
The Relationships between the Pillars of TPM and TQM and Manufacturing Performance Using Structural Equation Modeling


Abstract
:1. Introduction
2. Conceptual Framework
2.1. Pillars of TPM
2.2. Pillars of TQM
2.3. Pillars of Manufacturing Performance
2.4. Hypotheses Development
2.5. Survey Development and Analysis
- -
- The age of the majority of the responding firms (59%) is between 11 to 20 years.
- -
- The number of employees of the majority (=31%) of responding firms corresponds to those that exceed 200 employees and have between 10 to 50 employees.
- -
- The majority (=53%) of responding firms have implemented TPM practices, whereas 2% of the firms have relied on corrective maintenance.
- -
- The maintenance team of the majority of firms (=38%) is composed of one to five technicians.
- -
- About 61 % of the responding firms received ISO 9001 registration.
2.6. Models’ Content Validity
3. Results and Discussion
- -
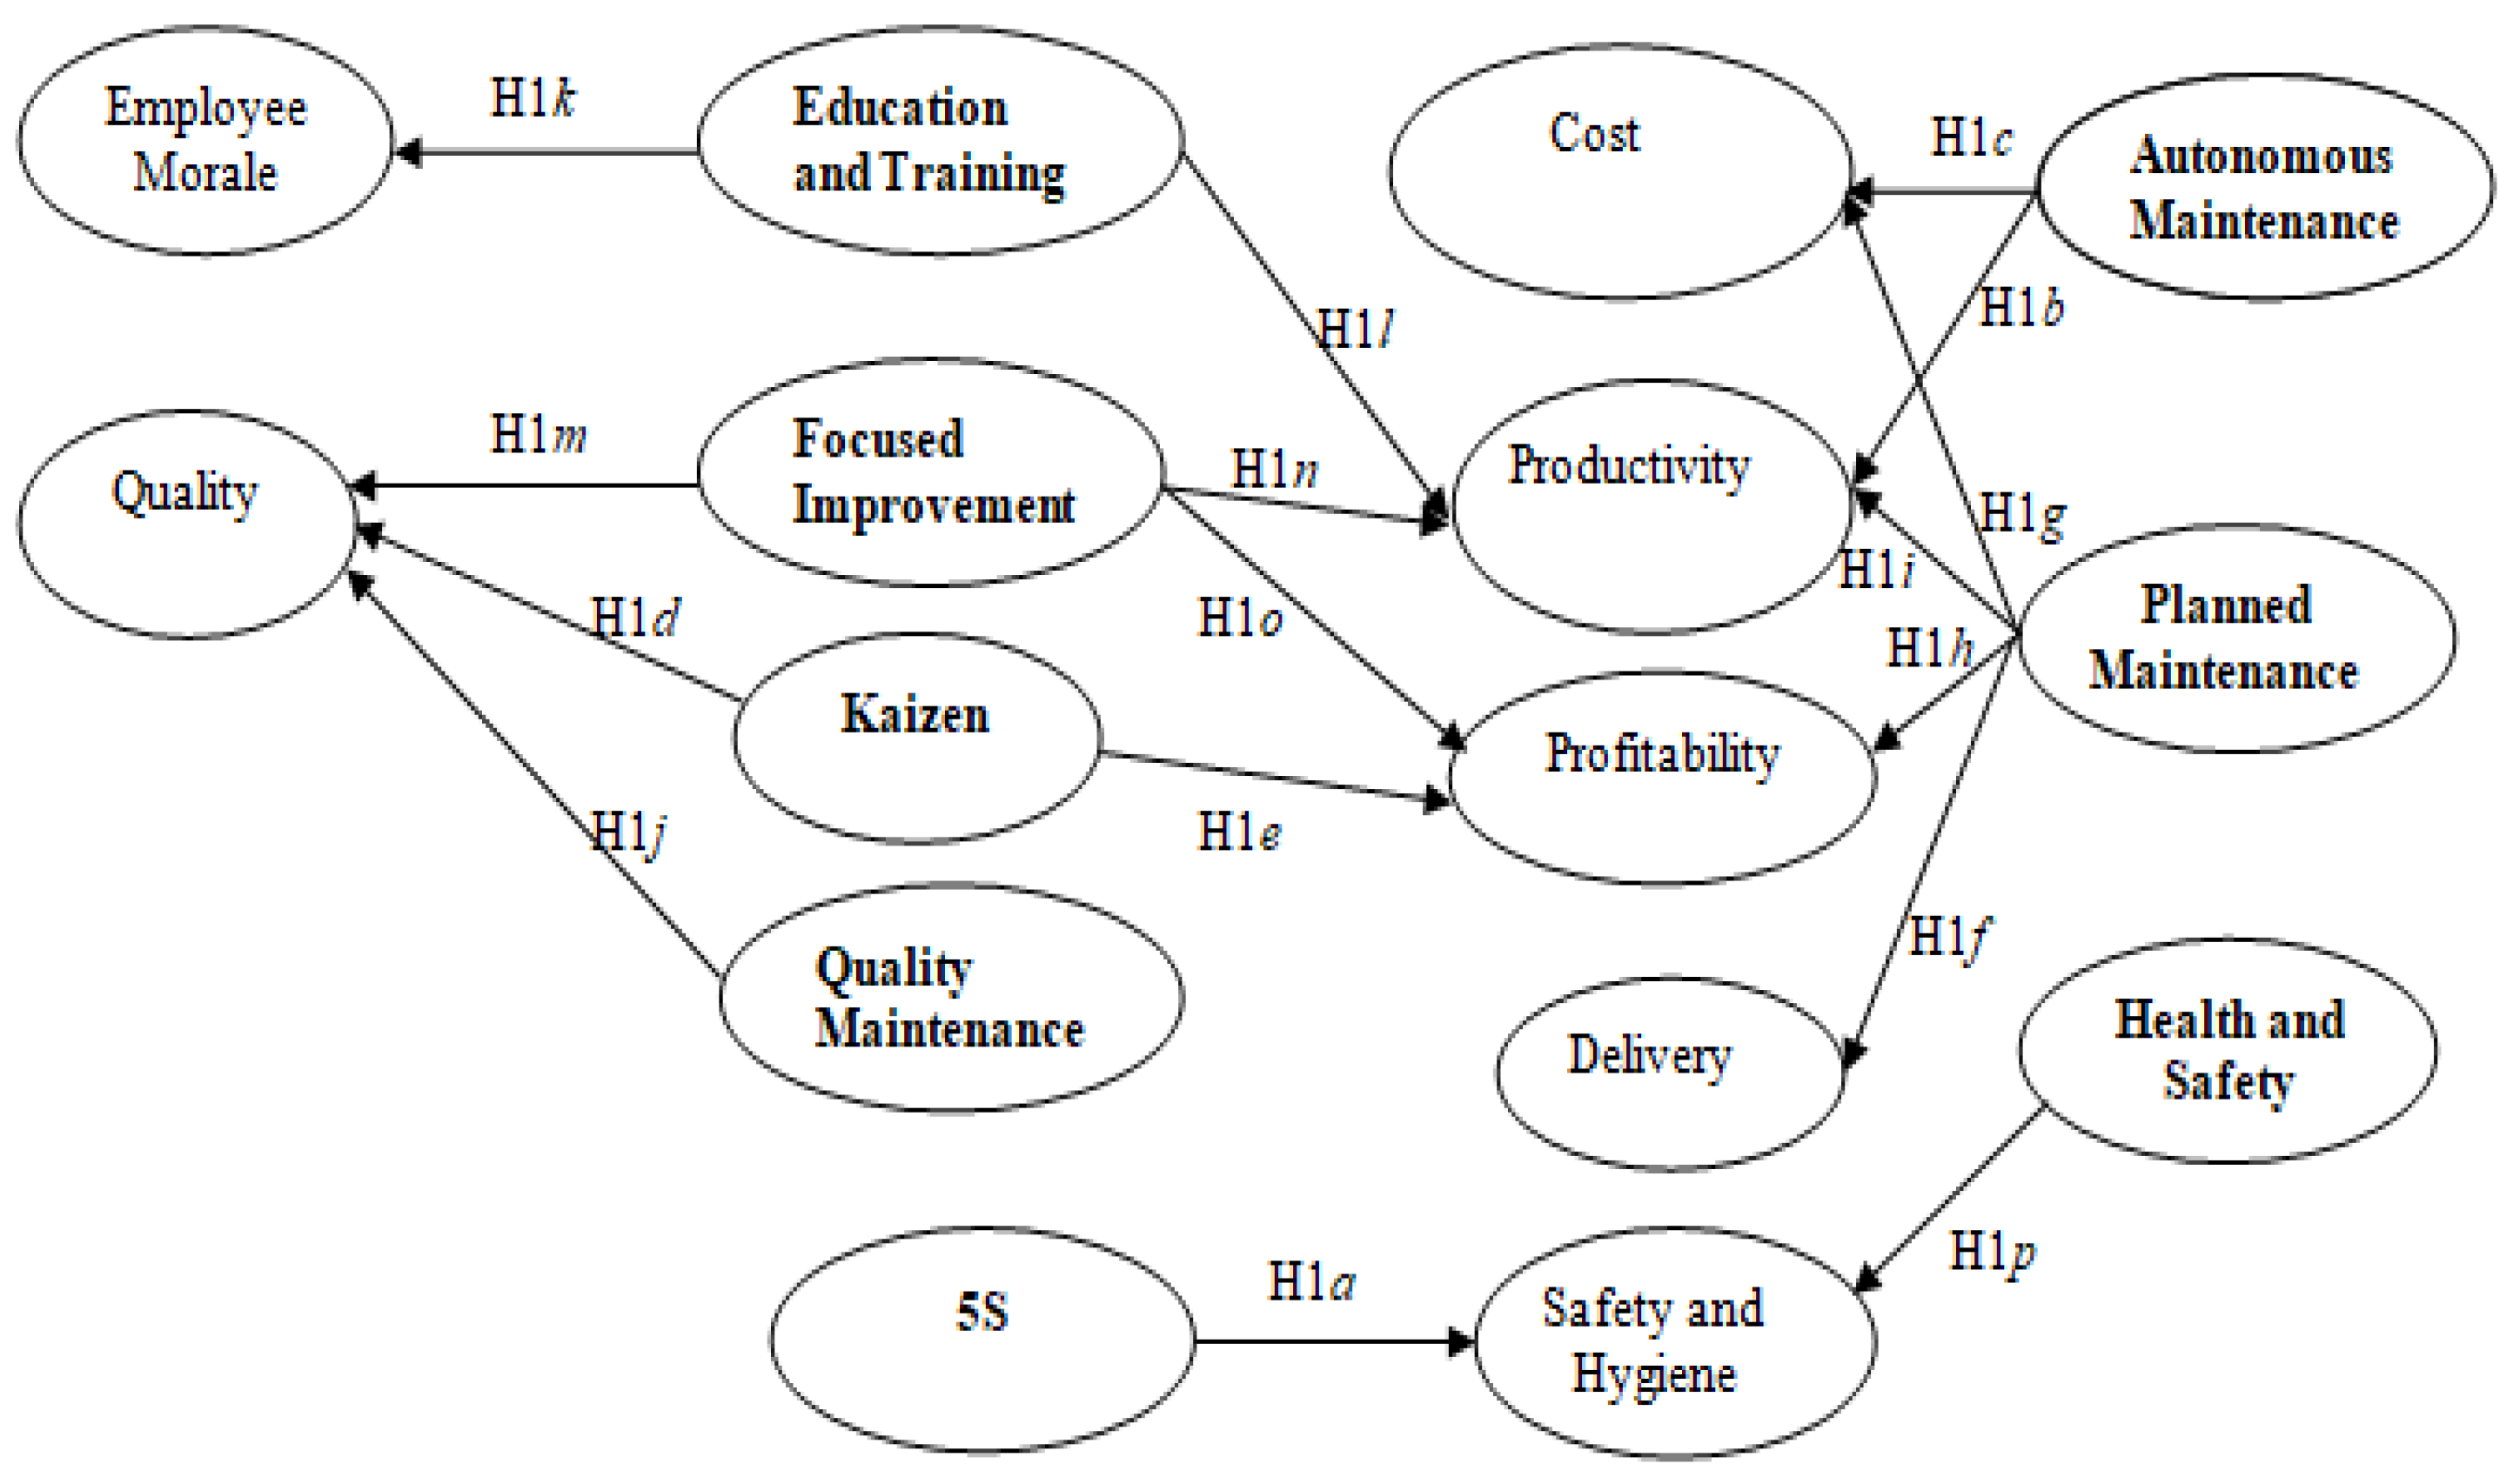
- In Table 11 for the relationships between the pillars of TPM and MPR (Model I), it is noticed that the largest weight (=3.2430) corresponds to the impact of planned maintenance (PM) on profitability (PF), whereas the smallest weight (=0.0664) corresponds to the impact of focused improvement (FI) on quality (QY). The largest weights of AM, KA, PM, ET, and FI correspond to CT (=0.2100), QY (=1.3080), PF (=3.2430), PD (=0.3570), and PD (=1.1020), respectively. Moreover, all the relationships are supported (p value less than 0.05), except for the hypothesized relationships H1c: AM→CT and H2k: ET→EM. In other words, autonomous maintenance (AM) and employee training (ET) do not have significant positive effects on cost (CT) and employee morale (EM), respectively. This indicates that machine operators lack the necessary training and skills on how to maintain machines, and thereby no significant cost reduction is achieved. Another point to highlight, based on responding firms’ responses, is that management only focuses on the reduction in production costs and does not encourage operators (employee) training on performing maintenance tasks, which results in a low overall employee satisfaction and team spirit.
- -
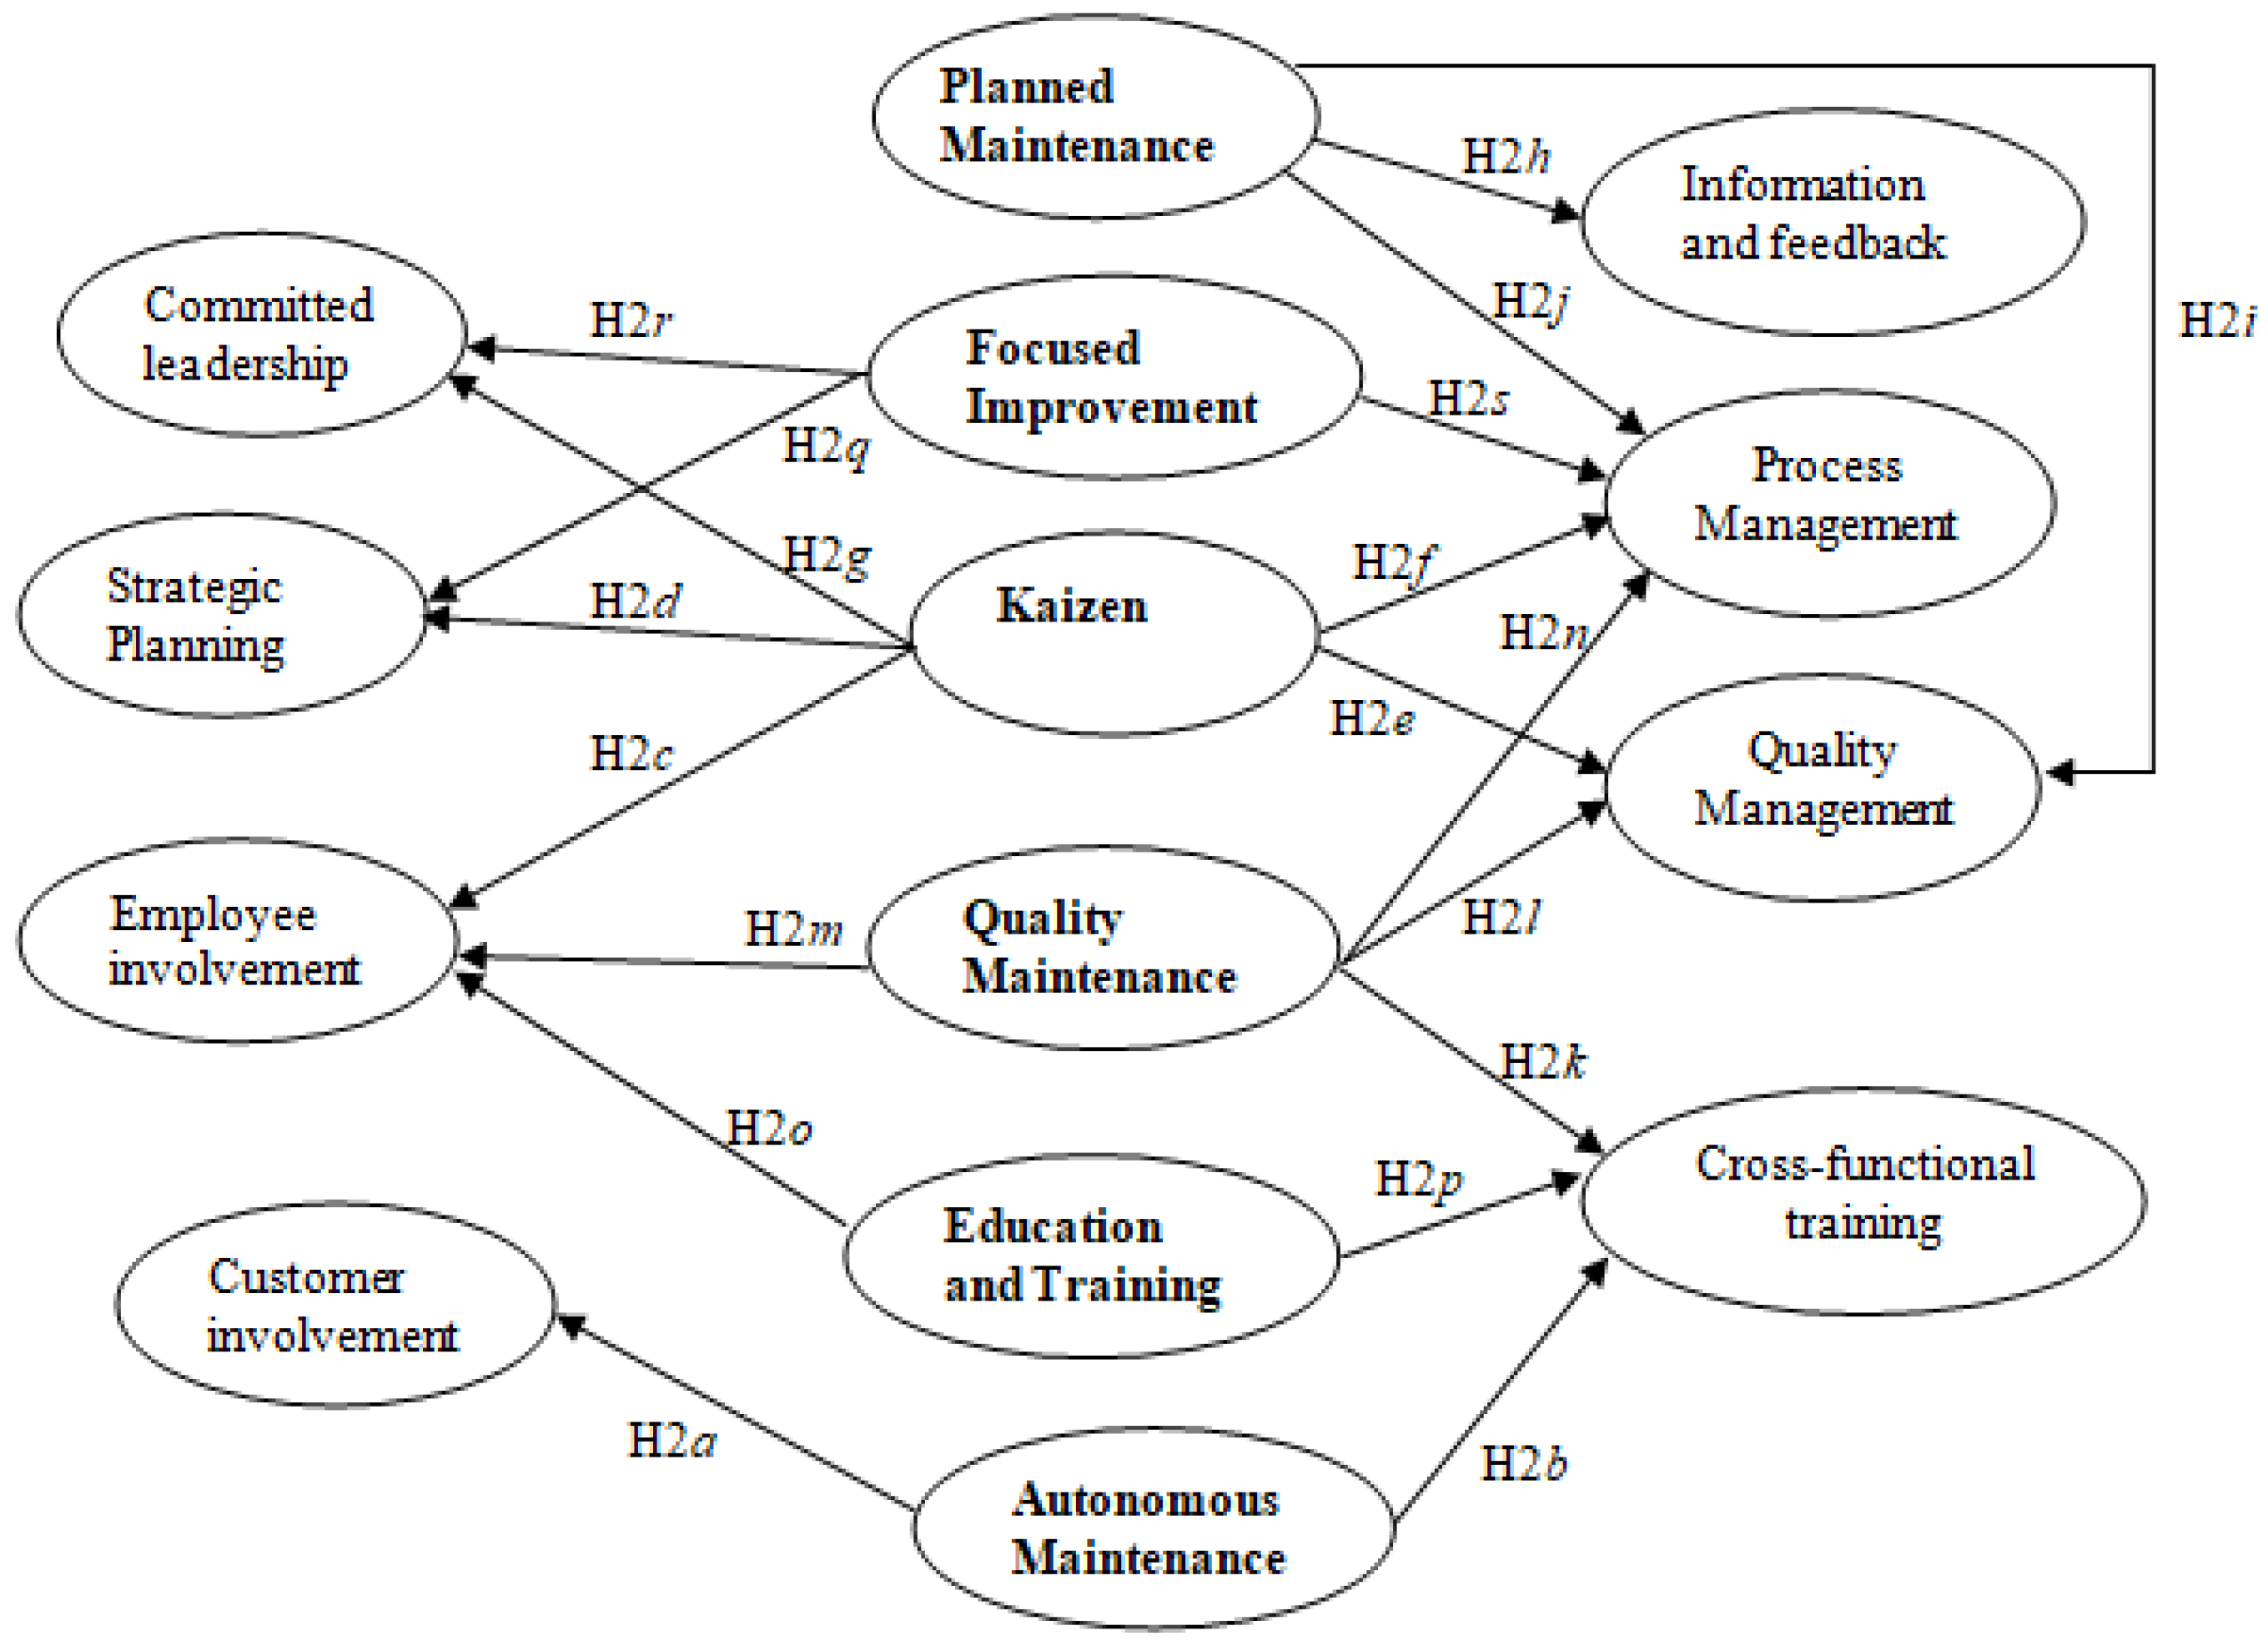
- In Table 12, for the relationships between the pillars of TPM and TQM (Model II), it is shown that the largest weight (=2.5000) corresponds to the impact of Kaizen (KA) on committed leadership (CL), whereas the smallest weight (=0.3155) corresponds to the influence of employee training (ET) on cross-functional training (CF). The largest weights of AM, KA, PM, QM, ET, and FI correspond to EI (=0.4770), CL (=2.5000), QG (=1.8190), CF (=1.2350), EI (=1.2920), and CL (=2.2100), respectively. In addition, all the hypothesized positive relationships are significant except for the relationships H2e: KA→QG, H2g: KA→CL, and H2r: FI→CL. In other words, Kaizen (KA) has no significant direct and positive relationships with quality management (QG) and committed leadership (CL), while focused improvement (FI) does not significantly impact CL. These results imply that firms do not regularly evaluate and implement employees’ suggestions and encourage all employees to participate in continual improvements. It is found that top management is only committed to improving quality and provides employees with the necessary leadership to produce quality products and achieve quality improvements. This means that KA has no significant direct and positive relationship with QG. On the other hand, the results showed that management is not fully committed to maintenance improvement, pays less attention to the reduction of maintenance costs and equipment losses, and seldom benchmarks maintenance performance. Due to these reasons, the influences of KA and FI on CL are shown to be insignificant.
- -
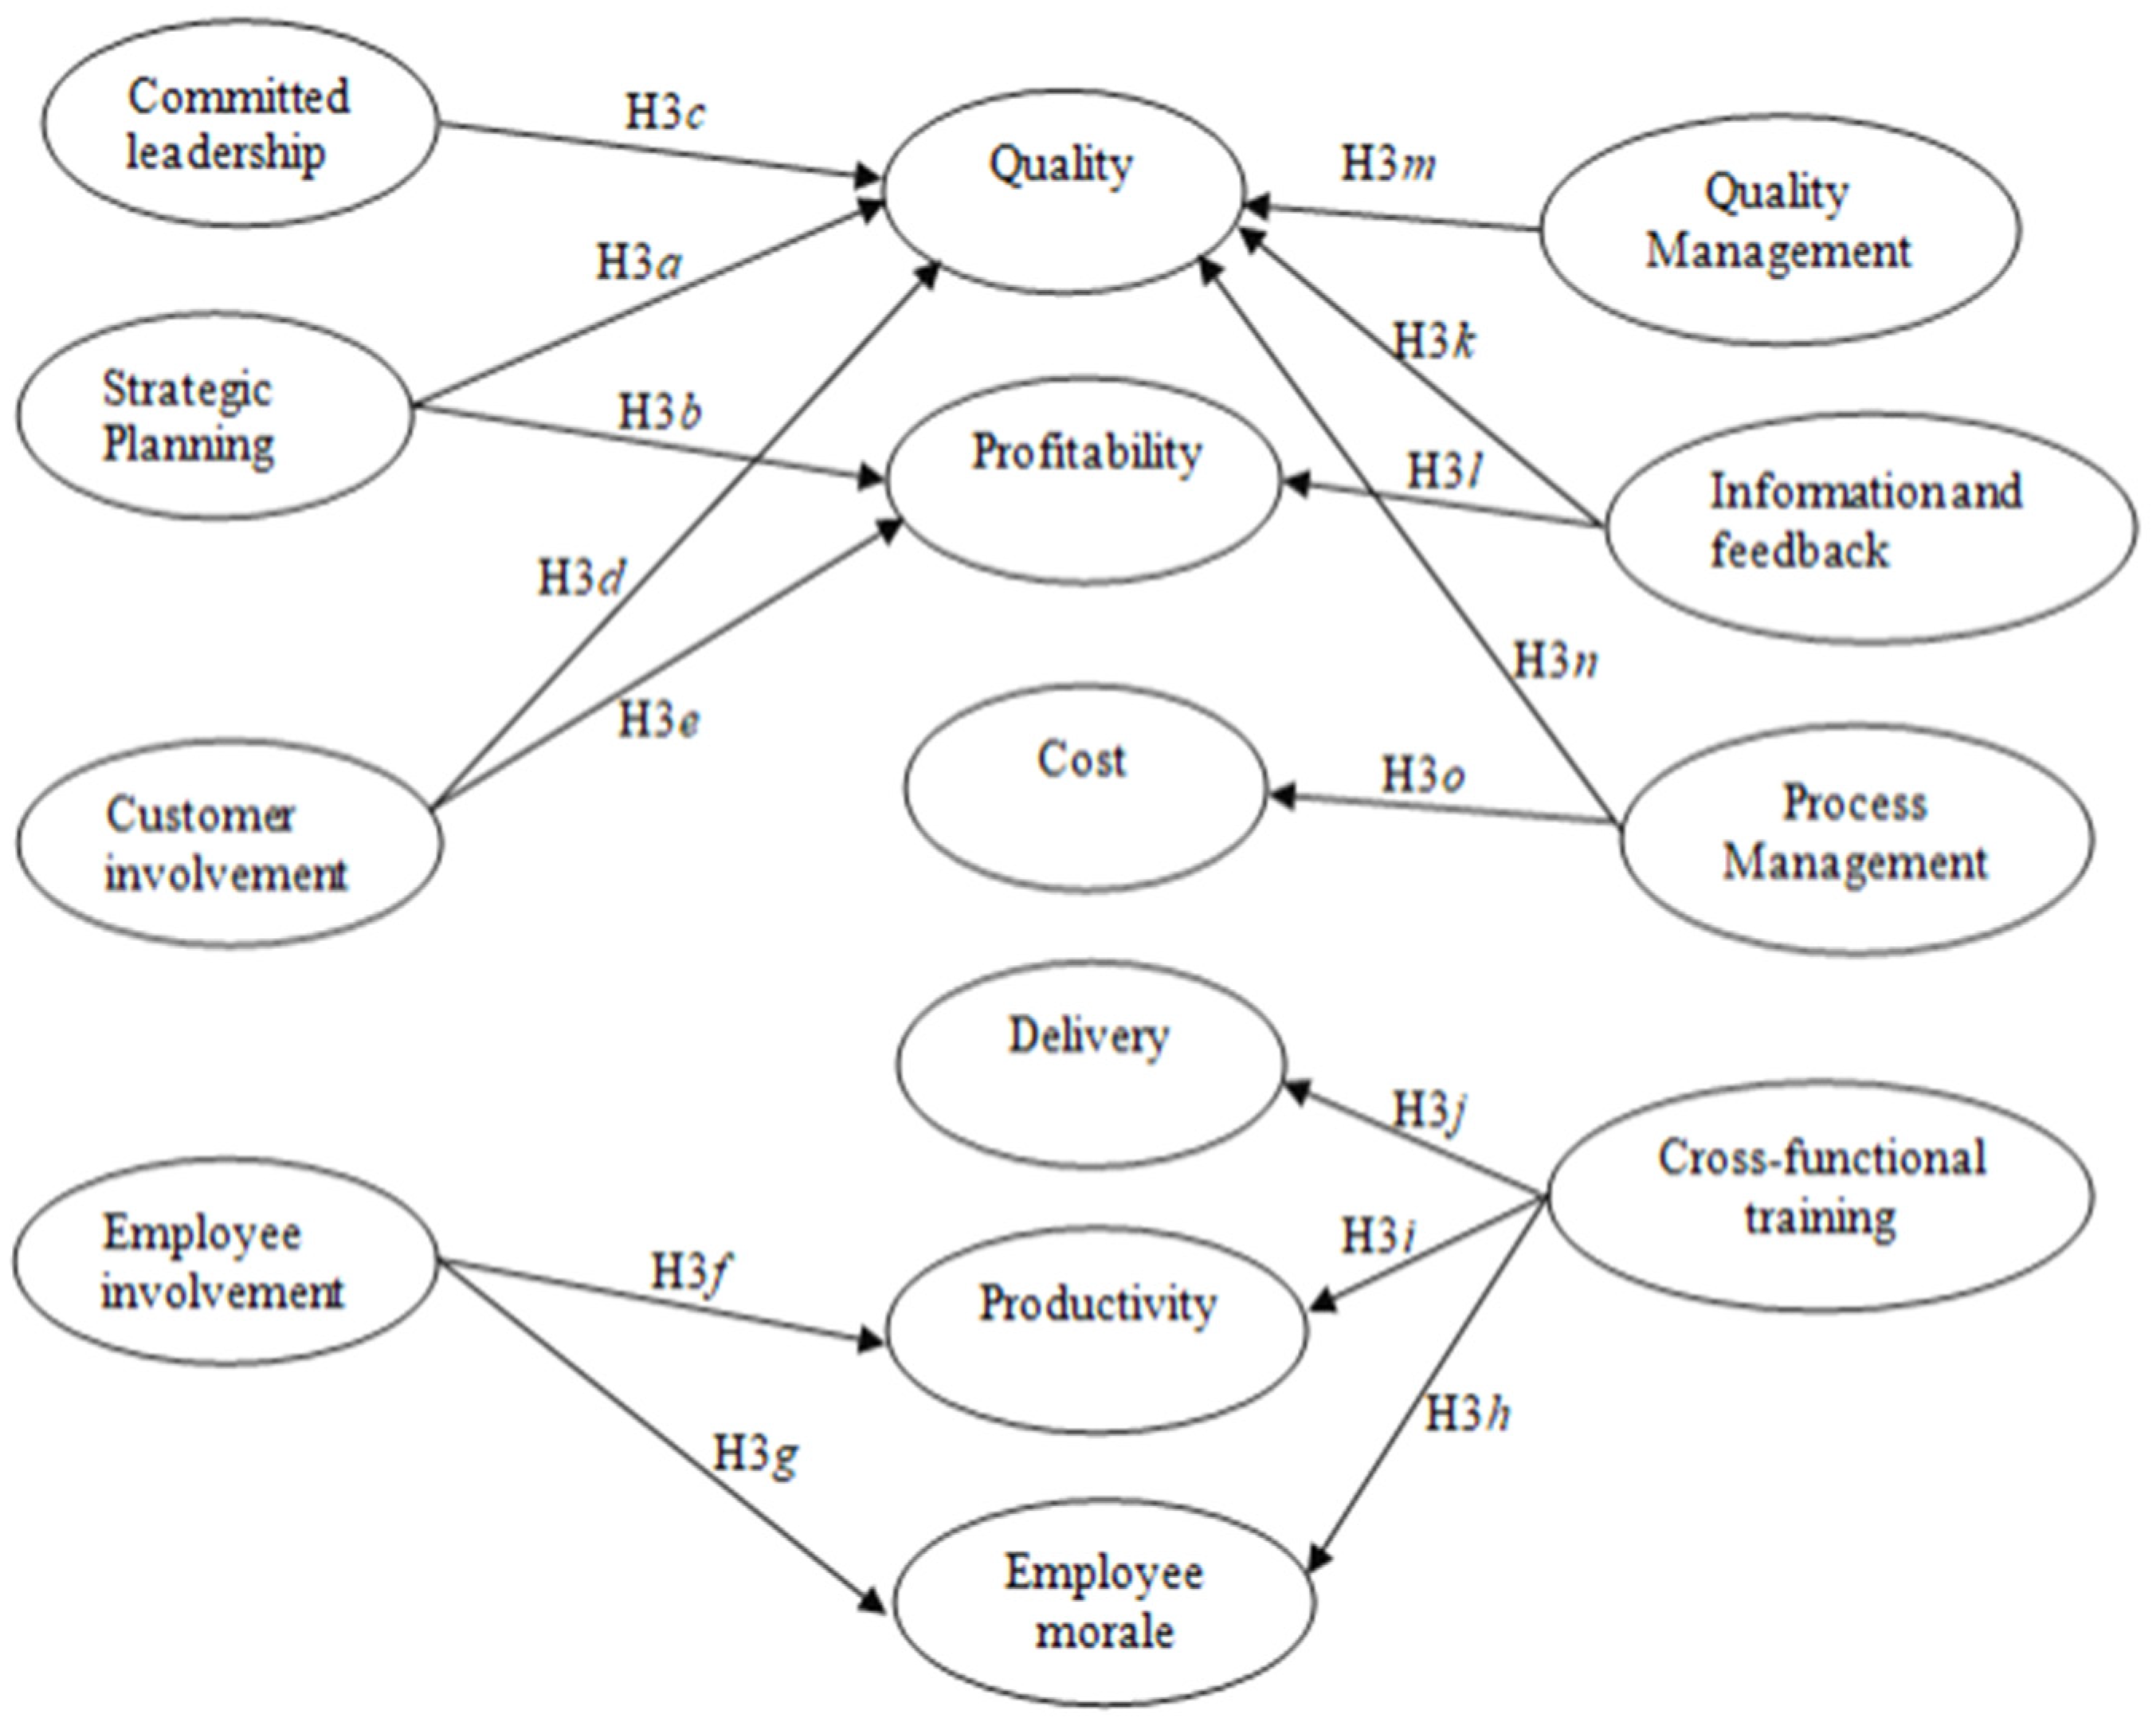
- In Table 13, for the relationships between the pillars of TQM and MPR (Model III), it is seen that the largest weight (=0.8317) corresponds to the impact of quality management (QG) on quality (QY), whereas the smallest weight (=0.1130) corresponds to the influence of employee involvement (EI) on productivity (DY). The largest weights of SP, CI, EI, CF, IF, and PS correspond to PF (=0.7860), PF (=0.5850), EM (=0.1500), EM (=0.5580), QY (=0.5580), and CT (=0.4050), respectively. Further, all the relationships are significant except for the relationships H3b: SP→PF, H3e: CI→PF, H3i: CF→PD, and H3j: CF→DY. That is, there is no significant direct and positive effect of strategic planning (SP) and customer involvement (CI) on profitability (PF). Besides, the effects of cross-functional training (CF) on productivity (PD) and delivery (DY) are insignificant. These findings imply that although a firm develops a formal strategic planning process and makes its vision on quality improvements, top management neither routinely review and update a long-range strategic plan nor effectively communicate the corresponding mission statement throughout the firm. In addition, according to the respondents’ responses, less attention is paid to enhancing the responsiveness to the customers’ needs, assessing feedback quality and delivery performance, and forming teams to solve quality problems. In practice, ineffective SP, CI, and MPR assessment hinder the use of the latest technology and focus on profitable products that increase the market share. Moreover, cross-functional training (CF) and on-job learning do not lead to a significant reduction in the average lead-time or an increase in the percentage of the on-time deliveries of the right items and the right quantities.
- -
- TPM pillars result in a larger increase in all MPR pillars than TQM, except for employee morale (EM). Further, the largest impact (=2.5051) of the TQM pillars corresponds to quality (QY). However, the smallest impact (=0.2590) corresponds to delivery (DY). Furthermore, the largest and smallest impacts of TPM correspond to a profitability (PF) and delivery of 5.0730 and 0.3130, respectively. Finally, the largest and smallest indirect impacts of TPM through TQM correspond to a quality (QY) and delivery of 8.855173 and 0.081715, respectively.
- -
- For the quality (QY) pillar, the total of TPM→QY, TQM→QY, and TPM→TQM→QY impacts are calculated and found to be 2.5051, 2.6094, and 8.855173, respectively. It is noticed that both TPM and TQM have almost the same direct impact on QY. Nevertheless, the largest impact (=8.855173) on QY is through TQM. The total direct and indirect impact of the TPM pillars on QY is 11.46457, which is almost equal to the total impact (=11.36027) of the TQM pillars plus the impacts of TPM on QY through TQM. Finally, the overall impact of the TPM and TQM pillars is 13.96967. This result implies that implementing both TQM and TPM results in a larger improvement in quality than implementing TQM or TPM separately, while TPM better supports quality through TQM.
- -
- For the profitability (PF) pillar, the direct impact (=5.0730) of TPM→PF is larger than that gained by TQM→PF (=1.7360) and TPM→TQM→PF (=2.530912).
- -
- For the productivity (PD) pillar, the largest impact (=1.359702) corresponds to TPM→PF, whereas the smallest impact (=0.423) corresponds to TQM→PF.
- -
- For the employee morale (EM) pillar, the largest impact (=3.5190) corresponds to TPM→TQM→EM, but the smallest impact (=0.708) corresponds to TQM→EM.
- -
- For the delivery (DY) pillar, the largest impact (=1.4160) corresponds to TPM→DY, whereas the smallest impact (=0.081715) corresponds to ET→CF→DY.
- -
- For the cost (CT) pillar, the largest impact (=2.0290) corresponds to TPM→CT, whereas the smallest impact (=0.4050) corresponds to PS→CT.
- -
- For the safety and hygiene (SH) pillar, only the TPM→MPR relationship contributes to improving SH by 2.6130.
4. Conclusions and Future Research
Author Contributions
Funding
Institutional Review Board Statement
Informed Consent Statement
Data Availability Statement
Conflicts of Interest
Nomenclature
| Abbreviation | Detail |
| AGFI | Adjusted goodness of fit index |
| ANOVA | Analysis of variance |
| AM | Autonomous maintenance |
| CI | Customer involvement |
| CF | Cross-functional training |
| CL | Committed leadership |
| COV | Coefficient of variation |
| CT | Cost |
| DY | Delivery |
| EI | Employee involvement |
| EM | Employee morale |
| ET | Education and training |
| FI | Focused improvement |
| GFI | Goodness of Fit |
| GFI | Goodness of fit index |
| HS | Health and safety |
| KA | Kaizen |
| MPR | Manufacturing performance |
| PD | Productivity |
| PF | Profitability |
| PM | Planned maintenance |
| PS | Process management |
| QG | Quality management |
| QM | quality maintenance |
| QY | Quality |
| RMR | Root Mean square for Residuals |
| Std. dev | Standard deviations |
| SH | Safety and hygiene |
| SP | Strategic planning |
| TPM | Total productive maintenance |
| TQM | Total quality management |
References
- Sun, H. Total quality management, ISO 9000 certification and performance improvement. Int. J. Qual. Reliab. Manag. 2000, 17, 168–179. [Google Scholar] [CrossRef]
- Sila, I.; Ebrahimpour, M. An investigation of the total quality management survey based research published between 1989 and 2000: A literature review. Int. J. Qual. Reliab. Manag. 2002, 19, 902–970. [Google Scholar] [CrossRef]
- Alsyouf, I. The role of maintenance in improving companies’ productivity and profitability. Int. J. Prod. Econ. 2007, 105, 70–78. [Google Scholar] [CrossRef]
- van der Meulen, P.; Petraitis, M.; Pannese, P. Design for Maintenance. In Proceedings of the IEEE/SEMI Advanced Semiconductor Manufacturing Conference, Cambridge, MA, USA, 5–7 May 2008; pp. 278–281. [Google Scholar] [CrossRef]
- Iqbal, T.; Huq, F.; Bhutta, M.K.S. Agile manufacturing relationship building with TQM, JIT, and firm performance: An exploratory study in apparel export industry of Pakistan. Int. J. Prod. Econ. 2018, 203, 24–37. [Google Scholar] [CrossRef]
- Singh, V.; Kumar, A.; Singh, T. Impact of TQM on organisational performance: The case of Indian manufacturing and service industry. Oper. Res. Perspect. 2018, 5, 199–217. [Google Scholar] [CrossRef]
- Abbas, J. Impact of total quality management on corporate sustainability through the mediating effect of knowledge management. J. Clean. Prod. 2019, 244, 118806. [Google Scholar] [CrossRef]
- Pascal, V.; Toufik, A.; Manuel, A.; Florent, D.; Frédéric, K. Improvement indicators for Total Productive Maintenance policy. Control Eng. Pract. 2018, 82, 86–96. [Google Scholar] [CrossRef]
- Hassan, A.S.; Jaaron, A.A. Total quality management for enhancing organizational performance: The mediating role of green manufacturing practices. J. Clean. Prod. 2021, 308, 127366. [Google Scholar] [CrossRef]
- Soltanmohammadi, A.; Ardakani, D.A.; Dion, P.A.; Hettiarachchi, B.D. Employing total quality practices in sustainable supply chain management. Sustain. Prod. Consum. 2021, 28, 953–968. [Google Scholar] [CrossRef]
- Tortorella, G.L.; Fogliatto, F.S.; Cauchick-Miguel, P.A.; Kurnia, S.; Jurburg, D. Integration of Industry 4.0 technologies into Total Productive Maintenance practices. Int. J. Prod. Econ. 2021, 240, 108224. [Google Scholar] [CrossRef]
- Mishra, R.P.; Gupta, G.; Sharma, A. Development of a Model for Total Productive Maintenance Barriers to Enhance the Life Cycle of Productive Equipment. Procedia CIRP 2021, 98, 241–246. [Google Scholar] [CrossRef]
- Pandey, D.S.; Raut, N. Implementing TPM by doing Root Cause Analysis of the Downtime losses. Int. J. Adv. Res. Sci. Eng. Technol. 2016, 3, 1399–1405. [Google Scholar]
- Singh, R.K.; Gurtu, A. Prioritizing success factors for implementing total productive maintenance (TPM). J. Qual. Maint. Eng. 2021. [Google Scholar] [CrossRef]
- Swanson, L. Linking maintenance strategies to performance. Int. J. Prod. Econ. 2001, 70, 237–244. [Google Scholar] [CrossRef]
- Kamoun, F. Toward best maintenance practices in communications network management. Int. J. Netw. Manag. 2005, 15, 321–334. [Google Scholar] [CrossRef]
- Bamber, C.; Sharp, J.; Hides, M. Factors affecting successful implementation of total productive maintenance: A UK manufacturing case study perspective. J. Qual. Maint. Eng. 1999, 5, 162–181. [Google Scholar] [CrossRef]
- Mckone, K.E.; Schroeder, R.G.; Cua, K.O. The impact of total productive maintenance practices on manufacturing performance. J. Oper. Manag. 2000, 19, 39–58. [Google Scholar] [CrossRef]
- Singh, R.; Gohil, A.M.; Shah, D.; Desai, S. Total Productive Maintenance (TPM) Implementation in a Machine Shop: A Case Study. Procedia Eng. 2013, 51, 592–599. [Google Scholar] [CrossRef] [Green Version]
- Eti, M.; Ogaji, S.; Probert, S. Implementing total productive maintenance in Nigerian manufacturing industries. Appl. Energy 2004, 79, 385–401. [Google Scholar] [CrossRef] [Green Version]
- Brah, S.A.; Chong, W.-K. Relationship between total productive maintenance and performance. Int. J. Prod. Res. 2004, 42, 2383–2401. [Google Scholar] [CrossRef]
- Thun, J.-H. Maintaining Preventive Maintenance and Maintenance Prevention: Analysing the Dynamic Implications of Total Productive Maintenance. Syst. Dyn. Rev. 2006, 22, 163–179. [Google Scholar] [CrossRef]
- Wang, F.-K. Evaluating the efficiency of implementing total productive maintenance. Total Qual. Manag. Bus. Excel. 2006, 17, 655–667. [Google Scholar] [CrossRef]
- Lazim, H.M.; Ramayah, T.; Ahmad, N. Total productive maintenance and performance: A Malaysian SME experience. Int. Rev. Bus. Res. Pap. 2008, 4, 237–250. [Google Scholar]
- Ahuja, I.S.; Khamba, J. Total productive maintenance: Literature review and directions. Int. J. Qual. Reliab. Manag. 2008, 25, 709–756. [Google Scholar] [CrossRef] [Green Version]
- Kocher, G.; Kumar, R.; Singh, A.; Dhillon, S.S. An approach for total productive maintenance and factors affecting its implementation in a manufacturing environment. Int. J. Emerg. Technol. 2012, 3, 41–47. [Google Scholar]
- Wickramasinghe, G.; Perera, A. Effect of total productive maintenance practices on manufacturing performance: Investigation of textile and apparel. J. Manuf. Technol. Manag. 2016, 27, 713–729. [Google Scholar] [CrossRef]
- Rathi, R.; Singh, M.; Sabique, M.; Al Amin, M.; Saha, S.; Krishnaa, M.H. Identification of total productive maintenance barriers in Indian manufacturing industries. Mater. Today Proc. 2021. [Google Scholar] [CrossRef]
- Pandi, A.P.; Rao, U.S.; Jeyathilagar, D. A study of integrated total quality management practices in technical institutions: Students’ perspectives. Int. J. Educ. Adm. 2009, 1, 17–30. [Google Scholar]
- Boulter, L.; Bendell, T.; Dahlgaard, J.J. Total quality beyond North America: A comparative analysis of the performance of European excellence award winners. Int. J. Oper. Prod. Manag. 2013, 33, 197–215. [Google Scholar] [CrossRef]
- Mosadeghrad, A.M. Essentials of total quality management: A meta-analysis. Int. J. Health Care Qual. Assur. 2014, 27, 544–558. [Google Scholar] [CrossRef]
- Douglas, T.J.; Judge, W.Q. Total Quality Management Implementation and Competitive Advantage: The Role of Structural Control and Exploration. Acad. Manag. J. 2001, 44, 158–169. [Google Scholar] [CrossRef]
- Joiner, T.A. Total quality management and performance: The role of organization support and co-worker support. Int. J. Qual. Reliab. Manag. 2007, 24, 617–627. [Google Scholar] [CrossRef]
- Zhang, Z.; Waszink, A.; Wijngaard, J. An instrument for measuring TQM implementation for Chinese manufacturing companies. Int. J. Qual. Reliab. Manag. 2000, 17, 730–755. [Google Scholar] [CrossRef]
- Brah, S.A.; Wong, J.L.; Rao, B.M. TQM and business performance in the service sector: A Singapore study. Int. J. Oper. Prod. Manag. 2000, 20, 1293–1312. [Google Scholar] [CrossRef]
- Brah, S.A.; Tee, S.S.; Rao, B.M. Relationship between TQM and performance of Singapore companies. Int. J. Qual. Reliab. Manag. 2002, 19, 356–379. [Google Scholar] [CrossRef]
- Kaynak, H. The relationship between total quality management practices and their effects on firm performance. J. Oper. Manag. 2003, 21, 405–435. [Google Scholar] [CrossRef]
- Feng, J.; Prajogo, D.; Tan, K.C.; Sohal, A.S. The impact of TQM practices on performance: A comparative study between Australian and Singaporean organizations. Eur. J. Innov. Manag. 2006, 9, 269–278. [Google Scholar] [CrossRef]
- Demirbag, M.; Tatoglu, E.; Tekinkus, M.; Zaim, S. An analysis of the relationship between TQM implementation and organizational performance: Evidence from Turkish SMEs. J. Manuf. Technol. Manag. 2006, 17, 829–847. [Google Scholar] [CrossRef]
- Salaheldin, S.I. Critical success factors for TQM implementation and their impact on performance of SMEs. Int. J. Prod. Perform. Manag. 2009, 58, 215–237. [Google Scholar] [CrossRef]
- Miyagawa, M.; Yoshida, K. TQM practices of Japanese-owned manufacturers in the USA and China. Int. J. Qual. Reliab. Manag. 2010, 27, 736–755. [Google Scholar] [CrossRef]
- Phan, C.A.; Abdallah, A.; Matsui, Y. Quality management practices and competitive performance: Empirical evidence from Japanese manufacturing companies. Int. J. Prod. Econ. 2011, 133, 518–529. [Google Scholar] [CrossRef]
- Awino, A.B.; Muchara, M.; Ogutu, M.; Oeba, L.K. Total quality and competitive advantage of firms in the horticultural industry in Kenya. Prime J. Bus. Adm. Manag. 2012, 2, 521–532. [Google Scholar]
- Bajaria, H.J. Effective TQM implementation: Critical issues. In Total Quality Management; Kanji, G.S., Ed.; Springer: Dordrecht, The Netherlands, 1995; pp. 128–136. [Google Scholar] [CrossRef]
- Islam, A.; Haque, A.F.M. Pillars of TQM implementation in manufacturing organization—An empirical study. J. Res. Int. Bus. Manag. 2012, 2, 128–141. [Google Scholar]
- Nawelwa, J.; Sichinsambwe, C.; Mwanza, B.G.M. An analysis of total quality management (TQM) practices in Zambian secondary schools. TQM J. 2015, 27, 716–731. [Google Scholar] [CrossRef]
- Niu, R.H.; Fan, Y. An in-depth investigation on quality management practices in China. Int. J. Qual. Reliab. Manag. 2015, 32, 736–753. [Google Scholar] [CrossRef]
- Cua, K.O.; McKone, K.E.; Schroeder, R.G. Relationships between implementation of TQM, JIT, and TPM and manufacturing performance. J. Oper. Manag. 2001, 19, 675–694. [Google Scholar] [CrossRef]
- Seth, D.; Tripathi, D. Relationship between TQM and TPM implementation factors and business performance of manufacturing industry in Indian context. Int. J. Qual. Reliab. Manag. 2005, 22, 256–277. [Google Scholar] [CrossRef]
- Seth, D.; Tripathi, D. A critical study of TQM and TPM approaches on business performance of Indian manufacturing industry. Total Qual. Manag. Bus. Excel. 2006, 17, 811–824. [Google Scholar] [CrossRef]
- Teeravaraprug, J.; Kitiwanwong, K.; Saetong, N. Relationship model and supporting activities of JIT, TQM and TPM. Songklanakarin J. Sci. Technol. 2011, 33, 101–106. [Google Scholar]
- Konecny, P.A.; Thun, J.-H. Do it separately or simultaneously—An empirical analysis of a conjoint implementation of TQM and TPM on plant performance. Int. J. Prod. Econ. 2011, 133, 496–507. [Google Scholar] [CrossRef]
- Al-Refaie, A.; Hanayneh, B. Influences of TPM, TQM, Six Sigma practices on firms performance in Jordan. Int. J. Prod. Qual. Manag. 2014, 13, 219. [Google Scholar] [CrossRef]
- Al-Refaie, A. A Structural Model to Investigate Factors Affect Patient Satisfaction and Revisit Intention in Jordanian Hospitals. Int. J. Artif. Life Res. 2011, 2, 43–56. [Google Scholar] [CrossRef]
- Al-Refaie, A.; Ghnaimat, O.; Ko, J.H. The effects of quality management practices on customer satisfaction and innovation: A perspective from Jordan. Int. J. Prod. Qual. Manag. 2011, 8, 398. [Google Scholar] [CrossRef]

| Practice | Item Measure |
|---|---|
| 5S |
|
| AM |
|
| KA |
|
| PM |
|
| QM |
|
| ET |
|
| HS |
|
| FI |
|
| Pillar | Item Measure |
|---|---|
| SP |
|
| CL |
|
| CI |
|
| EI |
|
| CF |
|
| IF |
|
| QG |
|
| PS |
|
| Pillar | Item Measure |
|---|---|
| CT |
|
| QY |
|
| |
| |
| |
| |
| DY |
|
| |
| |
| PF |
|
| PD |
|
| SH |
|
| EM |
|
| Model I: TPM and MPR | Model II: TPM and TQM | ||
|---|---|---|---|
| H1a | 5S is positively and directly related to SH. | ||
| H1b | AM is positively and directly related to PD. | H2a | AM is positively and directly related to EI. |
| H1c | AM is positively and directly related to CT | H2b | AM is positively and directly related to SF. |
| H1d H1e | KA is positively and directly related to QY. Kaizen is positively and directly related to PF. | H2c | KA is positively and directly related to EI. |
| H2d | KA is positively and directly related to SP. | ||
| H2e | KA is positively and directly related to QG. | ||
| H2f | KA is positively and directly related to PS. | ||
| H2g | KA is positively and directly related to CL. | ||
| H1f | PM is positively and directly related to DY. | H2h H2i H2j | PM is positively and directly related to IF. PM is positively and directly related to QG. PM is positively and directly related to PS. |
| H1g | PM is positively and directly related to CT. | ||
| H1h | PM is positively and directly related to PF. | ||
| H1i | PM is positively and directly related to PD. | ||
| H1j | QM is positively and directly related to QY. | H2k | QM is positively and directly related to CF. |
| H2l | QM is positively and directly related to QG. | ||
| H2m | QM is positively and directly related to EI. | ||
| H2n | QM is positively and directly related to PS. | ||
| H1k | ET is positively and directly related to EM. | H2o | ET is positively and directly related to EI. |
| H1l | ET is positively and directly related to PD. | H2p | ET is positively and directly related to CF. |
| H1m | FI is positively and directly related to QY. | H2q | FI is positively and directly related to SP. |
| H1n | FI is positively and directly related to PD. | H2r | FI is positively and directly related to CL. |
| H1o | FI is positively and directly related to PF. | H2s | FI is positively and directly related to PS. |
| H1p | HS is positively and directly related to SH. | ||
| Pillar | Hypothesis | |
|---|---|---|
| SP | H3a H3b | SP is positively and directly related to QY. SP is positively and directly related to PF. |
| CL | H3c | CL is positively and directly related to QY. |
| CI | H3d H3e | CI is positively and directly related to QY. CI is positively and directly related to PF. |
| EI | H3f H3g | EI is positively and directly related to PD. EI is positively and directly related to EM. |
| CF | H3h H3i H3j | CF is positively and directly related to EM. CF is positively and directly related to PD. CF is positively and directly related to DY. |
| IF | H3k H3l | IF is positively and directly related to QY. IF is positively and directly related to PF. |
| QG | H3m | QG is positively and directly related to QY. |
| PS | H3n H3o | PS is positively and directly related to QY. PS is positively and directly related to CT. |
| Latent | Pillar | N | Mean | Std. dev. | Coefficient of Variation | z-Value (z Cirital = 1.6) | Significance |
|---|---|---|---|---|---|---|---|
| TPM | 5S | 29 | 3.7655 | 0.4474 | 11.88% | 9.21 | Significant |
| AM | 29 | 3.5793 | 0.4254 | 11.89% | 7.33 | Significant | |
| KA | 29 | 3.3793 | 0.6024 | 17.83% | 3.39 | Significant | |
| PM | 29 | 3.3596 | 0.9263 | 27.57% | 2.09 | Significant | |
| QM | 29 | 2.3103 | 0.6839 | 29.60% | −5.43 | Insignificant | |
| ET | 29 | 3.5776 | 0.5432 | 15.18% | 5.73 | Significant | |
| HS | 29 | 3.3851 | 0.7016 | 20.73% | 2.96 | Significant | |
| FI | 29 | 3.0259 | 0.6792 | 22.45% | 0.21 | Insignificant | |
| TQM | SP | 29 | 3.6207 | 0.7489 | 20.68% | 4.46 | Significant |
| CL | 29 | 3.5747 | 0.6035 | 16.88% | 5.13 | Significant | |
| CI | 29 | 3.5862 | 0.7163 | 19.97% | 4.41 | Significant | |
| EI | 29 | 3.4345 | 0.6025 | 17.54% | 3.88 | Significant | |
| CF | 29 | 3.3621 | 0.4461 | 13.27% | 4.37 | Significant | |
| IF | 29 | 2.8897 | 0.7022 | 24.30% | −0.85 | Insignificant | |
| QG | 29 | 3.9138 | 0.4784 | 12.22% | 10.29 | Significant | |
| PS | 29 | 3.4897 | 0.7379 | 21.15% | 3.57 | Significant | |
| MPR | CT | 29 | 3.2759 | 0.6063 | 18.51% | 2.45 | Significant |
| QY | 29 | 3.8138 | 0.4033 | 10.57% | 10.87 | Significant | |
| DY | 29 | 3.8276 | 0.6148 | 16.06% | 7.25 | Significant | |
| PF | 29 | 3.5086 | 0.8464 | 24.12% | 3.24 | Significant | |
| PD | 29 | 3.4828 | 0.5605 | 16.09% | 4.64 | Significant | |
| SH | 29 | 3.6897 | 0.8064 | 21.86% | 4.61 | Significant | |
| EM | 29 | 3.6552 | 0.7453 | 20.39% | 4.73 | Significant |
| Latent | Source | Degrees of Freedom | Sum of Squares | Mean Sum of Squares | p-Value |
|---|---|---|---|---|---|
| TPM | Pillars | 7 | 41.858 | 5.980 | <0.001 |
| Error | 224 | 92.920 | |||
| Total | 231 | 134.778 | |||
| TQM | Pillars | 7 | 17.188 | 2.455 | <0.001 |
| Error | 224 | 91.472 | 0.408 | ||
| Total | 231 | 108.659 | |||
| MPR | Pillars | 6 | 6.825 | 1.137 | 0.022 |
| Error | 196 | 88.046 | 0.449 | ||
| Total | 202 | 94.871 |
| CT-1 | CT-3 | QY-1 | QY-2 | QY-5 | DY-2 | PF-3 | PF-4 | PD-2 | PD-3 | |
| CT-1 | 1 | 0.429 | 0.232 | 0.289 | 0.324 | 0.463 | 0.082 | 0.231 | 0.030 | 0.221 |
| CT-3 | 0.143 | 1 | 0.287 | 0.376 | 0.129 | 0.039 | 0.224 | 0.312 | 0.331 | 0.460 |
| QY-1 | 0.266 | 0.003 | 1 | 0.288 | 0.265 | 0.322 | 0.293 | 0.056 | 0.034 | 0.050 |
| QY-2 | 0.531 | 0.229 | 0.053 | 1 | 0.344 | 0.336 | 0.467 | 0.408 | 0.097 | 0.260 |
| SP-2 | 0.243 | 0.331 | 0.397 | 0.222 | 0.256 | 0.033 | 0.057 | 0.052 | 0.209 | 0.442 |
| PS-4 | 0.233 | 0.412 | 0.260 | 0.444 | 0.448 | 0.094 | 0.265 | 0.032 | 0.214 | 0.312 |
| CL-3 | 0.322 | 0.239 | 0.150 | 0.409 | 0.052 | 0.200 | 0.448 | 0.353 | 0.253 | 0.036 |
| CI-4 | 0.475 | 0.327 | 0.288 | 0.244 | 0.223 | 0.032 | 0.224 | 0.243 | 0.434 | 0.308 |
| EI-2 | 0.264 | 0.196 | 0.465 | 0.052 | 0.210 | 0.448 | 0.239 | 0.196 | 0.429 | 0.052 |
| CF-3 | 0.361 | 0.229 | 0.032 | 0.224 | 0.312 | 0.336 | 0.327 | 0.229 | 0.022 | 0.424 |
| IF-5 | 0.229 | 0.032 | 0.232 | 0.312 | 0.336 | 0.467 | 0.229 | 0.032 | 0.264 | 0.312 |
| QG-2 | 0.355 | 0.143 | 0.244 | 0.056 | 0.033 | 0.057 | 0.331 | 0.353 | 0.293 | 0.056 |
| TPM | TQM | MPR | |||
|---|---|---|---|---|---|
| Pillar | α Value | Pillar | α VALUE | Pillar | α Value |
| 5S | 0.7340 | SP | 0.7257 | CT | 0.8990 |
| AM | 0.8532 | CL | 0.7640 | QY | 0.7494 |
| KA | 0.9330 | CI | 0.9303 | DY | 0.8454 |
| PM | 0.8718 | EI | 0.8770 | PD | 0.8805 |
| QM | 0.8920 | CF | 0.6020 | SH | 0.7350 |
| ET | 0.7809 | IF | 0.7270 | PF | 0.8200 |
| HS | 0.7200 | QG | 0.9570 | ||
| FI | 0.8820 | PS | 0.8333 | ||
| Models | Type | GFI | AGFI | RMR |
|---|---|---|---|---|
| Model I | Measurement | 0.937 | 0.924 | 0.037 |
| Structural | 0.894 | 0.887 | 0.043 | |
| Model II | Measurement | 0.922 | 0.910 | 0.051 |
| Structural | 0.917 | 0.902 | 0.029 | |
| Model III | Measurement | 0.941 | 0.924 | 0.012 |
| Structural | 0.933 | 0.908 | 0.048 |
| Pillar | H1 | Relationship | Weight | p-Value | Decision | ||
|---|---|---|---|---|---|---|---|
| 5S | H1a | 5S | → | SH | 1.2230 | <000.1 | Supported |
| AM | H1b | AM | → | PD | 0.1060 | <000.1 | Supported |
| H1c | AM | → | CT | 0.2100 | 0.400 | Not Supported | |
| KA | H1d | KA | → | QY | 1.3080 | <000.1 | Supported |
| H1e | KA | → | PF | 1.0450 | <000.1 | Supported | |
| PM | H1f | PM | → | DY | 1.4160 | <000.1 | Supported |
| H1g | PM | → | CT | 1.8190 | <000.1 | Supported | |
| H1h | PM | → | PF | 3.2430 | <000.1 | Supported | |
| H1i | PM | → | PD | 1.9540 | <000.1 | Supported | |
| QM | H1j | QM | → | QY | 1.2350 | <000.1 | Supported |
| ET | H1k | ET | → | EM | 0.3130 | 0.0570 | Not Supported |
| H1l | ET | → | PD | 0.3570 | 0.0380 | Supported | |
| FI | H1m | FI | → | QY | 0.0664 | <000.1 | Supported |
| H1n | FI | → | PD | 1.1020 | <000.1 | Supported | |
| H1o | FI | → | PF | 0.7850 | <000.1 | Supported | |
| HS | H1p | HS | → | SH | 1.3900 | <000.1 | Supported |
| Pillar | H2 | Relationship | Weight | p-Value | Decision | ||
|---|---|---|---|---|---|---|---|
| AM | H2a | AM | → | EI | 0.4770 | <0.001 | Supported |
| H2b | AM | → | CF | 0.1090 | <0.001 | Supported | |
| KA | H2c | KA | → | EI | 1.7650 | <0.001 | Supported |
| H2d | KA | → | SP | 1.5490 | <0.001 | Supported | |
| H2e | KA | → | QG | 2.2250 | 0.350 | Not Supported | |
| H2f | KA | → | PS | 2.4020 | <0.001 | Supported | |
| H2g | KA | → | CL | 2.5000 | 0.9900 | Not Supported | |
| PM | H2h | PM | → | IF | 1.4600 | <0.001 | Supported |
| H2i | PM | → | QG | 1.8190 | <0.001 | Supported | |
| H2j | PM | → | PS | 1.3155 | <0.001 | Supported | |
| QM | H2k | QM | → | CF | 1.2350 | <0.001 | Supported |
| H2l | QM | → | QG | 0.5630 | <0.001 | Supported | |
| H2m | QM | → | EI | 0.5310 | <0.001 | Supported | |
| H2n | QM | → | PS | 0.9330 | <0.001 | Supported | |
| ET | H2o | ET | → | EI | 1.2920 | <0.001 | Supported |
| H2p | ET | → | CF | 0.3155 | <0.001 | Supported | |
| FI | H2q | FI | → | SP | 0.9930 | <0.001 | Supported |
| H2r | FI | → | CL | 2.2100 | <0.780 | Not Supported | |
| H2s | FI | → | PS | 0.9970 | <0.001 | Supported | |
| Pillar | H3 | Relationship | Weight | p-Value | Decision | ||
|---|---|---|---|---|---|---|---|
| SP | H3a | SP | → | QY | 0.2010 | 0.005 | Supported |
| H3b | SP | → | PF | 0.7860 | 0.643 | Not Supported | |
| CL | H3c | CL | → | QY | 0.5830 | 0.002 | Supported |
| CI | H3d | CI | → | QY | 0.1440 | 0.044 | Supported |
| H3e | CI | → | PF | 0.5850 | 0.748 | Not Supported | |
| EI | H3f | EI | → | PD | 0.1130 | 0.021 | Supported |
| H3g | EI | → | EM | 0.1500 | 0.045 | Supported | |
| CF | H3h | CF | → | EM | 0.5580 | 0.011 | Supported |
| H3i | CF | → | PD | 0.3100 | 0.450 | Not Supported | |
| H3j | CF | → | DY | 0.259 | 0.230 | Not Supported | |
| IF | H3k | IF | → | QY | 0.5834 | 0.039 | Supported |
| H3l | IF | → | PF | 0.3650 | 0.019 | Supported | |
| QG | H3m | QG | → | QY | 0.8317 | 0.001 | Supported |
| PS | H3n | PS | → | QY | 0.1620 | 0.014 | Supported |
| H3o | PS | → | CT | 0.4050 | 0.002 | Supported | |
| Performance | TQM (1) | TPM (2) | TPM→TQM→ Performance (3) | (4) = (2)+(3) | (5) = (4) + (1) |
|---|---|---|---|---|---|
| QY | 2.5051 | 2.6094 | 8.855173 | 11.46457 | 13.96967 |
| PF | 1.7360 | 5.0730 | 2.530912 | 7.603912 | 9.339912 |
| PD | 0.4230 | 3.5190 | 0.875985 | 4.394985 | 4.817985 |
| EM | 0.7080 | 0.3130 | 1.359702 | 1.672702 | 2.380702 |
| DY | 0.2590 | 1.4160 | 0.081715 | 1.497715 | 1.756715 |
| CT | 0.4050 | 2.0290 | 2.287238 | 4.316238 | 4.721238 |
| SH | 2.6130 | 2.613000 | 2.613000 |
Publisher’s Note: MDPI stays neutral with regard to jurisdictional claims in published maps and institutional affiliations. |
© 2022 by the authors. Licensee MDPI, Basel, Switzerland. This article is an open access article distributed under the terms and conditions of the Creative Commons Attribution (CC BY) license (https://creativecommons.org/licenses/by/4.0/).
Share and Cite
Al-Refaie, A.; Lepkova, N.; Camlibel, M.E. The Relationships between the Pillars of TPM and TQM and Manufacturing Performance Using Structural Equation Modeling. Sustainability 2022, 14, 1497. https://doi.org/10.3390/su14031497
Al-Refaie A, Lepkova N, Camlibel ME. The Relationships between the Pillars of TPM and TQM and Manufacturing Performance Using Structural Equation Modeling. Sustainability. 2022; 14(3):1497. https://doi.org/10.3390/su14031497
Chicago/Turabian StyleAl-Refaie, Abbas, Natalija Lepkova, and Mehmet Emre Camlibel. 2022. "The Relationships between the Pillars of TPM and TQM and Manufacturing Performance Using Structural Equation Modeling" Sustainability 14, no. 3: 1497. https://doi.org/10.3390/su14031497
APA StyleAl-Refaie, A., Lepkova, N., & Camlibel, M. E. (2022). The Relationships between the Pillars of TPM and TQM and Manufacturing Performance Using Structural Equation Modeling. Sustainability, 14(3), 1497. https://doi.org/10.3390/su14031497