Article

In Pursuit of New Spaces for Threatened Mammals: Assessing Habitat Suitability for Kashmir Markhor (Capra falconeri cashmeriensis) in the Hindukush Range

1
College of Wildlife and Protected Areas, Northeast Forestry University, Harbin 150040, China
2
Carnivore Conservation Lab, Department of Zoology, Quaid-I-Azam University, Islamabad 45320, Pakistan
3
Wildlife and Ecosystem Research Lab, Department of Zoology, University of Chitral, Chitral 17200, Pakistan
4
Wildlife Department Chitral Division, Chitral 17200, Pakistan
*
Authors to whom correspondence should be addressed.
Sustainability 2022, 14(3), 1544; https://doi.org/10.3390/su14031544
Submission received: 13 December 2021 / Revised: 13 January 2022 / Accepted: 26 January 2022 / Published: 28 January 2022
(This article belongs to the Section Sustainability, Biodiversity and Conservation)

Abstract

:
Natural wild habitats are either destroyed or shrunk due to human interventions. Therefore, habitat evaluation is crucial for managing wildlife populations and designing robust conservation strategies. Species presence data and geographic information system (GIS) coupled with ground-breaking powerful statistical techniques have made such assessments possible. We used maximum entropy modeling (MaxEnt) to identify suitable habitats for Kashmir markhor (Capra falconeri cashmeriensis) in Malakand Division, Pakistan. MaxEnt was applied to 169 markhor sighting points and topographical and current bioclimatic variables. Results showed that the accuracy of the MaxEnt model was good (AUC = 0.889). Of the total area studied (8407.09 km2), 22.35% (1878.75 km2) was highly suitable and 32.63% (2743.53 km2) was moderately suitable for markhor. Protected areas including Chitral Gol National Park (CGNP), Tooshi-Sasha Conservancy (TSC), and Gehrait-Golain Conservancy (GGC) and their buffers were included in highly suitable habitats. MaxEnt also predicted highly suitable habitats in Kumrat and Kalam valleys. We believe that moderately suitable habitats identified in Jinjeret, Ursoon, Birir valley, and Bumborait valley have the potential to host markhor populations. Based on the results obtained in the current study, we strongly recommend expanding the current protected areas (PAs) network in the study area and strengthening it by inclusive conservation management with local communities.

1. Introduction

Wildlife habitats are diverse natural environments, each with particular species completing their life cycles in these habitats [1]. Habitats supply resources for species persistence and represent a decisive factor for survival and successful propagation [2,3]. However, human activities have primarily destroyed the natural wild habitats, bringing many species to the verge of extinction. Such devastating impacts of human activities have alarmed biologists into safeguarding the threatened species by preserving their habitats [4,5]. Therefore, studying habitats is indispensable for wildlife management and protection, offering a scientific rationale for improving conservation policies [6,7,8].
A measure of the ability of a particular environment to sustain a species is the habitat suitability index (HSI), an important indicator reflecting the quality of habitat [9,10]. Ecological models such as habitat suitability models (HSMs) allow the opportunity to investigate wildlife relationships with habitats and identify potential habitats for endangered species [11,12]. The HSM helps to evaluate a particular habitat and defines suitable alternative habitats for conservational policies [13]. HSMs are increasingly being used to map the potential habitats for many species [14]. Several environmental variables are associated with species distribution, abundance, and habitat selection, thus ultimately contributing to species survival [15]. HSMs assimilate species occurrence data with climatic and other environmental variables to estimate species-specific environmental suitability across a given spatial extent [14,16,17].
Among the ecological niche models (ENMs), maximum entropy (MaxEnt) is widely used in habitat suitability modeling due to its accurate prediction capabilities in simulations and additional descriptive properties [1,18]. MaxEnt estimates the probability of the presence of a species based on occurrence records and randomly generates contextual locations by finding the maximum entropy distribution [19,20]. These models can use either presence/absence data or presence-only data [14]. There is widespread use of species presence/absence data in biological surveys and wildlife management [21]. Yet, species absence data are either unavailable or believed to be strenuous to interpret [22]. Nevertheless, species distribution models (SDMs) trained on presence-only data are extensively used in ecological research and designing conservation strategies [18,23]. Highly compatible even with a small amount of presence-only datasets, MaxEnt has surpassed classical modeling approaches such as Bioclimatic Prediction and Modeling System (BIOCLIM), Data-Interpolating Variational Analysis (DIVA), Generalized Additive Model (GAM), Generalized Linear Model (GLM), and Genetic Algorithm for Rule-set Prediction (GARP) [1,24,25,26,27,28].
Markhor (Capra falconeri) is a spectacular true wild goat belonging to family Bovidae and subfamily Caprinae [29]. Pakistan harbors four sub-species of markhor, including Astor markhor (Capra falconeri falconeri) endemic to Gilgit-Baltistan (GB) Province [30], Kashmir or Pir Panjal markhor (Capra falconeri cashmiriensis) endemic to the northern areas of Khyber Pakhtunkhwa (KP) Province, Kohistan, Kashmir, GB Province. The third subspecies, Kabul Markhor (Capra falconeri megaceros), is endemic to Baluchistan Province and Koh Safed range of Khyber KP Province. The fourth sub-species, i.e., Suleiman Markhor (Capra falconeri jerdoni), is endemic to Baluchistan Province [29]. Globally, markhor is listed as Near Threatened [31] and endangered in Pakistan [32]. The subspecies mentioned above face many anthropogenic pressures akin to overgrazing leading to habitat degradation and habitat fragmentation due to infrastructure projects coupled with climate change [33]. These factors are proving fatal to the survival of this magnificent species in the long term.
In Pakistan, most of the studies conducted on mountain ungulates are based on population dynamics for one specific reason—to monitor community-based trophy-hunting programs [34]. Though the inception of trophy hunting programs has helped in reviving the populations of ungulates, involving the local communities safeguarding the species by putting a stop to poaching, yet, many mountain ungulates of Pakistan are still listed as locally endangered [34]. It is believed that habitat destruction has played a significant role in the extinction of these ungulates from most of their ancestral ranges in Pakistan [13,35,36]. Information about the suitable habitats of mountain ungulates in Pakistan is scarce. Considering the habitat potentials of northern areas of KP Province Pakistan [33], we predicted that vast suitable habitats for Kashmir markhor exist outside the protected areas (PAs). Hence, the first study objective was to assess and evaluate potential habitats for Kashmir markhor, and the second, to suggest recommendations for possible expansion and better management of PAs network in the study area. We assume that this study will provide baseline information about habitat suitability for Kashmir markhor and serve as a gateway for further research on other sub-species of markhor and other mountain ungulates across the globe.

2. Materials and Methods

2.1. Study Area

Our study area encompassed 8407 km2 and was located in three districts of Malakand Division (35°29′59.99″ N 72°00′0.00″ E) of KP Province Pakistan. These districts include District Chitral–lower, District Dir–upper, and District Swat (Figure 1). In District Swat, markhor is found in Kalam and Mankiyal valley in the Upper–Swat bounded by Chitral District and GB Province in the north, Indus Kohistan in the east, Bahrain Kohistan in the south, and Dir District in the west. Kumrat valley in District Dir–upper has remained part of the historical range of markhor in the region, bounded by Kalam valley in the east and Shishikoh valley of Chitral in the north-west. In District Chitral–lower, prime areas harboring markhor are the PAs, including the Chitral Gol National Park (CGNP) and two conservancies viz. Tooshi-Sasha Conservancy (TSC) and Gehraite-Golain Conservancy (GGC). CGNP encompasses an area of 77.5 km2 and is situated at a distance of 3 km west of Chitral town. TSC comprises an area of 200 km2 and is located to the northeast of Chitral town on either side of Garam Chashma stream, a tributary of River Chitral. GGC encompasses an area of 950 km2, extending from south to northeast of Chitral town along the left bank of River Chitral.

2.1.1. Climate

The study area lies in the foothills of the greater Hindukush Mountains, where the winters are very cool, with temperatures ranging from 11.22 °C to −2.39 °C. The summer season is considered pleasant, with an average temperature of 28 °C. During winter, the climate is harsh (November–February), with frequent snowfall.

2.1.2. Flora and Fauna

The study areas consist of typical dry temperate vegetation predominantly consisting of Quercus ilex (Holly oak), Cedrus deodara (Deodar), Pistacia integerrima (Crab’s claw), Pinus gerardiana (Chilgoza pine), Juniperus macropoda (Pashtun juniper), Amygdalus bucharica (Korsh), Artemisia maritima (Wormwood), Salix iliensis (Willow tree), Rubus anatolicus (Bramble), Origanum vulgare (Oregano), and grasses [37,38]. The dominant mammalian fauna of the region includes Panthera uncia (Snow leopard), Panthera pardus (Common leopard), Canis lupus (Gray wolf), Lynx lynx isabellinus (Himalayan lynx), Canis aureus (Golden jackal), Vulpes vulpes (Red fox), Ursus thibetanus (Asiatic black bear), and Lepus capensis (Cape hare). Notable bird species include Alectoris chukar (Chukar partridge), Lophophorus impejanus (Monal pheasant), Tetraogallus himalayensis (Snow cock), Aquila chrysaetos (Golden eagle), Columba livia (Rock pigeon), etc. [39].

2.2. Study Methods

2.2.1. Species Presence Data

We conducted field surveys from 15 October 2021 to 30 November 2021. Based on watersheds, each central valley in the study area was subdivided into smaller sub-valleys for coverage and intensive survey. High-resolution maps (A3-sized base maps of ASTER satellite data of scale 1:50,000) were developed for each study site to facilitate data collection and navigation in the field [34,40]. A team of two observers walked on a line transect of variable length in each valley. The topography of the study area does not allow uniform transect length as most of the site consists of steep rocky terrain and narrow gorges [41,42]. On average, 1–2, mostly successive line transects were placed in each sub-valley based on the width of the valley [43]. Binoculars (10 × 50, Bushnell) were used to scan the area from different vantage points [34,44]. Each herd seen was ranked as a single unit [34,40]. After seeing markhor (individuals or herds) or fecal samples, presence points were recorded with a global positioning system (GPS) (GPSMAP 62s Garmin) as well as on the paper map. In areas where observations were made from a long distance to the transect or vintage point, a range finder (6 × 24, Prime 1700 Laser Bushnell) was used to measure the distance to precisely mark locations on the paper map. Given the gregarious nature of most ungulate species such as markhor, it is convenient to locate and obtain nearly exact coordinates from paper maps [45].

2.2.2. Data analysis

The data obtained in the current study were processed and analyzed using MaxEnt 3.3.3k [46] to predict suitable habitats for markhor in the study area. Based on the ecological niche theory, the MaxEnt model relies on information from species presence data to investigate the possible distribution of a target species within a study area [18]. The MaxEnt software was developed to assess and evaluate suitable habitats for target species with good predictive power [20] and is amongst the most advanced and promising tools for SDMs [47,48]. Due to its higher predictive accuracy, MaxEnt has surpassed other methods used for the purposes mentioned above [24,49].

2.2.3. Selection of Presence Data and Environmental Variables

All environmental layers were transformed to the same size and resolution, i.e., 1 × 1 km. Markhor occurrence points were converted into a vector file in ArcGIS 10.8. Markhor presence records were screened in ArcGIS 10.8 (SDM toolbox) for spatial autocorrelation using average nearest neighbor analysis to remove spatially correlated data points (located within 5 km) and to guarantee independence [50,51,52]. After this selection, 48 unrelated locations were used to produce markhor’s current habitat suitability models in the study area.
We initially considered a set of 28 environmental variables (Table 1). To remove the highly correlated variables from the analysis, we used Pearson Correlation Matrix [53] in program R (version 3.6.2) [54]. After this analysis, 19 variables were retained (r < 0.7) [14,53,55], including 12 bioclimatic variables (WorldClim version 2.1 climate data) (bio1, bio2, bio3, bio4, bio6, bio8, bio11, bio12, bio14, bio15, bio16, and bio17), rivers, roads, settlements, ruggedness, slope, soil, NDVI, and global land cover (glc2000). Bioclimatic variables were derived from the mean temperature, minimum temperature, maximum temperature, and precipitation to generate more biologically meaningful variables, often used in ecological niche modeling [14].

2.2.4. Model Simulation and Evaluation

Markhor presence data and selected variables were modified to the format required for MaxEnt software (v 3.3.3k) [20]. We used a random seed option and kept 5% of data for random tests—five replicates were run with typeset as a sub-sample. The rest of the settings were kept as default, including a maximum of 10,000 randomly generated background points, 500 maximum iterations with a convergence threshold of 0.00001, and a regularization multiplier of 1. We used a jackknife estimator to determine each variable’s importance and contribution [18,56]. Sensitivity analysis was performed for each variable with a logistic output format. The success of MaxEnt model was verified by receiver operating characteristic (ROC) values [56,57]: rejected with a ROC value 0.5–0.6; poor with 0.6–0.7; average with 0.7–0.8; good with 0.8–0.9; and excellent with 0.9–1.0. The output results were used to reclassify the suitable markhor habitat distribution. The ASCII outputs format file was imported into ArcGIS 10.8 for transformation into raster data to generate a habitat suitability map. Raster data were reclassified to calculate the area [58].

3. Results

3.1. Species Presence Records

A total of 169 confirmed markhor presence locations were recorded in the current study (Figure 1).

3.2. MaxEnt Prediction Evaluation

The current study obtained a valid and valuable model based on the values of the area under curve (AUC). The ROC results (Figure 2) showed an average AUC value of 0.889, indicating that the predictions obtained from the MaxEnt model were good. The standard deviation was 0.092.

3.3. Factors Determining Habitat Suitability

Global land cover (glc2000) contributed 35.4% in habitat selection of markhor (Figure 3, Table 2). Other variables with the highest contribution in habitat selection of markhor were bio15 (15%), bio6 (12.7%), rivers (10.3%), bio2 (4.3%), bio11 (4.2%), and bio12 (4%). The least contributing variable were ruggedness (0.4%), bio4 (0.5%), soil (1%), bio17 (1.1%), bio14 (1.2%), bio8 (1.4%), bio16 (2%), road (2.3%), and settlements (2.65%). Two variables, bio1 and slope, did not contribute to markhor’s habitat prediction in our study area (Figure 3, Table 2).
Results of the jackknife test showed that the environmental variable with the highest gain, when used in isolation, was bio6, which appeared to have the most useful information by itself. The environmental variable that decreased the gain the most when omitted was rivers. Therefore, it seems rivers held the most information not present in the other variables. Values shown are averages over replicate runs (Figure 4).

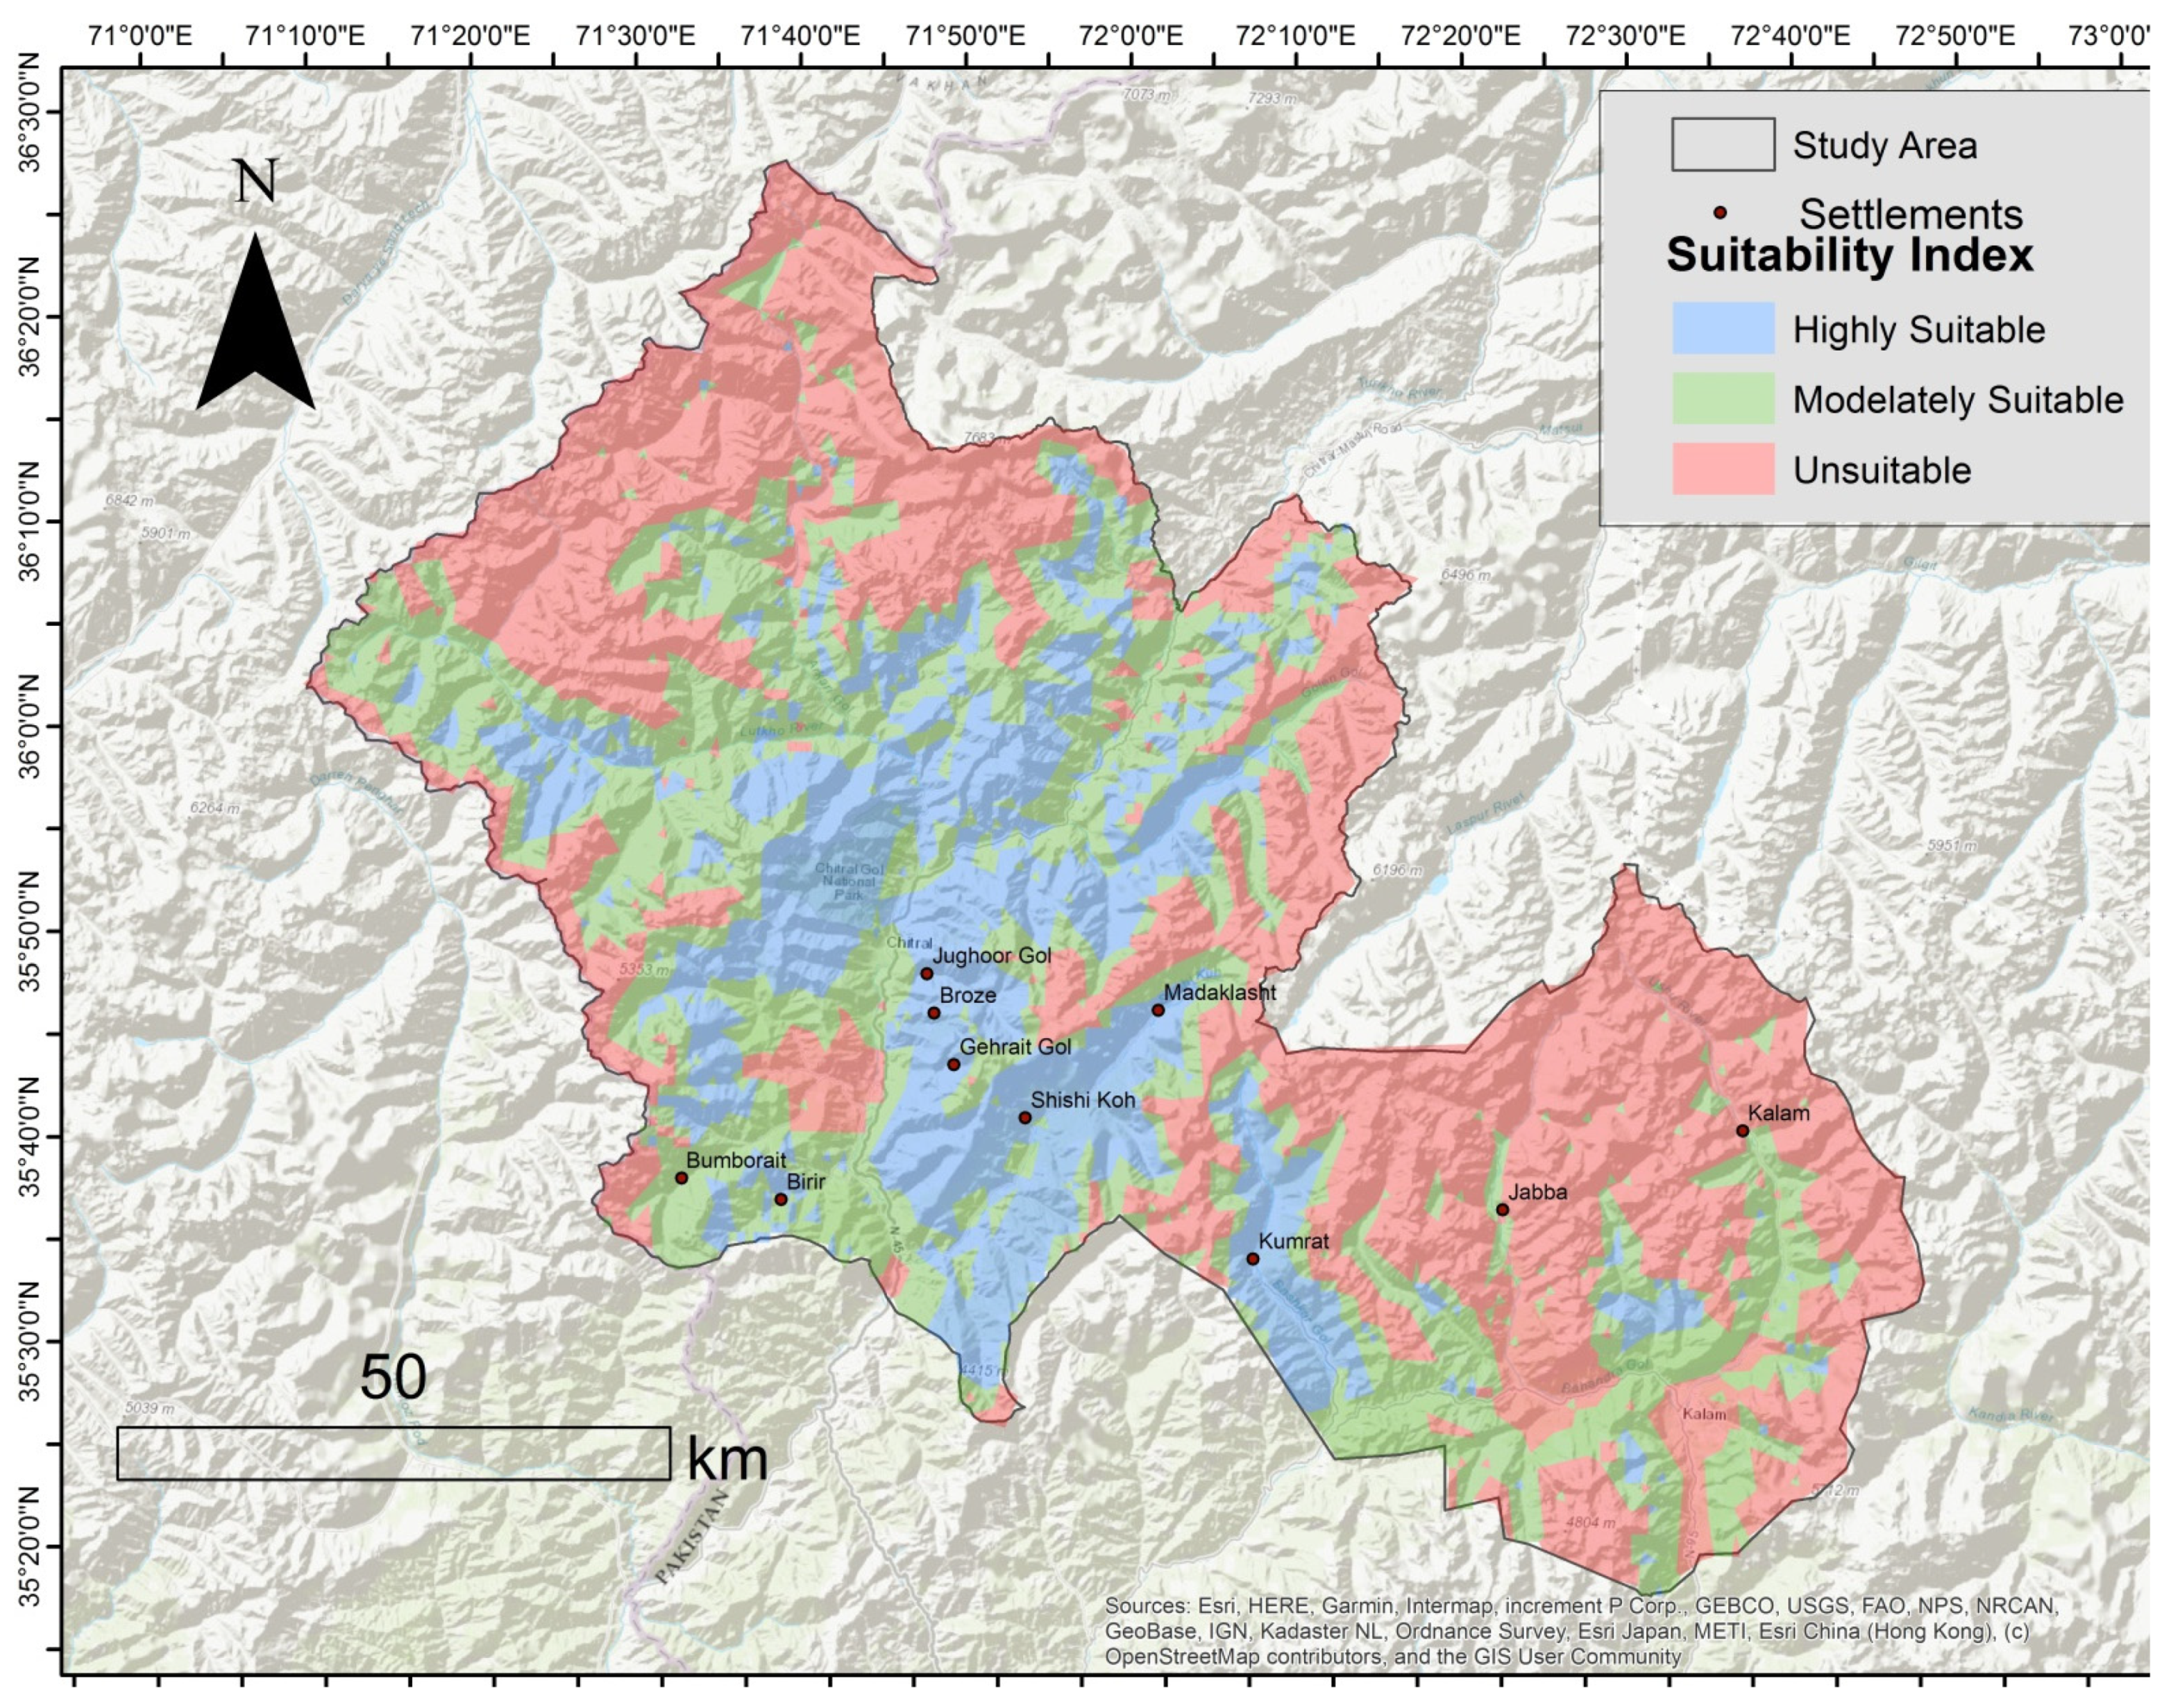
3.4. Distribution of Markhor-Suitable Habitat

The habitat suitability map generated through MaxEnt modeling showed that highly suitable habitats of markhor are present in the center of the study area, i.e., CGNP, buffer of CGNP, TSC, and GGC. These areas extend on either side of Lotkoh River and Chitral River in the north and connect to Kumrat and Kalam Mankiyal Valleys through the Shishikoh valley east of Chitral. MaxEnt model also predicted small patches of highly suitable habitats of markhor in the Kumrat Valley and Kalam valley of district Dir–upper and Swat, respectively (Figure 5). Most of the moderately suitable habitats of markhor are located in the north-western, south-western, and eastern parts of the study area. Unsuitable habitats are restricted to northern and eastern parts of the study area (Figure 5).

3.5. Suitable Area

The habitats were classified into three categories based on the thresholds: unsuitable (0.00–0.19), moderately suitable (0.20–0.45), and highly suitable (0.46–0.92) areas. Results obtained by processing the reclassified map showed that the unsuitable habitats in our study area constituted 3784.81 km2 (45.02%), moderately suitable habitat 2743.53 km2 (32.63%), and highly suitable habitat was 1878.75 km2 (22.35%).

4. Discussion

The bringing out of–and ensuing advances in geographic information systems (GISs) has made it possible to obtain a wide variety of spatial and temporal datasets to better comprehend species distribution and the environmental variables that influence these distributions at multiple scales [59]. In the current study, we almost covered the entire known distribution range of Kashmir markhor in Malakand Division to predict the suitable habitat that can assist in the conservation of this endangered species by upgrading and strengthening the PAs network.
Our results indicated that habitat suitability was influenced by several environmental variables, of which glc2000 was the most influential (35.4%), followed by bio15 (15%) and bio6 (12.7%). Glc2000 is a primary input dataset and categorical variable that includes and defines a variety of land covers viz. forests, water bodies, shrubs, herbaceous and sparse vegetation, etc. [18,60]. Markhor is a mixed feeder with higher propensities towards grazing [61]. It is believed that large herbivores’ habitat selection is primarily determined by the greenness of the area [62]. Our study area harbors an array of plant species, including trees, shrubs, herbs, and grasses [38]. Our results showed that the level 13 (herbaceous cover (closed-open)) and level 14 (sparse herbaceous or sparse shrub cover) of glc2000 had the highest significant contribution (Figure 3). However, there were no distinct features of any significant difference between the other levels of glc200 viz. level two (tree cover, broadleaved, deciduous, closed), level four (tree cover, needle-leaved, evergreen), level 12 (shrub cover, closed-open, deciduous), level 16 (cultivated and managed areas), level 19 (bare area), and level 21 (snow and ice) (Figure 3). The contribution of glc2000 in markhor habitat selection indicates the strong tendencies of markhor towards the greenness in the study area. Considering the contribution of glc2000 in markhor habitat selection and results reported by Ashraf et al. [38], we believe that markhor prefers to inhabit habitat patches with a clumpy and diverse variety of herbs and shrubs, avoiding forests.
Our results further indicated that bio15 (precipitation seasonality) and bio6 (minimum temperature of the coldest month) at the regional level strongly influence suitable markhor habitats. Thus, we assume that climate change will probably affect the markhor habitat selection [63]. Global warming has affected the climate of Pakistan to a large extent. In such cases, climate variability can potentially affect both forage quantity and quality [64], with ultimate impacts on population survival. Thus, it is vital to understand the direct and indirect effects of climate change on mountain ungulates for their robust management and conservation at regional levels.
Our study reports the use of the MaxEnt model to assess habitat suitability of markhor for the very first time and, according to the AUC values, results were promising [18]. We showed that the highly suitable habitat of markhor was mainly located within PAs and their buffer zones (Figure 5). These PAs include the CGNP and the two conservancies, TSC and GGC. The habitats in these areas are largely protected from human activities by the government in coordination with the local communities [33], thereby providing a refuge of 1878.75 km2 for the markhor. Our model further revealed that small patches of highly suitable habitat exist in Dir and Swat districts, south of Chitral district. Habitat potential of the areas mentioned above meets markhor needs [65].
Based on the results obtained in the current study, we assume that moderately suitable areas (2743.53 km2) can provide promising excursion and survival opportunities to markhor. These areas include south-western parts of Chitral–lower, including Jinjeret, Ursoon, Birir valley, some parts of Bumborait valley. All these areas are along the Pak-Afghan border or close to the border. In Kalam and Kumrat, areas below 3700 m a.s.l are predicted to be moderate to highly suitable. Comparing the field observation map (Figure 1) with the habitat suitability map (Figure 5) showed that the species has not been frequently recorded where the moderately suitable habitats have been predicted. The plausible explanation for this fact is the concentration of animals towards highly suitable areas [66], with sufficient resources. In our study area, markhor avoided some highly and moderately suitable areas, where human disturbance in the form of roads and settlements is either absent or very low (Supplementary Materials). A possible reason for this trend could be the weak protection levels against poaching, which may have drastically decreased markhor numbers in these areas. Schaller and Khan [67] once reported a higher presence of markhor with huge numbers (n = 1500) in the aforementioned habitats (Kalam, Swat Division) in comparison with the current core zones of markhor, i.e., CGNP and its buffers (n = 500–600). However, in recent decades, the shift in markhor presences reported in the current study and numbers (n = 2700) [33] in protected areas clearly indicates that strong protection levels have played a key role in increasing and stabilizing markhor populations. Areas with higher elevations (≥4000 m a.s.l) were predicted as unsuitable habitats in the current study. These results follow markhor principal elevational range use in our study area, i.e., from 2700 m a.s.l to 4000 m a.s.l [65].
Other studies conducted on the distribution of all sub-species of markhor including Kashmir markhor revealed that these mountain goats avoid high elevation areas with deep snow cover. Moreover, they prefer to inhabit comparatively dry areas. In addition, all sub-species of markhor avoid thick forests and prefer to inhabit grasslands [29,34,67,68]. The results obtained in the current study are in agreement with the findings of aforementioned studies.

4.1. Model Constraints

Our model has only one constraint, i.e., a single-season (winter) survey. Due to low winter temperature and snow cover, mountain ungulates reside on lower elevations and move back to higher elevations in spring and summer [69]. Therefore, in the current study, whether the presence of species was recorded in higher elevations summer zones is not sure.

4.2. Management Implications

PAs are considered foundations for biodiversity conservation, and the selection of these sites, their designs, and management is based on scientific knowledge [70]. Expanding the PAs networks on regional and international levels is essential to better safeguard the biodiversity. Yet, challenges exist in expanding the PAs network effectively, particularly in identifying priority landscapes for the threatened species [71]. Our study presents the HSM for Kashmir markhor to determine the priority landscapes for the target species and to better guide PAs’ expansion and strengthening for robust conservation in the study area.

5. Conclusions

Using MaxEnt, we identified priority landscapes for Kashmir markhor in the study area. Presence-only data obtained in the current study revealed that Kashmir markhor populations inhabit primarily the PAs, avoiding several highly and moderately suitable habitats outside the PAs. We strongly assume that the primary reason for avoiding these habitats are the weak protection levels. Inclusive conservation and management strategies operating in TSC and GGC seem promising in protecting the species and its habitat, which is evident from the field observations in the current study. Therefore, based on the results obtained in the current study, we strongly recommend expanding the existing PAs network by merging the aforementioned identified suitable habitats and strengthening the PAs management with inclusive management strategies by involving local communities for robust conservation of markhor. In addition, we also recommend assessing the impacts of predators and livestock on the distribution patterns of markhor, which we believe would be very promising for species conservation and better management of PAs networks.

Supplementary Materials

The following supporting information can be downloaded at: https://www.mdpi.com/article/10.3390/su14031544/s1, Figure S1: Intensity of Settlements and roads in the study Area.

Author Contributions

Conceptualization, R.H.K., Z.L. and L.T.; methodology, R.H.K. and S.A.; software, R.H.K. and S.A.; validation, R.H.K., Z.L. and L.T.; formal analysis, R.H.K. and S.A.; investigation, R.H.K., F.B., E.U.R. and A.A.S.; resources, Z.L. and L.T.; data curation, E.U.R., A.A.S. and F.B.; writing—original draft preparation, R.H.K.; writing—review and editing, R.H.K., S.A. and F.B.; visualization, R.H.K., Z.L. and L.T.; supervision, Z.L. and L.T.; project administration, R.H.K. and E.U.R.; funding acquisition, Z.L. and L.T. All authors have read and agreed to the published version of the manuscript.

Funding

This study was financially supported by the Key Laboratory of Conservation Biology, National Forestry and Grassland Administration, People’s Republic of China.

Acknowledgments

We are thankful to Khyber Pakhtunkhwa Wildlife Department, Chitral Division, for allowing us to conduct this study. Authors are thankful to the anonymous reviewers for their valuable and critical review and providing insightful comments.

Conflicts of Interest

The authors declare no conflict of interest. The funders had no role in the design of the study; in the collection, analyses, or interpretation of data; in the writing of the manuscript, or in the decision to publish the results.

References

  1. Su, H.; Bista, M.; Li, M. Mapping Habitat Suitability for Asiatic Black Bear and Red Panda in Makalu Barun National Park of Nepal from Maxent and GARP Models. Sci. Rep. 2021, 11, 14135. [Google Scholar] [CrossRef]
  2. Wang, J.L.; Chen, Y. Applications of 3S Technology in Wildlife Habitat Researches. Geogr. Geo-Inform. Sci. 2004, 20, 44–47. [Google Scholar]
  3. Yang, W.K.; Zhong, W.Q.; Gao, X.Y. A Review of Studies on Avian Habitat Selection. Arid Zo. Res. 2000, 17, 71–78. [Google Scholar]
  4. Suel, H. Brown Bear (Ursus Arctos) Habitat Suitability Modelling and Mapping. Appl. Ecol. Environ. Res. 2019, 17, 4245–4255. [Google Scholar] [CrossRef]
  5. Khattak, R.H.; Liu, Z.; Teng, L. Ex-Situ Conservation of Wild Ungulates in Khyber Pakhtunkhwa Province, Pakistan. Pak. J. Zool. 2021, 53, 2499–2501. [Google Scholar] [CrossRef]
  6. Pacifici, M.; Foden, W.B.; Visconti, P.; Watson, J.E.M.; Butchart, S.H.M.; Kovacs, K.M.; Scheffers, B.R.; Hole, D.G.; Martin, T.G.; Akçakaya, H.R.; et al. Assessing Species Vulnerability to Climate Change. Nat. Clim. Chang. 2015, 5, 215–224. [Google Scholar] [CrossRef]
  7. Gerrard, R.; Stine, P.; Church, R.; Gilpin, M. Habitat Evaluation Using GIS: A Case Study Applied to the San Joaquin Kit Fox. Landsc. Urban Plan. 2001, 52, 239–255. [Google Scholar] [CrossRef]
  8. Liu, Z.S.; Gao, H.; Teng, L.W.; Su, Y.; Wang, X.Q.; Kong, F.Y. Habitat Suitability Assessment of Blue Sheep in Helan Mountain Based on MAXENT Modeling. Acta Ecol. Sin. 2013, 33, 7243–7249. [Google Scholar]
  9. Song, J.; Wang, X.; Liao, Y.; Zhen, J.; Ishwaran, N.; Guo, H.; Yang, R.; Liu, C.; Chang, C.; Zong, X. An Improved Neural Network for Regional Giant Panda Habitat Suitability Mapping: A Case Study in Ya’an Prefecture. Sustainability 2014, 6, 4059–4076. [Google Scholar] [CrossRef] [Green Version]
  10. Lu, C.Y.; Gu, W.; Dai, A.H.; Wei, H.Y. Assessing Habitat Suitability Based on Geographic Information System (GIS) and Fuzzy: A Case Study of Schisandra sphenanthera Rehd. et Wils. in Qinling Mountains, China. Ecol. Modell. 2012, 242, 105–115. [Google Scholar] [CrossRef]
  11. Van Horne, B.; Wiens, J.A. Forest Bird Habitat Suitability Models and the Development of General Habitat Models; US Department of the Interior, Fish and Wildlife Service: Bailey’s Crossroads, VA, USA, 1991; Volume 8.
  12. Verner, J.; Morrison, M.L.; Ralph, C.J. Wildlife 2000: Modeling Habitat Relationships of Terrestrial Vertebrates: Based on an International Symposium Held at Stanford Sierra Camp, Fallen Leaf Lake, California, 7–11 October 1984; University of Wisconsin Press: Madison, WI, USA, 1986; ISBN 0299105202. [Google Scholar]
  13. Suleman, S.; Khan, W.A.; Anjum, K.M.; Shehzad, W.; Hashmi, S.G.M. Habitat suitability index (HIS) model of Punjab urial (Ovis vignei punjabiensis) in Pakistan. JAPS J. Anim. Plant Sci. 2020, 30, 229–238. [Google Scholar]
  14. Hameed, S.; Din, J.U.; Ali, H.; Kabir, M.; Younas, M.; Ur Rehman, E.; Bari, F.; Hao, W.; Bischof, R.; Nawaz, M.A. Identifying Priority Landscapes for Conservation of Snow Leopards in Pakistan. PLoS ONE 2020, 15, e0228832. [Google Scholar] [CrossRef] [PubMed]
  15. Debinski, D.M.; Kindscher, K.; Jakubauskas, M.E. A Remote Sensing and GIS-Based Model of Habitats and Biodiversity in the Greater Yellowstone Ecosystem. Int. J. Remote Sens. 1999, 20, 3281–3291. [Google Scholar] [CrossRef]
  16. Bentlage, B.; Peterson, A.T.; Barve, N.; Cartwright, P. Plumbing the Depths: Extending Ecological Niche Modelling and Species Distribution Modelling in Three Dimensions. Glob. Ecol. Biogeogr. 2013, 22, 952–961. [Google Scholar] [CrossRef]
  17. Phillips, S.J.; Dudík, M. Modeling of Species Distributions with Maxent: New Extensions and a Comprehensive Evaluation. Ecography 2008, 31, 161–175. [Google Scholar] [CrossRef]
  18. Bai, D.-F.; Chen, P.-J.; Atzeni, L.; Cering, L.; Li, Q.; Shi, K. Assessment of Habitat Suitability of the Snow Leopard (Panthera uncia) in Qomolangma National Nature Reserve Based on MaxEnt Modeling. Zool. Res. 2018, 39, 373. [Google Scholar]
  19. Reddy, M.T.; Begum, H.; Sunil, N.; Pandravada, S.R.; Sivaraj, N.; Kumar, S. Mapping the Climate Suitability Using MaxEnt Modeling Approach for Ceylon Spinach (Basella alba L.) Cultivation in India. J. Agric. Sci. 2015, 10, 87–97. [Google Scholar] [CrossRef]
  20. Phillips, S.J.; Anderson, R.P.; Schapire, R.E. Maximum Entropy Modeling of Species Geographic Distributions. Ecol. Modell. 2006, 190, 231–259. [Google Scholar] [CrossRef] [Green Version]
  21. Tyre, A.J.; Tenhumberg, B.; Field, S.A.; Niejalke, D.; Parris, K.; Possingham, H.P. Improving Precision and Reducing Bias in Biological Surveys: Estimating False-negative Error Rates. Ecol. Appl. 2003, 13, 1790–1801. [Google Scholar] [CrossRef] [Green Version]
  22. Václavík, T.; Meentemeyer, R.K. Invasive Species Distribution Modeling (ISDM): Are Absence Data and Dispersal Constraints Needed to Predict Actual Distributions? Ecol. Modell. 2009, 220, 3248–3258. [Google Scholar] [CrossRef]
  23. Syfert, M.M.; Smith, M.J.; Coomes, D.A. The Effects of Sampling Bias and Model Complexity on the Predictive Performance of MaxEnt Species Distribution Models. PLoS ONE 2013, 8, e55158. [Google Scholar] [CrossRef]
  24. Elith, J.H.; Graham, C.P.; Anderson, R.; Dudík, M.; Ferrier, S.; Guisan, A.J.; Hijmans, R.; Huettmann, F.R.; Leathwick, J.; Lehmann, A. Novel Methods Improve Prediction of Species’ Distributions from Occurrence Data. Ecography 2006, 29, 129–151. [Google Scholar] [CrossRef] [Green Version]
  25. Sun, W.T.; Liu, Y.T. Research Progress of Risk Analysis of Biological Invasion. Chin. Agric. Sci. Bull. 2010, 26, 233–236. [Google Scholar]
  26. Kriticos, D.J.; Randall, R.P. A Comparison of Systems to Analyse Potential Weed Distributions. In Weed Risk Assess, 1st ed.; Groves, R.H., Panetta, F.D., Virtue, J.G., Eds.; CSIRO Publishing: Clayton, Australia, 2001; pp. 61–79. [Google Scholar]
  27. Phillips, S.J.; Dudík, M.; Schapire, R.E. A Maximum Entropy Approach to Species Distribution Modeling. In Proceedings of the Twenty-First International Conference on Machine Learning, Banff, AB, Canada, 4–8 July 2004; p. 83. [Google Scholar]
  28. Guisan, A.; Thuiller, W. Predicting Species Distribution: Offering More than Simple Habitat Models. Ecol. Lett. 2005, 8, 993–1009. [Google Scholar] [CrossRef] [PubMed]
  29. Roberts, T.J. The Mammals of Pakistan; Earnst Benn Limited: London, UK, 1977. [Google Scholar]
  30. Zafar, M.; Khan, B.; Khan, E.; Garee, A.; Khan, A.; Rehmat, A.; Abbas, A.S.; Ali, M.; Hussain, E. Abundance Distribution and Conservation of Key Ungulate Species in Hindu Kush Karakoram and Western Himalayan (HKH) Mountain Ranges of Pakistan. Int. J. Agric. Biol. 2014, 16, 1050–1058. [Google Scholar]
  31. Michel, S.; Rosen Michel, T. Capra Falconeri (Errata Version Published in 2016). The IUCN Red List of Threatened Species. e.T3787A97218336. 2015. Available online: https://doi.org/10.2305/IUCN.UK.2015-4.RLTS.T3787A82028427.en (accessed on 6 December 2021).
  32. Sheikh, K.M.; Molur, S. Status and Red List of Pakistan’s Mammals. In Proceedings of the Based on the Conservation Assessment and Management Plan Workshop, IUCN Pakistan, Karachi, Pakistan, 13–17 December 2004. [Google Scholar]
  33. Rehman, E.; Khattak, R.H. Trophy Hunting Impacts on Kashmir Markhor and Changing the Negative Perception of Local Communities about Wildlife in Chitral District, Pakistan. Zoo’s Print J. 2020, 35, 12–14. [Google Scholar]
  34. Arshad, M.; Qamer, F.M.; Saleem, R.; Malik, R.N. Prediction of Kashmir Markhor Habitat Suitability in Chitral Gol National Park, Pakistan. Biodiversity 2012, 13, 78–87. [Google Scholar] [CrossRef]
  35. Arshad, M.; Malik, R.N.; Saqib, Z. Assessing Potential Habitats of Kashmir Markhor in Chitral Gol National Park, Khyber Pakhtunkhwa, Pakistan. Pak. J. Bot 2013, 45, 561–570. [Google Scholar]
  36. Baig, M.B.; Al-Subaiee, F.S. Biodiversity in Pakistan: Key Issues. Biodiversity 2009, 10, 20–29. [Google Scholar] [CrossRef]
  37. Din, J.U.; Nawaz, M.A. Status of the Himalayan Lynx in District Chitral, NWFP, Pakistan. J. Anim. Plant Sci. 2010, 20, 17–22. [Google Scholar]
  38. Ashraf, N.; Anwar, M.; Hussain, I.; Nawaz, M.A. Competition for Food between the Markhor and Domestic Goat in Chitral, Pakistan. Turk. J. Zool. 2014, 38, 191–198. [Google Scholar] [CrossRef] [Green Version]
  39. Din, J.U.; Hameed, S.; Shah, K.A.; Khan, M.A.; Khan, S.; Ali, M.; Nawaz, M.A. Assessment of Canid Abundance and Conflict with Humans in the Hindu Kush Mountain Range of Pakistan. Wildl. Biol. Pract. 2013, 9, 20–29. [Google Scholar] [CrossRef]
  40. Khan, G.; Khan, B.; Qamer, F.M.; Abbas, S.; Khan, A.; Xi, C. Himalayan Ibex (Capra Ibex Sibirica) Habitat Suitability and Range Resource Dynamics in the Central Karakorum National Park, Pakistan. J. King Saud Univ. 2016, 28, 245–254. [Google Scholar] [CrossRef] [Green Version]
  41. Khan, M.; Zaheer, A.I.; Gul Mehnaz, A.H. Distribution and Current Trends in the Population of Kashmir Markhor in Chitral Gol National Park District Chitral, Khyber Pakhtunkhwa. Can. J. Pure Appl. Sci. 2018, 12, 4561–4566. [Google Scholar]
  42. Hess, R. The Ecological Niche of Markhor Capra Falconeri between Wild Goat Capra Aegagrus and Asiatic Ibex Capra Ibex; University of Zurich: Zurich, Switzerland, 2002. [Google Scholar]
  43. Odonjavkhlan, C.; Alexsander, J.S.; Mishra, C.; Samelius, G.; Sharma, K.; Lkhagvajav, P.; Suryawanshi, K.R. Factors Affecting the Spatial Distribution and Co-Occurrence of Two Sympatric Mountain Ungulates in Southern Mongolia. J. Zool. 2021, 314, 266–274. [Google Scholar] [CrossRef]
  44. Jackson, R.M.; Hunter, D.O. Snow Leopard Survey and Conservation Handbook; International Snow Leopard Trust: Seattle, DC, USA, 1996. [Google Scholar]
  45. Le Moullec, M.; Pedersen, Å.Ø.; Yoccoz, N.G.; Aanes, R.; Tufto, J.; Hansen, B.B. Ungulate Population Monitoring in an Open Tundra Landscape: Distance Sampling versus Total Counts. Wildl. Biol. 2017, 2017. [Google Scholar] [CrossRef] [Green Version]
  46. Steven, J.; Phillips, M.; Dudík, R.E.S. Maxent Software for Modeling Species Niches and Distributions (Version 3.3.3). Available online: http://biodiversityinformatics.amnh.org/open_source/maxent/ (accessed on 3 December 2021).
  47. Fourcade, Y.; Engler, J.O.; Rödder, D.; Secondi, J. Mapping Species Distributions with MAXENT Using a Geographically Biased Sample of Presence Data: A Performance Assessment of Methods for Correcting Sampling Bias. PLoS ONE 2014, 9, e97122. [Google Scholar] [CrossRef] [Green Version]
  48. Merow, C.; Smith, M.J.; Silander, J.A., Jr. A Practical Guide to MaxEnt for Modeling Species’ Distributions: What It Does, and Why Inputs and Settings Matter. Ecography 2013, 36, 1058–1069. [Google Scholar] [CrossRef]
  49. Summers, D.M.; Bryan, B.A.; Crossman, N.D.; Meyer, W.S. Species Vulnerability to Climate Change: Impacts on Spatial Conservation Priorities and Species Representation. Glob. Chang. Biol. 2012, 18, 2335–2348. [Google Scholar] [CrossRef]
  50. Bosso, L.; Di Febbraro, M.; Cristinzio, G.; Zoina, A.; Russo, D. Shedding Light on the Effects of Climate Change on the Potential Distribution of Xylella Fastidiosa in the Mediterranean Basin. Biol. Invasions 2016, 18, 1759–1768. [Google Scholar] [CrossRef]
  51. Bosso, L.; Luchi, N.; Maresi, G.; Cristinzio, G.; Smeraldo, S.; Russo, D. Predicting Current and Future Disease Outbreaks of Diplodia Sapinea Shoot Blight in Italy: Species Distribution Models as a Tool for Forest Management Planning. For. Ecol. Manag. 2017, 400, 655–664. [Google Scholar] [CrossRef]
  52. Kwon, H.-S.; Kim, B.-J.; Jang, G.-S. Modelling the Spatial Distribution of Wildlife Animals Using Presence and Absence Data. Contemp. Probl. Ecol. 2016, 9, 515–528. [Google Scholar] [CrossRef]
  53. Welch, B.L.; Cole, D.N.; McArthur, E.D.; Booth, G.D.; Geier-Hayes, K.; Sloan, J.P. Identifying Proxy Sets in Multiple Linear Regression: An Aid to Better Coefficient Interpretation; US Department of Agriculture, Forest Service, Intermountain Research Station: Ogden, UT, USA, 1994; ISBN 0886-7380.
  54. R Core Team. R: A Language and Environment for Statistical Computing; R FoundAtion for Statistical Computing: Vienna, Austria, 2014. [Google Scholar]
  55. Kabir, M.; Hameed, S.; Ali, H.; Bosso, L.; Din, J.U.; Bischof, R.; Redpath, S.; Nawaz, M.A. Habitat Suitability and Movement Corridors of Grey Wolf (Canis Lupus) in Northern Pakistan. PLoS ONE 2017, 12, e0187027. [Google Scholar] [CrossRef] [Green Version]
  56. Baldwin, R.A. Use of Maximum Entropy Modeling in Wildlife Research. Entropy 2009, 11, 854–866. [Google Scholar] [CrossRef]
  57. Monterroso, P.; Brito, J.C.; Ferreras, P.; Alves, P.C. Spatial Ecology of the European Wildcat in a Mediterranean Ecosystem: Dealing with Small Radio-tracking Datasets in Species Conservation. J. Zool. 2009, 279, 27–35. [Google Scholar] [CrossRef]
  58. Ashraf, U.; Ali, H.; Chaudry, M.N.; Ashraf, I.; Batool, A.; Saqib, Z. Predicting the Potential Distribution of Olea Ferruginea in Pakistan Incorporating Climate Change by Using Maxent Model. Sustainability 2016, 8, 722. [Google Scholar] [CrossRef] [Green Version]
  59. Hirzel, A.H.; Le Lay, G. Habitat Suitability Modelling and Niche Theory. J. Appl. Ecol. 2008, 45, 1372–1381. [Google Scholar] [CrossRef]
  60. Mayaux, P.; Eva, H.; Gallego, J.; Strahler, A.H.; Herold, M.; Agrawal, S.; Naumov, S.; De Miranda, E.E.; Di Bella, C.M.; Ordoyne, C.; et al. Validation of the Global Land Cover 2000 Map. IEEE Trans. Geosci. Remote Sens. 2006, 44, 1728–1739. [Google Scholar] [CrossRef] [Green Version]
  61. Bashir, M.; Fazili, M.F.; Ahmad, F.; Ahmad, J. Dietary Ecology of Markhor (Capra Falconeri Cashmiriensis) in Winter Range of Kazinag National Park, Kashmir, J&K, India. Indian J. Sci. Technol. 2020, 13, 2463–2474. [Google Scholar]
  62. Traill, L.W.; Bigalke, R.C. A Presence-Only Habitat Suitability Model for Large Grazing African Ungulates and Its Utility for Wildlife Management. Afr. J. Ecol. 2007, 45, 347–354. [Google Scholar] [CrossRef]
  63. Li, J.; McCarthy, T.M.; Wang, H.; Weckworth, B.V.; Schaller, G.B.; Mishra, C.; Lu, Z.; Beissinger, S.R. Climate Refugia of Snow Leopards in High Asia. Biol. Conserv. 2016, 203, 188–196. [Google Scholar] [CrossRef]
  64. Middleton, A.D.; Kauffman, M.J.; McWhirter, D.E.; Cook, J.G.; Cook, R.C.; Nelson, A.A.; Klaver, R.W. Animal Migration amid Shifting Patterns of Phenology and Predation: Lessons from a Yellowstone Elk Herd. Ecology 2013, 94, 1245–1256. [Google Scholar] [CrossRef]
  65. Ali, S. Conservation and Status of Markhor (Capra Falconeri) in the Northen Parts of North West Frontier Province, Pakistan; University of Montana: Missoula, Montana, 2008. [Google Scholar]
  66. Strubbe, D.; Matthysen, E. Predicting the Potential Distribution of Invasive Ring-Necked Parakeets Psittacula Krameri in Northern Belgium Using an Ecological Niche Modelling Approach. Biol. Invasions 2009, 11, 497–513. [Google Scholar] [CrossRef]
  67. Schaller, G.B.; Khan, S.A. Distribution and Status of Markhor (Capra Falconeri. Biol. Conserv. 1975, 7, 185–198. [Google Scholar] [CrossRef]
  68. Haider, J.; Rakha, B.A.; Anwar, M.; Khan, M.Z.; Ali, H. An Updated Population Status of Astor Markhor (Capra Falconeri Falconeri) in Gilgit-Baltistan, Pakistan. Glob. Ecol. Conserv. 2021, 27, e01555. [Google Scholar] [CrossRef]
  69. Khattak, R.H.; Hussain, A.; Ejaz, U.-R.; Nawaz, M.A. Population Structure of Blue Sheep (Pseudios Nayaur) in Shimshal Valley Gilgit-Baltistan Pakistan. Pak. J. Zool. 2020, 52, 699–707. [Google Scholar] [CrossRef]
  70. Boucher, T.M.; Saplding, M.; Revenga, C. Role and Trends of Protected Areas in Conservation. Encycl. Biodivers. 2013, 6, 458–503. [Google Scholar]
  71. Zhang, K.; Gao, J.; Zou, C.; Lin, N.; Yu, D.; Cao, B.; Wang, Y. Expansion of Protected Area Networks Integrating Ecosystem Service and Social-Ecological Coordination. Glob. Ecol. Conserv. 2020, 24, e01298. [Google Scholar] [CrossRef]
Figure 1. Study area map, depicting markhor recorded presence in the current survey.
Sustainability 14 01544 g001
Figure 2. ROC verification of distribution of suitable markhor habitat in the current study area.
Sustainability 14 01544 g002
Figure 3. Response curves of predictors for markkhor occurrence in the study area. Note: The red curves show the mean response of the five replicate MaxEnt runs, while the mean +/− one standard deviation is shown by blue (two shades for categorical variables). Predicted value of habitat suitibality (logistic output) is shown on the Y-axis while the range of the environmental predictors is shown on the X-axis.
Sustainability 14 01544 g003
Figure 4. Jackknife test of regularized training gain of variables tested in the markhor habitat suitability model.
Sustainability 14 01544 g004
Figure 5. Distribution of habitats with different degrees of suitability in the study area based on MaxEnt modeling using presence-only data.
Sustainability 14 01544 g005
Table 1. List of environmental variables used in the current study [14,55].
Environmental VariablesInterpretationSource
bio1Annual mean temperaturehttps://www.worldclim.org/data/worldclim21.html (accessed on 4 December 2021)
bio2Mean diurnal range (mean of monthly [max temp–min temp])
bio3Isothermality (Bio2/Bio7) (×100)
bio4Temperature seasonality
(standard deviation ×100)
bio5Maximum temperature of warmest month
bio6Minimum temperature of coldest month
bio7Temperature annual range (Bio5–Bio6)
bio8Mean temperature of wettest quarter
bio9Mean temperature of driest quarter
bio10Mean temperature of warmest quarter
bio11Mean temperature of coldest quarter
bio12Annual precipitation
bio13Precipitation of wettest month
bio14Precipitation of driest month
bio15Precipitation seasonality (coefficient of variation)
bio16Precipitation of wettest quarter
bio17Precipitation of driest quarter
bio18Precipitation of warmest quarter
bio19Precipitation of coldest quarter
glc2000Global landcover 2000NASA (http://modis-land.gsfc.nasa. gov/vi.html) (accessed on 4 December 2021)
ruggednessVector ruggedness measureCreated from SRTM 90m DEM by the Center for Nature and Society, Peking University using the Terrain Ruggedness (VRM) Tool
altitudeElevation above sea level (m)NASA (SRTM)
slopeSlope of the areaCreated from SRTM 90m DEM
riverDensity of rivers (m) Line Density tool in ArcGIS 10.8
roadDensity of roads (m) Line Density tool in ArcGIS 10.8
settlementDensity of settlements (m) Point Density tool in ArcGIS 10.8
soilDigital soil map of the worldFAO, 2003
NDVI (MODIS)Normalized Difference Vegetation IndexUSGS: http://edcsns17.cr.usgs.gov/glcc (accessed on 4 December 2021)
Table 2. Variables’ contribution in determining suitable habitats for markhor in the study area.
S.NOVariablePercent ContributionPermutation Importance
1glc200035.44.1
2bio15154.8
3bio612.70
4rivers10.313.8
5bio24.39.9
6bio114.236.1
7bio1245.1
8settlements2.61.4
9road2.34.1
10bio1622.5
11bio31.63.6
12bio81.40.8
13bio141.22.5
14bio171.18.7
15soil10.3
16bio40.51.1
17ruggedness0.40.4
18bio100.7
19slope00
Publisher’s Note: MDPI stays neutral with regard to jurisdictional claims in published maps and institutional affiliations.

