
Determinants of Financial Sustainability in Chinese Firms: A Quantile Regression Approach

 , ,
, ,  ,
,
Abstract
:1. Introduction
2. Literature Review
3. Methodology, Model, and Determinants of Capital Structure
3.1. Methodology
3.2. Model and Determinants of Capital Structure
4. Data and Empirical Results
4.1. Data
4.2. Empirical Results
5. Conclusions
Author Contributions
Funding
Institutional Review Board Statement
Informed Consent Statement
Data Availability Statement
Acknowledgments
Conflicts of Interest
References
- Modigliani, F.; Miller, M.H. The cost of capital, corporation finance and the theory of investment. Am. Econ. Rev. 1958, 48, 261–297. [Google Scholar]
- Rajan, R.G.; Zingales, L. What do we know about capital structure? Some evidence from international data. J. Financ. 1995, 50, 1421–1460. [Google Scholar] [CrossRef]
- Murray, Z.F.; Vidhan, K.G. Testing the pecking order theory of capital structure. J. Financ. Econ. 2003, 67, 217–248. [Google Scholar]
- Hung, J.; Chang, V.Y.L. The analysis of capital structure for property-liability insurers: A quantile regression approach. Bus. Econ. Horiz. 2018, 14, 829–850. [Google Scholar] [CrossRef] [Green Version]
- Myers, S.C.; Majluf, N.S. Corporate financing and investment decisions when firms have information that in vestors do not have. J. Financ. Econ. 1984, 13, 187–221. [Google Scholar] [CrossRef] [Green Version]
- Titman, S.; Wessels, R. The determinants of capital structure choice. J. Financ. 1988, 43, 1–19. [Google Scholar] [CrossRef]
- Fama, E.F.; French, K.R. Testing trade-off and pecking order predictions about dividends and debt. Rev. Financ. Stud. 2002, 15, 1–33. [Google Scholar] [CrossRef]
- Yıldırım, D.; Çelik, A.K. Testing the pecking order theory of capital structure: Evidence from Turkey using panel quantile regression approach. Borsa Istanb. Rev. 2021, 21, 317–331. [Google Scholar] [CrossRef]
- Akdal, S. How Do Firm Characteristics Affect Capital Structure? Some UK Evidence. Available online: https://ssrn.com/abstract=1775706 (accessed on 3 March 2011).
- Myers, S.C. Capital structure. J. Econ. Perspect. 2001, 15, 81–102. [Google Scholar] [CrossRef] [Green Version]
- Aquino, R.; Yu, D. Testing capital structure models on Philippine listed firms. Appl. Econ. 2009, 41, 1973–1990. [Google Scholar]
- Lemmon, M.L.; Zender, J.F. Debt capacity and tests of capital structure theories. J. Financ. Quant. Anal. 2010, 45, 1161–1187. [Google Scholar] [CrossRef] [Green Version]
- Graham, J.R. How big are the tax benefits of debt? J. Financ. 2000, 55, 1901–1941. [Google Scholar] [CrossRef]
- Bancel, F.; Mittoo, U.R. Cross-country determinants of capital structure choice: A survey of European firms. Financ. Manag. 2004, 10, 103–132. [Google Scholar]
- Flannery, M.J.; Rangan, K.P. Partial adjustment toward target capital structures. J. Financ. Econ. 2006, 79, 469–506. [Google Scholar] [CrossRef]
- Fattouh, B. Capital structure in South Korea: A quantile regression approach. J. Dev. Econ. 2005, 76, 231–250. [Google Scholar] [CrossRef] [Green Version]
- Oliveira, G.R.; Tabak, B.M.; de Lara Resende, J.G.; Cajueiro, D.O. Determinants of the level of indebtedness for Brazilian firms: A quantile regression approach. EconomiA 2013, 14, 123–138. [Google Scholar] [CrossRef] [Green Version]
- Sánchez-Vidal, F.J. High debt companies’ leverage determinants in Spain: A quantile regression approach. Econ. Model. 2014, 36, 455–465. [Google Scholar] [CrossRef]
- Canh, N.T.; Liem, N.T.; Son, T.H. Determinants of capital structure of listed firms in Vietnam: A quantile regression approach. J. Econ. Dev. 2017, 24, 114–131. [Google Scholar] [CrossRef]
- Kaloudis, A.; Tsolis, D. Capital structure in US, a quantile regression approach with macroeconomic impacts. J. Econ. Bibliogr. 2018, 5, 1–17. [Google Scholar]
- Chen, J.J. Determinants of capital structure of Chinese-listed companies. J. Bus. Res. 2004, 57, 1341–1351. [Google Scholar] [CrossRef]
- Tong, G.; Green, C.J. Pecking order or trade-off hypothesis? Evidence on the capital structure of Chinese companies. Appl. Econ. 2005, 37, 2179–2189. [Google Scholar] [CrossRef]
- Huang, G. The determinants of capital structure: Evidence from China. China Econ. Rev. 2006, 17, 14–36. [Google Scholar] [CrossRef]
- Liu, Y.; Ren, J.; Zhuang, Y. An empirical analysis on the capital structure of Chinese listed I.T. companies. Int. J. Bus. Manag. 2009, 4, 46–51. [Google Scholar] [CrossRef] [Green Version]
- Chen, J.; Jiang, C.; Lin, Y. What determine firms’ capital structure in China? Manag. Financ. 2013, 40, 1024–1039. [Google Scholar]
- Yang, Y. Dynamic capital structure in China: Determinants and adjustment speed. Invest. Manag. Financ. Innov. 2015, 12, 8. [Google Scholar]
- Kyissima, K.H.; Xue, G.Z.; Kossele, T.P.Y.; Abeid, A.R. Analysis of capital structure stability of listed firms in China. China Financ. Rev. Int. 2020, 10, 213–228. [Google Scholar] [CrossRef]
- Vijayakumaran, S.; Vijayakumaran, R. Debt maturity and the effects of growth opportunities and liquidity risk on leverage: Evidence from Chinese listed companies. J. Asian Financ. Econ. Bus. Forthcom. 2019, 6, 27–40. [Google Scholar] [CrossRef]
- Bajaj, Y.; Kashiramka, S.; Singh, S. Capital structure dynamics: China and India (Chindia) perspective. Eur. Bus. Rev. 2020, 32, 845–868. [Google Scholar] [CrossRef]
- Jiang, X.; Shen, J.H.; Lee, C.C.; Chen, C. Supply-side structural reform and dynamic capital structure adjustment: Evidence from Chinese-listed firms. Pac.-Basin Financ. J. 2021, 65, 101482. [Google Scholar] [CrossRef]
- Szomko, N. Factors Associated with the Capital Structure of Polish Companies in the Long and Short Term. Gospod. Nar. Pol. J. Econ. 2020, 301, 55–74. [Google Scholar] [CrossRef]
- Ahmed, R.; Bhuyan, R. Capital structure and firm performance in Australian service sector firms: A panel data analysis. J. Risk Financ. Manag. 2020, 13, 214. [Google Scholar] [CrossRef]
- Koenker, R.; Bassett, G., Jr. Regression quantiles. Econom. J. Econom. Soc. 1978, 46, 33–50. [Google Scholar] [CrossRef]
- Rodriguez, R.N.; Yao, Y. Five things you should know about quantile regression. In Proceedings of the SAS Global Forum 2017 Conference, Orlando, FL, USA, 2–5 April 2017; pp. 2–5. [Google Scholar]
- Powell, J.L. Censored regression quantiles. J. Econom. 1986, 32, 143–155. [Google Scholar] [CrossRef]
- Buchinsky, M. Estimating the asymptotic covariance matrix for quantile regression models a Monte Carlo study. J. Econ. 1995, 68, 303–338. [Google Scholar] [CrossRef]
- Jensen, M.C.; Meckling, W.H. Theory of the firm: Managerial behavior, agency costs and ownership structure. J. Financ. Econ. 1976, 3, 305–360. [Google Scholar] [CrossRef]
- Harris, M.; Raviv, A. Capital structure and the informational role of debt. J. Financ. 1990, 45, 321–349. [Google Scholar] [CrossRef]
- Harris, M.; Raviv, A. The theory of capital structure. J. Financ. 1991, 46, 297–355. [Google Scholar] [CrossRef]
- De Jong, A.; Kabir, R.; Nguyen, T.T. Capital structure around the world: The roles of firm-and country-specific determinants. J. Bank. Financ. 2008, 32, 1954–1969. [Google Scholar] [CrossRef] [Green Version]
- DeAngelo, H.; Masulis, R.W. Optimal capital structure under corporate and personal taxation. J. Financ. Econ. 1980, 8, 3–29. [Google Scholar] [CrossRef]
- Wald, J.K. How firm characteristics affect capital structure: An international comparison. J. Financ. Res. 1999, 22, 161–187. [Google Scholar] [CrossRef]
- Baskin, J. An empirical investigation of the pecking order hypothesis. Financ. Manag. 1989, 18, 26–35. [Google Scholar] [CrossRef]
- Warner, J.B. Bankruptcy costs: Some evidence. J. Financ. 1977, 32, 337–347. [Google Scholar] [CrossRef]
- Dang, C.; Li, Z.F.; Yang, C. Measuring firm size in empirical corporate finance. J. Bank. Financ. 2018, 86, 159–176. [Google Scholar] [CrossRef]
- Aviral, K.T.; Raveesh, K. Determinants of capital structure: A quantile regression analysis. Stud. Bus. Econ. 2015, 10, 16–34. [Google Scholar] [CrossRef] [Green Version]
- Hovakimian, A.; Li, G. Do firms have unique target debt ratios to which they adjust? SSRN Electron. J. 2009. [Google Scholar] [CrossRef]
- Cotei, C.; Farhat, J.; Abugri, B.A. Testing trade-off and pecking order models of capital structure: Does legal system matter? Manag. Financ. 2011, 37, 715–735. [Google Scholar] [CrossRef]
- Castro, P.; Fernández, M.T.T.; Amor-Tapia, B.; de Miguel, A. Target leverage and speed of adjustment along the life cycle of European listed firms. BRQ Bus. Res. Q. 2016, 19, 188–205. [Google Scholar] [CrossRef] [Green Version]
- Wanzenried, G. Capital structure dynamics in the U.K. and continental Europe. Eur. J. Financ. 2006, 12, 693–716. [Google Scholar] [CrossRef]
- Smith, C.W., Jr.; Watts, R.L. The investment opportunity set and corporate financing, dividend, and compensation policies. J. Financ. Econ. 1992, 32, 263–292. [Google Scholar] [CrossRef]

| Linear Regression | Quantile Regression |
|---|---|
| Predicts the conditional mean E (y/x) | Predicts conditional quantiles Quantθ (y/x) |
| Applies when n is small | Needs sufficient data |
| Often assumes normality | Is distribution agnostic |
| Doesn’t preserve E (y/x) under transformation | Preserves Quantθ (y/x) under transformation |
| Is sensitive to outliers | Is robust to response outliers |
| Is computationally inexpensive | Is computationally intensive |
| Determinant | Description | Reference |
|---|---|---|
| Profitability | Profitability plays an essential role in making decisions on leverage. In trade-off theory, taxes, agency costs, and bankruptcy costs push more profitable firms toward a higher book leverage. First, this is due to a decline in the expected bankruptcy costs when profitability is high. Second, the deductibility of corporate interest payments makes more firms finance with debt. When firms are profitable in a trade-off theory framework, they prefer debt to the benefit of a tax shield. | PROF |
| Tangible assets | The nature of a firm’s assets impacts the capital structure. In case of bankruptcy, tangible assets are less subject to informational asymmetries because they have a more excellent value than intangible ones. Therefore, moral hazard risks are reduced when the firm offers tangible assets as collateral because this constitutes a positive signal to creditors. | TANG |
| Non-debt tax shields | Many firms tend to use tax shields even though interest is tax-deductible due to default risk. Some certain tax deductions are to be made from a company’s taxable income, allowed by tax laws. Depreciation on tangibles and intangibles is also tax-deductible. To determine the capital structure choice, the effective tax rate must be used as a determinant. | NDTS |
| Growth opportunity | The trade-off theory suggests that firms with investment opportunities have less leverage because they have more substantial incentives to avoid under-investment and asset substitution that can arise from stockholder-bondholder agency conflicts. Therefore, the trade-off theory predicts a negative relationship between leverage and investment opportunities. | GROWTH |
| Firm size | The trade-off theory suggests an inverse relationship between size and the probability of bankruptcy, i.e., a positive relationship between size and leverage. However, the capital structure’s pecking order theory predicts a negative relationship between size and leverage; that is, a larger firm exhibits an increasing preference for equity relative to debt. | SIZE |
| LEV | PROF | TANG | NDTS | GROWTH | SIZE | |
|---|---|---|---|---|---|---|
| Mean | 0.4880 | 0.0710 | 0.3616 | 0.2741 | 0.2924 | 17.0281 |
| Median. | 0.5020 | 0.0589 | 0.3539 | 0.1659 | 0.1435 | 16.9827 |
| Maximum | 2.5785 | 0.6674 | 0.9005 | 2.2438 | 11.9419 | 21.6010 |
| Minimum | 0.0075 | −3.8889 | 0.0000 | 0.0000 | −0.7867 | 12.0764 |
| Std. Dev. | 0.2172 | 0.1202 | 0.1813 | 0.3022 | 0.7835 | 1.5300 |
| Skewness | 0.4334 | −20.2723 | 0.2738 | 2.5784 | 8.5295 | 0.0195 |
| Kurtosis | 8.0981 | 670.3990 | 2.4667 | 12.1222 | 94.9804 | 3.0653 |
| Observations | 1768 | 1768 | 1768 | 1768 | 1768 | 1768 |
| Correlation (p-Value) | LEV | PROF | TANG | NDTS | GROWTH | SIZE |
|---|---|---|---|---|---|---|
| LEV | 1.0000 | |||||
| ----- | ||||||
| PROF | −0.4510 *** | 1.0000 | ||||
| (0.0000) | ----- | |||||
| TANG | 0.3264 *** | −0.1214 *** | 1.0000 | |||
| (0.0000) | (0.0000) | ----- | ||||
| NDTS | 0.0970 *** | −0.0909 *** | 0.6231 *** | 1.0000 | ||
| (0.0000) | (0.0001) | (0.0000) | ----- | |||
| GROWTH | −0.1006 *** | 0.0887 *** | −0.2012 *** | −0.1516 *** | 1.0000 | |
| (0.0000) | (0.0002) | (0.0000) | (0.0000) | ----- | ||
| SIZE | 0.5487 *** | −0.1572 *** | 0.4124 *** | 0.2965 *** | −0.1612 *** | 1.0000 |
| (0.0000) | (0.0000) | (0.0000) | (0.0000) | (0.0000) | ----- |
| Quantiles | <0.1 | 0.1–0.2 | 0.2–0.3 | 0.3–0.4 | 0.4–0.5 | 0.5–0.6 | 0.6–0.7 | 0.7–0.8 | 0.8–0.9 | >0.9 |
|---|---|---|---|---|---|---|---|---|---|---|
| Obs. | 177 | 177 | 177 | 177 | 176 | 177 | 177 | 177 | 177 | 176 |
| LEV | 0.1096 | 0.2393 | 0.3320 | 0.4086 | 0.4733 | 0.5343 | 0.5981 | 0.6568 | 0.7097 | 0.8202 |
| PROF | 0.1270 | 0.11857 | 0.1151 | 0.0841 | 0.0771 | 0.0609 | 0.0532 | 0.0388 | 0.0372 | −0.0022 |
| TANG | 0.2103 | 0.3048 | 0.3358 | 0.3450 | 0.3726 | 0.3822 | 0.3759 | 0.4056 | 0.4537 | 0.4307 |
| NDTS | 0.1711 | 0.2808 | 0.2294 | 0.2516 | 0.3449 | 0.3099 | 0.2917 | 0.2724 | 0.3253 | 0.2647 |
| GROWTH | 0.5668 | 0.2272 | 0.3799 | 0.2797 | 0.2261 | 0.2711 | 0.2209 | 0.2581 | 0.2180 | 0.2753 |
| SIZE | 15.2236 | 16.1143 | 16.3605 | 16.7748 | 16.9808 | 17.3021 | 17.4941 | 17.5861 | 18.0475 | 18.4047 |
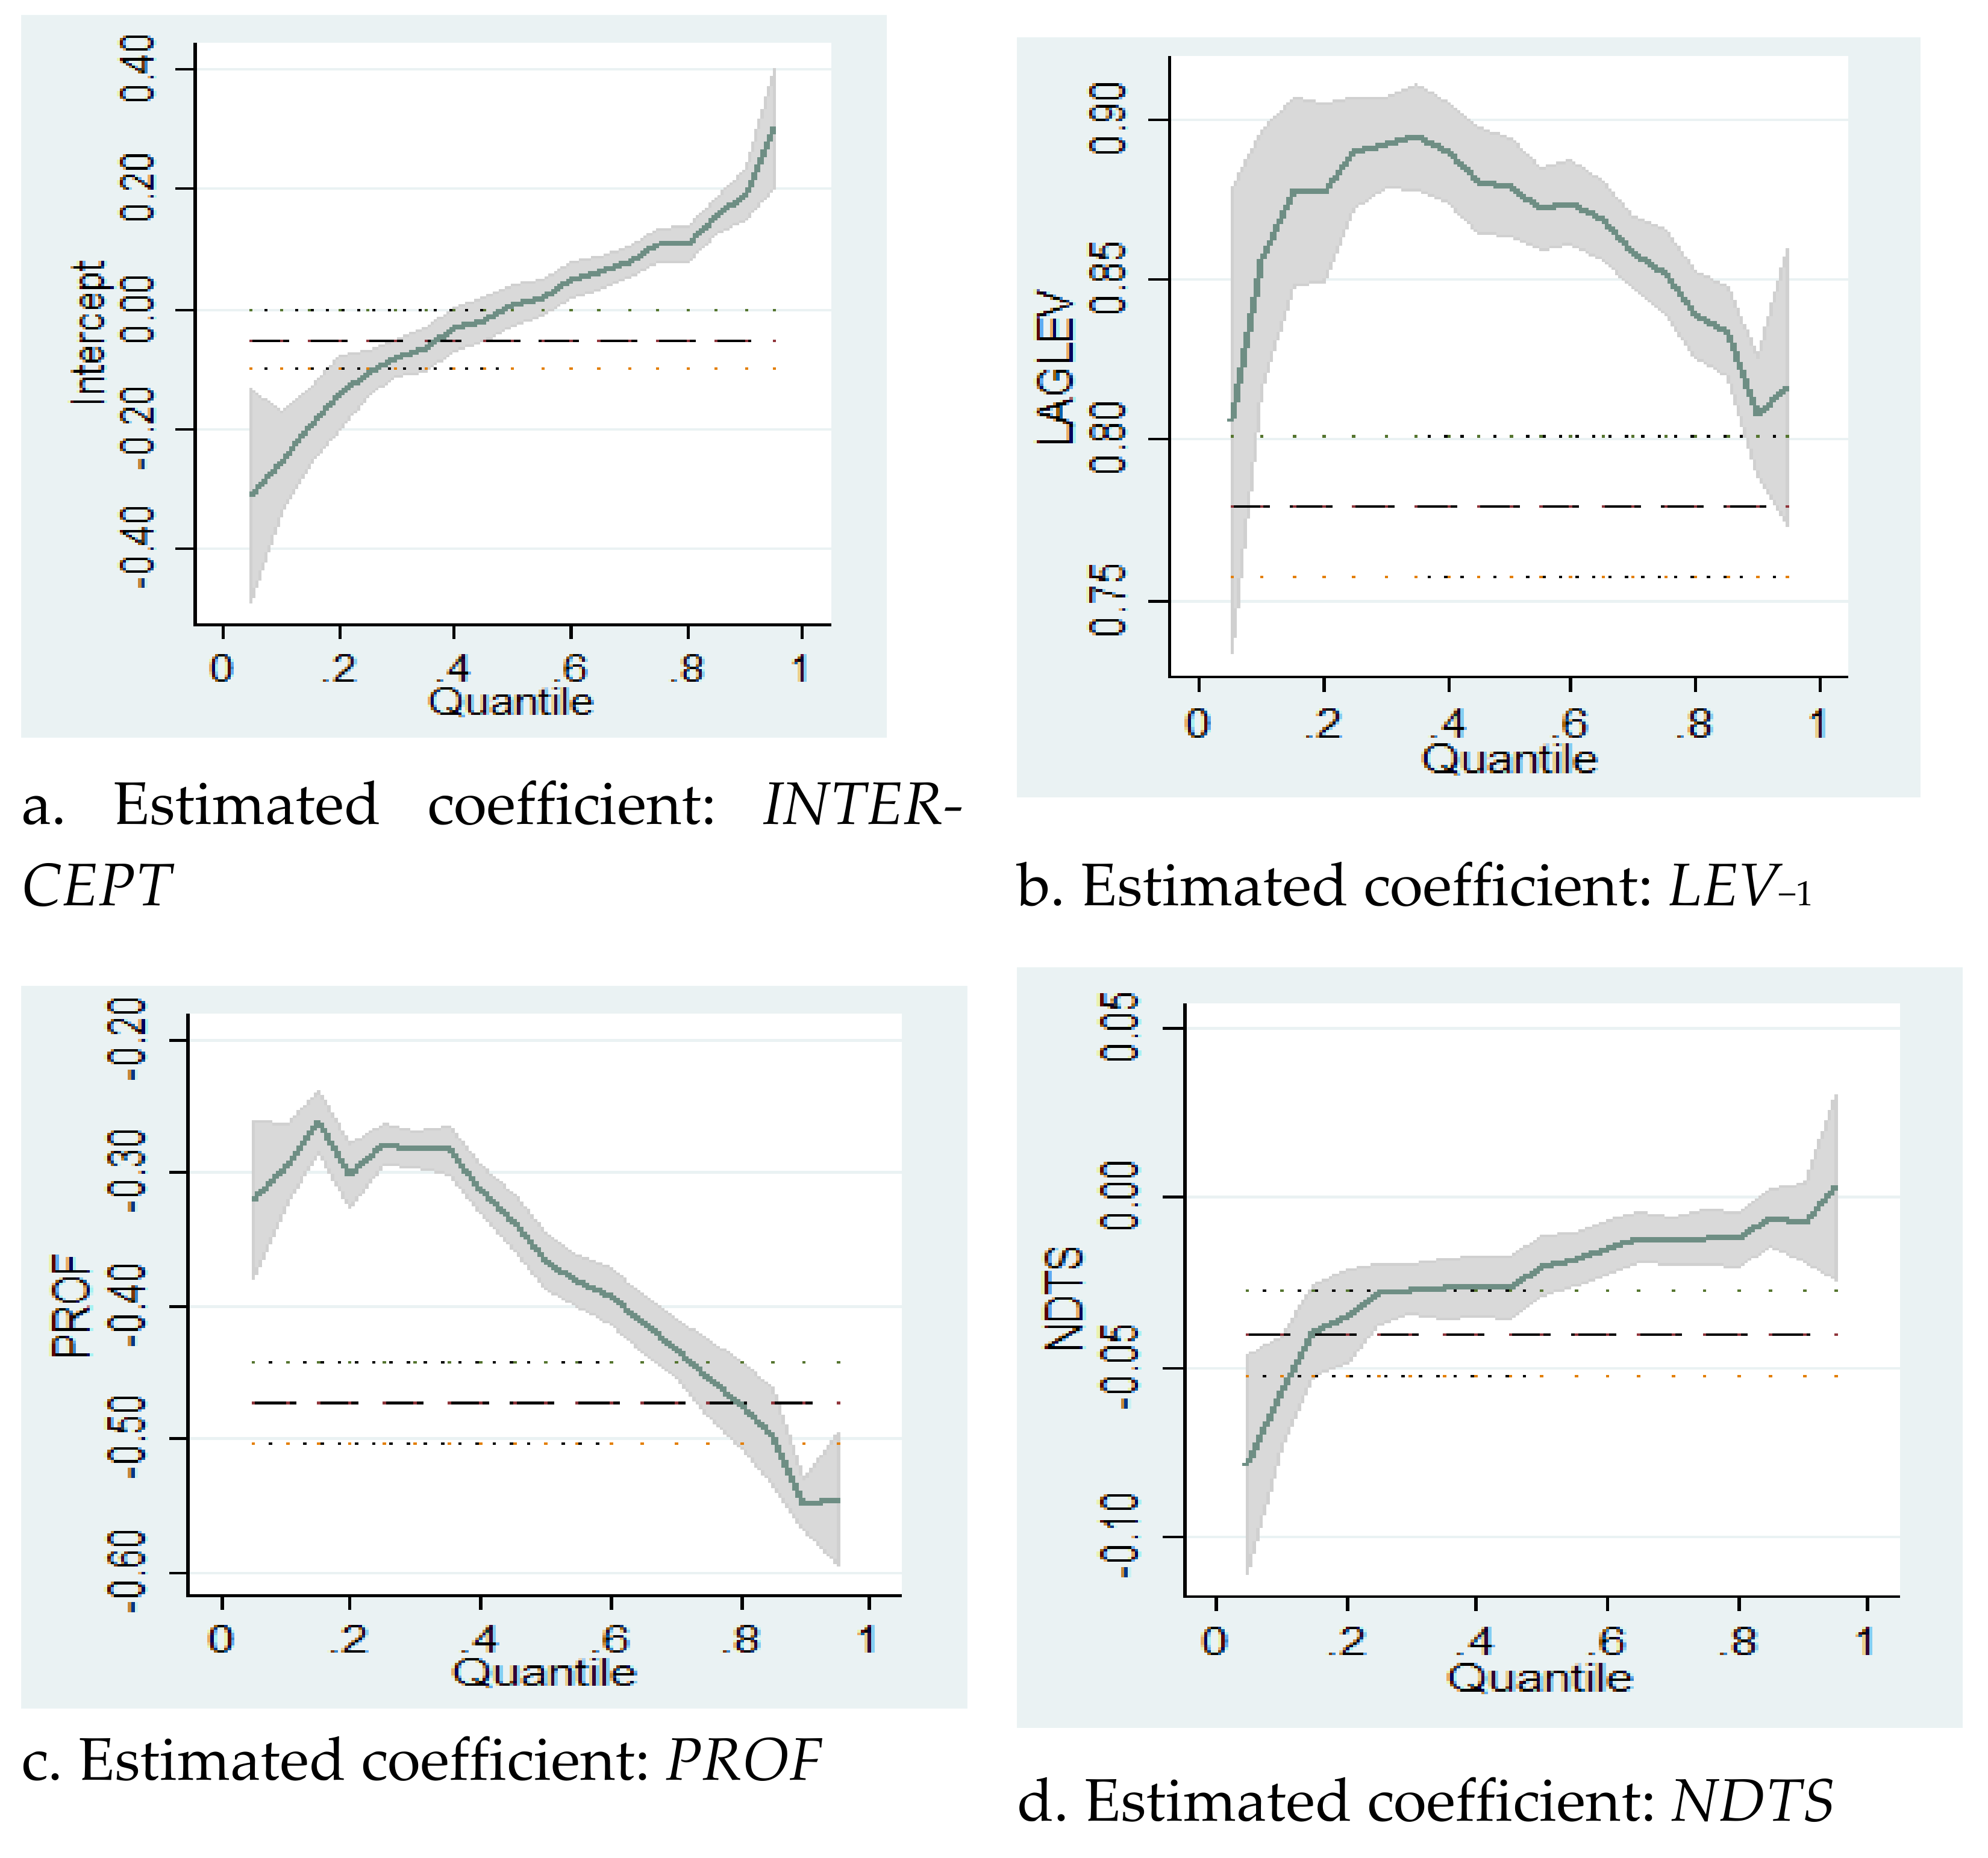
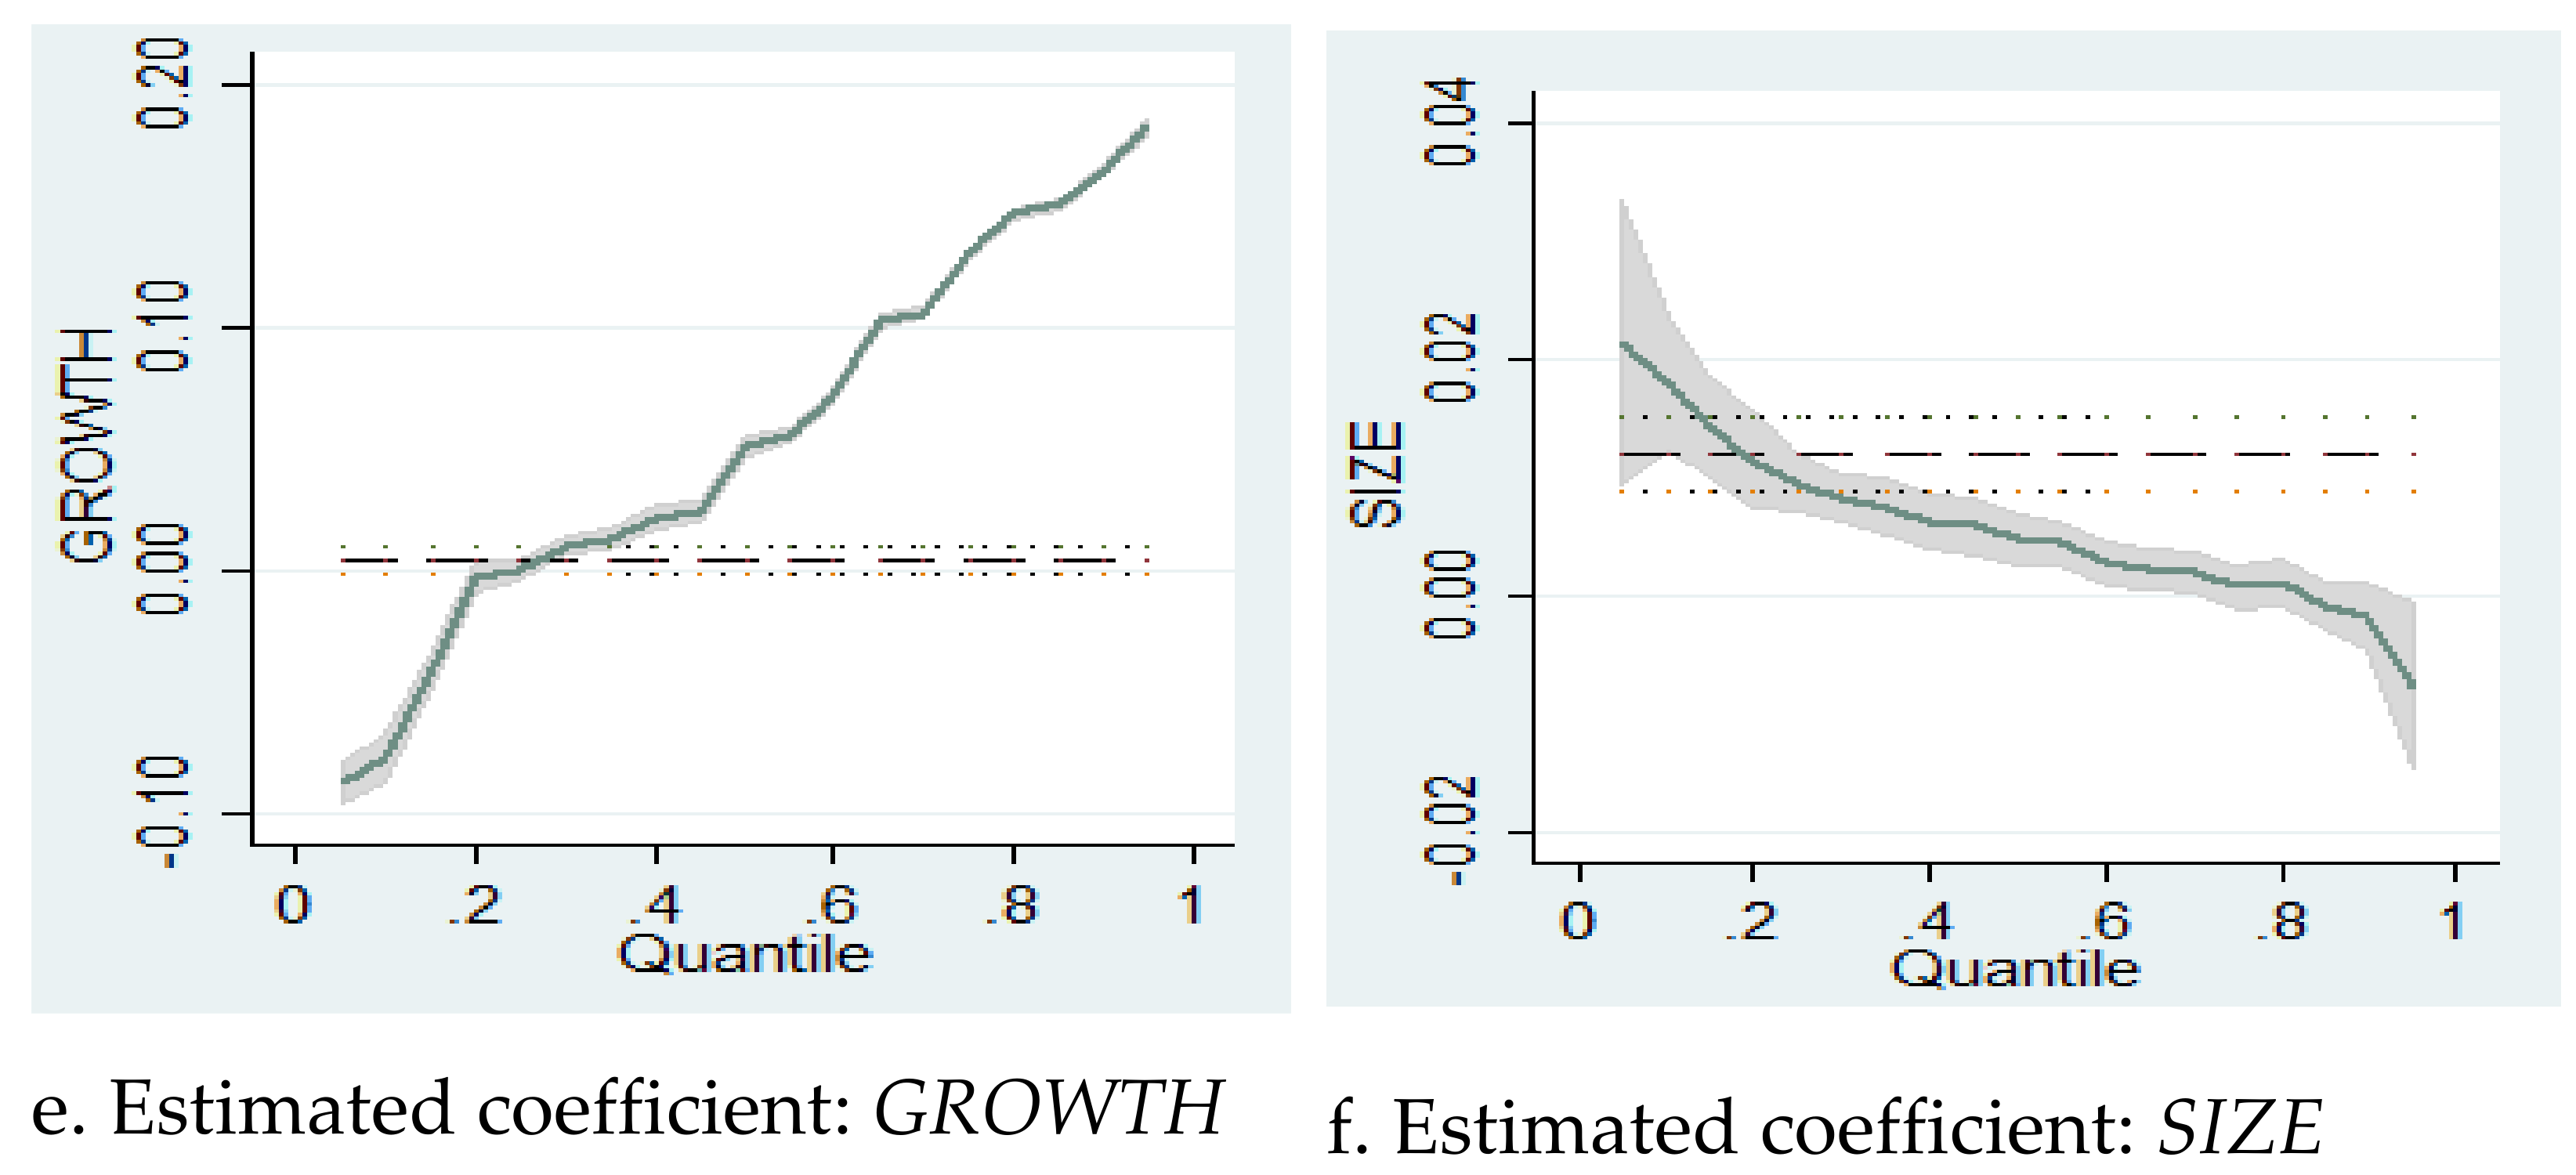
| Quantile | INTERCEPT | LEV(−1) | PROF | NDTS | GROWTH | SIZE | Statistic Tests of the Equality of Slope Estimates Across Various Quantiles | |
|---|---|---|---|---|---|---|---|---|
| Quantiles | F-Statistic (p-Value) | |||||||
| 0.1 | −0.2558 (0.0000) *** | 0.8562 (0.0000) *** | −0.2932 (0.0295) ** | −0.0571 (0.0000) *** | −0.0776 (0.0000) *** | 0.0180 (0.0000) *** | 0.1 versus 0.9 | 35.65 (0.0000) *** |
| 0.2 | −0.1396 (0.0000) *** | 0.8768 (0.0000) *** | −0.3017 (0.0000) *** | −0.0350 (0.0000) *** | −0.0022 (0.5090) | 0.0116 (0.0000) *** | 0.2 versus 0.8 | 26.81 (0.0000) *** |
| 0.3 | −0.0808 (0.0000) *** | 0.8922 (0.0000) *** | −0.2824 (0.0000) *** | −0.0272 (0.0000) *** | 0.0104 (0.0009) *** | 0.0082 (0.0000) *** | 0.3 versus 0.7 | 21.50 (0.0000) *** |
| 0.4 | −0.0331 (0.1429) | 0.8893 (0.0000) *** | −0.3122 (0.0000) *** | −0.0261 (0.0000) *** | 0.0222 (0.0062) *** | 0.0062 (0.0000) *** | 0.4 versus 0.6 | 7.62 (0.0000) *** |
| 0.5 | 0.0067 (0.7503) | 0.8785 (0.0000) *** | −0.3660 (0.0000) *** | −0.0202 (0.0005) *** | 0.0516 (0.0000) *** | 0.0048 (0.0003) *** | ||
| 0.6 | 0.0504 (0.0055) *** | 0.8739 (0.0000) *** | −0.3933 (0.0000) *** | −0.0149 (0.0247) ** | 0.0719 (0.1287) | 0.0028 (0.0243) ** | ||
| 0.7 | 0.0788 (0.0001) *** | 0.8587 (0.0000) *** | −0.4325 (0.0000) *** | −0.0129 (0.0101) ** | 0.1063 (0.0057) *** | 0.0020 (0.0724) * | ||
| 0.8 | 0.1096 (0.0000) *** | 0.8390 (0.0000) *** | −0.4745 (0.0000) *** | −0.0121 (0.0014) *** | 0.1464 (0.0000) *** | 0.0012 (0.2698) | ||
| 0.9 | 0.1928 (0.0000) *** | 0.8076 (0.0000) *** | −0.5492 (0.0000) *** | −0.0072 (0.0000) *** | 0.1645 (0.0000) *** | −0.0018 (0.0998) * | ||
| OLS | −0.0512 (0.0379) ** | 0.7794 (0.0000) *** | −0.4730 (0.0000) *** | −0.0402 (0.0000) *** | 0.0048 (0.0919) * | 0.0121 (0.0000) *** | ||
Publisher’s Note: MDPI stays neutral with regard to jurisdictional claims in published maps and institutional affiliations. |
© 2022 by the authors. Licensee MDPI, Basel, Switzerland. This article is an open access article distributed under the terms and conditions of the Creative Commons Attribution (CC BY) license (https://creativecommons.org/licenses/by/4.0/).
Share and Cite
Zhao, L.; Liu, Z.; Vuong, T.H.G.; Nguyen, H.M.; Radu, F.; Tăbîrcă, A.I.; Wu, Y.-C. Determinants of Financial Sustainability in Chinese Firms: A Quantile Regression Approach. Sustainability 2022, 14, 1555. https://doi.org/10.3390/su14031555
Zhao L, Liu Z, Vuong THG, Nguyen HM, Radu F, Tăbîrcă AI, Wu Y-C. Determinants of Financial Sustainability in Chinese Firms: A Quantile Regression Approach. Sustainability. 2022; 14(3):1555. https://doi.org/10.3390/su14031555
Chicago/Turabian StyleZhao, Li, Zhengqiao Liu, Thi Huong Giang Vuong, Huu Manh Nguyen, Florin Radu, Alina Iuliana Tăbîrcă, and Yang-Che Wu. 2022. "Determinants of Financial Sustainability in Chinese Firms: A Quantile Regression Approach" Sustainability 14, no. 3: 1555. https://doi.org/10.3390/su14031555
APA StyleZhao, L., Liu, Z., Vuong, T. H. G., Nguyen, H. M., Radu, F., Tăbîrcă, A. I., & Wu, Y.-C. (2022). Determinants of Financial Sustainability in Chinese Firms: A Quantile Regression Approach. Sustainability, 14(3), 1555. https://doi.org/10.3390/su14031555