
How the Carbonization Time of Sugarcane Biomass Affects the Microstructure of Biochar and the Adsorption Process?

 ,
, 

Abstract
:1. Introduction
2. Materials and Methods
2.1. Synthesis and Characterization of the Adsorbents
2.2. Adsorption Studies of MB Removal onto SCB and BCs
3. Results and Discussion
3.1. FTIR Spectroscopy
3.2. Topography Study and Surface Area of SCB and BCs
3.3. Adsorption Study
3.3.1. Effect of BC5 Dosages
3.3.2. pHPZC and Effect of the Solution pH on the MB Adsorption
3.3.3. Effect of Contact Time and Kinetic Models
3.3.4. Adsorption Mechanism
4. Conclusions
Supplementary Materials
 ) and DTG (
  ) of SCB in an inert atmosphere (N2), with a heating rate of 10 °C min−1, and flux of 20 mL min−1. Figure S3: MB adsorption: effect of adsorbent dosage for BC5. Figure S4: Effect of MB initial concentration in the adsorption: (a) maximum adsorption capacity and (b) removal efficiency. SCB (
  ), BC1 (
  ), BC2 (
  ), BC3 (
  ), BC4 (
  ), and BC5 (
  ); at 25 °C; Table S1: Function groups on the SCB and BC’s surfaces. Table S2: The surface area of the six types of adsorbents used in the study. Table S3: Initial and final pH of the test of pH effect on the MB adsorption. Table S4: Solution concentration before and after filtration and agitation.
 Author Contributions
Funding
Institutional Review Board Statement
Informed Consent Statement
Data Availability Statement
Acknowledgments
Conflicts of Interest
References
- Wang, Z.; Gao, M.; Li, X.; Ning, J.; Zhou, Z.; Li, G. Efficient adsorption of methylene blue from aqueous solution by graphene oxide modified persimmon tannins. Mater. Sci. Eng. C 2020, 108, 110196. [Google Scholar] [CrossRef] [PubMed]
- Yin, Z.; Liu, N.; Bian, S.; Li, J.; Xu, S.; Zhang, Y. Enhancing the adsorption capability of areca leaf biochar for methylene blue by K2FeO4-catalyzed oxidative pyrolysis at low temperature. RSC Adv. 2019, 9, 42343–42350. [Google Scholar] [CrossRef] [Green Version]
- Liu, Y.; Jia, J.; Gao, T.; Wang, X.; Yu, J.; Wu, D.; Li, F. Rapid, Selective Adsorption of Methylene Blue from Aqueous Solution by Durable Nanofibrous Membranes. J. Chem. Eng. Data 2020, 65, 3998–4008. [Google Scholar] [CrossRef]
- Lei, H.; Hao, Z.; Chen, K.; Chen, Y.; Zhang, J.; Hu, Z.; Song, Y.; Rao, P.; Huang, Q. Insight into Adsorption Performance and Mechanism on Efficient Removal of Methylene Blue by Accordion-like V2CTx MXene. J. Phys. Chem. Lett. 2020, 11, 4253–4260. [Google Scholar] [CrossRef]
- Sahu, S.; Pahi, S.; Tripathy, S.; Singh, S.K.; Behera, A.; Sahu, U.K.; Patel, R.K. Adsorption of methylene blue on chemically modified lychee seed biochar: Dynamic, equilibrium, and thermodynamic study. J. Mol. Liq. 2020, 315, 113743. [Google Scholar] [CrossRef]
- Li, Y.; Wang, S.; Shen, Z.; Li, X.; Zhou, Q.; Sun, Y.; Wang, T.; Liu, Y.; Gao, Q. Gradient Adsorption of Methylene Blue and Crystal Violet onto Compound Microporous Silica from Aqueous Medium. ACS Omega 2020, 5, 28382–28392. [Google Scholar] [CrossRef]
- Shen, Y.; Ni, W.-X.; Li, B. Porous Organic Polymer Synthesized by Green Diazo-Coupling Reaction for Adsorptive Removal of Methylene Blue. ACS Omega 2021, 6, 3202–3208. [Google Scholar] [CrossRef]
- Mohanty, A.K.; Vivekanandhan, S.; Pin, J.M.; Misra, M. Composites from renewable and sustainable resources: Challenges and innovations. Science 2018, 362, 536–542. [Google Scholar] [CrossRef] [Green Version]
- Mandal, A.; Singh, N.; Purakayastha, T.J. Characterization of pesticide sorption behaviour of slow pyrolysis biochars as low cost adsorbent for atrazine and imidacloprid removal. Sci. Total Environ. 2017, 577, 376–385. [Google Scholar] [CrossRef]
- Selvarajoo, A.; Oochit, D. Effect of pyrolysis temperature on product yields of palm fibre and its biochar characteristics. Mater. Sci. Energy Technol. 2020, 3, 575–583. [Google Scholar] [CrossRef]
- Hass, A.; Lima, I.M. Effect of feed source and pyrolysis conditions on properties and metal sorption by sugarcane biochar. Environ. Technol. Innov. 2018, 10, 16–26. [Google Scholar] [CrossRef]
- Brito, M.J.P.; Veloso, C.M.; Santos, L.S.; Bonomo, R.C.F.; Fontan, R.D.C.I. Adsorption of the textile dye Dianix® royal blue CC onto carbons obtained from yellow mombin fruit stones and activated with KOH and H3PO4: Kinetics, adsorption equilibrium and thermodynamic studies. Powder Technol. 2018, 339, 334–343. [Google Scholar] [CrossRef]
- Açikyildiz, M.; Gürses, A.; Karaca, S. Preparation and characterization of activated carbon from plant wastes with chemical activation. Microporous Mesoporous Mater. 2014, 198, 45–49. [Google Scholar] [CrossRef]
- Titiladunayo, I.F.; McDonald, A.G.; Fapetu, O.P. Effect of temperature on biochar product yield from selected lignocellulosic biomass in a pyrolysis process. Waste Biomass Valorization 2012, 3, 311–318. [Google Scholar] [CrossRef]
- López, J.E.; Builes, S.; Salgado, M.A.H.; Tarelho, L.A.C.; Arroyave, C.; Aristizábal, A.; Chavez, E. Adsorption of Cadmium Using Biochars Produced from Agro-Residues. J. Phys. Chem. C 2020, 124, 14592–14602. [Google Scholar] [CrossRef]
- Tayibi, S.; Monlau, F.; Fayoud, N.E.; Abdeljaoued, E.; Hannache, H.; Zeroual, Y.; Oukarroum, A.; Barakat, A. Production and Dry Mechanochemical Activation of Biochars Derived from Moroccan Red Macroalgae Residue and Olive Pomace Biomass for Treating Wastewater: Thermodynamic, Isotherm, and Kinetic Studies. ACS Omega 2021, 6, 159–171. [Google Scholar] [CrossRef]
- Chen, S.; Rotaru, A.E.; Shrestha, P.M.; Malvankar, N.S.; Liu, F.; Fan, W.; Nevin, K.P.; Lovley, D.R. Promoting interspecies electron transfer with biochar. Sci. Rep. 2014, 4, 5019. [Google Scholar] [CrossRef] [Green Version]
- Güzel, F.; Sayğılı, H.; Sayğılı, G.A.; Koyuncu, F.; Yılmaz, C. Optimal oxidation with nitric acid of biochar derived from pyrolysis of weeds and its application in removal of hazardous dye methylene blue from aqueous solution. J. Clean. Prod. 2017, 144, 260–265. [Google Scholar] [CrossRef]
- Shang, J.G.; Kong, X.R.; He, L.L.; Li, W.H.; Liao, Q.J.H. Low-cost biochar derived from herbal residue: Characterization and application for ciprofloxacin adsorption. Int. J. Environ. Sci. Technol. 2016, 13, 2449–2458. [Google Scholar] [CrossRef] [Green Version]
- Ravve, A. Principles of Polymer Chemistry, 3rd ed.; Springer Science & Business Media: New York, NY, USA, 2013; ISBN 978-1-4614-2211-2. [Google Scholar]
- Wu, J.; Yang, J.; Huang, G.; Xu, C.; Lin, B. Hydrothermal carbonization synthesis of cassava slag biochar with excellent adsorption performance for Rhodamine B. J. Clean. Prod. 2020, 251, 119717. [Google Scholar] [CrossRef]
- Igalavithana, A.D.; Choi, S.W.; Dissanayake, P.D.; Shang, J.; Wang, C.H.; Yang, X.; Kim, S.; Tsang, D.C.W.; Lee, K.B.; Ok, Y.S. Gasification biochar from biowaste (food waste and wood waste) for effective CO2 adsorption. J. Hazard. Mater. 2020, 391, 121147. [Google Scholar] [CrossRef] [PubMed]
- Oginni, O.; Singh, K. Influence of high carbonization temperatures on microstructural and physicochemical characteristics of herbaceous biomass derived biochars. J. Environ. Chem. Eng. 2020, 8, 104169. [Google Scholar] [CrossRef]
- Ganguly, P.; Sarkhel, R.; Das, P. Synthesis of pyrolyzed biochar and its application for dye removal: Batch, kinetic and isotherm with linear and non-linear mathematical analysis. Surf. Interfaces 2020, 20, 100616. [Google Scholar] [CrossRef]
- Al-Ghouti, M.A.; Al-Absi, R.S. Mechanistic understanding of the adsorption and thermodynamic aspects of cationic methylene blue dye onto cellulosic olive stones biomass from wastewater. Sci. Rep. 2020, 10, 15928. [Google Scholar] [CrossRef] [PubMed]
- Bouhadjra, K.; Lemlikchi, W.; Ferhati, A.; Mignard, S. Enhancing removal efficiency of anionic dye (Cibacron blue) using waste potato peels powder. Sci. Rep. 2021, 11, 2090. [Google Scholar] [CrossRef] [PubMed]
- El-Naggar, N.E.A.; Rabei, N.H. Bioprocessing optimization for efficient simultaneous removal of methylene blue and nickel by Gracilaria seaweed biomass. Sci. Rep. 2020, 10, 17439. [Google Scholar] [CrossRef]
- Uddin, M.K.; Nasar, A. Walnut shell powder as a low-cost adsorbent for methylene blue dye: Isotherm, kinetics, thermodynamic, desorption and response surface methodology examinations. Sci. Rep. 2020, 10, 7983. [Google Scholar] [CrossRef]
- Janković, B.; Manić, N.; Dodevski, V.; Radović, I.; Pijović, M.; Katnić, Đ.; Tasić, G. Physico-chemical characterization of carbonized apricot kernel shell as precursor for activated carbon preparation in clean technology utilization. J. Clean. Prod. 2019, 236, 117614. [Google Scholar] [CrossRef]
- Tong, Y.; McNamara, P.J.; Mayer, B.K. Adsorption of organic micropollutants onto biochar: A review of relevant kinetics, mechanisms and equilibrium. Environ. Sci. Water Res. Technol. 2019, 5, 821–838. [Google Scholar] [CrossRef]
- Chen, W.H.; Lu, K.M.; Lee, W.J.; Liu, S.H.; Lin, T.C. Non-oxidative and oxidative torrefaction characterization and SEM observations of fibrous and ligneous biomass. Appl. Energy 2014, 114, 104–113. [Google Scholar] [CrossRef]
- Li, W.; Yang, K.; Peng, J.; Zhang, L.; Guo, S.; Xia, H. Effects of carbonization temperatures on characteristics of porosity in coconut shell chars and activated carbons derived from carbonized coconut shell chars. Ind. Crops Prod. 2008, 28, 190–198. [Google Scholar] [CrossRef]
- Yaashikaa, P.R.; Kumar, P.S.; Varjani, S.J.; Saravanan, A. Advances in production and application of biochar from lignocellulosic feedstocks for remediation of environmental pollutants. Bioresour. Technol. 2019, 292, 122030. [Google Scholar] [CrossRef] [PubMed]
- Biswas, S.; Mohapatra, S.S.; Kumari, U.; Meikap, B.C.; Sen, T.K. Batch and continuous closed circuit semi-fluidized bed operation: Removal of MB dye using sugarcane bagasse biochar and alginate composite adsorbents. J. Environ. Chem. Eng. 2020, 8, 103637. [Google Scholar] [CrossRef]
- Patawat, C.; Silakate, K.; Chuan-Udom, S.; Supanchaiyamat, N.; Hunt, A.J.; Ngernyen, Y. Preparation of activated carbon fromDipterocarpus alatusfruit and its application for methylene blue adsorption. RSC Adv. 2020, 10, 21082–21091. [Google Scholar] [CrossRef]
- Li, X.Y.; Han, D.; Xie, J.F.; Wang, Z.B.; Gong, Z.Q.; Li, B. Hierarchical porous activated biochar derived from marine macroalgae wastes (Enteromorpha prolifera): Facile synthesis and its application on Methylene Blue removal. RSC Adv. 2018, 8, 29237–29247. [Google Scholar] [CrossRef] [Green Version]
- Wang, P.; Wu, C.; Guo, Y.; Wang, C. Experimental and theoretical studies on methylene blue and methyl orange sorption by wheat straw-derived biochar with a large surface area. Phys. Chem. Chem. Phys. 2016, 18, 30196–30203. [Google Scholar] [CrossRef]
- Lyu, H.; Gao, B.; He, F.; Zimmerman, A.R.; Ding, C.; Tang, J.; Crittenden, J.C. Experimental and modeling investigations of ball-milled biochar for the removal of aqueous methylene blue. Chem. Eng. J. 2018, 335, 110–119. [Google Scholar] [CrossRef]
- Xu, X.; Cao, X.; Zhao, L.; Zhou, H.; Luo, Q. Interaction of organic and inorganic fractions of biochar with Pb(ii) ion: Further elucidation of mechanisms for Pb(ii) removal by biochar. RSC Adv. 2014, 4, 44930–44937. [Google Scholar] [CrossRef]
- Zhu, Y.; Yi, B.; Yuan, Q.; Wu, Y.; Wang, M.; Yan, S. Removal of methylene blue from aqueous solution by cattle manure-derived low temperature biochar. RSC Adv. 2018, 8, 19917–19929. [Google Scholar] [CrossRef] [Green Version]
- Wang, Y.; Zhou, Y.; Jiang, G.; Chen, P.; Chen, Z. One-step fabrication of carbonaceous adsorbent from corncob for enhancing adsorption capability of methylene blue removal. Sci. Rep. 2020, 10, 12515. [Google Scholar] [CrossRef]
- Liu, C.; Wang, W.; Wu, R.; Liu, Y.; Lin, X.; Kan, H.; Zheng, Y. Preparation of Acid- And Alkali-Modified Biochar for Removal of Methylene Blue Pigment. ACS Omega 2020, 5, 30906–30922. [Google Scholar] [CrossRef] [PubMed]
- Wang, Y.; Zhang, Y.; Li, S.; Zhong, W.; Wei, W. Enhanced methylene blue adsorption onto activated reed-derived biochar by tannic acid. J. Mol. Liq. 2018, 268, 658–666. [Google Scholar] [CrossRef]
- Lagergren, S. Zur theorie der sogenannten adsorption geloster stoffe. K. Sven. Vetensk. Handl. 1898, 24, 1–39. [Google Scholar]
- Blanchard, G.; Maunaye, M.; Martin, G. Removal of heavy metals from waters by means of natural zeolites. Water Res. 1984, 18, 1501–1507. [Google Scholar] [CrossRef]
- Aharoni, C.; Tompkins, F.C. Kinetics of Adsorption and Desorption and the Elovich Equation. Adv. Catal. 1970, 21, 1–49. [Google Scholar] [CrossRef]
- McLintock, I.S. The elovich equation in chemisorption kinetics. Nature 1967, 216, 1204–1205. [Google Scholar] [CrossRef]
- Fan, S.; Tang, J.; Wang, Y.; Li, H.; Zhang, H.; Tang, J.; Wang, Z.; Li, X. Biochar prepared from co-pyrolysis of municipal sewage sludge and tea waste for the adsorption of methylene blue from aqueous solutions: Kinetics, isotherm, thermodynamic and mechanism. J. Mol. Liq. 2016, 220, 432–441. [Google Scholar] [CrossRef]
- Chen, S.; Qin, C.; Wang, T.; Chen, F.; Li, X.; Hou, H.; Zhou, M. Study on the adsorption of dyestuffs with different properties by sludge-rice husk biochar: Adsorption capacity, isotherm, kinetic, thermodynamics and mechanism. J. Mol. Liq. 2019, 285, 62–74. [Google Scholar] [CrossRef]
- Mosoarca, G.; Vancea, C.; Popa, S.; Gheju, M.; Boran, S. Syringa vulgaris leaves powder a novel low-cost adsorbent for methylene blue removal: Isotherms, kinetics, thermodynamic and optimization by Taguchi method. Sci. Rep. 2020, 10, 17676. [Google Scholar] [CrossRef]
- Sharma, P.; Kaur, H. Sugarcane bagasse for the removal of erythrosin B and methylene blue from aqueous waste. Appl. Water Sci. 2011, 1, 135–145. [Google Scholar] [CrossRef] [Green Version]
- Mohammad, N.; Atassi, Y. Adsorption of methylene blue onto electrospun nanofibrous membranes of polylactic acid and polyacrylonitrile coated with chloride doped polyaniline. Sci. Rep. 2020, 10, 13412. [Google Scholar] [CrossRef] [PubMed]
- Albroomi, H.I.; Elsayed, M.A.; Baraka, A.; Abdelmaged, M.A. Batch and fixed-bed adsorption of tartrazine azo-dye onto activated carbon prepared from apricot stones. Appl. Water Sci. 2017, 7, 2063–2074. [Google Scholar] [CrossRef] [Green Version]
 ), BC1 (
  ), BC2 (
  ), BC3 (
  ), BC4 (
  ), and BC5 (
  ). The intense band of C-O and O-H (1100–1300 cm−1) in the BC1 spectra decreases with increasing the carbonization time, evidencing the degradation of cellulose, hemicellulose, and lignin.
), BC1 ( ), BC2 ( ), BC3 ( ), BC4 ( ), and BC5 ( ). The intense band of C-O and O-H (1100–1300 cm−1) in the BC1 spectra decreases with increasing the carbonization time, evidencing the degradation of cellulose, hemicellulose, and lignin.
). The intense band of C-O and O-H (1100–1300 cm−1) in the BC1 spectra decreases with increasing the carbonization time, evidencing the degradation of cellulose, hemicellulose, and lignin.
), BC1 ( ), BC2 ( ), BC3 ( ), BC4 ( ), and BC5 ( ). The intense band of C-O and O-H (1100–1300 cm−1) in the BC1 spectra decreases with increasing the carbonization time, evidencing the degradation of cellulose, hemicellulose, and lignin.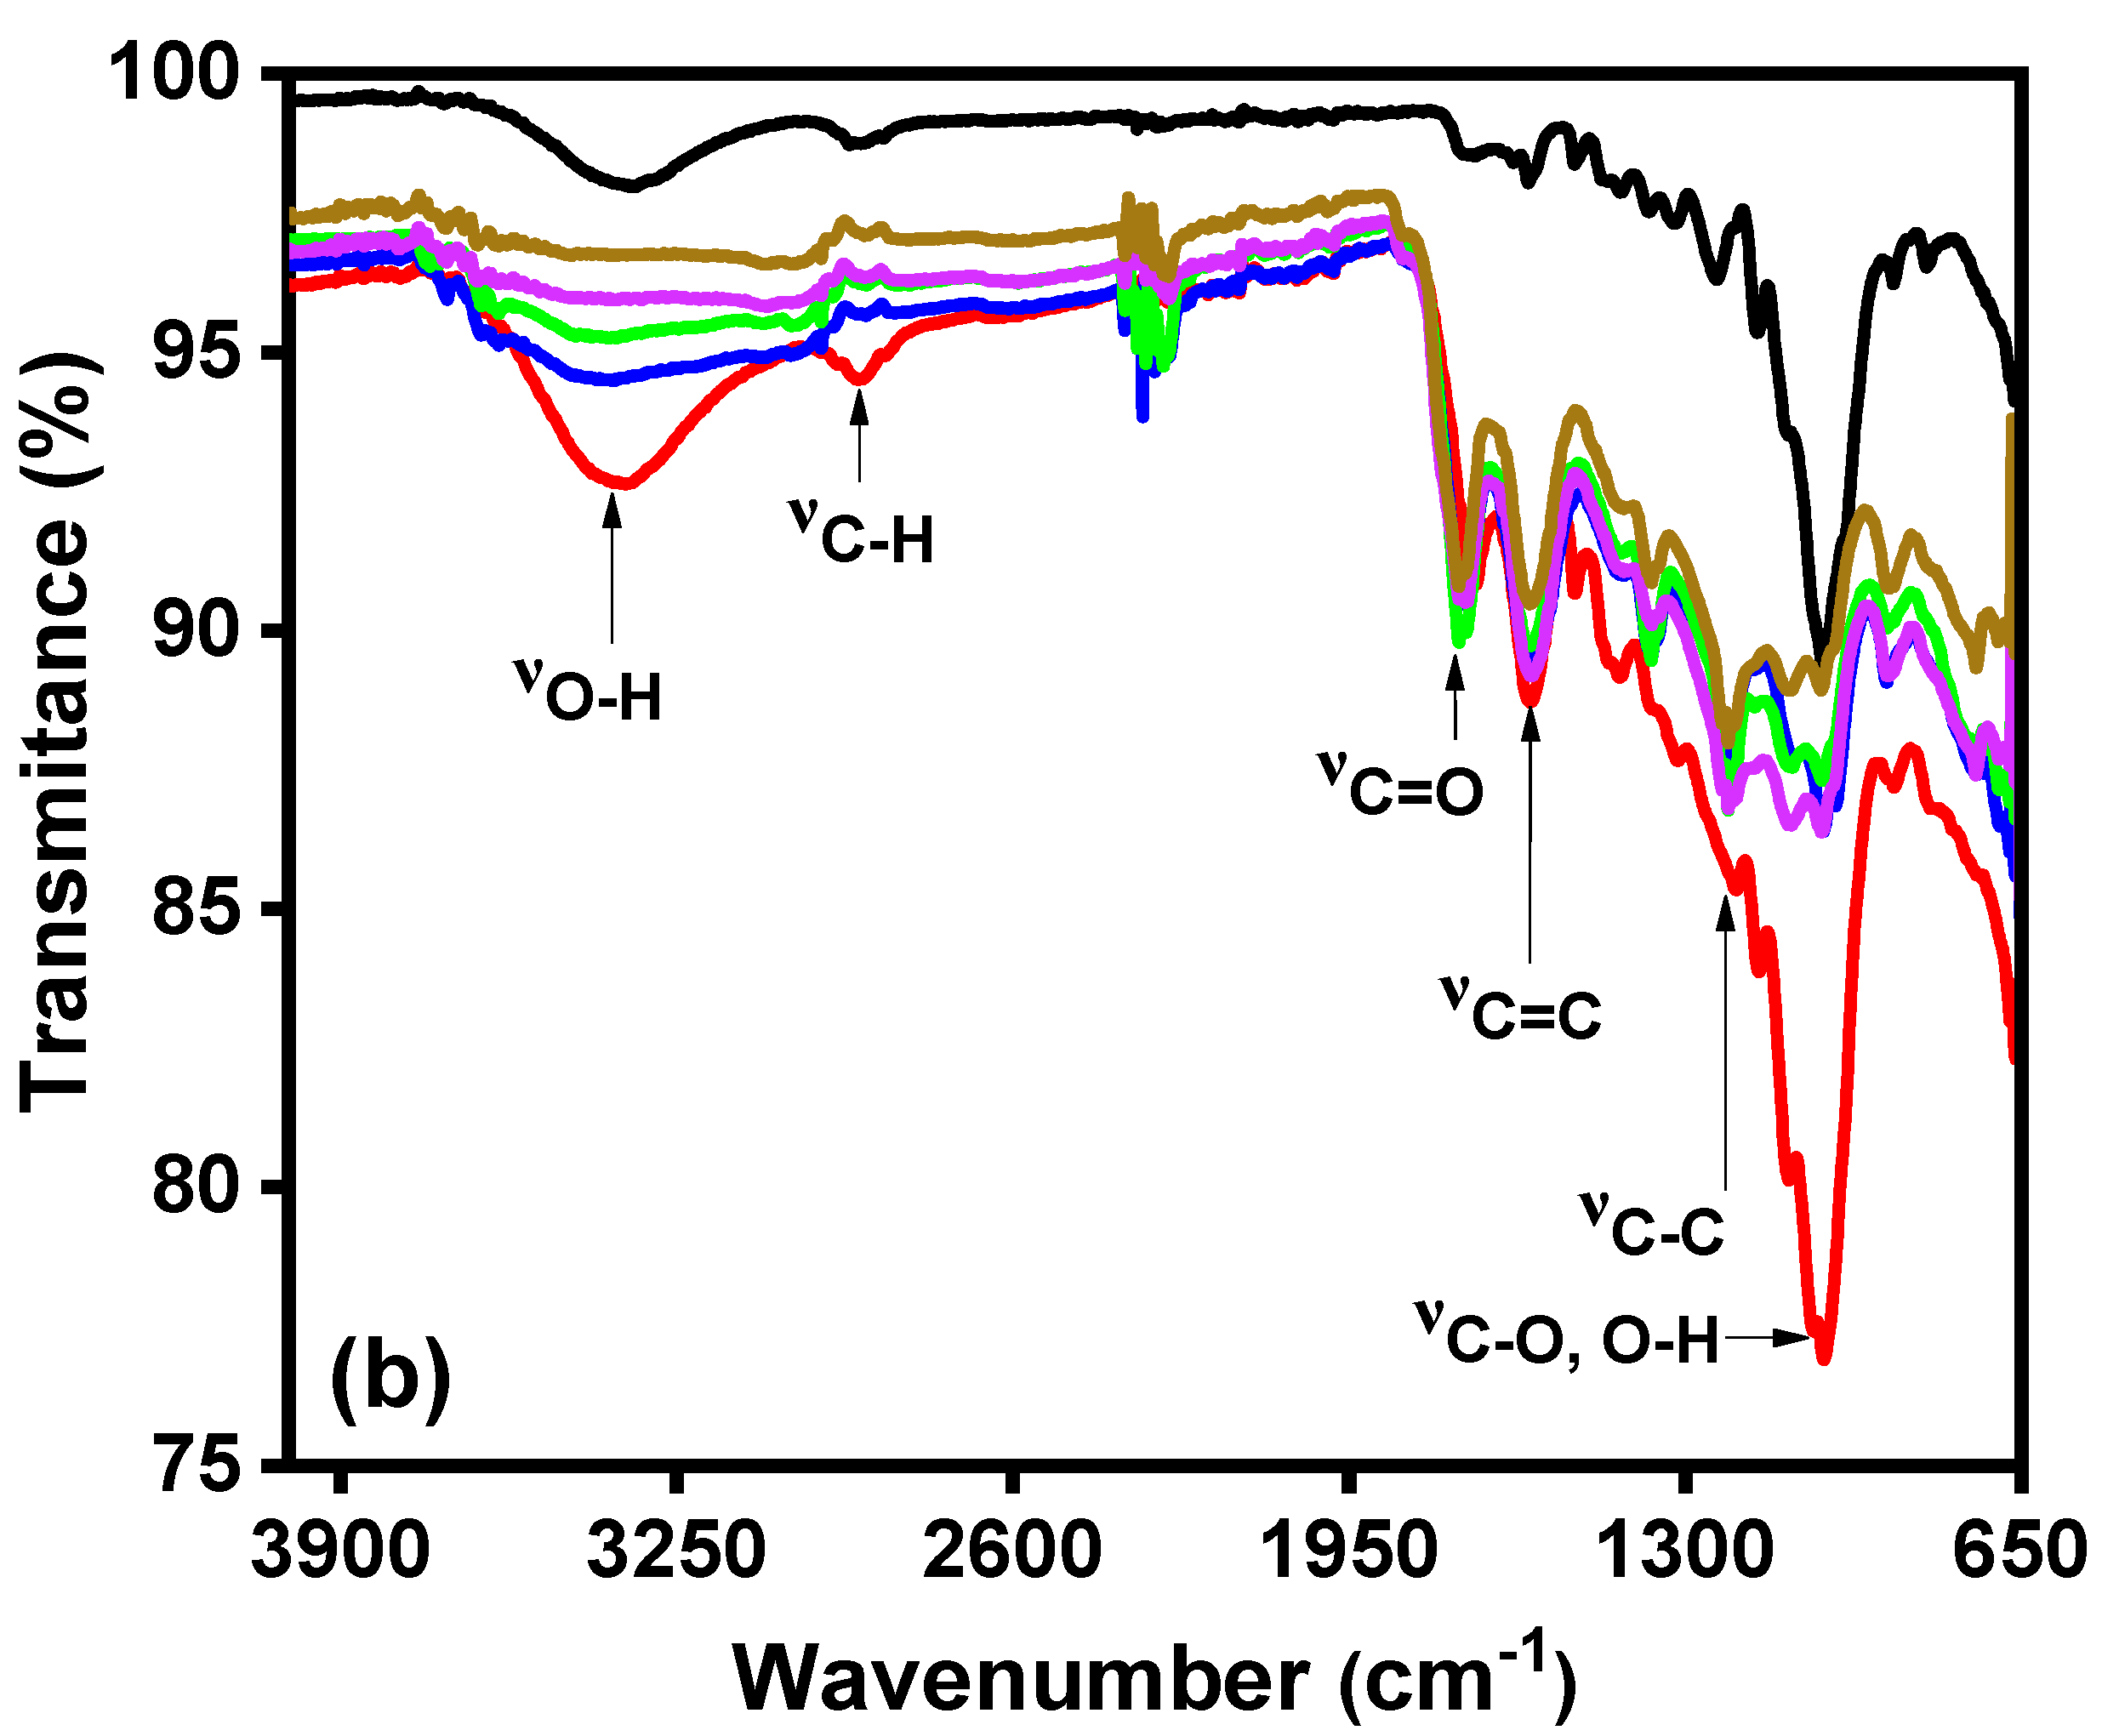

 ), BC1 (
  ), BC2 (
  ), BC3 (
  ), BC4 (
  ), and BC5 (
  ). (b) effect of the solution pH in the MB adsorption onto SCB and BCs: SCB (
  ), BC1 (
  ), BC2 (
  ), BC3 (
  ), BC4 (
  ), and BC5 (
  ).
), BC1 ( ), BC2 ( ), BC3 ( ), BC4 ( ), and BC5 ( ). (b) effect of the solution pH in the MB adsorption onto SCB and BCs: SCB ( ), BC1 ( ), BC2 ( ), BC3 ( ), BC4 ( ), and BC5 ( ).
).
), BC1 ( ), BC2 ( ), BC3 ( ), BC4 ( ), and BC5 ( ). (b) effect of the solution pH in the MB adsorption onto SCB and BCs: SCB ( ), BC1 ( ), BC2 ( ), BC3 ( ), BC4 ( ), and BC5 ( ).
 ), BC1 (
  ), BC2 (
  ), BC3 (
  ), BC4 (
  ), and BC5 (
  ).
), BC1 ( ), BC2 ( ), BC3 ( ), BC4 ( ), and BC5 ( ).
).
), BC1 ( ), BC2 ( ), BC3 ( ), BC4 ( ), and BC5 ( ).

 ), 35 °C (
  ), and 45 °C (
  ).
), 35 °C ( ), and 45 °C ( ).
).
), 35 °C ( ), and 45 °C ( ).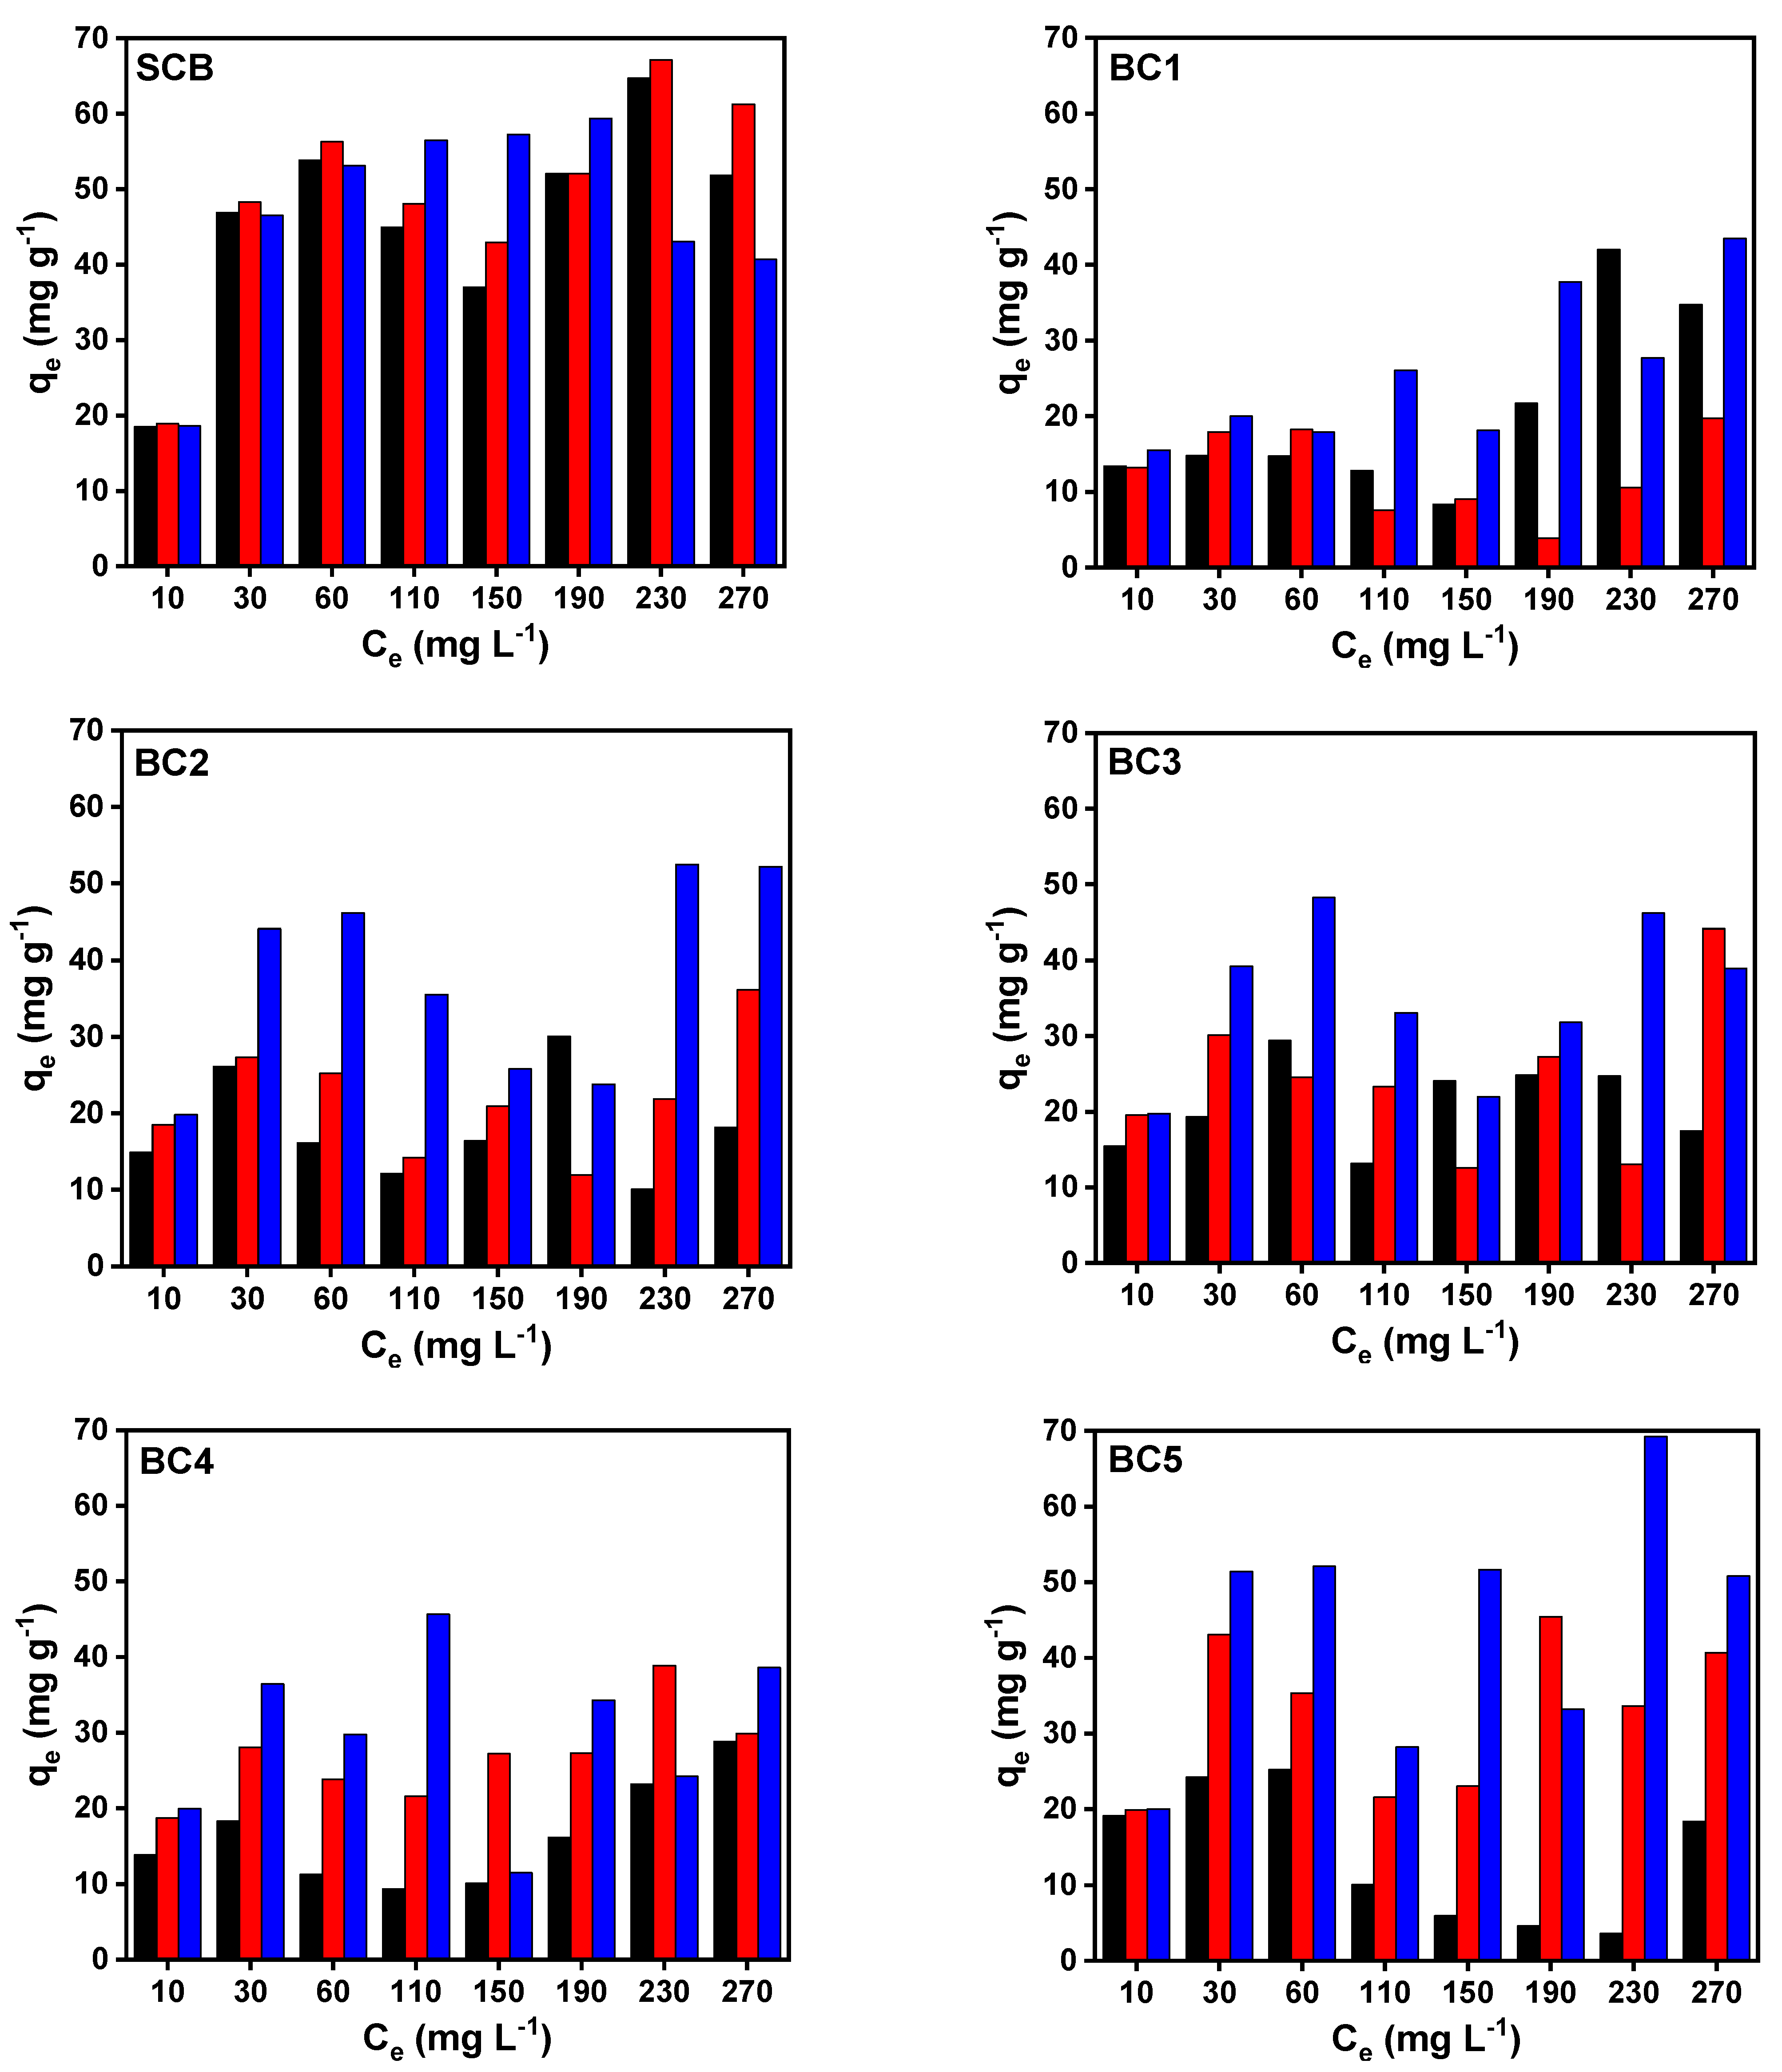

| Model | Equation/Ref. | Parameter | Value | |||||
|---|---|---|---|---|---|---|---|---|
| SCB | BC1 | BC2 | BC3 | BC4 | BC5 | |||
| PFO | [44] | q1 (mg g−1) | 18.38 | 9.46 | 18.73 | 19.09 | 18.79 | 18.56 |
| k1 (min−1) | 0.34 | 0.20 | 0.04 | 0.04 | 0.14 | 0.12 | ||
| R2 | 1.00 | 0.85 | 0.96 | 0.96 | 0.97 | 0.96 | ||
| PSO | [45] | q2 (mg g−1) | 18.77 | 10.59 | 19.42 | 19.68 | 19.71 | 19.57 |
| k2 (g mg−1 min−1) | 0.04 | 0.01 | 0.003 | 0.004 | 0.01 | 0.01 | ||
| R2 | 1.00 | 0.91 | 0.98 | 0.98 | 0.99 | 0.99 | ||
| Elovich | [46] | α (mg g−1 min−1) | 1012 | 44.1 | 12.3 | 18.1 | 3177 | 700 |
| β (mg g−1) | 1.84 | 0.92 | 0.43 | 0.44 | 0.71 | 0.63 | ||
| R2 | 0.99 | 0.98 | 0.99 | 0.98 | 0.98 | 0.99 | ||
Publisher’s Note: MDPI stays neutral with regard to jurisdictional claims in published maps and institutional affiliations. |
© 2022 by the authors. Licensee MDPI, Basel, Switzerland. This article is an open access article distributed under the terms and conditions of the Creative Commons Attribution (CC BY) license (https://creativecommons.org/licenses/by/4.0/).
Share and Cite
Fonseca, G.C.d.; Oliveira, M.S.; Martins, C.V.C.; de Souza, J.C.P. How the Carbonization Time of Sugarcane Biomass Affects the Microstructure of Biochar and the Adsorption Process? Sustainability 2022, 14, 1571. https://doi.org/10.3390/su14031571
Fonseca GCd, Oliveira MS, Martins CVC, de Souza JCP. How the Carbonization Time of Sugarcane Biomass Affects the Microstructure of Biochar and the Adsorption Process? Sustainability. 2022; 14(3):1571. https://doi.org/10.3390/su14031571
Chicago/Turabian StyleFonseca, Gabriel Cabral da, Marilene Silva Oliveira, Carlos Vinicius Costa Martins, and João Carlos Perbone de Souza. 2022. "How the Carbonization Time of Sugarcane Biomass Affects the Microstructure of Biochar and the Adsorption Process?" Sustainability 14, no. 3: 1571. https://doi.org/10.3390/su14031571
APA StyleFonseca, G. C. d., Oliveira, M. S., Martins, C. V. C., & de Souza, J. C. P. (2022). How the Carbonization Time of Sugarcane Biomass Affects the Microstructure of Biochar and the Adsorption Process? Sustainability, 14(3), 1571. https://doi.org/10.3390/su14031571