
Analysis of Construction Cost and Investment Planning Using Time Series Data


Abstract
:1. Introduction
2. Materials and Methods

| Factors of Construction Cost Prediction | References | |
|---|---|---|
| Economic growth, Construction cost index | Acquisition of rights to land and building | [20] |
| Types of work (general cost, installation works, engineering works, etc.) Construction side location (in the city center, outside the city center, non-urban, etc.) | The overall duration of the construction works, Size and necessary potential of the main contractor | [19] |
| Consumer price index, employment level in construction, Building permits, Money supply | Crude oil prices, Producer price index Housing starts, Gross domestic product | [18] |
| Consumer price index, Federal funds rate, Unemployment rate, The employment rate in construction, Average weekly hours, Prime loan rate | Building permits, Money supply, Average hourly earnings, Crude oil price, Housing starts, Construction spending, Gross domestic product | [16] |
| The selling price of residential properties, Total transaction of residential properties, | Total number of residences, Total population, Total number of new mortgages | [26] |
| Consumer price index, crude oil price, producer price index, gross domestic product, | employment levels, number of building permits, the number of housings starts the money supply crude oil prices | [27] |
| Payment delay by the client, Change by the client during construction, Owner understanding and granting strategy, Estimator’s experience level, | Estimation methods, Techniques used, Location of project, Quality and contents of specification code | [28] |
| Clear and detailed drawings, Experience and skill level of estimators, Materials (price, availability, quality), Experience on similar projects, | Accuracy of the bill of quantities, Management team, Financial capacity, Quality of assumption, Project complexity of design, | [29] |
3. Results and Discussion
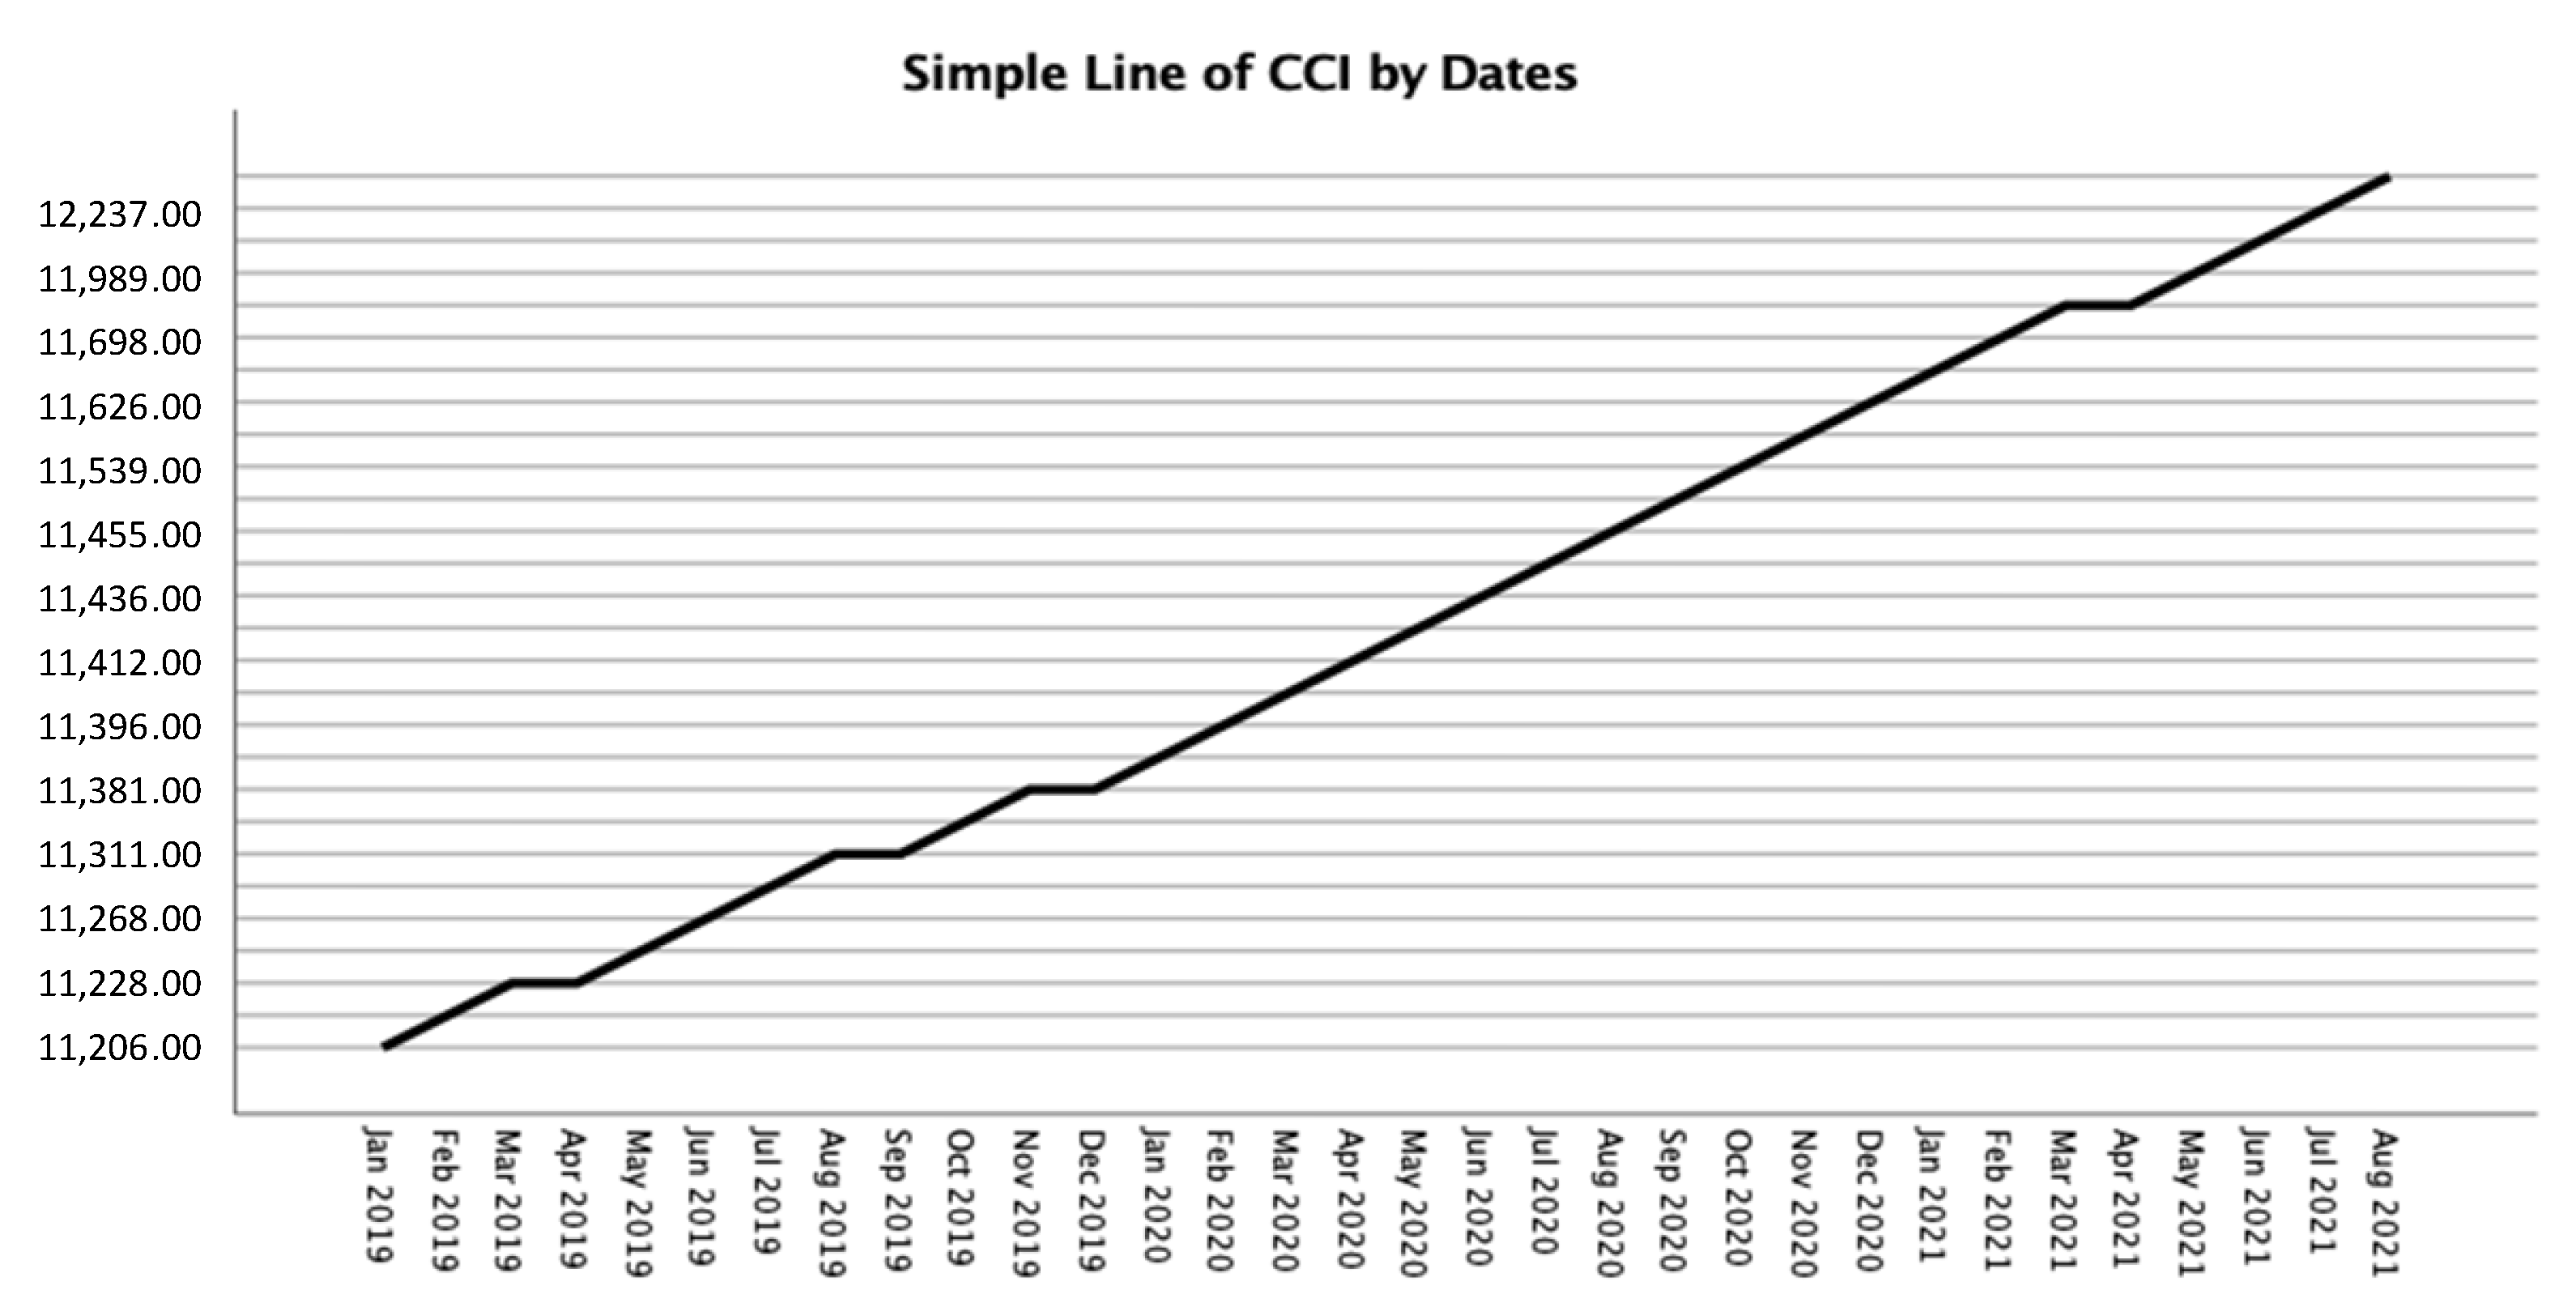
3.1. Trend of Construction Cost Index
3.2. Descriptive Analysis and Pearson Correlation (I) of the Original Variables
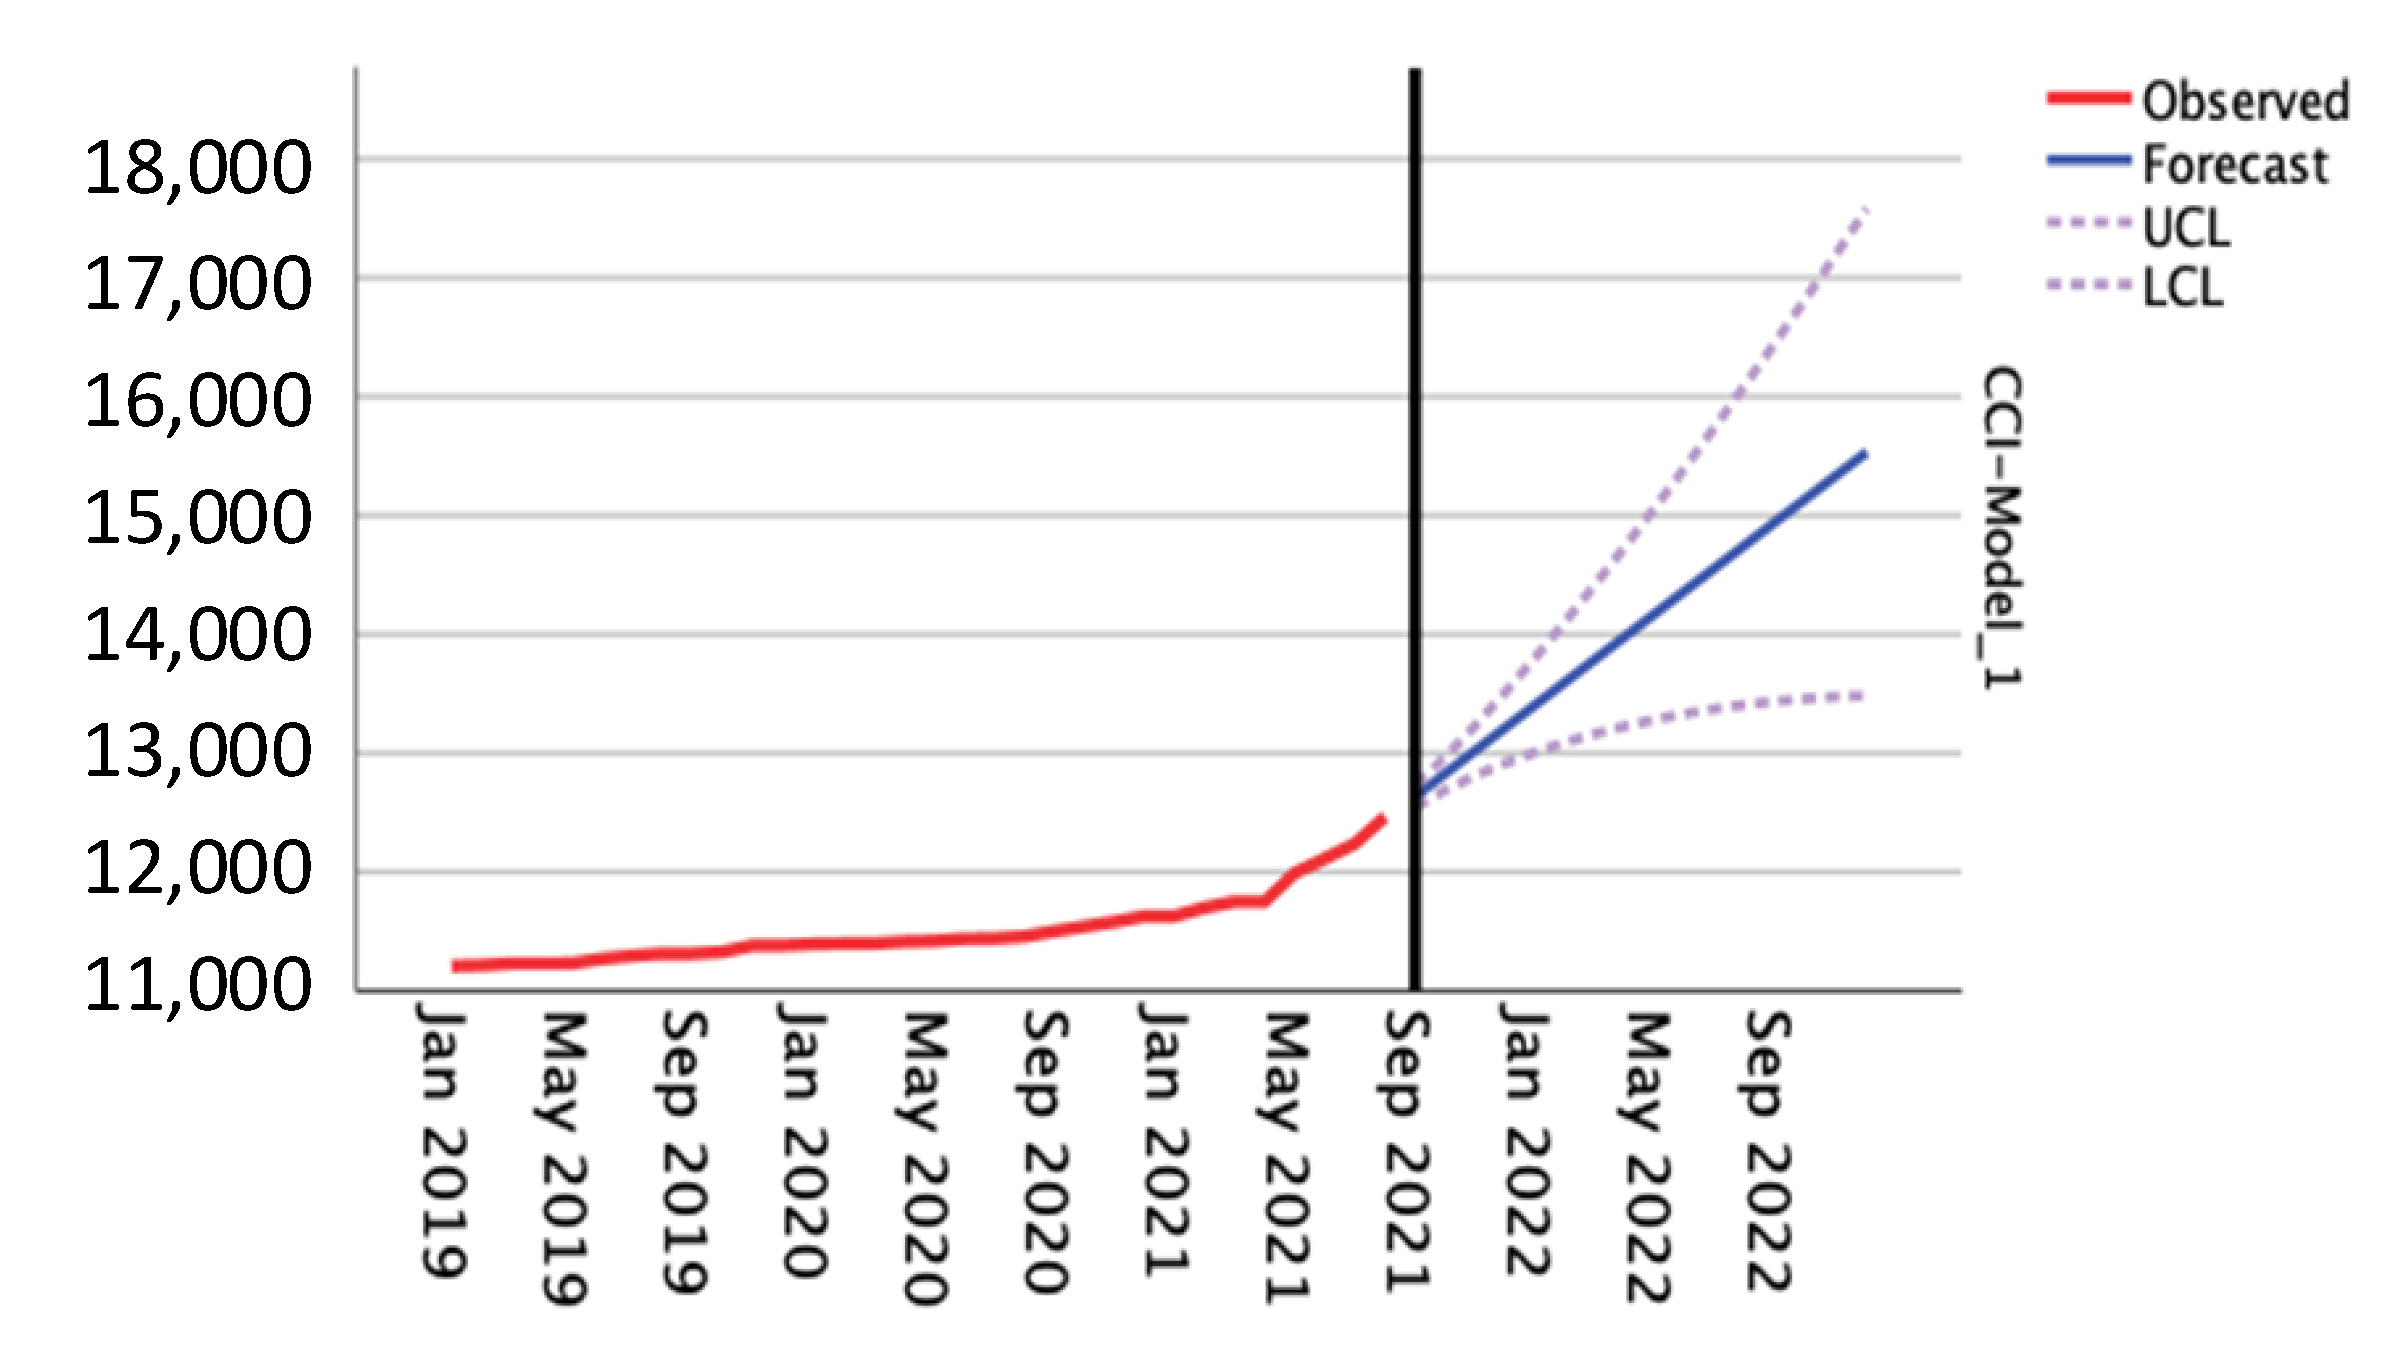
3.3. Forecast of CCI Using Holt Model
3.4. Forecast of Independent Variables for September 2021 to December 2022
3.5. Pearson Correlation (II) of Forecasted Independent and Dependent Variables
3.6. Impact of Transportation Metrics on the Construction Cost Index
3.7. Forecast of Transportation Metric
4. Conclusions
Author Contributions
Funding
Institutional Review Board Statement
Informed Consent Statement
Data Availability Statement
- Construction Cost Index—https://www.enr.com/economics (accessed on 30 December 2021)
- Consumer Price Index—https://www.bls.gov/cpi/ (accessed on 30 December 2021)
- Unemployment Rate (general)—https://www.bls.gov/eag/eag.us.htm (accessed on 30 December 2021)
- Employment Rate (general)—https://www.bls.gov/ces/ (accessed on 30 December 2021)
- Producer Price Index—https://www.bls.gov/ppi/ (accessed on 30 December 2021)
- Crude Oil Prices—https://www.eia.gov/outlooks/steo/report/prices.php (accessed on 30 December 2021)
- Gross Domestic Product—https://www.bea.gov/data/gdp/gross-domestic-product (accessed on 30 December 2021)
- Building Permits—https://socds.huduser.gov/permits/ (accessed on 30 December 2021)
- US Import Price Index—https://www.bls.gov/mxp/ (accessed on 30 December 2021)
- Money supply—https://www.federalreserve.gov/releases/h6/current/default.htm (accessed on 30 December 2021)
Conflicts of Interest
References
- Leśniak, A.; Zima, K. Cost calculation of construction projects including sustainability factors using the Case Based Reasoning (CBR) method. Sustainability 2018, 10, 1608. [Google Scholar] [CrossRef] [Green Version]
- Alinizzi, M.; Haider, H.; Almoshaogeh, M.; Alharbi, F.; Alogla, S.M.; Al-Saadi, G.A. Sustainability Assessment of Construction Technologies for Large Pipelines on Urban Highways: Scenario Analysis using Fuzzy QFD. Sustainability 2020, 12, 2648. [Google Scholar] [CrossRef] [Green Version]
- Alvarenga, F.C. Analysis of the Causes of Food Additives Cost and Time in Public Works of Federal Educational Institutions. UFPA. Universidade Federal do Pará. 2019. Available online: http://repositorio.ufpa.br/jspui/bitstream/2011/11129/1/Dissertacao_Analisecausasaditivos.pdf (accessed on 30 December 2021).
- Plebankiewicz, E. Model of predicting cost overrun in construction projects. Sustainability 2018, 10, 4387. [Google Scholar] [CrossRef] [Green Version]
- Famiyeh, S.; Amoatey, C.T.; Adaku, E.; Agbenohevi, C.S. Major causes of construction time and cost overruns: A case of selected educational sector projects in Ghana. J. Eng. Des. Technol. 2017, 15, 181–198. [Google Scholar] [CrossRef]
- Elmousalami, H.H. Artificial intelligence and parametric construction cost estimate modeling: State-of-the-art review. J. Constr. Eng. Manag. 2020, 146, 03119008. [Google Scholar] [CrossRef]
- Zhang, R.; Ashuri, B.; Shyr, Y.; Deng, Y. Forecasting construction cost index based on visibility graph: A network approach. Phys. A Stat. Mech. Its Appl. 2018, 493, 239–252. [Google Scholar] [CrossRef]
- Cong, T.D.; Minh, Q.N. Estimating the construction schools cost in Ho Chi Minh City using Artificial Neural Network. In IOP Conference Series: Materials Science and Engineering; IOP Publishing: Bristol, UK, 2020; p. 062014. [Google Scholar]
- Mao, S.; Xiao, F. Time series forecasting based on complex network analysis. IEEE Access 2019, 7, 40220–40229. [Google Scholar] [CrossRef]
- Juan, Y.-K.; Liou, L.-E. Predicting the schedule and cost performance in public school building projects in Taiwan. J. Civ. Eng. Manag. 2021, 28, 51–67. [Google Scholar] [CrossRef]
- Assaad, R.; El-Adaway, I.H.; Abotaleb, I.S. Predicting project performance in the construction industry. J. Constr. Eng. Manag. 2020, 146, 04020030. [Google Scholar] [CrossRef]
- Elfahham, Y. Estimation and prediction of construction cost index using neural networks, time series, and regression. Alex. Eng. J. 2019, 58, 499–506. [Google Scholar] [CrossRef]
- Shahandashti, S.M.; Ashuri, B. Highway construction cost forecasting using vector error correction models. J. Manag. Eng. 2016, 32, 04015040. [Google Scholar] [CrossRef]
- Ghodoosi, F.; Abu-Samra, S.; Zeynalian, M.; Zayed, T. Maintenance cost optimization for bridge structures using system reliability analysis and genetic algorithms. J. Constr. Eng. Manag. 2018, 144, 04017116. [Google Scholar] [CrossRef]
- Hassim, S.; Muniandy, R.; Alias, A.H.; Abdullah, P. Construction tender price estimation standardization (TPES) in Malaysia: Modeling using fuzzy neural network. Eng. Constr. Archit. Manag. 2018, 25, 443–457. [Google Scholar] [CrossRef]
- Ashuri, B.; Lu, J. Time series analysis of ENR construction cost index. J. Constr. Eng. Manag. 2010, 136, 1227–1237. [Google Scholar] [CrossRef]
- Wang, J.; Ashuri, B. Predicting ENR construction cost index using machine-learning algorithms. Int. J. Constr. Educ. Res. 2017, 13, 47–63. [Google Scholar] [CrossRef]
- Shahandashti, S.M.; Ashuri, B. Forecasting engineering news-record construction cost index using multivariate time series models. J. Constr. Eng. Manag. 2013, 139, 1237–1243. [Google Scholar] [CrossRef]
- Juszczyk, M.; Leśniak, A. Modelling construction site cost index based on neural network ensembles. Symmetry 2019, 11, 411. [Google Scholar] [CrossRef] [Green Version]
- Tarmizi, H.; Daulay, M.; Muda, I. Impact of the economic growth and acquisition of land to the construction cost index in North Sumatra. In IOP Conference Series: Materials Science and Engineering; IOP Publishing: Bristol, UK, 2017; p. 012004. [Google Scholar]
- Moon, S.; Chi, S.; Kim, D.Y. Predicting Construction Cost Index Using the Autoregressive Fractionally Integrated Moving Average Model. J. Manag. Eng. 2017, 34, 04017063. [Google Scholar] [CrossRef]
- Caffieri, J.J.; Love, P.E.; Whyte, A.; Ahiaga-Dagbui, D.D. Planning for production in construction: Controlling costs in major capital projects. Prod. Plan. Control 2018, 29, 41–50. [Google Scholar] [CrossRef]
- Ilbeigi, M.; Ashuri, B.; Joukar, A. Time-series analysis for forecasting asphalt-cement price. J. Manag. Eng. 2017, 33, 04016030. [Google Scholar] [CrossRef]
- Ilbeigi, M.; Castro-Lacouture, D.; Joukar, A. Generalized autoregressive conditional heteroscedasticity model to quantify and forecast uncertainty in the price of asphalt cement. J. Manag. Eng. 2017, 33, 04017026. [Google Scholar] [CrossRef]
- Joukar, A.; Nahmens, I. Volatility forecast of construction cost index using general autoregressive conditional heteroskedastic method. J. Constr. Eng. Manag. 2015, 142, 04015051. [Google Scholar] [CrossRef]
- Tajani, F.; Morano, P.; Saez-Perez, M.P.; Di Liddo, F.; Locurcio, M. Multivariate dynamic analysis and forecasting models of future property bubbles: Empirical applications to the housing markets of Spanish metropolitan cities. Sustainability 2019, 11, 3575. [Google Scholar] [CrossRef] [Green Version]
- Hellaoui, H.; Bekkouche, O.; Bagaa, M.; Taleb, T. Aerial control system for spectrum efficiency in UAV-to-cellular communications. IEEE Commun. Mag. 2018, 56, 108–113. [Google Scholar] [CrossRef]
- Chimdi, J.; Girma, S.; Mosisa, A.; Mitiku, D. Assessment of factors affecting accuracy of cost estimation in public building construction projects in western oromia region, Ethiopia. J. Civ. Eng. Sci. Technol. 2020, 11, 111–124. [Google Scholar] [CrossRef]
- Ibrahim, A.H.; Elshwadfy, L.M. Assessment of Construction Project Cost Estimating Accuracy in Egypt. Open Civ. Eng. J. 2021, 15, 290–298. [Google Scholar] [CrossRef]
- ENR. Construction Cost Index (CCI). 2021. Available online: https://www.enr.com/economics (accessed on 20 January 2022).
- BLS. U.S. Bureau of Labor Statistics. 2021. Available online: https://www.bls.gov/ (accessed on 20 January 2022).
- EIA. U.S. Energy Information Administration. 2021. Available online: https://www.eia.gov/ (accessed on 20 January 2022).
- BEA. U.S. Bureau of Economic Analysis. 2021. Available online: https://www.bea.gov/ (accessed on 20 January 2022).
- Census. U.S. Census Bureau. 2021. Available online: https://data.census.gov/cedsci/ (accessed on 20 January 2022).
- HUD. Department of Housing and Urban Development. 2021. Available online: https://www.huduser.gov/portal/pdrdatas_landing.html (accessed on 20 January 2022).
- Reserve. U.S. Board of Governors of the Federal Reserve System. 2021. Available online: https://www.federalreserve.gov/ (accessed on 20 January 2022).
- Gilliland, M. FVA: A Reality Check on Forecasting Practices. Int. J. Appl. Forecast. 2013. Available online: https://forecasters.org/wp-content/uploads/FVA_A-Reality-Check_Foresight29.pdf (accessed on 30 December 2021).
- Jallan, Y.; Brogan, E.; Ashuri, B.; Clevenger, C.M. Application of Natural Language Processing and Text Mining to Identify Patterns in Construction-Defect Litigation Cases. J. Leg. Aff. Disput. Resolut. Eng. Constr. 2019, 11, 04519024. [Google Scholar] [CrossRef]


| Dependent Variable | Source |
|---|---|
| Construction Cost Index (CCI) | Engineering News-Record [30] |
| Independent Variables | |
| Consumer Price Index (CPI) | U.S. Bureau of Labor Statistics [31] |
| Unemployment Rate (UNEMP) (general) | U.S. Bureau of Labor Statistics [31] |
| Employment Rate (EMP) (general) | U.S. Bureau of Labor Statistics [31] |
| Producer Price Index (PPI) | U.S. Bureau of Labor Statistics [31] |
| Crude Oil Prices (COIL) * | U.S. Energy Information Administration [32] |
| Gross Domestic Products (GDP) | Bureau of Economic Analysis [33] |
| Building Permits (BP) | Census Bureau [34], Housing and Urban Development [35] |
| Import Price Index (IPI) | U.S. Bureau of Labor Statistics [31] |
| Money Supply (MS) * | U.S. Board of Governors of the Federal Reserve System [36] |
| Name | Mean | Sth. Dev. | Coefficient of Variation | Name | Mean | Sth. Dev. | Coefficient of Variation |
|---|---|---|---|---|---|---|---|
| CCI | 11,518.4063 | 308.5893 | 2.6791 | COIL | 52.0747 | 12.8476 | 24.6715 |
| BP | 123,176.5000 | 18,290.1588 | 14.8487 | MS | 17,235.2344 | 2297.0631 | 13.3277 |
| CPI | 259.8683 | 5.4227 | 2.0867 | PPI | 119.9594 | 3.2528 | 2.7116 |
| UNEMP | 59.6619 | 4.5107 | 7.5605 | GDP | 2.4750 | 2.0947 | 84.6339 |
| EMP | 5.8438 | 2.9303 | 50.1431 | IPI | 125.8156 | 4.0993 | 3.2582 |
| CCI | BP | CPI | UNEMP | EMP | COIL | MS | PPI | GDP | IPI | ||
|---|---|---|---|---|---|---|---|---|---|---|---|
| CCI | Pearson | 1 | 0.726 ** | 0.976** | −0.706 ** | 0.104 | 0.398 * | 0.853 ** | 0.953 ** | 0.738 ** | 0.727 ** |
| p | <0.001 | <0.001 | <0.001 | 0.571 | 0.024 | <0.001 | <0.001 | <0.001 | <0.001 | ||
| BP | Pearson | 0.726 ** | 1 | 0.794 ** | −0.519 ** | 0.014 | 0.405 * | 0.742 ** | 0.757 ** | 0.767 ** | 0.628 ** |
| p | <0.001 | <0.001 | 0.002 | 0.939 | 0.021 | <0.001 | <0.001 | <0.001 | <0.001 | ||
| CPI | Pearson | 0.976 ** | 0.794 ** | 1 | −0.690 ** | 0.030 | 0.455 ** | 0.858 ** | 0.962 ** | 0.818 ** | 0.762 ** |
| p | <0.001 | <0.001 | <0.001 | 0.872 | 0.009 | <0.001 | <0.001 | <0.001 | <0.001 | ||
| UNEMP | Pearson | −0.706 ** | −0.519 ** | −0.690 ** | 1 | −0.091 | −0.369 * | −0.688 ** | −0.729 ** | −0.657 ** | −0.637 ** |
| p | <0.001 | 0.002 | <0.001 | 0.620 | 0.038 | <0.001 | <0.001 | <0.001 | <0.001 | ||
| EMP | Pearson | 0.104 | 0.014 | 0.030 | −0.091 | 1 | −0.710 ** | 0.433 * | −0.133 | −0.283 | −0.472 ** |
| p | 0.571 | 0.939 | 0.872 | 0.620 | <0.001 | 0.013 | 0.468 | 0.117 | 0.006 | ||
| COIL | Pearson | 0.398 * | 0.405 * | 0.455 ** | −0.369 * | −0.710 ** | 1 | 0.071 | 0.627 ** | 0.639 ** | 0.885 ** |
| p | 0.024 | 0.021 | 0.009 | 0.038 | <0.001 | 0.699 | <0.001 | <0.001 | <0.001 | ||
| MS | Pearson | 0.853 ** | 0.742 ** | 0.858 ** | −0.688 ** | 0.433 * | 0.071 | 1 | 0.740 ** | 0.644 ** | 0.436 * |
| p | <0.001 | <0.001 | <0.001 | <0.001 | 0.013 | 0.699 | <0.001 | <0.001 | 0.013 | ||
| PPI | Pearson | 0.953 ** | 0.757 ** | 0.962 ** | −0.729 ** | −0.133 | 0.627 ** | 0.740 ** | 1 | 0.838 ** | 0.889 ** |
| p | <0.001 | <0.001 | <0.001 | <0.001 | 0.468 | <0.001 | <0.001 | <0.001 | <0.001 | ||
| GDP | Pearson | 0.738 ** | 0.767 ** | 0.818 ** | −0.657 ** | −0.283 | 0.639 ** | 0.644 ** | 0.838 ** | 1 | 0.738 ** |
| p | <0.001 | <0.001 | <0.001 | <0.001 | 0.117 | <0.001 | <0.001 | <0.001 | <0.001 | ||
| IPI | Pearson | 0.727 ** | 0.628 ** | 0.762 ** | −0.637 ** | −0.472 ** | 0.885 ** | 0.436 * | 0.889 ** | 0.738 ** | 1 |
| p | <0.001 | <0.001 | <0.001 | <0.001 | 0.006 | <0.001 | 0.013 | <0.001 | <0.001 | ||
| Fit Statistic | Value | Fit Statistic | Value | Fit Statistic | Value |
|---|---|---|---|---|---|
| Stationary R-squared | 0.410 | MAPE | 0.217 | MaxAE | 194.060 |
| R-squared | 0.980 | MaxAPE | 1.619 | Normalized BIC | 7.789 |
| RMSE | 44.098 | MAE | 25.394 |
| MONTH | YEAR | PREDICTED | LCL | UCL | MONTH | YEAR | PREDICTED | LCL | UCL |
|---|---|---|---|---|---|---|---|---|---|
| September | 2021 | 12,635.03 | 12,544.97 | 12,725.09 | May | 2022 | 14,181.19 | 13,284.05 | 15,078.33 |
| October | 2021 | 12,828.30 | 12,689.25 | 12,967.34 | June | 2022 | 14,374.46 | 13,332.63 | 15,416.29 |
| November | 2021 | 13,021.57 | 12,810.42 | 13,232.71 | July | 2022 | 14,567.73 | 13,374.05 | 15,761.41 |
| December | 2021 | 13,214.84 | 12,915.72 | 13,513.95 | August | 2022 | 14,761.00 | 13,408.65 | 16,113.36 |
| January | 2022 | 13,408.11 | 13,008.60 | 13,807.62 | September | 2022 | 14,954.27 | 13,436.71 | 16,471.83 |
| February | 2022 | 13,601.38 | 13,090.89 | 14,111.87 | October | 2022 | 15,147.54 | 13,458.50 | 16,836.59 |
| March | 2022 | 13,794.65 | 13,163.72 | 14,425.58 | November | 2022 | 15,340.81 | 13,474.24 | 17,207.39 |
| April | 2022 | 13,987.92 | 13,227.91 | 14,747.93 | December | 2022 | 15,534.08 | 13,484.13 | 17,584.03 |
| ID | Description | Type | ID | Description | Type |
|---|---|---|---|---|---|
| BP | Model_1 | Winter’s Additive | COIL | Model_5 | ARIMA (0, 1, 1) |
| CPI | Model_2 | ARIMA (0, 2, 0) | MS | Model_6 | ARIMA (0, 2, 0) |
| UNEMP | Model_3 | Simple Seasonal | PPI | Model_7 | ARIMA (0, 2, 1) |
| EMP | Model_4 | Simple Seasonal | GDP | Model_8 | ARIMA (3, 1, 0) |
| IPI | Model_9 | ARIMA (0, 2, 0) |
| Model | Model Fit Statistics | Ljung-Box Q (18) | |||
|---|---|---|---|---|---|
| Stationary R-Squared | R-Squared | Statistics | DF | Sig. | |
| BP-Model_1 | 0.707 | 0.751 | 23.658 | 15 | 0.071 |
| CPI-Model_2 | −2.022 × 10⁻¹⁷ | 0.984 | 22.999 | 18 | 0.191 |
| UNEMP-Model_3 | 0.782 | 0.736 | 16.428 | 16 | 0.424 |
| EMP-Model_4 | 0.721 | 0.690 | 26.935 | 16 | 0.042 |
| COIL-Model_5 | 0.285 | 0.823 | 10.639 | 17 | 0.875 |
| MS-Model_6 | 2.011 × 10⁻¹⁶ | 0.993 | 21.116 | 18 | 0.274 |
| PPI-Model_7 | 0.274 | 0.974 | 7.450 | 17 | 0.977 |
| GDP-Model_8 | 0.249 | 0.737 | 10.982 | 17 | 0.857 |
| IPI-Model_9 | 0.000 | 0.934 | 15.416 | 18 | 0.633 |
| Fit Statistic | Mean | SE | Minimum | Maximum | Percentile | ||
|---|---|---|---|---|---|---|---|
| 5 | 90 | 95 | |||||
| Stationary R-squared | 0.335 | 0.324 | −2.022 × 10⁻¹⁷ | 0.782 | −2.220 × 10⁻¹⁶ | 0.782 | 0.782 |
| R-squared | 0.847 | 0.124 | 0.690 | 0.993 | 0.690 | 0.993 | 0.993 |
| RMSE | 1070.384 | 3134.629 | 0.529 | 9427.694 | 0.529 | 9427.694 | 9427.694 |
| MAPE | 5.519 | 6.446 | 0.193 | 17.605 | 0.193 | 17.605 | 17.605 |
| MaxAPE | 44.625 | 67.704 | 0.615 | 203.457 | 0.615 | 203.457 | 203.457 |
| MAE | 798.485 | 2344.909 | 0.411 | 7050.581 | 0.411 | 7050.581 | 7050.581 |
| MaxAE | 2672.519 | 7793.375 | 1.167 | 23,449.075 | 1.167 | 23,449.075 | 23,449.075 |
| Normalized BIC | 3.847 | 6.582 | −1.160 | 18.628 | −1.160 | 18.628 | 18.628 |
| Month | Year | BP | CPI | EMP | UNEMP | COIL | MS | PPI | GDP | IPI |
|---|---|---|---|---|---|---|---|---|---|---|
| Sept. | 2021 | 150,207.64 | 273.77 | 56.13 | 4.95 | 65.24 | 21,067.91 | 130.00 | 5.70 | 133.74 |
| Oct. | 2021 | 158,415.65 | 274.53 | 56.34 | 4.55 | 65.24 | 21,347.03 | 131.11 | 5.89 | 133.23 |
| Nov. | 2021 | 139,852.66 | 275.31 | 56.25 | 4.45 | 65.24 | 21,364.36 | 132.21 | 5.89 | 132.66 |
| Dec. | 2021 | 146,541.17 | 276.11 | 56.21 | 4.45 | 65.24 | 21,929.90 | 133.32 | 5.89 | 132.03 |
| Jan. | 2022 | 146,289.07 | 276.91 | 49.60 | 3.90 | 65.24 | 22,233.65 | 134.42 | 5.80 | 131.35 |
| Feb. | 2022 | 137,591.75 | 277.75 | 53.54 | 3.77 | 65.24 | 22,545.61 | 135.53 | 5.80 | 130.61 |
| Mar. | 2022 | 160,649.10 | 278.60 | 53.37 | 4.00 | 65.24 | 22,865.78 | 136.63 | 5.80 | 129.81 |
| April | 2022 | 158,432.77 | 279.47 | 52.50 | 7.40 | 65.24 | 23,194.16 | 137.73 | 5.80 | 128.96 |
| May | 2022 | 157,918.78 | 280.36 | 52.84 | 6.80 | 65.24 | 23,530.75 | 138.84 | 5.84 | 128.05 |
| June | 2022 | 164,083.79 | 281.29 | 53.01 | 6.10 | 65.24 | 23,875.55 | 139.94 | 5.84 | 127.08 |
| July | 2022 | 165,363.12 | 282.24 | 53.18 | 5.63 | 65.24 | 24,228.56 | 141.05 | 5.84 | 126.06 |
| Aug. | 2022 | 170,432.11 | 283.22 | 53.42 | 5.00 | 65.24 | 24,589.21 | 142.15 | 5.82 | 124.98 |
| Sept. | 2022 | 166,520.26 | 284.23 | 56.13 | 4.95 | 65.24 | 24,989.21 | 143.26 | 5.82 | 123.84 |
| Aug. | 2022 | 174,728.26 | 285.28 | 56.34 | 4.55 | 65.24 | 25,336.85 | 144.36 | 5.83 | 122.65 |
| Nov. | 2022 | 156,165.28 | 286.37 | 56.25 | 4.45 | 65.24 | 25,722.70 | 145.47 | 5.83 | 121.40 |
| Dec. | 2022 | 162,853.79 | 287.50 | 56.21 | 4.45 | 65.24 | 26,116.76 | 146.57 | 5.83 | 120.09 |
| Name | CCI | CPI Transport | GDP Transport | TSI Freight | |
|---|---|---|---|---|---|
| CCI | Pearson Correlation | 1 | 0.257 | −0.213 | −0.055 |
| Sig. (2−tailed) | 0.156 | 0.242 | 0.767 | ||
| CPI Transport | Pearson Correlation | 0.257 | 1 | −0.158 | 0.792 |
| Sig. (2−tailed) | 0.156 | 0.387 | <0.001 | ||
| GDP Transport | Pearson Correlation | −0.213 | −0.158 | 1 | 0.075 |
| Sig. (2−tailed) | 0.242 | 0.387 | 0.683 | ||
| TSI Freight | Pearson Correlation | −0.055 | 0.792 | 0.075 | 1 |
| Sig. (2−tailed) | 0.767 | <0.001 | 0.683 | ||
| Fit Statistic | Mean | SE | Min. | Max. | Percentile | |||
|---|---|---|---|---|---|---|---|---|
| 5 | 10 | 90 | 95 | |||||
| Stationary R-squared | 0.091 | 0.140 | −0.001 | 0.252 | −0.001 | −0.001 | 0.252 | 0.252 |
| R-squared | 0.478 | 0.223 | 0.252 | 0.699 | 0.252 | 0.252 | 0.699 | 0.699 |
| RMSE | 8.049 | 7.867 | 2.466 | 17.047 | 2.466 | 2.466 | 17.047 | 17.047 |
| MAPE | 157.810 | 271.572 | 0.824 | 471.394 | 0.824 | 0.824 | 471.394 | 471.394 |
| MaxAPE | 2676.961 | 4626.141 | 4.157 | 8018.768 | 4.157 | 4.157 | 8018.768 | 8018.768 |
| MAE | 5.222 | 5.332 | 1.611 | 11.346 | 1.611 | 1.611 | 11.346 | 11.346 |
| MaxAE | 26.996 | 26.937 | 10.002 | 58.055 | 10.002 | 10.002 | 58.055 | 58.055 |
| Normalized BIC | 3.623 | 1.972 | 1.914 | 5.780 | 1.914 | 1.914 | 5.780 | 5.780 |
Publisher’s Note: MDPI stays neutral with regard to jurisdictional claims in published maps and institutional affiliations. |
© 2022 by the authors. Licensee MDPI, Basel, Switzerland. This article is an open access article distributed under the terms and conditions of the Creative Commons Attribution (CC BY) license (https://creativecommons.org/licenses/by/4.0/).
Share and Cite
Jiang, F.; Awaitey, J.; Xie, H. Analysis of Construction Cost and Investment Planning Using Time Series Data. Sustainability 2022, 14, 1703. https://doi.org/10.3390/su14031703
Jiang F, Awaitey J, Xie H. Analysis of Construction Cost and Investment Planning Using Time Series Data. Sustainability. 2022; 14(3):1703. https://doi.org/10.3390/su14031703
Chicago/Turabian StyleJiang, Fengchang, John Awaitey, and Haiyan Xie. 2022. "Analysis of Construction Cost and Investment Planning Using Time Series Data" Sustainability 14, no. 3: 1703. https://doi.org/10.3390/su14031703
APA StyleJiang, F., Awaitey, J., & Xie, H. (2022). Analysis of Construction Cost and Investment Planning Using Time Series Data. Sustainability, 14(3), 1703. https://doi.org/10.3390/su14031703