
Using ARC-D Toolkit for Measuring Community Resilience to Disasters


 , ,
, ,
Abstract
:1. Introduction
2. ARC-D Toolkit
3. Data and Method
3.1. Research Approach
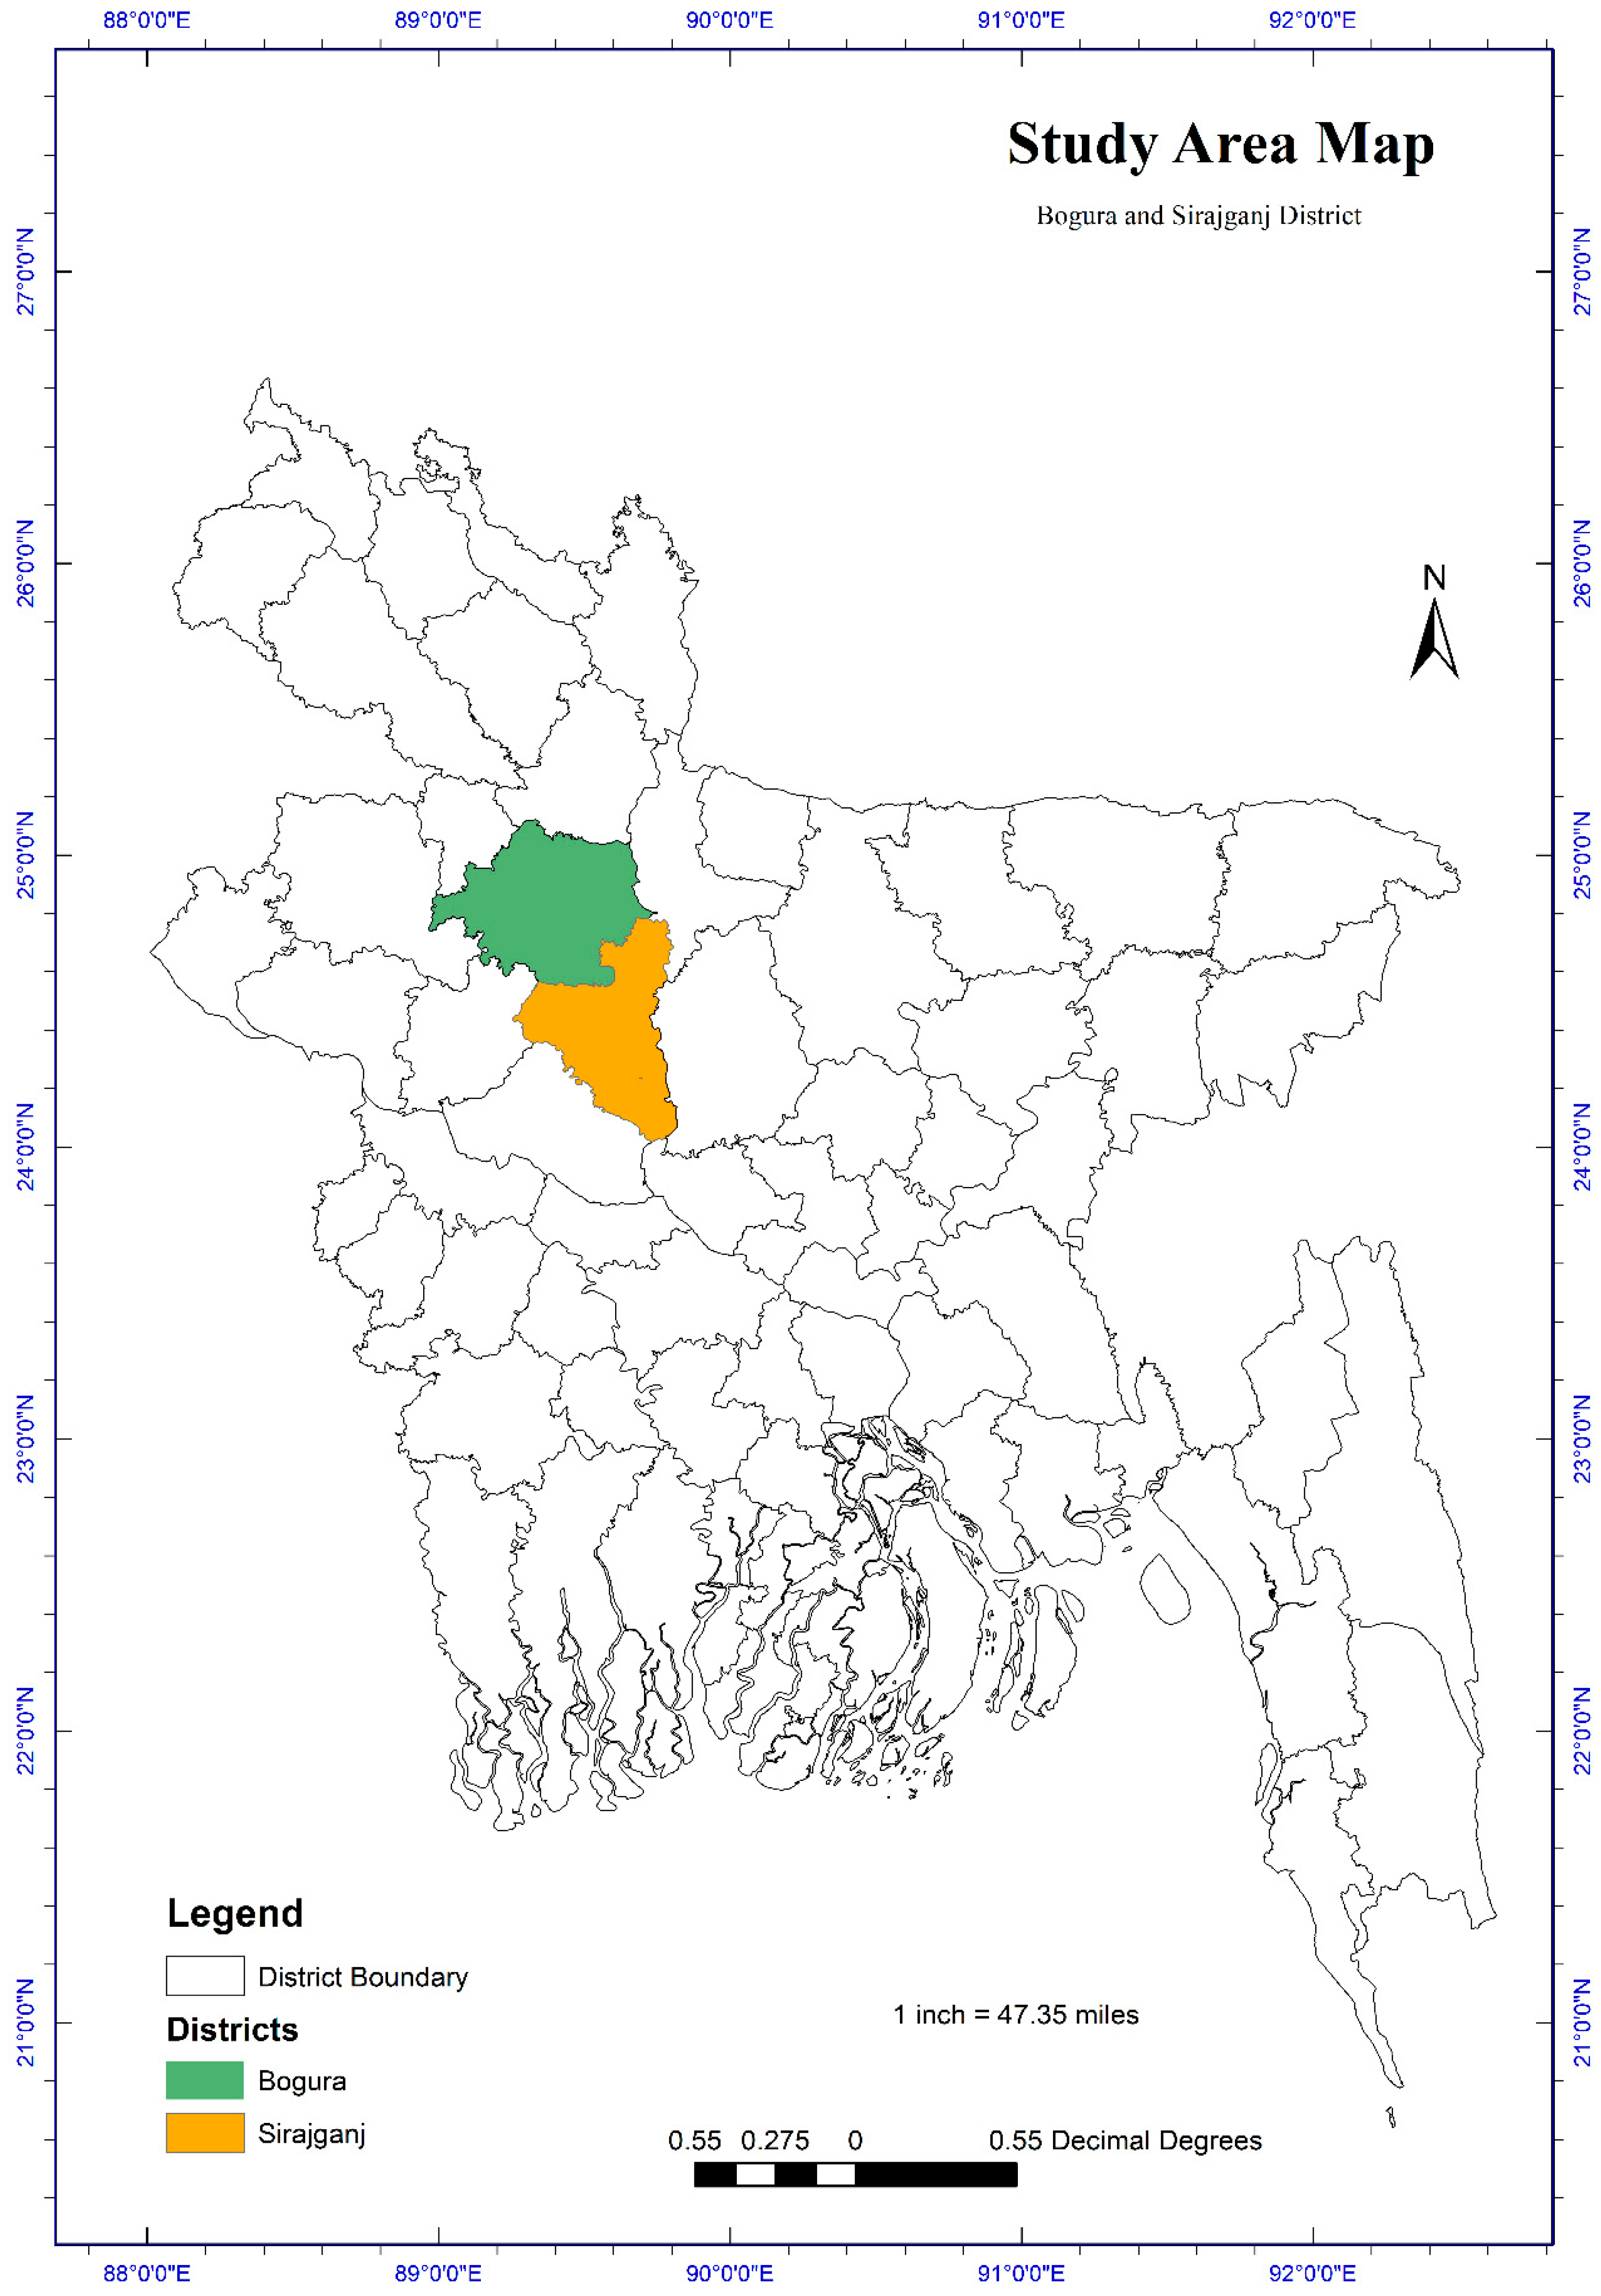
3.2. Study Area
3.3. Sample Size and Sampling
3.4. Data Collection Tool
3.4.1. Quantitative Method
3.4.2. Qualitative Method
3.5. Data Analysis
3.6. Ethical Considerations
4. Results
4.1. Socio-Demographic Information
4.2. Community Resilience Level
5. Discussion
6. Conclusions
Author Contributions
Funding
Institutional Review Board Statement
Informed Consent Statement
Data Availability Statement
Acknowledgments
Conflicts of Interest
References
- Bündnis Entwicklung Hilft, Ruhr University Bochum—Institute for International Law of Peace and Armed Conflict (IFHV). World Risk Report 2019—Focus: Water Supply; Bündnis Entwicklung Hilft, Ruhr University Bochum—Institute for International Law of Peace and Armed Conflict: Berlin/Heidelberg, Germany, 2019; Available online: https://reliefweb.int/sites/reliefweb.int/files/resources/WorldRiskReport-2019_Online_english.pdf (accessed on 2 June 2021).
- Centre for Research on the Epidemiology of Disasters—CRED. EM-DAT: The Emergency Events Database—Université catholique de Louvain (UCL). Available online: www.emdat.be (accessed on 2 June 2021).
- Pinos, J.; Quesada-Román, A. Flood Risk-Related Research Trends in Latin America and the Caribbean. Water 2021, 14, 10. [Google Scholar] [CrossRef]
- García-Soriano, D.; Quesada-Román, A.; Zamorano-Orozco, J.J. Geomorphological hazards susceptibility in high-density urban areas: A case study of Mexico City. J. S. Am. Earth Sci. 2020, 102, 102667. [Google Scholar] [CrossRef]
- Quesada-Román, A.; Ballesteros-Cánovas, J.A.; Granados-Bolaños, S.; Birkel, C.; Stoffel, M. Improving regional flood risk assessment using flood frequency and dendrogeomorphic analyses in mountain catchments impacted by tropical cyclones. Geomorphology 2021, 396, 108000. [Google Scholar] [CrossRef]
- Quesada-Román, A.; Castro-Chacón, J.P.; Boraschi, S.F. Geomorphology, land use, and environmental impacts in a densely populated urban catchment of Costa Rica. J. S. Am. Earth Sci. 2021, 112, 103560. [Google Scholar] [CrossRef]
- Needs Assessment Working Group (NAWG). Bangladesh: Monsoon Floods 2020 Coordinated Preliminary Impact and Needs Assessment; Needs Assessment Working Group: Dhaka, Bangladesh, 2020; Available online: https://reliefweb.int/sites/reliefweb.int/files/resources/nawg_monsoon_flood_preliminary_impact_and_kin_20200725_final_draft.pdf (accessed on 2 June 2021).
- Wattie, J.; Masys, A.J. Enabling Resilience: An Examination of High Reliability Organizations and Safety Culture through the Lens of Appreciative Inquiry. In Disaster Management: Enabling Resilience. Lecture Notes in Social Networks; Masys, A., Ed.; Springer: Cham, Switzerland, 2015; pp. 157–176. [Google Scholar] [CrossRef]
- Southwick, S.M.; Bonanno, G.A.; Masten, A.; Panter-Brick, C.; Yehuda, R. Resilience definitions, theory, and challenges: Interdisciplinary perspectives. Eur. J. Psychotraumatol. 2014, 5, 25338. [Google Scholar] [CrossRef] [Green Version]
- Bruneau, M.; Chang, S.E.; Eguchi, R.T.; Lee, G.C.; O’Rourke, T.D.; Reinhorn, A.M.; Shinozuka, M.; Tierney, K.; Wallace, W.A.; von Winterfeldt, D. A Framework to Quantitatively Assess and Enhance the Seismic Resilience of Communities. Earthq. Spectra 2003, 19, 733–752. [Google Scholar] [CrossRef] [Green Version]
- Bhamra, R.S.; Dani, S.; Burnard, K.J. Resilience: The concept, a literature review and future directions. Int. J. Prod. Res. 2011, 49, 5375–5393. [Google Scholar] [CrossRef]
- Paton, D.; Smith, L.; Violanti, J. Disaster response: Risk, vulnerability and resilience. Disaster Prev. Manag. Int. J. 2000, 9, 173–180. [Google Scholar] [CrossRef]
- Etkin, D. Disaster Theory: An Interdisciplinary Approach to Concepts and Causes, 1st ed.; Butterworth-Heinemann Elsevier Ltd: Oxford, UK, 2014; p. 368. [Google Scholar]
- Shaw, R.; Sharma, A. (Eds.) Climate and Disaster Resilience in Cities; Community, Environment and Disaster Risk Management, Volume 6; Emerald Group Publishing Limited: Bingley, UK, 2011. [Google Scholar] [CrossRef]
- Ronan, K.R.; Johnston, D.M. Promoting Community Resilience in Disasters: The Role for Schools, Youth, and Families; Springer Science + Business Media, Inc.: New York, NY, USA, 2005; p. 221. [Google Scholar]
- Ride, A.; Bretherton, D. Conclusion: Community Resilience in Natural Disasters. In Community Resilience in Natural Disasters; Palgrave Macmillan: New York, NY, USA, 2011; pp. 169–193. [Google Scholar]
- Nehren, U.; Sudmeier-Rieux, K.; Sandholz, S.; Estrella, M.; Lomarda, M.; Guillén, T. The Ecosystem-Based Disaster Risk Reduction Case Study and Exercise Source Book, 1st ed.; Partnership for Environment and Disaster Risk Reduction and Center for Natural Resources and Development: Geneva, Switzerland; Cologne, Germany, 2014. [Google Scholar]
- Plough, A.; Fielding, J.E.; Chandra, A.; Williams, M.; Eisenman, D.; Wells, K.B.; Law, G.Y.; Fogleman, S.; Magana, A. Building Community Disaster Resilience: Perspectives From a Large Urban County Department of Public Health. Am. J. Public Health 2013, 103, 1190–1197. [Google Scholar] [CrossRef]
- Joerin, J.; Shaw, R.; Takeuchi, Y.; Krishnamurthy, R. Assessing community resilience to climate-related disasters in Chennai, India. Int. J. Disaster Risk Reduct. 2012, 1, 44–54. [Google Scholar] [CrossRef]
- Chen, L.-C.; Wang, Y.-W. Building community capacity for disaster resilience in Taiwan. J. Disaster Res. 2010, 5, 138–146. [Google Scholar] [CrossRef]
- Chandra, A.; Acosta, J.; Stern, S.; Uscher-Pines, L.; Williams, M.V.; Yeung, D.; Garnett, J.; Meredith, L.S. Definition and Application of Community Resilience. In Building Community Resilience to Disasters; RAND Corporation: Santa Monica, CA, USA, 2011; pp. 7–10. [Google Scholar]
- National Research Council. Building Community Disaster Resilience through Private-Public Collaboration; The National Academies Press: Washington, DC, USA, 2011; p. 142. [CrossRef]
- Mayunga, J.S. Understanding and Applying the Concept of Community Disaster Resilience: A Capital-Based Approach; A draft working paper prepared for the Summer Academy for Social Vulnerability and Resilience Building: Munich, Germany, 22–28 July 2007. [Google Scholar]
- Arbon, P.; Steenkamp, M.; Cornell, V.; Cusack, L.; Gebbie, K. Measuring disaster resilience in communities and households: Pragmatic tools developed in Australia. Int. J. Disaster Resil. Built Environ. 2016, 7, 201–215. [Google Scholar] [CrossRef]
- Wisner, B.; Kelman, I. Community Resilience to Disasters. In International Encyclopedia of the Social & Behavioral Sciences, 2nd ed.; Wright, J.D., Ed.; Elsevier: Amsterdam, The Netherlands, 2015; pp. 354–360. [Google Scholar] [CrossRef]
- Fitzpatrick, T. Community disaster resilience. In Disasters and Public Health, 2nd ed.; Clements, B.W., Casani, J.A.P., Eds.; Butterworth-Heinemann: Oxford, UK, 2016; pp. 57–85. [Google Scholar]
- Yoon, D.K.; Kang, J.E.; Brody, S.D. A measurement of community disaster resilience in Korea. J. Environ. Plan. Manag. 2015, 59, 436–460. [Google Scholar] [CrossRef]
- Ostadtaghizadeh, A.; Ardalan, A.; Paton, D.; Khankeh, H.; Jabbari, H. Community disaster resilience: A qualitative study on Iranian concepts and indicators. Nat. Hazards 2016, 83, 1843–1861. [Google Scholar] [CrossRef]
- Chandra, A.; Williams, M.; Plough, A.; Stayton, A.; Wells, K.B.; Horta, M.; Tang, J. Getting Actionable About Community Resilience: The Los Angeles County Community Disaster Resilience Project. Am. J. Public Health 2013, 103, 1181–1189. [Google Scholar] [CrossRef] [PubMed]
- Sherrieb, K.; Norris, F.H.; Galea, S. Measuring Capacities for Community Resilience. Soc. Indic. Res. 2010, 99, 227–247. [Google Scholar] [CrossRef]
- Clark-Ginsberg, A.; McCaul, B.; Bremaud, I.; Cáceres, G.; Mpanje, D.; Patel, S.; Patel, R. Practitioner approaches to measuring community resilience: The analysis of the resilience of communities to disasters toolkit. Int. J. Disaster Risk Reduct. 2020, 50, 101714. [Google Scholar] [CrossRef] [PubMed]
- Twigg, J. Characteristics of a Disaster-Resilient Community: A Guidance Note. 2007. Benfield UCL Hazard Research Centre Website. Available online: https://www.preventionweb.net/files/2310_Characteristicsdisasterhighres.pdf (accessed on 2 June 2021).
- Chisty, M.A.; Rahman, M.; Khan, N.A.; Alam Dola, S.E. Assessing Community Disaster Resilience in Flood-Prone Areas of Bangladesh: From a Gender Lens. Water 2022, 14, 40. [Google Scholar] [CrossRef]
- Fenxia, Z. The community resilience measurement throughout the COVID-19 pandemic and beyond -an empirical study based on data from Shanghai, Wuhan and Chengdu. Int. J. Disaster Risk Reduct. 2022, 67, 102664. [Google Scholar] [CrossRef]
- Cruz, N. Measuring Informal Urban Settlements´ Pathway to Resilience Building. In Proceedings of the IFoU 2018: Reframing Urban Resilience Implementation: Aligning Sustainability and Resilience, Barcelona, Spain, December 2018; MDPI: Basel, Switzerland, 2018. [Google Scholar] [CrossRef]
- Mehryar, S.; Sasson, I.; Surminski, S. Supporting urban adaptation to climate change: What role can resilience measurement tools play? Urban Clim. 2022, 41, 101047. [Google Scholar] [CrossRef]
- Neuman, W.L. Social Research Methods: Qualitative and Quantitative Approaches, 7th ed.; Pearson: Essex, UK, 2009; p. 631. [Google Scholar]
- Flood Forecasting & Warning Center; Processing & Flood Forecasting Circle; Bangladesh Water Development Board. Annual Flood Report 2016. Flood Forecasting & Warning Center Website. Available online: http://www.ffwc.gov.bd/images/annual16.pdf (accessed on 2 June 2021).
- Tejada, J.; Punzalan, J. On the Misuse of Slovin’s Formula. Philipp. Stat. 2012, 61, 129–136. [Google Scholar]
- Chakraborty, U.; Bhat, S. The Effects of Credible Online Reviews on Brand Equity Dimensions and Its Consequence on Consumer Behavior. J. Promot. Manag. 2018, 24, 57–82. [Google Scholar] [CrossRef]
- Creswell, J.W.; Clark, V.L.P. Designing and Conducting Mixed Methods Research, 3rd ed.; SAGE Publications Inc: Los Angeles, CA, USA, 2017. [Google Scholar]
- Sarantakos, S. Social Research, 4th ed.; Red Globe Press: London, UK, 2013. [Google Scholar]
- IBM SPSS Statistics, version 25; Campus licentie; IBM: Armonk, NY, USA, 2018. Available online: https://www.surfspot.nl/ibm-spss-25-statistics.html (accessed on 2 June 2021).
- Nakamura, H.; Umeki, H.; Kato, T. Importance of communication and knowledge of disasters in community-based disaster-prevention meetings. Saf. Sci. 2017, 99, 235–243. [Google Scholar] [CrossRef]
- Price-Robertson, R.; Knight, K. Natural disasters and community resilience: A framework for support. Child Family Community Australia (CFCA): Canberra, Australia, 2012. Available online: https://aifs.gov.au/cfca/sites/default/files/cfca/pubs/papers/a141862/cfca03.pdf. (accessed on 2 June 2021).
- Cavaye, J.; Ross, H. Community resilience and community development: What mutual opportunities arise from interactions between the two concepts? Community Dev. 2019, 50, 181–200. [Google Scholar] [CrossRef]
- Cutter, S.; Ash, K.; Emrich, C.T. The geographies of community disaster resilience. Glob. Environ. Chang. 2014, 29, 65–77. [Google Scholar] [CrossRef]
- Chisty, M.A.; Alam Dola, S.E.; Khan, N.A.; Rahman, M. Intersectionality, vulnerability and resilience: Why it is important to review the diversifications within groups at risk to achieve a resilient community. Contin. Resil. Rev. 2021, 3, 119–131. [Google Scholar] [CrossRef]
- Cox, R.S.; Hamlen, M. Community Disaster Resilience and the Rural Resilience Index. Am. Behav. Sci. 2014, 59, 220–237. [Google Scholar] [CrossRef]
- Fekete, A. Critical infrastructure cascading effects. Disaster resilience assessment for floods affecting city of Cologne and Rhein-Erft-Kreis. J. Flood Risk Manag. 2020, 13, e312600. [Google Scholar] [CrossRef]
- Cutter, S.L.; Burton, C.G.; Emrich, C.T. Disaster Resilience Indicators for Benchmarking Baseline Conditions. J. Homel. Secur. Emerg. Manag. 2010, 7, 1–25. [Google Scholar] [CrossRef]
- Gwimbi, P. Linking rural community livelihoods to resilience building in flood risk reduction in Zimbabwe. Jàmbá J. Disaster Risk Stud. 2009, 2, 80–89. [Google Scholar] [CrossRef] [Green Version]
- Cox, R.S.; Perry, K.-M.E. Like a Fish Out of Water: Reconsidering Disaster Recovery and the Role of Place and Social Capital in Community Disaster Resilience. Am. J. Community Psychol. 2011, 48, 395–411. [Google Scholar] [CrossRef] [PubMed]
- Boin, A.; McConnell, A. Preparing for Critical Infrastructure Breakdowns: The Limits of Crisis Management and the Need for Resilience. J. Contingencies Crisis Manag. 2007, 15, 50–59. [Google Scholar] [CrossRef]
- Zavaleta, K.W.; Asirvatham, U.; Callies, B.; Franz, W.B.; Scanlan-Hanson, L.; Molella, R.G. Improving Community Resilience through Disaster Simulation: How Simulation-based Education Augments Emergency Management Exercises. J. Homel. Secur. Emerg. Manag. 2018, 15, 20180002. [Google Scholar] [CrossRef]
- Ohara, M.; Nagumo, N.; Shrestha, B.B.; Sawano, H. Evidence-Based Contingency Planning to Enhance Local Resilience to Flood Disasters. In Recent Advances in Flood Risk Management; Abbot, J., Hammond, A., Eds.; IntechOpen: London, UK, 2019; pp. 39–55. [Google Scholar] [CrossRef] [Green Version]
- Pfefferbaum, R.L.; Pfefferbaum, B.; Nitiéma, P.; Houston, J.B.; Van Horn, R.L. Assessing Community Resilience: An Application of the Expanded CART Survey Instrument With Affiliated Volunteer Responders. Am. Behav. Sci. 2014, 59, 181–199. [Google Scholar] [CrossRef]

| Sl. No. | Components | Questions | SFDRR Priority Areas | ||
|---|---|---|---|---|---|
| 1 | Participatory risk assessment | Has the community carried out a participatory risk assessment (hazard analysis, vulnerability and capacity analysis (VCA), impact analysis), shared the findings, and have human resources capable for conducting and updating this assessment? [31,33] | Priority 1: Understanding disaster risk | ||
| 2 | Scientific risk assessment | Does the community combine local knowledge and perceptions of risk with scientific knowledge, data, and assessment methods? [31,33] | |||
| 3 | Dissemination of Disaster Risk Reduction (DRR) information | Have community members been exposed to/have participated in DRR specific awareness events (campaigns, discussions, and training) and have improved awareness and practices as a result? [31,33] | |||
| 4 | Education of children on DRR | Are DRR and recovery knowledge and capacities being passed on to children formally through local schools and informally via oral tradition from one generation to the next? [31,33] | |||
| 5 | DRR in development planning | Does the community see DRR as an integral part of plans and actions to achieve wider community goals (e.g., poverty alleviation, quality of life)? [31,33] | Priority 2: Strengthening disaster risk governance to manage disaster risk | ||
| 6 | DRR in land use planning | Does community decision-making regarding land use and management take disaster risk into account? [31,33] | |||
| 7 | Community decision-making | Is the community leadership committed, effective, and accountable? [31,33] | |||
| 8 | Inclusion of vulnerable groups | Are the vulnerable groups in the community included and represented in community decision-making and management of DRR and recovery? [31,33] | |||
| 9 | Participation of women | Do women participate in community decision-making and management of DRR and recovery? [31,33] | |||
| 10 | Rights awareness and advocacy | Is the community aware of its rights, relevant legal mechanisms, and responsible actors for their fulfillment, and does it advocate for these? [31,33] | |||
| 11 | Partnerships for DRR and recovery | Are there clear, agreed, and stable partnerships between the community and other actors (local authorities, NGOs, businesses, etc.) that provide resources for DRR and recovery? [31,33] | |||
| 12 | Sustainable environmental management | Does the community adopt sustainable environmental management practices that reduce disaster risk and new risks related to the effects of climate change? [31,33] | Priority 3: Investing in disaster risk reduction for resilience | ||
| 13 | Water security and management | Does the community have access to sufficient quantity and quality of water for domestic needs during disasters? [31,33] | |||
| 14 | Health access and awareness | Do community members maintain good health in normal times through appropriate awareness and practices (adequate nutrition, hygiene, and health care access)? [31,33] | |||
| 15 | Secure and sufficient food supply | Does the community have a secure and sufficient food supply during disasters? [31,33] | |||
| 16 | Hazard-resistant livelihood practices | Does the community employ hazard-resistant livelihood practices for food and income security? [31,33] | |||
| 17 | Access to market | Are the local market links for products, labor, and services protected against shocks? [31,33] | |||
| 18 | Access to financial services | Are there affordable and flexible financial services (savings and credit schemes, microfinance), whether formal or informal? [31,33] | |||
| 19 | Income and asset protection | Are household asset bases (income, savings, and convertible property) sufficiently large and diverse, and protected to ensure reduced vulnerability to disaster? [31,33] | |||
| 20 | Social protection | Does the community have access to informal and formal social protection schemes that support disaster risk reduction and recovery? [31,33] | |||
| 21 | Social cohesion and conflict prevention | Is there a sense of peace, security, and effective conflict prevention and mitigation mechanisms, both within the community and with other communities? [31,33] | |||
| 22 | Critical infrastructure | Are the community’s critical infrastructure and basic services resilient to disaster (e.g., located in low-risk areas, using hazard-resistant construction methods, and structural mitigation measures)? [31,33] | |||
| 23 | Housing | Is the community’s housing resilient to disaster (e.g., located in low-risk areas, using hazard-resistant construction methods, and structural mitigation measures)? [31,33] | |||
| 24 | Contingency and recovery planning | Does the community use communally developed contingency and recovery plans that are widely understood and include measures to protect vulnerable groups? [31,33] | Priority 4: Enhancing disaster preparedness for effective response, and to “Build Back Better” in recovery, rehabilitation, and reconstruction | ||
| 25 | Early warning system | Is there an operational early warning system in the community? [31,33] | |||
| 26 | Capacity in preparedness, response, and early recovery | Does the community have a trained and operating organization in disaster preparedness, response, and early recovery? [31,33] | |||
| 27 | Health services in emergencies | Does the community have access to health care facilities and health workers equipped and trained to respond to physical and mental health consequences of disasters, and supported by access to emergency health services, medicines, etc.? [31,33] | |||
| 28 | Education services in emergencies | Do education services have the capacity to continue operating in emergencies? [31,33] | |||
| 29 | Emergency infrastructure | Are emergency shelters (purpose-built or modified) accessible to the community and have adequate facilities to meet basic needs for all of the affected population? [31,33] | |||
| 30 | Leadership and volunteerism in response and recovery | Does the community play a leading role in coordinating preparedness, response, and recovery, reaching all affected people—including the most vulnerable—through organized and trained volunteers? [31,33] | |||
| Measurement Score | |||||
| Score | 1 | 2 | 3 | 4 | 5 |
| Description | Minimum resilience | Low resilience | Medium resilience | Approaching resilience | Resilience |
| Resilience Level | Score | Description |
|---|---|---|
| Very low resilience | 30–45 | Very limited awareness and knowledge of the problem(s). No action taken [31,33] |
| Low resilience | 46–75 | A certain awareness of the problem(s), willingness to act, some actions taken, but actions are fragmented, and solutions are only short term [31,33] |
| Medium resilience | 76–105 | Awareness of the problems and long-term actions taken, but not related to a long-term strategy and/or addressing all aspects of the problem(s) [31,33] |
| Close to resilience | 106–135 | Long-term actions, in accordance with a predefined strategy, addressing the main aspects of the problem(s), but are inhibited by persistent shortcomings in their implementation [31,33] |
| Resilience | 136–150 | Long-term actions are undertaken in accordance with a pre-defined strategy assessing all aspects of the problem(s); they are sustainable and supported by the community [31,33] |
| Sl. No. | Characteristics | Percent | p-Value | Df | |
|---|---|---|---|---|---|
| Study Area 1 | Study Area 2 | ||||
| 1 | Sex | 0.426 | 1 | ||
| Male | 28.8 | 26.8 | |||
| Female | 21.2 | 23.2 | |||
| 2 | Age | 0.002 ** | 36 | ||
| <18 | 2.2 | 1.7 | |||
| 18–25 | 12.7 | 11.9 | |||
| 26–35 | 14.7 | 14.7 | |||
| 36–45 | 10.1 | 12.2 | |||
| >45 | 10.3 | 9.5 | |||
| 3 | Marital status | 0.087 | 2 | ||
| Single | 5.4 | 2.7 | |||
| Married | 44.6 | 47.3 | |||
| 4 | Educational status | 0.024 * | 7 | ||
| No formal education | 23.9 | 25.4 | |||
| Primary level | 11.7 | 16.3 | |||
| Secondary level | 10.7 | 7.4 | |||
| Higher secondary level and above | 3.7 | 0.9 | |||
| 5 | Monthly household expenses (in BDT) | 0.001 ** | 17 | ||
| <5000 | 1.6 | 2.9 | |||
| 5000–10,000 | 37.1 | 41.0 | |||
| 10,000–20,000 | 10.0 | 6.1 | |||
| >20,000 | 1.3 | 0.0 | |||
| 6 | Monthly household income (in BDT) | 0.000 *** | 22 | ||
| <5000 | 0.4 | 2.5 | |||
| 5000–10,000 | 31.6 | 40.6 | |||
| 10,000–20,000 | 14.6 | 6.8 | |||
| >20,000 | 3.4 | 0.1 | |||
| 7 | Number of family member(s) | 0.001 ** | 11 | ||
| <5 | 21.0 | 25.1 | |||
| 5–10 | 27.0 | 24.8 | |||
| >10 | 2.0 | 0.1 | |||
| Sl. No. | Component | σ | p-Value | |||
|---|---|---|---|---|---|---|
| Study Area 1 | Study Area 2 | Study Area 1 | Study Area 2 | |||
| 1 | Participatory risk assessment | 3.67 | 1.78 | 1.032 | 0.538 | 0.000 *** |
| 2 | Scientific risk assessment | 3.50 | 1.86 | 1.008 | 0.570 | |
| 3 | Dissemination of DRR information | 3.24 | 1.77 | 1.241 | 0.509 | |
| 4 | Education of children on DRR | 3.18 | 1.88 | 1.241 | 0.524 | |
| 5 | DRR in development planning | 3.00 | 1.72 | 1.122 | 0.452 | |
| 6 | DRR in land use planning | 2.59 | 1.92 | 0.833 | 0.713 | |
| 7 | Community decision-making | 3.46 | 1.87 | 1.319 | 0.367 | |
| 8 | Inclusion of vulnerable groups | 2.07 | 1.61 | 0.918 | 0.588 | |
| 9 | Participation of women | 2.87 | 1.56 | 1.399 | 0.517 | |
| 10 | Rights awareness and advocacy | 2.91 | 1.72 | 1.312 | 0.520 | |
| 11 | Partnerships for DRR and recovery | 3.31 | 1.56 | 1.501 | 0.497 | |
| 12 | Sustainable environmental management | 2.14 | 1.79 | 1.022 | 0.723 | |
| 13 | Water security and management | 3.92 | 4.07 | 0.794 | 0.671 | |
| 14 | Health access and awareness | 1.91 | 2.98 | 1.020 | 1.014 | |
| 15 | Secure and sufficient food supply | 2.13 | 1.53 | 1.050 | 0.547 | |
| 16 | Hazard-resistant livelihoods practices | 1.84 | 1.62 | 0.685 | 0.579 | |
| 17 | Access to market | 1.61 | 1.30 | 0.659 | 0.458 | |
| 18 | Access to financial services | 2.10 | 1.66 | 1.005 | 0.559 | |
| 19 | Income and asset protection | 1.83 | 1.58 | 0.818 | 0.495 | |
| 20 | Social protection | 2.27 | 1.65 | 1.143 | 0.487 | |
| 21 | Social cohesion and conflict prevention | 3.50 | 3.66 | 0.958 | 0.891 | |
| 22 | Critical infrastructure | 2.13 | 1.66 | 0.989 | 0.474 | |
| 23 | Housing | 2.15 | 1.50 | 1.009 | 0.520 | |
| 24 | Contingency and recovery planning | 2.42 | 1.60 | 0.869 | 0.490 | |
| 25 | Early warning system | 3.41 | 1.60 | 1.475 | 0.566 | |
| 26 | Capacity in preparedness, response and early recovery | 4.08 | 2.08 | 0.772 | 0.527 | |
| 27 | Health services in emergencies | 1.84 | 1.76 | 1.078 | 0.481 | |
| 28 | Education services in emergencies | 1.70 | 1.55 | 0.717 | 0.537 | 0.005 ** |
| 29 | Emergency infrastructure | 3.55 | 4.19 | 1.054 | 0.519 | 0.000 *** |
| 30 | Leadership and volunteerism in response and recovery | 3.29 | 1.53 | 1.425 | 0.573 | |
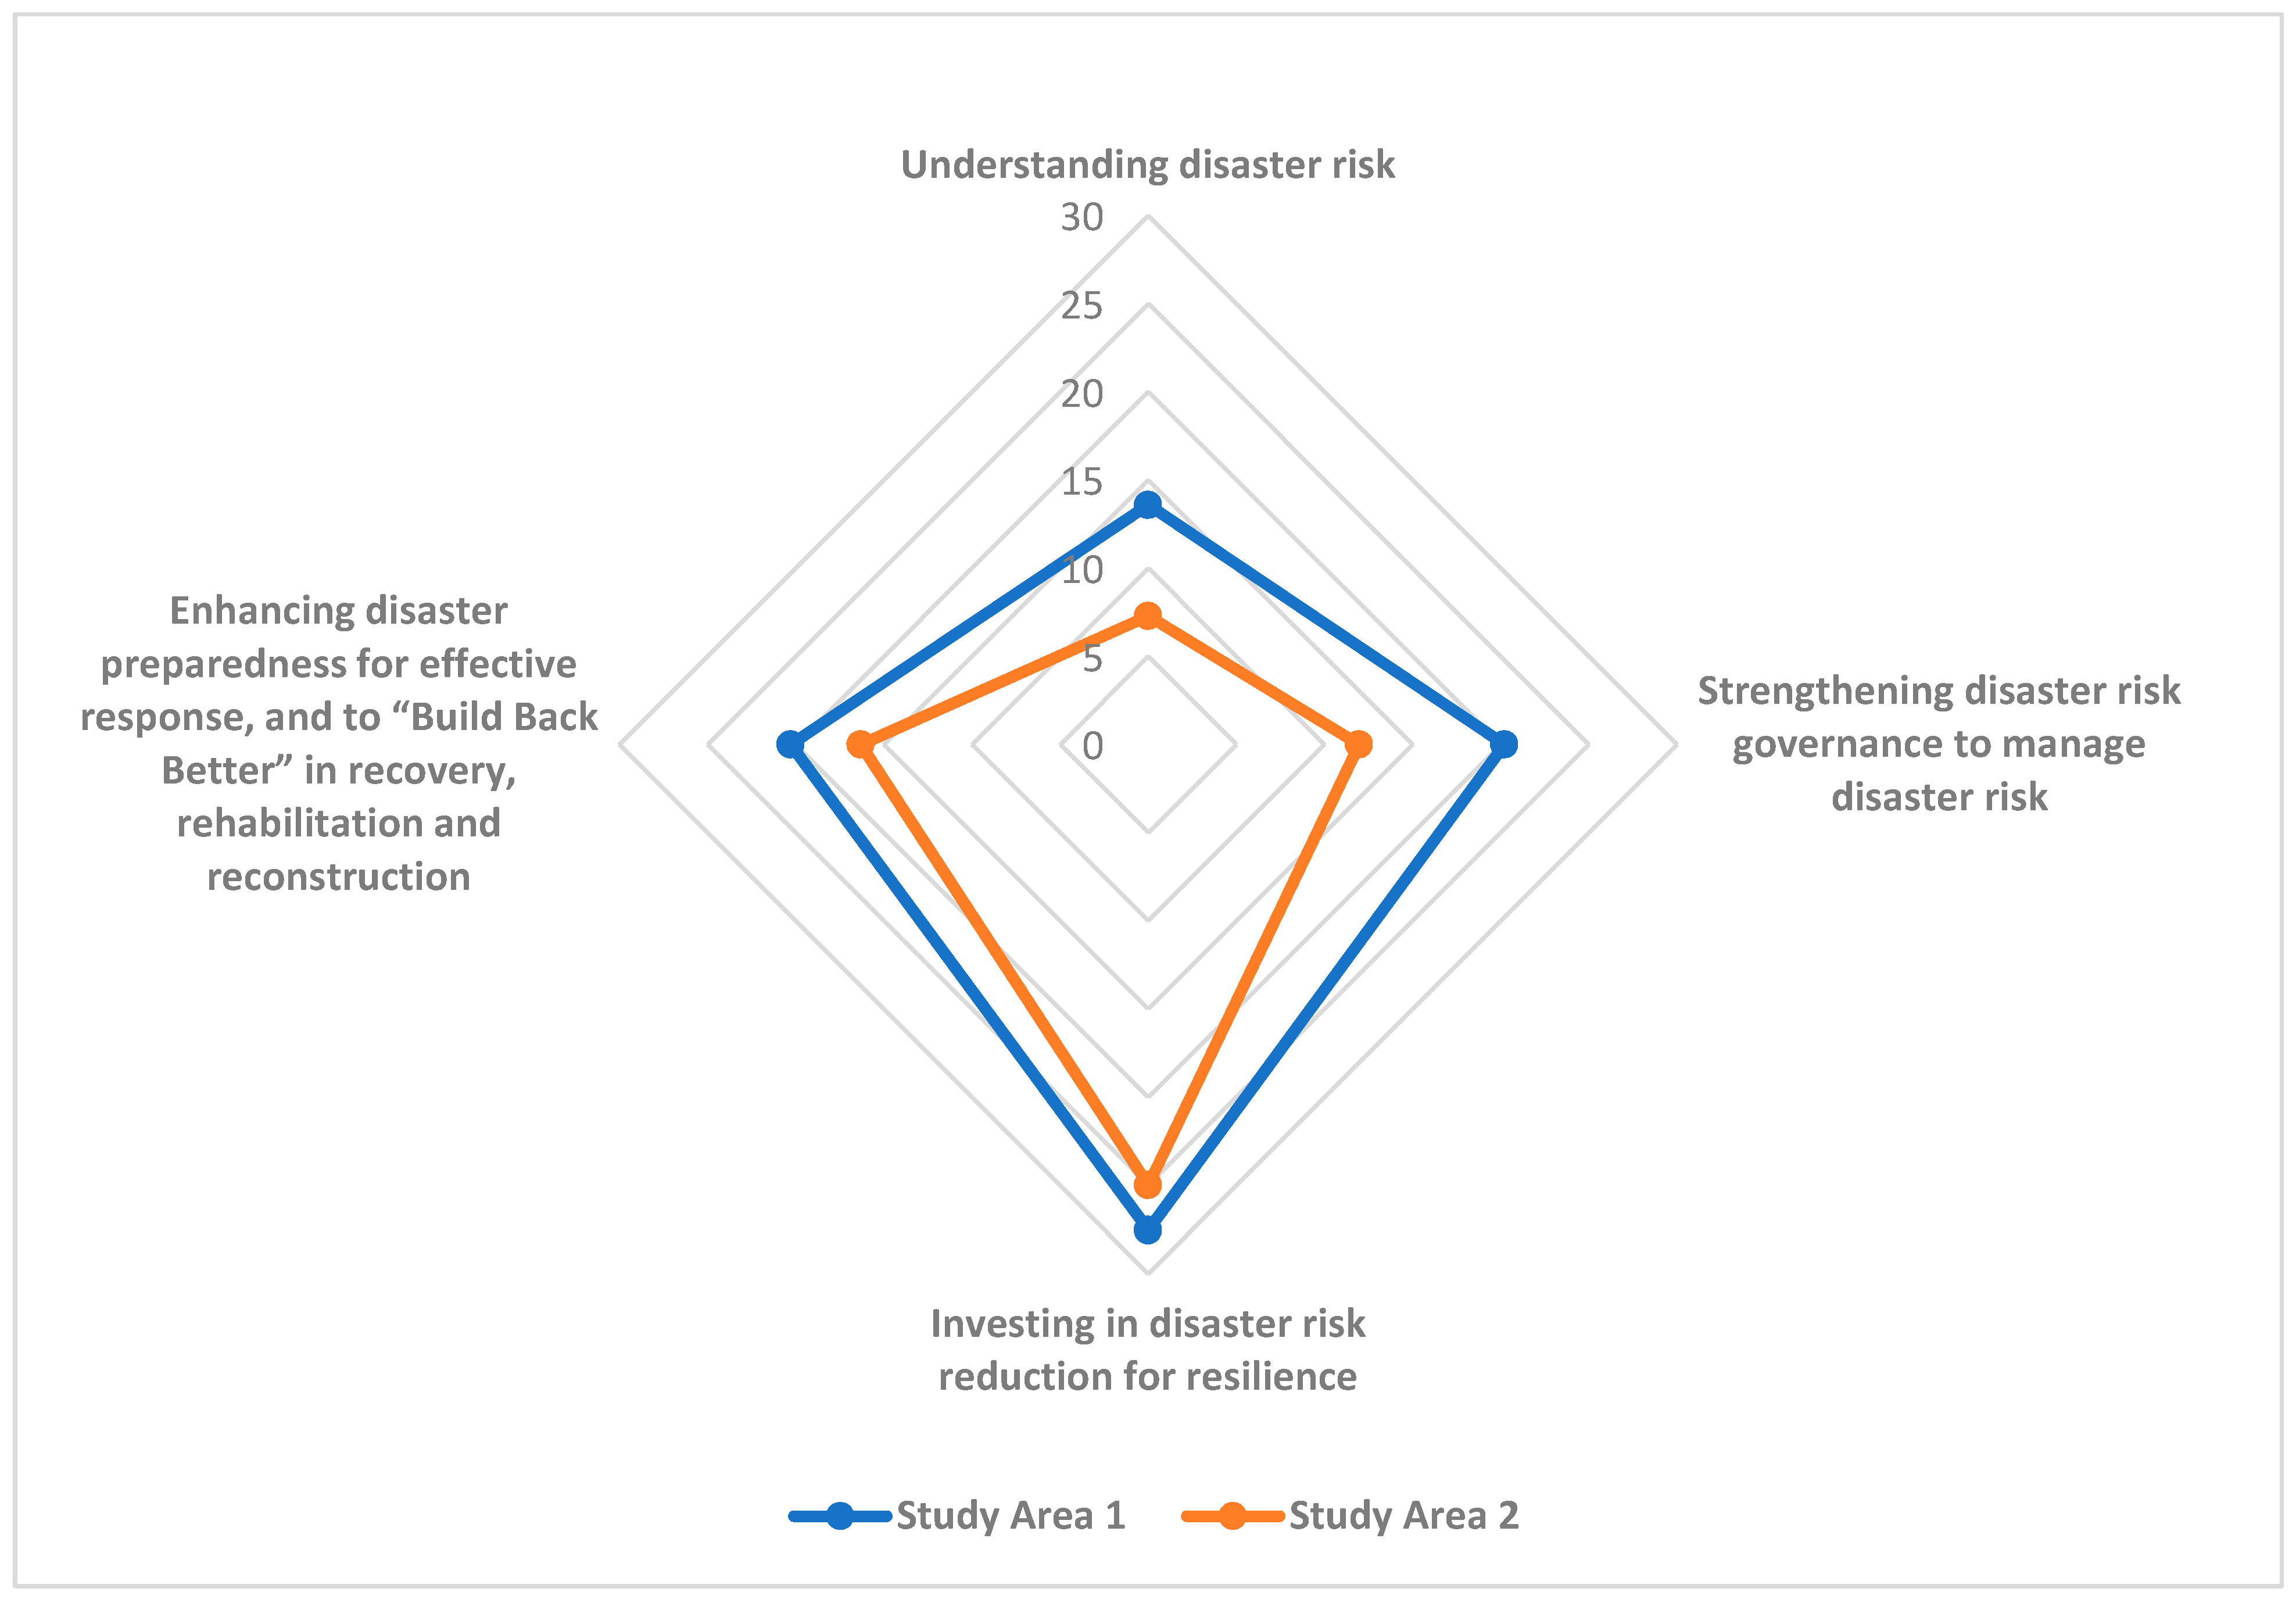
| Total Score | 81.62 | 60.56 | ||||
Publisher’s Note: MDPI stays neutral with regard to jurisdictional claims in published maps and institutional affiliations. |
© 2022 by the authors. Licensee MDPI, Basel, Switzerland. This article is an open access article distributed under the terms and conditions of the Creative Commons Attribution (CC BY) license (https://creativecommons.org/licenses/by/4.0/).
Share and Cite
Islam, M.A.; Chisty, M.A.; Fuad, A.; Rahman, M.M.; Muhtasim, M.; Dola, S.E.A.; Biva, F.J.; Khan, N.A. Using ARC-D Toolkit for Measuring Community Resilience to Disasters. Sustainability 2022, 14, 1758. https://doi.org/10.3390/su14031758
Islam MA, Chisty MA, Fuad A, Rahman MM, Muhtasim M, Dola SEA, Biva FJ, Khan NA. Using ARC-D Toolkit for Measuring Community Resilience to Disasters. Sustainability. 2022; 14(3):1758. https://doi.org/10.3390/su14031758
Chicago/Turabian StyleIslam, Muhammad Awfa, Musabber Ali Chisty, Abdullah Fuad, Md. Mostafizur Rahman, Maliha Muhtasim, Syeda Erena Alam Dola, Fariha Jahin Biva, and Nesar Ahmed Khan. 2022. "Using ARC-D Toolkit for Measuring Community Resilience to Disasters" Sustainability 14, no. 3: 1758. https://doi.org/10.3390/su14031758