Article

Effect of Gasification Char and Recycled Carbon Fibres on the Electrical Impedance of Concrete Exposed to Accelerated Degradation

1
Department of Materials, Environmental Sciences and Urban Planning (SIMAU), Università Politecnica delle Marche—INSTM Research Unit, 60131 Ancona, Italy
2
Department of Industrial Engineering and Mathematical Science (DIISM), Università Politecnica delle Marche, 60131 Ancona, Italy
3
Department of Mechanical Engineering, Politecnico di Milano, 20156 Milano, Italy
*
Authors to whom correspondence should be addressed.
Sustainability 2022, 14(3), 1775; https://doi.org/10.3390/su14031775
Submission received: 29 December 2021 / Revised: 31 January 2022 / Accepted: 2 February 2022 / Published: 4 February 2022
(This article belongs to the Special Issue Sustainable Organic Materials Used in the Construction Sector)

Abstract

:
This paper aims to evaluate the effect of carbon-based conductive recycled additions, i.e., recycled carbon fibres (RCF) and gasification char (GCH), on the mechanical, electrical, and durability properties of concretes. The obtained results show that the compressive strength of concrete is not affected by conductive additions, whereas electrical impedance, measured according to Wenner’s method, is significantly reduced (6%, 30% and 74% with RCF, GCH, and their combination, respectively) to the advantage of self-sensing properties. As durability is concerned, conductive additions slightly increase capillary water absorption, whereas they decrease chloride ingress through diffusion and do not significantly modify carbonation resistance.

1. Introduction

The structural integrity of concrete-based artifacts (buildings, tunnels, bridges, etc.) is of great importance in guaranteeing its safety for the final users and to better manage the structure’s service life costs. From “The Law of Fives” proposed by De Sitter [1], it is well known that the costs for repairing a concrete structure exponentially grow with the time elapsed between the first sign of degradation and intervention. For this reason, research has been active in developing strategies to promptly identify these signs of degradation, strategies which also involve the use of different types of sensors. However, the big question remains: can concrete sense its own condition, including load variations, stress, damage, temperature, or the ingress of aggressive agents? The answer to this question is indeed yes, concrete can. This ability is also referred to as the self-sensing capability of concrete [2]. This ability makes it possible to avoid the use of high-cost embedded sensors, such as fibre optics or continuous carbon fibre, since concrete becomes the sensor itself thanks to the addition of conductive materials [3,4], in the form of both fibres and fillers. As a matter of fact, to take advantage of concrete self-sensing capability, its electrical impedance [5], which is the ability of a material to oppose the flow of electric current, should be measured. Since there are ions in the interstitial solution (linked to the mixing procedure of binder and water [6]), electrolytic conduction takes place in concrete. However, when conductive materials are added, electric conduction also occurs, since the transportation of free electrons through the conductive phase becomes possible [7]. Consequently, measured electrical impedance takes into account both of the above-mentioned conduction mechanisms [8]. It should be underlined that conductive additions enhance the self-sensing properties of concrete since, thanks to the given higher electrical conductivity of concrete, a higher signal-to-noise ratio (SNR) can be obtained that allows the use of relatively low-cost instrumentation to measure electrical impedance, thus enabling the deployment of a distributed monitoring system [9].
As fibres are concerned, though both carbon fibres [10] and steel fibres [11] can be used, the former are commonly preferred, since they do not suffer from possible corrosion phenomena and provide higher electrical conductivity for the same dosage in volume [12,13]. Several types of carbon fibres have been used in the literature, both long and short, even if the latter are cheaper and easier to disperse within the matrix [14], and are the most effective for enhancing the strain sensing ability [15]. Chiarello and Zinno studied the percolation theory of fibres (the “percolation threshold” is the amount of fibres required to make a cement-based composite a conductor, since it significantly increases electrical conductivity [16]), finding values of 0.15 and 0.2 vol% on the total mix for 3 mm and 6 mm long fibres, respectively; moreover, they state that electrical conductivity increases with the fibres length [17,18]. Similarly, Belli et al. [12] found that the percolation zone of both virgin carbon fibres (VCF) and recycled carbon fibres (RCF) is from 0.1 and 0.2 vol% on the total mix. However, other studies report different values of percolation thresholds, namely between 0.4 and 1 vol% [19], depending on the type of composites, fibre aspect ratio, and fibre length [20].
As carbon-based fillers are concerned, several studies report the addition of carbon nanotube (CNT) [21], graphene nanoplatelets (GNP) [22], carbon black [15] and nickel powder [23]. It has been proved that these materials increase the electrical conductivity of mortars/concretes, besides enhancing their piezoresistive behaviour [24,25,26]. However, to the best of the authors’ knowledge, only two studies [27,28] regard the use of industrial by-products, such as gasification char (GCH), as conductive additions to decrease the electrical resistivity of construction materials, whereas others are related to the use of biochar for electromagnetic interference shielding applications [29,30].
Apart from increasing the electrical conductivity of concrete, carbon-based fibres and fillers can also improve its mechanical performance and durability [18,31,32]. It is well known that the ingress of contaminants heavily influences a concrete structure service life. Water can deteriorate a mortar/concrete structure [33] because it is the main carrier of aggressive ions (Cl, SO42-, etc. [34,35]), and/or it facilitates the growth of germs and moulds in the indoor environment [36,37]. Also, CO2 is harmful for concrete-based structures because in the presence of moist air reinforcements yield to corrosion.
The ingress of contaminants should be reliably evidenced by means of proper monitoring techniques in order to avoid the possible premature failure of structures [38]. Therefore, the aim of this study is to evaluate the effect of adding low-cost and “green” carbon-based fillers and fibres to concrete manufactured with a new low-clinker cement, developed within the EnDurCrete project (GA no. 760639) on the mechanical, electrical, and durability properties of concrete during both curing and accelerated degradation tests.
To this aim, RCF and GCH have been introduced in the concrete mix design, both as single addition and coupled together. These materials have been chosen since RCF are sustainable and cheap [39], being obtained by recycling pure virgin carbon fibres, whereas GCH is an industrial by-product obtained by gasification of biomasses, which has no cost and is actually landfilled. Moreover, both RCF and GCH have been already reported by the present authors as good conductive carbon-based additions, instead of commercial ones, in pastes and mortars [12,27,28].
Since electrical impedance is directly linked to the mobility of ions involved in degradation phenomena [40,41,42], degradation tests consisted of exposing concrete specimens to capillary water absorption, salt-spray chamber, accelerated carbonation, chloride penetration, and in correlating the degradation level with the electrical impedance measurement results.

2. Materials and Methods

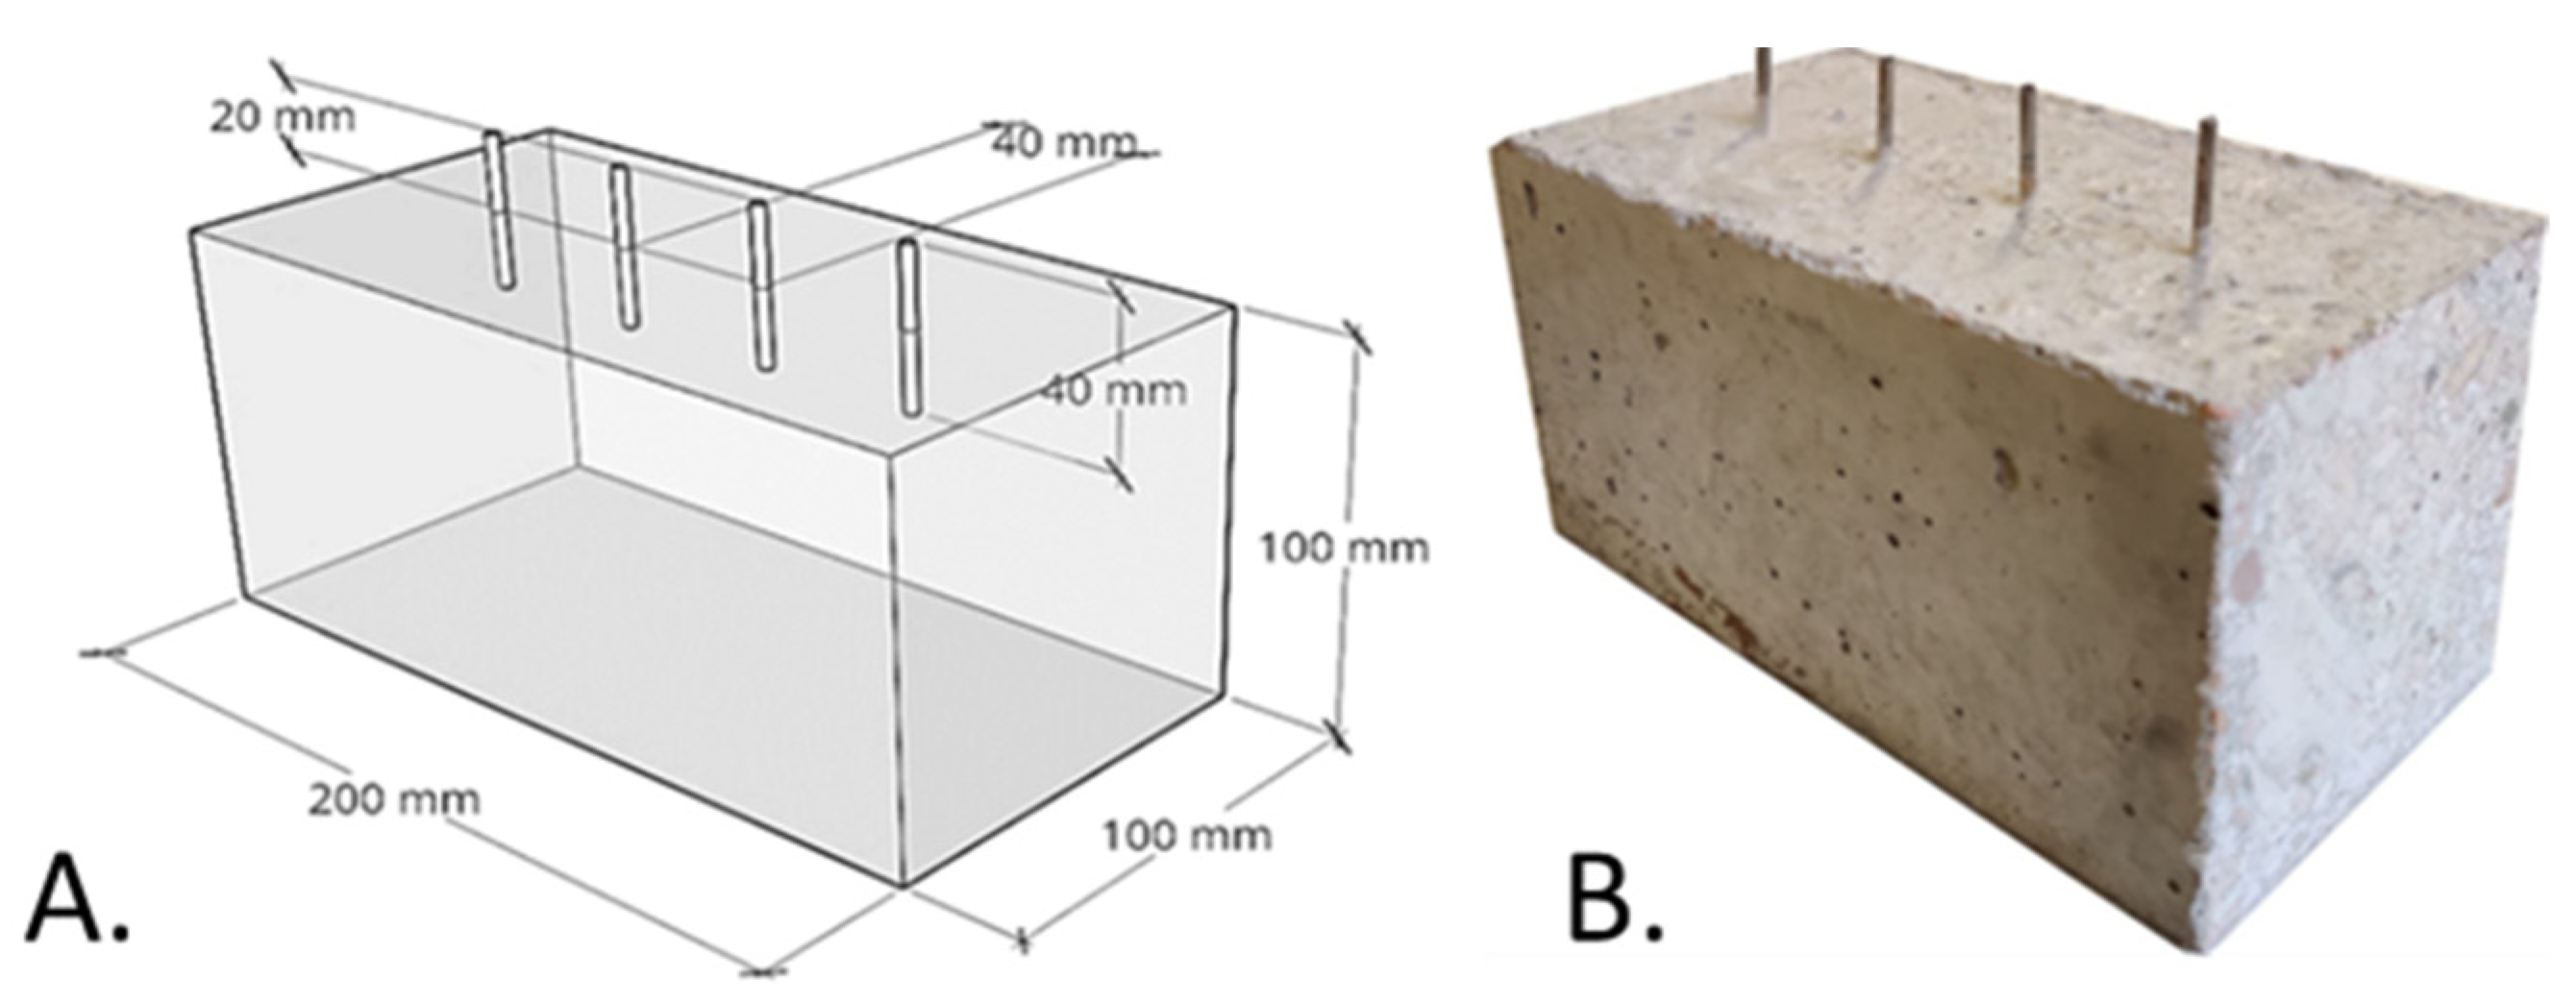
2.1. Concrete Specimens Preparation

Concrete specimens were manufactured with a new cement, CEM II/C-M (S-LL), developed within the frame of the EnDurCrete project [43]; the European Standardization Committee added this low-clinker binder to the common cements class of the standard EN 197-5 in 2021. It is a blend of ordinary Portland cement (50 wt%), ground granulated blast furnace slag (40 wt%), and limestone filler (10 wt%). Three types of aggregates were used in saturated surface dry (s.s.d.) condition; calcareous sand (0/8 mm) was used as fine aggregate, whereas intermediate (5/10 mm) and coarse (10/15 mm) river gravels were employed as coarse aggregates. Water absorption was 3.8%, 3.0%, and 2.3%, for sand, intermediate gravel, and coarse gravel, respectively. The particle size distribution of aggregates is reported in Figure 1.
Two different types of conductive carbon-based additions were used: recycled carbon fibres (RCF) CGF-6 [12] from Procotex Belgium SA and gasification char (GCH) [27]. RCF are obtained by mixing carbon and graphite ex-polyacrylonitrile (PAN) fibres, coming from spools of pure carbon fibres. RCF have a diameter of 7 µm and a length of 6 mm (aspect ratio 857); they are composed of 94% carbon and have a density of 1.85 g/cm3. GCH is obtained by the gasification of wood chips previously dried to reach a moisture content lower than 13%. GCH has a carbon content of 77%, a density of 2.0 g/cm3 and a maximum particle size diameter (Dmax) of 0.5 mm. In order to optimize its dispersion within concrete, GCH was ground for 1 h by means of a ball mill and sieved to reach a particle size distribution lower than 75 μm and then added in dry condition into the concrete mix. An acrylic-based superplasticizer (Dynamon SP1, Mapei S.p.A.) was used as admixture to manufacture concretes with the same workability (S5 class), with a water/cement (w/c) ratio equal to 0.44.
In order to evaluate the effect of conductive additions on the concrete performance, four different compositions were tested: (i) a reference concrete without any addition, labelled as REF, (ii) a concrete with the addition of RCF at 0.05 vol% on the total mix, labelled as RCF, (iii) a concrete with the addition of GCH at 1 vol% on the total mix, labelled as GCH, and iv) a concrete with the addition of both GCH (at 1 vol% on the total mix) and RCF (at 0.05 vol% on the total mix), labelled as GCH+RCF. In this study, RCF were used at 0.05 vol%, which is below their percolation threshold (between 0.1 and 0.2 vol%), since this quantity was also sufficient to obtain a significant decrease of electrical resistivity of mortars [12]. As far as the carbon-based filler is concerned, GCH was added at 1 vol%, since a previous study demonstrates that this concentration is well able to decrease the electrical resistivity of mortars [27].
The mix design of the four compositions is reported in Table 1. It is worth noting that in case of the addition of GCH, to reach the S5 workability class, more admixture was necessary, since GCH decreases the workability of a cement-based mixture, as already reported by Sirico et al. [44] and Mobili et al. [27,28]. This effect is attributed to the high carbon content and porous microstructure of char [44], which causes water retention if added in dry conditions. On the contrary, the addition of RCF at only 0.05 vol% did not lead to a decrease in the workability of concrete.
The concrete batches were mixed according to the following procedure: first, the solid components (sand, gravels, and cement) were mixed for 30 s; later, GCH was added and mixed for 30 s; afterwards, RCF were added and mixed for 30 s. Finally, water was added and mixed for 210 s followed by incorporation of a superplasticizer which was then mixed for 600 s. After the addition of each ingredient, the mixer was stopped to ease the mixing procedure.
After mixing, concretes were poured in different moulds depending on the test to be performed: cubes of 10 cm per side and parallelepiped-shaped moulds of 10 cm × 10 cm × 20 cm dimensions. Concrete specimens were cured in a climatic chamber at a temperature (T) of 20 °C ± 1 °C and a relative humidity (RH) of 95% ± 5% for 28 days, by wrapping them in polyethylene sheets. Then, the plastic sheets were removed, and the specimens were left at room conditions (i.e., T = 20 °C and RH = 50 ± 5%) before testing.

2.2. Mechanical Tests

The compressive strength (Rc) of concretes was measured after 1, 7, and 28 days of curing on three cubic specimens (10 cm per side) according to the EN 12390-3 standard and the average result reported for each test time. After 28 days of curing, the density of hardened concretes was also calculated on the same cubic specimens.

2.3. Electrical Impedance Measurement

For monitoring the electrical impedance of concrete, the adoption of a 4-electrode alternating current (AC) (Wenner’s method [45]) should be preferred to the 2-electrode configuration or direct current (DC), in order to avoid the polarization of both electrode/material interface and material itself [43].
Specimens of a parallelepiped shape were equipped with 4 stainless-steel rods (Ø 3 mm, length 40 mm) serving as electrodes for electrical impedance measurements. The rods were embedded for half of their length (Figure 2) with an inter-electrode spacing equal to 40 mm (greater than 1.5 times the maximum aggregate size, as recommended in ref. [46]).
The excitation current (RMS value: 10 μA) is injected through the external electrodes (i.e., Working Electrode, WE, and Counter Electrode, CE) and the corresponding electric potential difference is measured between the internal ones (i.e., Sensing, S, and Reference Electrode, RE). A Gamry Reference 600 Potentiostat/Galvanostat was used in galvanostatic configuration to measure electrical impedance value at 10 kHz. This frequency was chosen since, as discussed in ref. [43], it provides the best compromise between the ability to detect changes in the material electrical impedance due to contaminants and measurement speed. Only the real part of the electrical impedance was considered in the post-processing phase, since it is the one mostly related to concrete durability [8] and is more easily transferrable to in-field applications [5]. From here on, for ease of readability, the term “electrical impedance” will be used when referring to the real part of electrical impedance (ZRe). Electrical impedance measurements were carried out after 7, 14, 21, and 28 days of curing, and then carried out again at set periods of time during accelerated degradation tests. For each test, three specimens per composition were tested and the average value is reported with the corresponding standard deviation.

2.4. Capillary Water Absorption

After 28 days of curing, concrete specimens of 10 cm x 10 cm × 20 cm dimensions were immersed in distilled water, in an open container, with a 3.5 cm depth that was kept constant throughout all of the test by adding any water that evaporated. Specimens were placed in a horizontal position on specific supports to allow water to penetrate from the bottom surface without hindrance; for REF specimens, vertical positioning was also taken into account (Figure 3). The absorbed water was evaluated by computing water absorbed per unit area (Qi (kg/m2)) according to the EN 15801 standard. Test times for weighing the specimens and carrying out electrical impedance measurements were the following: 0, 10, 20, 30, and 60 min and then 4, 6, 24, 48, 120, 144, and 168 h. For each test, three specimens per composition were tested and the average value is reported.

2.5. Chloride Penetration

After 28 days of curing, a chloride penetration test was set up per the method described in ref. [43]. The concrete specimens of 10 cm × 10 cm × 20 cm dimensions were placed horizontally on specific cylindrical supports inside an open plastic box and partially immersed (9 cm) in a 3.5% NaCl solution for 28 days (Figure 4). The level of the solution was kept constant by adding new solution to replace the solution that evaporated. To avoid corrosion, plasticine was used to seal sensing electrodes.
After 0, 7, 21, and 28 days, the free chloride concentration was measured following the UNI 9944 standard. Cubic specimens (at the same exposure conditions of parallelepiped-shaped ones) were drilled to collect powder samples (approximately 5 g) at 0–30 mm depth. The powder sample was suspended in 20 mL of distilled water, mixed for 24 h, diluted in 100 mL of distilled water and analysed to obtain the chloride content by the cement weight (wt%). Electrical measurements were carried out at 0, 7, 14, 21, and 28 days test periods. For each test, three specimens per composition were tested and the average value is reported.

2.6. Salt-Spray Chamber

After 28 days of curing, salt-spray chamber tests (Figure 5) were performed according to the EN ISO 9227 standard in a warm, humid and chloride-rich environment (T = 35 ± 2 °C, RH = 95–98%, NaCl = 5%). Concrete specimens of 10 cm × 10 cm × 20 cm dimensions were placed horizontally on proper supports inside the salt-spray chamber (ACS DCTC 600 P). As for chloride penetration test, plasticine was used to seal electrodes in order to prevent corrosion and a free chloride concentration analysis was performed at 0, 7, 21, and 28 days. For each test, three specimens per composition were tested and the average value is reported.

2.7. Accelerated Carbonation and Phenolphthalein Test

After 28 days of curing, accelerated carbonation test was carried out in a CO2 chamber (Figure 6) at T = 21 ± 1 °C, RH = 60 ± 10%, CO2 = 3 ± 0.2 vol%. The CO2 content was three times higher than the one suggested by the standard EN 13295 [46] to accelerate concrete carbonation. Carbonation depth was measured by means of phenolphthalein test according to the EN 13295 standard. The carbonation depth is defined as the average distance, measured in mm, from the surface of the concrete or mortar where the CO2 has reduced the alkalinity of the hydrated cement to an extent such that an indicator solution based on phenolphthalein remains colourless. In particular, two cubic concrete specimens per composition (side: 10 cm, same composition and same curing conditions/time and exposed to the same conditions of those with electrodes) were cut into two halves and the broken surface was sprayed with 1% solution of phenolphthalein in alcohol. Purple-red coloration is obtained where concrete is not carbonated (since it is highly alkaline), whereas the carbonated region remains uncoloured (Figure 7). Indeed, phenolphthalein changes its colour at approximately pH = 9, when steel corrodes in the presence of moist air. Before putting the concrete cubes back inside the CO2 chamber, the broken surfaces were silicone-sealed to prevent the ingress of CO2; the halves were further split into two at the subsequent testing time. The carbonation depth can be modelled through the following equation:
x = k√t,
where: x is the carbonated thickness (in mm), k is the carbonation coefficient (in mm/√days), and t is the time (in days).

3. Results and Discussion

3.1. Curing Period: Mechanical Strength and Electrical Impedance Results

Results in terms of compressive strength during curing are reported in Table 2. Generally, mechanical performance of concretes is comparable at early ages; however, after 28 days, the addition of RCF and GCH slightly increases the compressive strength compared with concrete without additions (REF). This effect has already been reported in the literature, where a low amount of RCF (up to 0.8 vol%) leads to enhanced compressive strength thanks to the ability of the fibres to prevent the growth of micro-cracks [12]. Moreover, the carbon micro-particles, which cover the surface of RCF, increase the specific surface of the fibres, working as nucleation sites for the formation of C–S–H crystals on their length [47], as reported by the present authors in refs. [12,27]. Conversely, some authors have also found a decrease of mechanical strength, which has been attributed to the length of the fibres, since a higher length hinders the dispersion in the mix [39], or to the fibres quantity, since too high a content of carbon fibres would cause clumping and bundling effects, resulting in the formation of air voids [18].
Concerning GCH, the enhanced compressive strength of cement-based composites manufactured with this material is related to the high surface area of GCH particles, which contributes to the growth of hydration products, and their ability to fill the voids between solid particles thanks to their small dimension, as already found by Gupta and Kua [48]. Moreover, as reported by Mrad and Chehab [49], the porous structure of GCH particles allows the migration of absorbed water to the surrounding paste, thus promoting the hydration reactions and densifying the interfacial transition zone (ITZ). However, there are also studies showing a decrease of Rc of concrete when char is added. Sirico et al. [44] report a slight decrease in compressive strength, which increases with the increase of GCH added to the mix. Belletti et al. [50] found that char added at 1% by weight of cement in mortars decreases by 11% the Rc value after 28 days of curing. Falliano et al. [51] found that in foamed concretes the addition of char more than 2% by weight of cement reduces the compressive strength by 50%. In the present study, when GCH is combined with RCF, a slight decrease in compressive strength (approximately 9%) is detected.
At the chosen amounts, the carbon-based additions do not modify the density of the specimens both alone and coupled together (Table 2).
As expected [41], the measured electrical impedance values increase with curing (Figure 8) because of the hydration process, which makes the microstructure less porous and with pores of smaller dimensions. Carbon-based additions have an important effect in decreasing the electrical properties of concrete at all test times; in particular, after 28 days of curing, electrical impedance decreases by 6%, 30%, and 74% than REF when considering RCF, GCH, and their combined use, respectively. This is in accordance with literature results, where 6-mm long RCF, even at low dosages of 0.05 vol%, decrease the electrical resistivity of mortars considerably [12]. Concerning GCH, a recent study reports that the addition of GCH in cement-based mortars reduces the electrical impedance of 42% [27], thanks to its high carbon content (77%) [27,28]. The reduced electrical impedance registered in the GCH+RCF specimen is related to the combined use of RCF and GCH, which enhances the electrical connectivity of the material. As also reported by Wen and Chung in [15], the filler particles interposing between adjacent fibres enhance the electrical connectivity of the composite, thus resulting in a synergistic effect.

3.2. Capillary Water Absorption Results

After 28 days of curing, concrete specimens were subjected to a capillary absorption test. The first set of experiments was performed only on REF specimens placed in two different positions, namely horizontally and vertically, with respect to the water ingress direction. Then, the best position for the measurement of the electrical impedance value was adopted for testing all four of the concrete compositions.

3.2.1. Effect of the Specimen Position on the Measurement of the Electrical Impedance Value

The water absorbed per unit area of both horizontal and vertical REF specimens is reported in Figure 9. The two curves related to the vertical and horizontal positions are similar, since the specimens absorb the same amount of water regardless of their position. The specimens reach saturation when the water absorption curve becomes horizontal, after 5 days of exposure (120 h). As expected, water ingress makes the concrete electrical resistivity decrease [52] (Figure 8). However, comparing the results obtained on REF specimen in horizontal and vertical configurations (Figure 10), the water penetrating the specimen needs more time to reach the sensing volume (i.e., the volume affected by the excitation current lines) when the specimen is placed vertically. As a matter of fact, whereas in the horizontal position ZRe values show a decreasing trend up to 120 h, in the vertical position ZRe values slightly decrease but only between 48 h and 120 h, meaning that water penetration is not detectable in the vertical specimen at earlier test times. The slight increase of electrical impedance until 48 h could be ascribed to the curing process of concrete [5]. It is worth noting that after five days (i.e., 120 h) of exposure, when specimens have reached saturation, electrical impedance starts to increase in both configurations. Therefore, what is measured after that time is probably linked only to the curing of concrete, which determines an increase of the ZRe value, and which is prevailing on water ingress. In fact, curing increases the hydration products and therefore leads to microstructure modification; when hydration products block the pores conduction path and tortuosity increases, electrical resistivity (and therefore electrical impedance) sharply increases [5].
Since water probably does not reach the sensing volume on the vertical specimen, this provides an interesting hint as far as electrodes installation is concerned: the sensing electrodes should be installed facing the area of the specimen in which water ingress is expected to occur (horizontal position). Given this, capillary water absorption (on GCH, RCF, and GCH+RCF specimens) and chloride penetration tests were carried out with specimens placed horizontally.

3.2.2. Effect of the Different Compositions on the Measurement of the Electrical Impedance Value (Horizontal Positioning)

Electrical impedance progressively decreases while water is absorbed, as reported also by Liu et al. [53]. Absorbed water increases over test time (Figure 11) and carbon-based additions (in particular RCF) seem to increase the Qi value in time. This is in line with what has been found by Belli et al. [12], when RCF at 0.05 vol% are added to cement-based mortars. Concerning GCH, literature already reports that pyrolytic biochar, a material similar to gasification char, increases water sorptivity of cement mortars if it is CO2-saturated [54] (as probably in the present case, where char has been tested after a long period of storage in the environment). Tibbetts et al. [55] attributed this effect to the fact that conductive additions decrease electrical resistivity, thus increasing the total charge passed and increasing water permeability. Moreover, it is possible to notice that, in the last day of the test, there is a rapid increase of Qi in both RCF and GCH specimens, meaning that they have not reached saturation as opposed to REF, which is mirrored by a slight decrease of electrical impedance (Figure 12). The visual aspect of specimens (Figure 13) shows that REF is the least porous one, whereas all the other specimens containing carbon-based additions are characterized by a distributed macroporosity all over their surface. It is known that carbon fibres are difficult to distribute homogeneusly in cement-based materials [56]. Therefore, the increased amount of voids in RCF specimens could be related to the entanglement of fibres when they are incorporated into the cement matrix. Indeed, during mixing, the air in the carbon-fibre bundles is squeezed to the neaby areas, thus generating voids [57]. As reported by Gupta et al. [36], increased porosity is found in mortars where the amount of char is higher than 5% by weight of cement. Moreover, they have reported that the lower flowability of mixes with char at 5–8 wt% affects the compactness of mortars, leading to increased voids in the hardened specimens. In the present experimentation, similar results are found, since GCH added at 0.5% on total volume of concrete corresponds to 5.5% by weight of cement. The increased porosity, also visible in specimens containing both RCF and GCH, is related to the air entrapped by the two types of additions. As a matter of fact, RCF+GCH concrete is also the specimen with the lower compressive strength after 28 days of curing (Table 2).
By correlating electrical impedance and water absorbed per unit area (Figure 14), water penetration is reflected in an immediate decrease of electrical impedance value. Moreover, conductive additions seem to decrease the water penetration depth: in fact, the electrical impedance of specimens with conductive additions changes its trend and begins to lean toward higher Qi values compared with the REF specimen, probably because less water is reaching the sensing volume. Even if the total water amount absorbed by the specimen is higher, conductive additions could behave like a barrier, retaining water and slowing its penetration into deeper layers, as reported by Gupta et al. [36].

3.3. Chloride Penetration Results

The free chloride concentration measured on concrete specimens during the test exposure is reported in Figure 15. The reference mixture is the one less subjected to the penetration of Cl ions. All carbon-based additions increase the free chloride content at each testing period and RCF+GCH specimen shows the highest chloride concentration, in particular with the increase in immersion time. This effect is linked to the above-mentioned increased water absorption, the higher the water suction, the higher the chloride concentration.
Electrical impedance is expected to decrease with chloride penetration [58]; in fact, after just the first week of measurements (i.e., seven days of exposure) all specimens show a decrease of electrical impedance values (Figure 16). This effect is related to the changes of environmental conditions, since at 0-time specimens are tested at room conditions, whereas at seven days specimens are extracted from the chloride-rich solution, so they move from dry to wet conditions. However, for longer test periods, curing gives an increase in electrical impedance, counterbalancing the decreasing effect due to chloride penetration. Thus, after seven days the resulting electrical impedance increases over time.
As correlation between electrical impedance and free chloride concentration is concerned (Figure 17), chloride penetration can be detected as an immediate decrease in electrical impedance only up to seven days of contact with the chloride solution. After seven days, curing becomes the prevailing effect, giving an overall increase of the electrical impedance value on the studied compositions.

3.4. Salt-Spray Chamber Results

Free chloride concentration measured on concrete during the exposure of specimens in a salt-spray chamber is reported in Figure 18. In this case, all the tested carbon-based additions seem to make concrete more resistant to chloride penetration, something which is different to when chlorides penetrate from the contact with a chloride-rich solution. This is due to the different penetration mechanisms of chlorides: in the salt-spray chamber chlorides move by diffusion generated by a concentration gradient, whereas in chloride penetration test chlorides move by capillary water absorption generated by the chloride-rich solution capillary pressure [59]. In this case, as expected, chlorides penetrate much less by concentration gradient than by the capillary pressure of the chloride-rich solution. Therefore, when exposed to the salt-spray environment, penetrated chlorides remain in the upper layers of the concrete. Given this, since carbon-based additions could behave like a barrier slowing the penetration of water, and therefore contaminants, into deeper layers, as reported in ref. [36], the specimens containing GCH and RCF show a lower chloride content than the REF specimen.
Also in this case, as chlorides penetrate within the specimen, electrical impedance decreases (Figure 19) [58]. For all the tested specimens, the most evident changes in electrical impedance were again up to seven days, when concrete moves from dry to wet conditions; whereas as time progresses, electrical impedance values slightly increase. As for the previous test, even if the concentration of free chlorides continues to increase, the electrical impedance seems to become more affected by the microstructural changes of the cement matrix due to curing, which gives an increase in electrical impedance rather than to external aggressive agents (i.e., chlorides) which should give a decrease in electrical impedance.
The correlation between electrical impedance and free chloride content on cement weight (Figure 20) suggests that, in the present experimentation, chloride penetration is reflected by an immediate decrease of electrical impedance but only at short periods of contact time; afterwards, curing becomes the prevailing effect.

3.5. Accelerated Carbonation Results

The carbonation depth measured on concrete specimens exposed to the CO2 chamber is reported in Figure 21; as expected, carbonation depth increases over time. Moreover, all specimens show similar carbonation values at the end of the test, meaning that the addition of carbon-based recycled materials at the selected percentages does not alter the carbonation process of concrete. In particular GCH, given its affinity for non-polar compounds and high amount of surface pores [54], could be considered a CO2 catcher or “carbon negative material” [60,61]. However, in the present study GCH was probably already CO2 saturated due to its long storage in the environment before being added to the mixes, and therefore does not affect the carbonation depth of the concrete specimens.
Since carbonation decreases the ion concentration of the interstitial fluid [62], due to the transformation of Ca(OH)2 in CaCO3 that precipitates in the pore solution, it gives an increase of electrical impedance values (Figure 22); different to water and chloride penetration, this degradation mechanism gives the same effect on electrical impedance as curing.
Therefore, correlating electrical impedance and carbonation depth (Figure 23), it can be concluded that carbonation can be detected as an increase in electrical impedance. Moreover, when the exposure time increases, the trends of the electrical impedance values change their slopes because of the sum of carbonation and curing effects on electrical impedance values (both making the electrical impedance increase).

4. Conclusions

Low-cost and “green” carbon-based conductive additions, namely recycled carbon fibres (RCF) and gasification char (GCH), have been used to decrease the electrical impedance of concrete in order to enhance its self-sensing properties. Their effect on the concrete performance has been investigated not only in terms of electrical impedance by Wenner’s method, but also in terms of compressive strength and durability during exposure to capillary water absorption, chloride penetration, salt-spray chamber and accelerated carbonation.
Results obtained have shown that:
  • Both RCF and GCH significantly decrease electrical impedance of concrete (6% and 30%, respectively, with respect to REF concrete) and the effect is enhanced when they are used together (74%);
  • Conductive additions do not significantly modify the compressive strength of concrete (only a slight decrease of 9% is detected when RCF and GCH are added together);
  • The configuration adopted to measure electrical impedance has proved to be suitable since electrical impedance varies with curing time and the penetration of aggressive agents;
  • Curing gives an increase in electrical impedance, independently from the conductive additions; the absolute increase is less marked in concrete with conductive additions, even if the trends over time are similar;
  • Water and chloride ingress give a decrease in the electrical impedance of concrete (trends of the tested concrete types are similar, even if absolute values depend on the concrete composition; maximum decrease of approximately 14% with respect to 0-time);
  • Carbonation gives an increase in the electrical impedance of concrete (approximately +150% over the test period of 28 days);
  • The changes in concrete conditions can be sensed by the electrodes provided that aggressive agents evenly reach the sensing volume, otherwise results will reflect only the curing effect (resulting in increasing electrical impedance);
  • It is preferable to install sensing electrodes oriented towards the face where the ingress of aggressive agents is foreseen, allowing contaminants to reach the sensing volume more easily;
  • Conductive additions increase water penetration (maximum approximately +24% in case of RCF concrete with respect to REF);
  • The effect of conductive additions on chloride ingress depends on the transport mechanism: when diffusion is involved (salt-spray chamber test), conductive additions seem to decrease the penetration (with a maximum of approximately –33% in case of RCF with respect to REF concrete); on the contrary, if capillary absorption is the governing mechanism, chloride penetration is increased (approximately +60% in case of RCF+GCH with respect to REF);
  • Carbonation seems to be unaffected by conductive additions, both when these additions are used alone and together as fibres and fillers.
In light of the above results, sustainable and low-cost carbon-based waste or by-products could also be added to enhance the self-sensing concrete properties, since they are effective in decreasing the electrical impedance of concrete, allowing the possibility to use low-cost instrumentation, thanks to the high SNR obtained, without considerably affecting the mechanical performance or durability features.

Author Contributions

Conceptualization, A.M., G.C., N.G., P.C., T.B., G.M.R. and F.T.; methodology, A.M., G.C., N.G. and P.C.; software, A.M., G.C., N.G. and P.C.; validation, A.M., G.C., N.G. and P.C.; formal analysis, A.M., G.C., N.G. and P.C.; investigation, A.M., G.C., N.G. and G.P.; data curation, A.M., G.C., N.G. and P.C.; writing—original draft preparation, A.M. and G.C.; writing—review and editing, P.C., G.P., T.B., G.M.R. and F.T.; supervision, P.C., T.B., G.M.R. and F.T.; funding acquisition, G.M.R. All authors have read and agreed to the published version of the manuscript.

Funding

This research activity was carried out within the EnDurCrete (New Environmental friendly and Durable conCrete, integrating industrial by-products and hybrid systems, for civil, industrial and offshore applications) project, funded by the European Union’s Horizon 2020 research and innovation programme under grant agreement n° 760639.

Institutional Review Board Statement

Not applicable.

Informed Consent Statement

Not applicable.

Data Availability Statement

Data is contained within the article.

Acknowledgments

The authors would like to thank HeidelbergCement AG group for having provided cement to cast concrete and Procotex Belgium SA for the recycled carbon fibres kindly offered for this work.

Conflicts of Interest

The authors declare no conflict of interest.

References

  1. De Sitter, W.R. Costs of service life optimization “The Law of Fives”. In Proceedings of the CEB-RILEM Workshop on Durability of Concrete Structures, Copenhagen, Denmark, 18–20 May 1983; pp. 131–134. [Google Scholar]
  2. Chung, D.D.L. Carbon materials for structural self-sensing, electromagnetic shielding and thermal interfacing. Carbon 2012, 50, 3342–3353. [Google Scholar] [CrossRef]
  3. Yıldırım, G.; Öztürk, O.; Al-Dahawi, A.; Ulu, A.A.; Şahmaran, M. Self-sensing capability of Engineered Cementitious Composites: Effects of aging and loading conditions. Constr. Build. Mater. 2020, 231, 117132. [Google Scholar] [CrossRef]
  4. Mohammed, A.; Sanjayan, J.G.; Duan, W.H.; Nazari, A. Incorporating graphene oxide in cement composites: A study of transport properties. Constr. Build. Mater. 2015, 84, 341–347. [Google Scholar] [CrossRef]
  5. Cosoli, G.; Mobili, A.; Tittarelli, F.; Revel, G.M.; Chiariotti, P. Electrical Resistivity and Electrical Impedance Measurement in Mortar and Concrete Elements: A Systematic Review. Appl. Sci. 2020, 10, 9152. [Google Scholar] [CrossRef]
  6. Whittington, H.W.; McCarter, W.J.; Forde, M.C. The conduction of electricity through concrete. Mag. Concr. Res. 1981, 33, 48–60. [Google Scholar] [CrossRef]
  7. Donnini, J.; Bellezze, T.; Corinaldesi, V. Mechanical, electrical and self-sensing properties of cementitious mortars containing short carbon fibers. J. Build. Eng. 2018, 20, 8–14. [Google Scholar] [CrossRef]
  8. Berrocal, C.G.; Hornbostel, K.; Geiker, M.R.; Löfgren, I.; Lundgren, K.; Bekas, D.G. Electrical resistivity measurements in steel fibre reinforced cementitious materials. Cem. Concr. Compos. 2018, 89, 216–229. [Google Scholar] [CrossRef] [Green Version]
  9. Giulietti, N.; Chiariotti, P.; Cosoli, G.; Giacometti, G.; Violini, L.; Mobili, A.; Pandarese, G.; Tittarelli, F.; Revel, G.M. Continuous monitoring of the health status of cement-based structures: Electrical impedance measurements and remote monitoring solutions. Acta Imeko 2021, 10, 132–139. [Google Scholar] [CrossRef]
  10. Wen, S.; Chung, D.D.L. The role of electronic and ionic conduction in the electrical conductivity of carbon fiber reinforced cement. Carbon 2006, 44, 2130–2138. [Google Scholar] [CrossRef]
  11. Wen, S.; Chung, D.D.L. A comparative study of steel- and carbon-fibre cement as piezoresistive strain sensors. Adv. Cem. Res. 2003, 15, 119–128. [Google Scholar] [CrossRef]
  12. Belli, A.; Mobili, A.; Bellezze, T.; Tittarelli, F. Commercial and recycled carbon/steel fibers for fiber-reinforced cement mortars with high electrical conductivity. Cem. Concr. Compos. 2020, 109, 103569. [Google Scholar] [CrossRef]
  13. Chung, D.D.L. Piezoresistive Cement-Based Materials for Strain Sensing. J. Intell. Mater. Syst. Struct. 2002, 13, 599–609. [Google Scholar] [CrossRef]
  14. Chung, D.D.L. Dispersion of Short Fibers in Cement. J. Mater. Civ. Eng. 2005, 17, 379–383. [Google Scholar] [CrossRef]
  15. Wen, S.; Chung, D.D.L. Partial replacement of carbon fiber by carbon black in multifunctional cement–matrix composites. Carbon 2007, 45, 505–513. [Google Scholar] [CrossRef]
  16. Xie, P.; Gu, P.; Beaudoin, J.J. Electrical percolation phenomena in cement composites containing conductive fibres. J. Mater. Sci. 1996, 31, 4093–4097. [Google Scholar] [CrossRef]
  17. Chiarello, M.; Zinno, R. Electrical conductivity of self-monitoring CFRC. Cem. Concr. Compos. 2005, 27, 463–469. [Google Scholar] [CrossRef]
  18. Han, B.; Zhang, L.; Zhang, C.; Wang, Y.; Yu, X.; Ou, J. Reinforcement effect and mechanism of carbon fibers to mechanical and electrically conductive properties of cement-based materials. Constr. Build. Mater. 2016, 125, 479–489. [Google Scholar] [CrossRef] [Green Version]
  19. Wu, J.; Liu, J.; Yang, F. Three-phase composite conductive concrete for pavement deicing. Constr. Build. Mater. 2015, 75, 129–135. [Google Scholar] [CrossRef]
  20. Chung, D.D.L. Electrically conductive cement-based materials. Adv. Cem. Res. 2004, 16, 167–176. [Google Scholar] [CrossRef]
  21. Siddique, R.; Mehta, A. Effect of carbon nanotubes on properties of cement mortars. Constr. Build. Mater. 2014, 50, 116–129. [Google Scholar] [CrossRef]
  22. Le, J.-L.; Du, H.; Pang, S.D. Use of 2D Graphene Nanoplatelets (GNP) in cement composites for structural health evaluation. Compos. Part B Eng. 2014, 67, 555–563. [Google Scholar] [CrossRef]
  23. Han, B.G.; Han, B.Z.; Ou, J.P. Experimental study on use of nickel powder-filled Portland cement-based composite for fabrication of piezoresistive sensors with high sensitivity. Sens. Actuators A Phys. 2009, 149, 51–55. [Google Scholar] [CrossRef]
  24. Monteiro, A.O.; Cachim, P.B.; Costa, P.M.F.J. Self-sensing piezoresistive cement composite loaded with carbon black particles. Cem. Concr. Compos. 2017, 81, 59–65. [Google Scholar] [CrossRef]
  25. Tao, J.; Wang, X.; Wang, Z.; Zeng, Q. Graphene nanoplatelets as an effective additive to tune the microstructures and piezoresistive properties of cement-based composites. Constr. Build. Mater. 2019, 209, 665–678. [Google Scholar] [CrossRef]
  26. Belli, A.; Mobili, A.; Bellezze, T.; Tittarelli, F.; Cachim, P. Evaluating the Self-Sensing Ability of Cement Mortars Manufactured with Graphene Nanoplatelets, Virgin or Recycled Carbon Fibers through Piezoresistivity Tests. Sustainability 2018, 10, 4013. [Google Scholar] [CrossRef] [Green Version]
  27. Mobili, A.; Giosuè, C.; Bellezze, T.; Revel, G.M.; Tittarelli, F. Gasification Char and Used Foundry Sand as Alternative Fillers to Graphene Nanoplatelets for Electrically Conductive Mortars with and without Virgin/Recycled Carbon Fibres. Appl. Sci. 2021, 11, 50. [Google Scholar] [CrossRef]
  28. Mobili, A.; Belli, A.; Giosuè, C.; Pierpaoli, M.; Bastianelli, L.; Mazzoli, A.; Ruello, M.L.; Bellezze, T.; Tittarelli, F. Mechanical, durability, depolluting and electrical properties of multifunctional mortars prepared with commercial or waste carbon-based fillers. Constr. Build. Mater. 2021, 283, 122768. [Google Scholar] [CrossRef]
  29. Khalid, A.; Khushnood, R.A.; Mahmood, A. Impact of pyrolytic carbonaceous nano inerts addition on fracture and electromagnetic interference shielding characteristics of cementitious composites. Theor. Appl. Fract. Mech. 2019, 103, 102320. [Google Scholar] [CrossRef]
  30. Khushnood, R.A.; Ahmad, S.; Savi, P.; Tulliani, J.-M.; Giorcelli, M.; Ferro, G.A. Improvement in electromagnetic interference shielding effectiveness of cement composites using carbonaceous nano/micro inerts. Constr. Build. Mater. 2015, 85, 208–216. [Google Scholar] [CrossRef]
  31. Tong, T.; Fan, Z.; Liu, Q.; Wang, S.; Tan, S.; Yu, Q. Investigation of the effects of graphene and graphene oxide nanoplatelets on the micro- and macro-properties of cementitious materials. Constr. Build. Mater. 2016, 106, 102–114. [Google Scholar] [CrossRef]
  32. Chuah, S.; Pan, Z.; Sanjayan, J.G.; Wang, C.M.; Duan, W.H. Nano reinforced cement and concrete composites and new perspective from graphene oxide. Constr. Build. Mater. 2014, 73, 113–124. [Google Scholar] [CrossRef]
  33. Akhtar, A.; Sarmah, A.K. Strength improvement of recycled aggregate concrete through silicon rich char derived from organic waste. J. Clean. Prod. 2018, 196, 411–423. [Google Scholar] [CrossRef]
  34. Mobili, A.; Giosuè, C.; Corinaldesi, V.; Tittarelli, F. Bricks and Concrete Wastes as Coarse and Fine Aggregates in Sustainable Mortars. Adv. Mater. Sci. Eng. 2018, 2018, 8676708. [Google Scholar] [CrossRef] [Green Version]
  35. Mobili, A.; Giosuè, C.; Tittarelli, F. Valorisation of GRP Dust Waste in Fired Clay Bricks. Adv. Civ. Eng. 2018, 2018, 5256741. [Google Scholar] [CrossRef]
  36. Gupta, S.; Kua, H.W.; Pang, S.D. Biochar-mortar composite: Manufacturing, evaluation of physical properties and economic viability. Constr. Build. Mater. 2018, 167, 874–889. [Google Scholar] [CrossRef]
  37. Giosuè, C.; Mobili, A.; Yu, Q.L.; Brouwers, H.J.H.; Ruello, M.L.; Tittarelli, F. Properties of multifunctional lightweight mortars containing zeolite and natural fibers. J. Sustain. Cem. Mater. 2019, 8, 214–227. [Google Scholar] [CrossRef]
  38. Bertolini, L.; Elsener, B.; Pedeferri, P.; Redaelli, E.; Polder, R. Corrosion of Steel in Concrete: Prevention, Diagnosis, Repair; Wiley-VCH: Weinheim, Germany, 2004. [Google Scholar]
  39. Faneca, G.; Segura, I.; Torrents, J.M.; Aguado, A. Development of conductive cementitious materials using recycled carbon fibres. Cem. Concr. Compos. 2018, 92, 135–144. [Google Scholar] [CrossRef]
  40. Osterminski, K.; Polder, R.B.; Schießl, P. Long term behaviour of the resistivity of concrete. Heron 2012, 57, 211–230. [Google Scholar]
  41. Azarsa, P.; Gupta, R. Electrical Resistivity of Concrete for Durability Evaluation: A Review. Adv. Mater. Sci. Eng. 2017, 2017, 8453095. [Google Scholar] [CrossRef] [Green Version]
  42. Saleem, M.; Shameem, M.; Hussain, S.E.; Maslehuddin, M. Effect of moisture, chloride and sulphate contamination on the electrical resistivity of Portland cement concrete. Constr. Build. Mater. 1996, 10, 209–214. [Google Scholar] [CrossRef]
  43. Cosoli, G.; Mobili, A.; Giulietti, N.; Chiariotti, P.; Pandarese, G.; Tittarelli, F.; Bellezze, T.; Mikanovic, N.; Revel, G.M. Performance of concretes manufactured with newly developed low-clinker cements exposed to water and chlorides: Characterization by means of electrical impedance measurements. Constr. Build. Mater. 2021, 271, 121546. [Google Scholar] [CrossRef]
  44. Sirico, A.; Bernardi, P.; Belletti, B.; Malcevschi, A.; Dalcanale, E.; Domenichelli, I.; Fornoni, P.; Moretti, E. Mechanical characterization of cement-based materials containing biochar from gasification. Constr. Build. Mater. 2020, 246, 118490. [Google Scholar] [CrossRef]
  45. Wenner, F. A method for measuring Earth resistivity. J. Wash. Acad. Sci. 1915, 5, 561–563. [Google Scholar] [CrossRef] [Green Version]
  46. Gowers, K.R.; Millard, S.G. Measurement of Concrete Resistivity for Assessment of Corrosion Severity of Steel Using Wenner Technique. ACI Mater. J. 2000, 96, 536–541. [Google Scholar]
  47. Mastali, M.; Dalvand, A. The impact resistance and mechanical properties of self-compacting concrete reinforced with recycled CFRP pieces. Compos. Part B Eng. 2016, 92, 360–376. [Google Scholar] [CrossRef]
  48. Gupta, S.; Kua, H.W. Carbonaceous micro-filler for cement: Effect of particle size and dosage of biochar on fresh and hardened properties of cement mortar. Sci. Total Environ. 2019, 662, 952–962. [Google Scholar] [CrossRef]
  49. Mrad, R.; Chehab, G. Mechanical and Microstructure Properties of Biochar-Based Mortar: An Internal Curing Agent for PCC. Sustainability 2019, 11, 2491. [Google Scholar] [CrossRef] [Green Version]
  50. Belletti, B.; Bernardi, P.; Malcevschi, A.; Sirico, A. Experimental research on mechanical properties of biochar-added cementitious mortars. In Proceedings of the Fib Symposium 2019: Concrete-Innovations in Materials, Design and Structures, Krakow, Poland, 27–29 May 2019. [Google Scholar]
  51. Falliano, D.; de Domenico, D.; Sciarrone, A.; Ricciardi, G.; Restuccia, L.; Ferro, G.; Tulliani, J.-M.; Gugliandolo, E. Influence of biochar additions on the fracture behavior of foamed concrete. Frat. Integrità Strutt. 2020, 14, 189–198. [Google Scholar] [CrossRef]
  52. Ramezanianpour, A.A.; Pilvar, A.; Mahdikhani, M.; Moodi, F. Practical evaluation of relationship between concrete resistivity, water penetration, rapid chloride penetration and compressive strength. Constr. Build. Mater. 2011, 25, 2472–2479. [Google Scholar] [CrossRef]
  53. Liu, Y.; Presuel-Moreno, F.J. Normalization of Temperature Effect on Concrete Resistivity by Method Using Arrhenius Law. ACI Mater. J. 2014, 111, 433–442. [Google Scholar] [CrossRef]
  54. Gupta, S.; Kua, H.W.; Low, C.Y. Use of biochar as carbon sequestering additive in cement mortar. Cem. Concr. Compos. 2018, 87, 110–129. [Google Scholar] [CrossRef]
  55. Tibbetts, C.M.; Paris, J.M.; Ferraro, C.C.; Riding, K.A.; Townsend, T.G. Relating water permeability to electrical resistivity and chloride penetrability of concrete containing different supplementary cementitious materials. Cem. Concr. Compos. 2020, 107, 103491. [Google Scholar] [CrossRef]
  56. Zhu, H.; Zhou, H.; Gou, H. Evaluation of carbon fiber dispersion in cement-based materials using mechanical properties, conductivity, mass variation coefficient, and microstructure. Constr. Build. Mater. 2021, 266, 120891. [Google Scholar] [CrossRef]
  57. Gao, J.; Sha, A.; Wang, Z.; Hu, L.; Yun, D.; Liu, Z.; Huang, Y. Characterization of carbon fiber distribution in cement-based composites by Computed Tomography. Constr. Build. Mater. 2018, 177, 134–147. [Google Scholar] [CrossRef]
  58. Dérobert, X.; Lataste, J.F.; Balayssac, J.-P.; Laurens, S. Evaluation of chloride contamination in concrete using electromagnetic non-destructive testing methods. NDT E Int. 2017, 89, 19–29. [Google Scholar] [CrossRef] [Green Version]
  59. Coppola, L. Concretum; McGraw-Hill Education: Milan, Italy, 2007. (In Italian) [Google Scholar]
  60. Praneeth, S.; Guo, R.; Wang, T.; Dubey, B.K.; Sarmah, A.K. Accelerated carbonation of biochar reinforced cement-fly ash composites: Enhancing and sequestering CO2 in building materials. Constr. Build. Mater. 2020, 244, 118363. [Google Scholar] [CrossRef]
  61. Wang, L.; Chen, L.; Tsang, D.C.W.; Guo, B.; Yang, J.; Shen, Z.; Hou, D.; Ok, Y.S.; Poon, C.S. Biochar as green additives in cement-based composites with carbon dioxide curing. J. Clean. Prod. 2020, 258, 120678. [Google Scholar] [CrossRef]
  62. Saetta, A.V.; Schrefler, B.A.; Vitaliani, R.V. The carbonation of concrete and the mechanism of moisture, heat and carbon dioxide flow through porous materials. Cem. Concr. Res. 1993, 23, 761–772. [Google Scholar] [CrossRef]
Figure 1. Particle size distribution of aggregates.
Sustainability 14 01775 g001
Figure 2. Configuration of electrodes for electrical impedance measurements in concrete specimens: (A) drawing with dimensions and (B) picture.
Sustainability 14 01775 g002
Figure 3. Capillary water absorption test setup: (A) horizontal and (B) vertical configurations.
Sustainability 14 01775 g003
Figure 4. Chloride penetration test setup.
Sustainability 14 01775 g004
Figure 5. Salt-spray chamber test setup.
Sustainability 14 01775 g005
Figure 6. Accelerated carbonation test setup.
Sustainability 14 01775 g006
Figure 7. Carbonated specimen after phenolphthalein test.
Sustainability 14 01775 g007
Figure 8. Electrical impedance measured during curing period.
Sustainability 14 01775 g008
Figure 9. Results of capillary water absorption tests on REF specimens: water absorbed per unit area—comparison between vertical and horizontal positioning.
Sustainability 14 01775 g009
Figure 10. Results of capillary water absorption tests on REF specimens: electrical impedance over test time—comparison between vertical and horizontal positioning.
Sustainability 14 01775 g010
Figure 11. Results of capillary water absorption tests: water absorbed per unit area.
Sustainability 14 01775 g011
Figure 12. Results of capillary water absorption tests: electrical impedance over test time.
Sustainability 14 01775 g012
Figure 13. Visual aspect of concrete specimens: (A) REF, (B) RCF, (C) GCH, (D) RCF+GCH.
Sustainability 14 01775 g013
Figure 14. Correlation between electrical impedance and water absorbed per unit area.
Sustainability 14 01775 g014
Figure 15. Results of chloride penetration test: free chloride content by cement weight.
Sustainability 14 01775 g015
Figure 16. Results of chloride penetration test: electrical impedance over test time.
Sustainability 14 01775 g016
Figure 17. Correlation between electrical impedance and chloride content by cement weight.
Sustainability 14 01775 g017
Figure 18. Results of salt-spray chamber test: free chloride content on cement weight (0–30 mm).
Sustainability 14 01775 g018
Figure 19. Results of salt-spray chamber test: electrical impedance over test time.
Sustainability 14 01775 g019
Figure 20. Correlation between electrical impedance and chloride content on cement weight.
Sustainability 14 01775 g020
Figure 21. Results of accelerated carbonation test: carbonation depth.
Sustainability 14 01775 g021
Figure 22. Results of accelerated carbonation tests: electrical impedance over test time.
Sustainability 14 01775 g022
Figure 23. Correlation between electrical impedance and carbonation depth.
Sustainability 14 01775 g023
Table 1. Mix design of concrete specimens.
MixtureCement
[kg/m3]
Water
[kg/m3]
Sand
[kg/m3]
Intermediate Gravel
[kg/m3]
Coarse Gravel
[kg/m3]
Air
[%]
Superplasticizer
[kg/m3]
GCH
[kg/m3]
RCF
[kg/m3]
REF37316410963923892.45.6--
RCF37316410963923892.45.6-0.9
GCH36916210833873842.47.420.2-
GCH+RCF36916210833873842.47.420.20.9
Table 2. Compressive strength (Rc) measured during curing period (mean and standard deviation values obtained on three specimens per test time per composition) and density after 28 days of curing.
MixtureRc
[MPa]
Density
[kg/m3]
1 Day7 Days28 Days
REF10.2 ± 0.431.1 ± 1.743.4 ± 4.52330
RCF9.9 ± 0.133.1 ± 1.145.2 ± 2.82319
GCH12.1 ± 0.731.3 ± 1.745.9 ± 1.82328
GCH+RCF11.8 ± 0.733.5 ± 1.939.7 ± 4.02320
Publisher’s Note: MDPI stays neutral with regard to jurisdictional claims in published maps and institutional affiliations.

