Article

What Shapes Activity Preferences? The Role of Tourist Personality, Destination Personality and Destination Image: Evidence from Serbia

by
Sanja Kovačić
1,2,
Tamara Jovanović
1,
Miroslav D. Vujičić
1,
Alastair M. Morrison
3 and
James Kennell
3,*
1
Department of Geography, Tourism and Hotel Management, Faculty of Sciences, University of Novi Sad, Trg Dositeja Obradovića 3, 21000 Novi Sad, Serbia
2
Institute of Sports, Tourism and Service, South Ural State University, 76 Lenin Ave., 454080 Chelyabinsk, Russia
3
Department of Marketing, Events and Tourism, Faculty of Business, University of Greenwich, Old Royal Naval College, Park Row, London SE10 9LS, UK
*
Author to whom correspondence should be addressed.
Sustainability 2022, 14(3), 1803; https://doi.org/10.3390/su14031803
Submission received: 5 January 2022 / Revised: 31 January 2022 / Accepted: 1 February 2022 / Published: 4 February 2022
(This article belongs to the Section Tourism, Culture, and Heritage)

Abstract

:
Understanding activity preferences and their antecedents is essential for creating personalized tourism offers and effective destination marketing, vital components of a sustainable tourism destination. Previous studies have provided insights into tourist behavior and activity choices, but without research on activity preferences and their relationship with perceptions of destinations. The literature still lacks an integrative model exploring the antecedents of activity preferences, including tourist characteristics, destination personality, and destination image, and explaining the nature of the relationships between them. This research proposes and tests a structural model of individual characteristics, destination image, destination personality, and activity preferences. A survey was conducted on a sample of 502 visitors to The Trail of Roman Emperors in Serbia. The results confirmed the influence of personality (extraversion, agreeableness, conscientiousness, and openness) and destination personality (sincerity and ruggedness) on activity preferences. Additionally, the model revealed the significant influence of individual characteristics on perceptions of destination personality and image. Managerial implications were given in light of the importance of this research for destination branding that will support long-term destination sustainability.

1. Introduction

The choices of, and preferences for, activities during vacations, are an important aspect of tourist behavior. They influence tourists’ experiences, their levels of satisfaction and their happiness with particular destinations [1]. For this reason, activities are a critical focus for planning and decision-making, and for managing tourism products, services and experiences [2] in ways that help to ensure the long-term sustainability of destinations [3].
The concept of sustainability is essential for successful destination branding [4]. Balancing the competing priorities of sustainability and increasing the economic value of tourism is a key challenge facing Destination Management Organizations (DMO) [5,6]. Understanding activity preferences and their antecedents is also vital for creating personalized tourism offers [2,7] and as a basis for effective marketing campaigns [8]. which can help to support the sustainability of destinations.
People’s choices and preferences are changing towards more novel experiential and participatory activities that provide escape from daily routines [9]. Thus, activities at the destination are a crucial consideration in positioning and creating destination brands [9]. The destination included in this research is the cultural route The Trail of Roman Emperors in Serbia, which consists of nine Roman heritage sites. The destination offers a variety of tourist activities, both passive and interactive, at different locations and attractions [10], so it was considered convenient to study antecedents of tourists’ activity preference.
Destination personality and image, although well researched, remain popular topics in the tourism literature [11,12,13,14,15,16]. Previous research sheds light on how these constructs influence tourist behavior in general—particularly in explaining the influence of destination personality [17,18,19,20], destination image [21,22,23,24,25], and tourists’ individual characteristics on destination image and destination personality [8,16,23,26,27,28,29,30]. However, activity preferences have not been sufficiently explored in previous studies.
Therefore, the principal aim of this research is to construct and test a structural equation model of individual characteristics, destination image, destination personality, and activity preferences. This study contributes to theory by addressing three important research questions (RQ):
RQ1. How do tourists’ individual characteristics influence their perceptions of destination image and personality?
RQ2. How do tourists’ individual characteristics influence their activity preferences at destinations?
RQ3. How do tourists’ perceptions of destination image and personality influence their activity preferences at destinations?

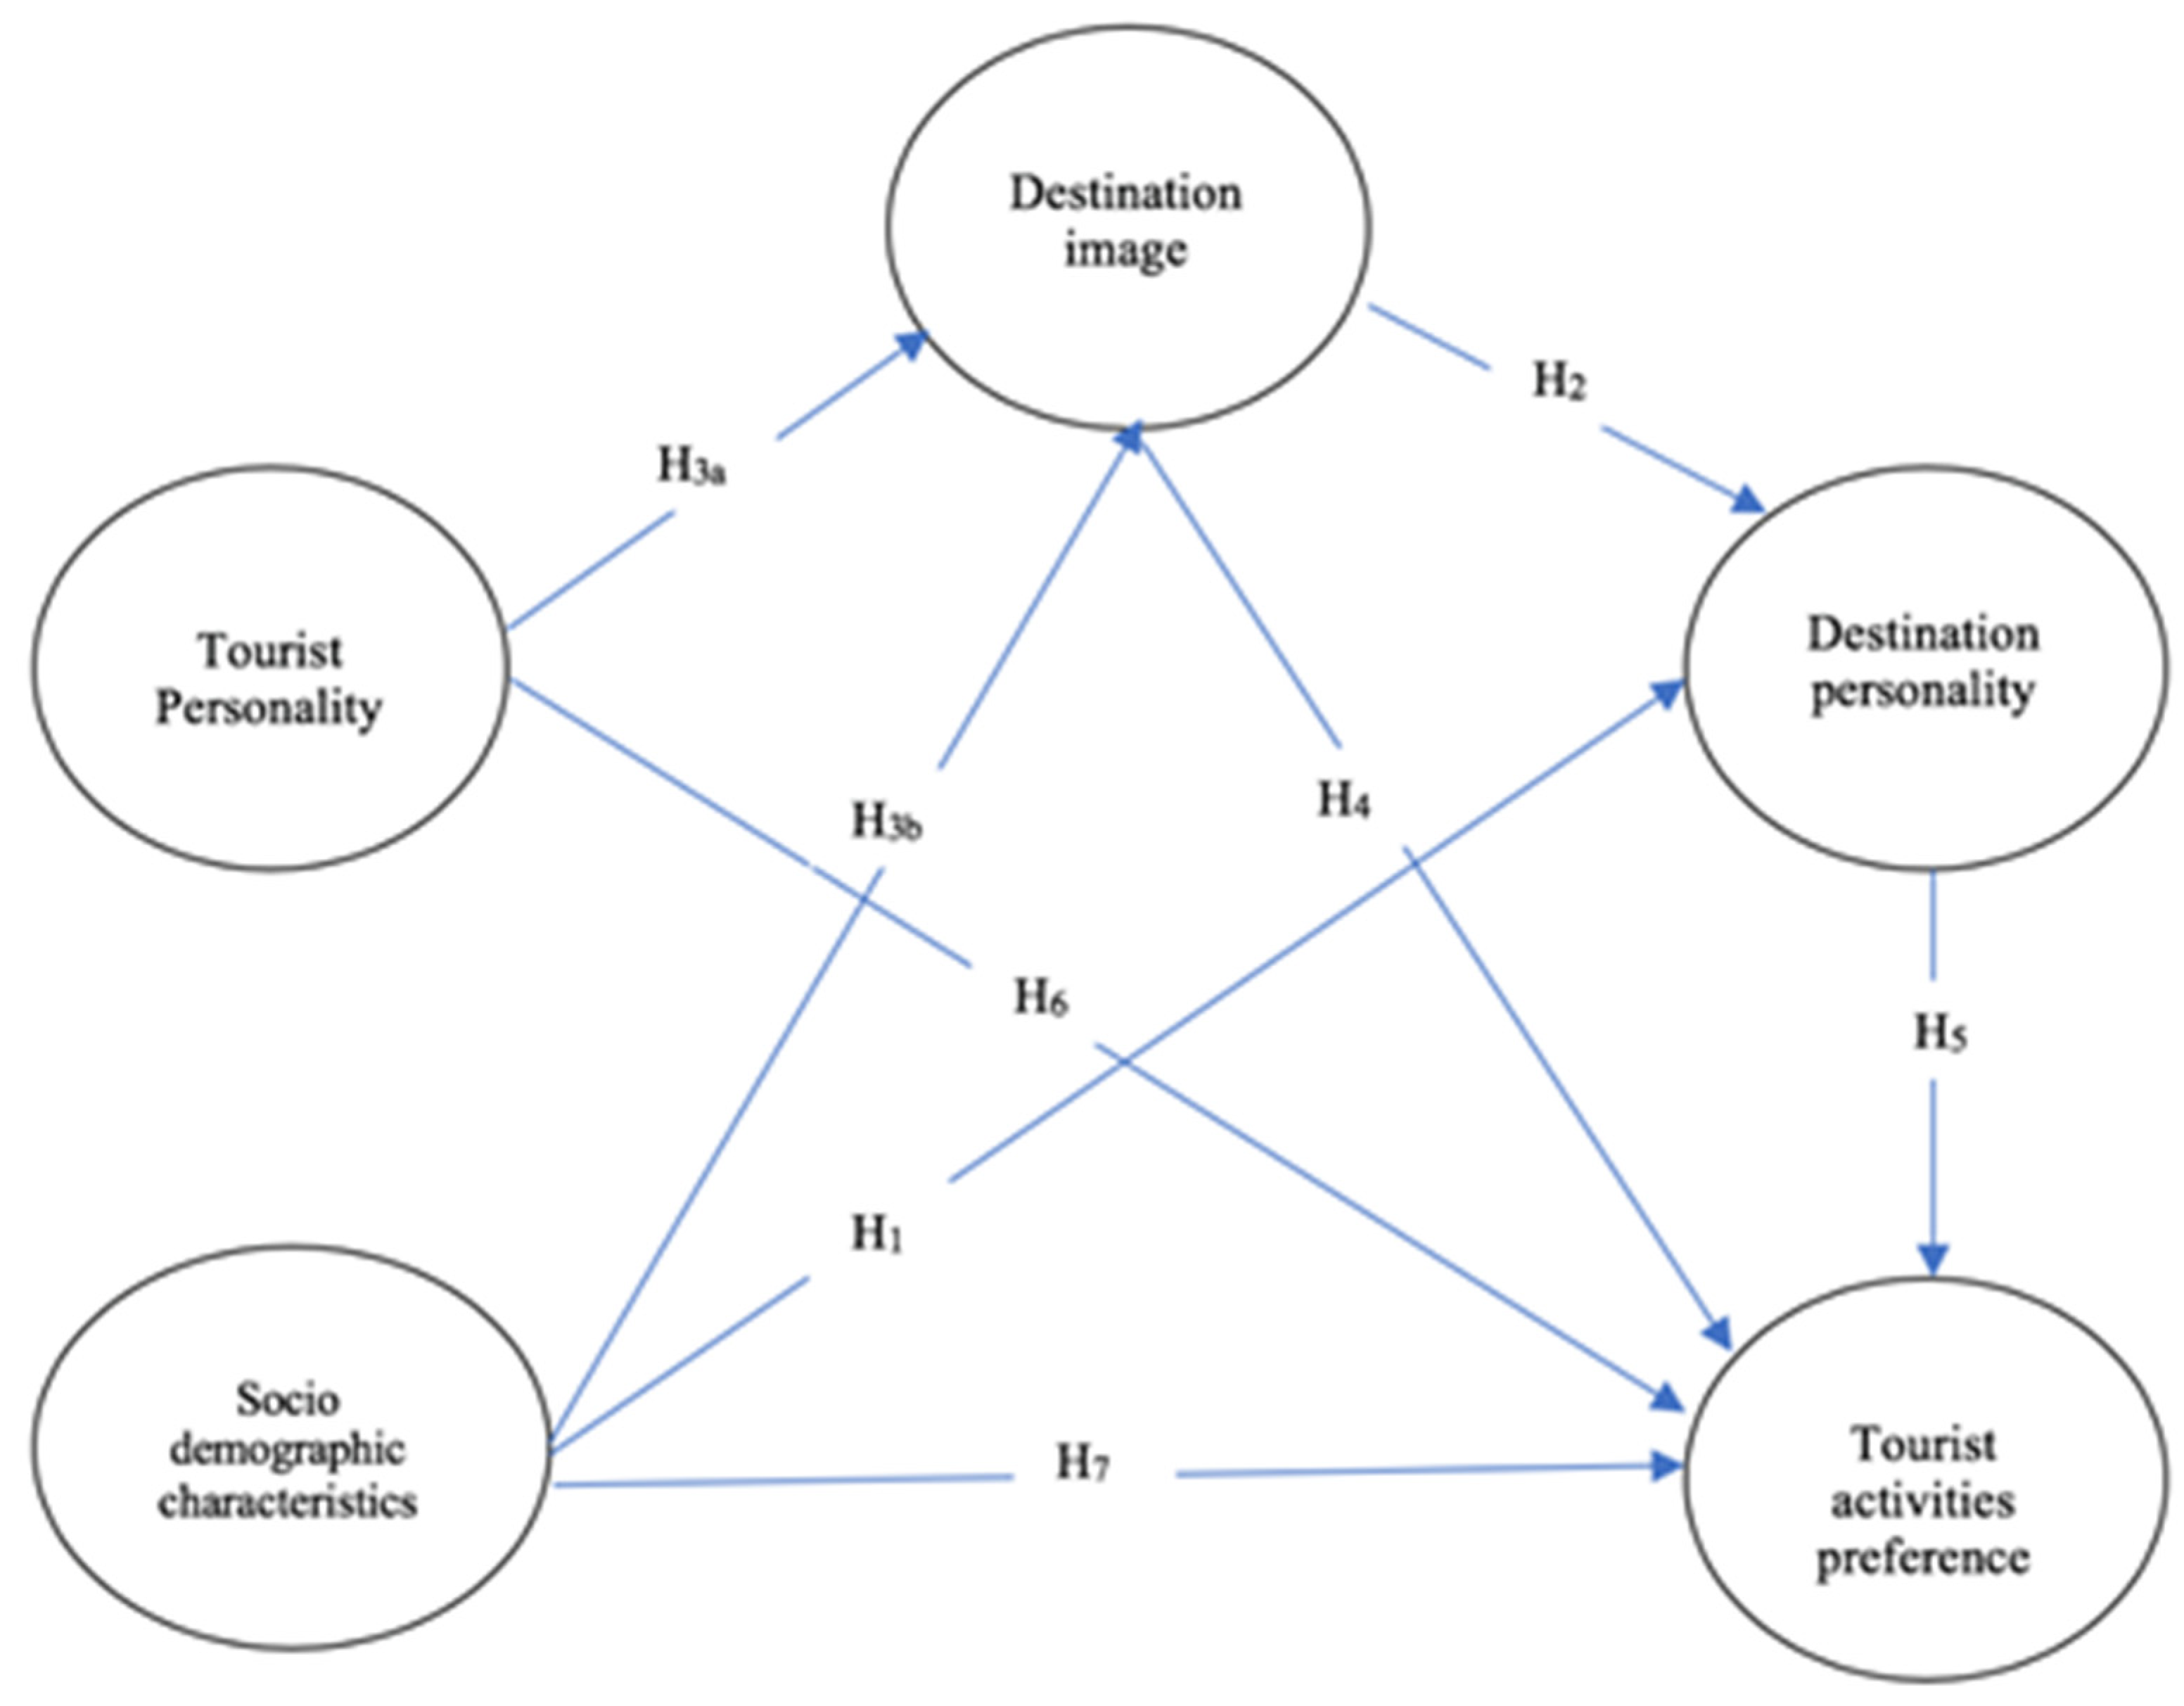
2. Literature Review and Hypotheses Development

2.1. Travel Destination Personality

Destination positioning based on functional attributes makes destinations easily interchangeable. Because of this, researchers suggest that destination personality should be used to craft a destination brand, unique identity and marketing campaigns, which highlight unique destination personalities (attributing human traits to destinations) [26].
A brand personality is defined as “a set of human characteristics that can be associated with a brand” [31] (p. 347). The most popular general scale for measuring brand personality is the BPS (Brand Personality Scale) developed by Jennifer Aaker [31]. This scale is based on the Big Five model for measuring personality and consists of 42 items measuring five basic dimensions: Honesty, Excitement, Competence, Sophistication, and Ruggedness. Azoulay and Kapferer [32] argued that the BPS does not measure brand personality but dimensions of brand identity, with personality as one segment of that identity, deeming it imprecise [32]. Thus, several researchers [31,33,34] have provided modifications, based on which alternative scales have been offered.
Accordingly, many researchers have used the BPS to explore tourism destinations as brands, but normally in a modified form. Ekinci and Hosany [26] were the first to apply a shortened BPS to destination personality assessment, identifying three dimensions inherent in destinations: ordinariness, excitement, and sociability [26,34,35]. Similarly, many authors [36,37,38,39] also applied the BPS to various destinations and obtained different numbers of dimensions with quite different factor structures. This indicated that destinations cannot be described with the same personality traits as for the standardized commerce brands for which the BPS was developed, but that there is a need for a specific scale to measure destination personality. This issue was addressed by developing a 24-item travel destination personality scale (DPS) [40] based on the original five dimensions of Aaker’s [31] model of brand personality, but with items specifically generated to describe destination personality. The DPS shows good construct and predictive validity, as well as reliability. This scale was applied in the current research because of its suitability for describing the specific nature of travel destinations.
Depending on their own personality traits, tourists may perceive different destination personalities. There are several studies comparing consumer and product brand personalities [41,42,43,44,45] suggesting consumers choose products whose personality is more suited to their own personality traits. Previous studies also indicate the relationship between self-congruity and destination personality [19,46,47,48,49,50], as well as the importance of similarity between tourist and destination personality [28]. Although, up to now, there has been no research on the relationship between tourist personality measured by the Big Five Inventory and destination personality, it is expected that the personality of tourists will influence how they perceive destination personality.
Based on this, the first hypothesis was stated as:
Hypothesis 1a (H1a).
Tourist personality influences their destination personality perceptions.
Previous research [16,29,30,51] indicates some differences in destination personality perception between respondents of different sociodemographic characteristics, especially of different nationality. The literature also highlights the importance of sociodemographic characteristics (such as gender and race) as a moderator of the relationship between brand personality and consumer satisfaction [52], while specifically, the study by Awad [53] emphasizes the impacts of age, income, and education. Additionally, Jovanovic [51] revealed that men perceive urban destinations as more honest than women, while educated respondents perceive destinations as less exciting. When it comes to mountain destinations, Jovanovic [51] points out that age has a negative effect on the perception of excitement. It is expected that the sociodemographic profile of a person will influence how that person perceives the personality of a given destination and hence:
Hypothesis 1b (H1b).
Sociodemographic characteristics influence destination personality perceptions.

2.2. Destination Image

Image is defined in different ways in various fields of study [54,55,56,57]. One of the most cited definitions was given by Crompton [58] (p.18), who defined an image as “the sum of beliefs, ideas and impressions that tourists have about a particular destination”. Additionally, several authors define the image of a destination as a set of impressions tourists have about a place [59,60].
In exploring the structure of destination image, there are two main streams in academia: the traditional one, which argues that image consists of one cognitive dimension [61] and the contemporary one, which advocates that the nature of image can be better explained through two dimensions—cognitive and affective [62]. A cognitive component means the knowledge and belief that a person has about the attributes and characteristics of an object or a place [63,64]. The affective component represents the emotions and feelings an individual has about that object/place [57].
More recent work has shown that the nature of image can be better explained by considering both dimensions because image does not consist solely of physical attributes and destination characteristics [54,55]. Some authors consider that there is a third dimension [56,63]—a conative image related to the behavioral aspect (i.e., intention to visit a destination, return to a destination, or recommend it to other people). In this research, the emphasis was on cognitive and affective images because a general consensus has been reached in the tourism literature that destination image is most often measured through these two components. Some previous studies [34,65,66,67,68] have addressed the link between image and destination personality, indicating that image has a positive influence on the formation of destination personality. On balance, the literature shows that image is an important antecedent of destination personality because a positive image contributes to the creation of strong and attractive characteristics of a particular destination. Based on this, hypothesis 2 was:
Hypothesis 2 (H2).
Destination image positively influences destination personality.
Furthermore, there are some studies that highlight the relationship between destination image and tourists’ individual characteristics. Chon [69] suggested that the greater the correspondence between a tourist’s self-image and destination image, the greater the satisfaction of a given destination will be. Beerli and Martin [70] also pointed out that personal factors influence destination image, which refers to the sociodemographic characteristics of tourists as well as the psychological ones. They claimed that these factors affect the cognitive organization of perceptions and, therefore, the image perception. On this basis, it is expected that the personality of the respondents will influence how they perceive the image of a particular destination:
Hypothesis 3a (H3a).
Tourist personality influences a positive destination image.
Many authors have so far demonstrated the influence of sociodemographic characteristics (gender, age, education, social status, marital status, occupation, income) on image perceptions [30,54,55,70,71,72,73,74]. Therefore, it is also believed that certain sociodemographic characteristics of tourists determine their destination image perception:
Hypothesis 3b (H3b).
Sociodemographic characteristics of tourists influence their destination image perception.

2.3. Activity Preferences

One of the greatest challenges for tourism managers today is in understanding tourist behavioral patterns, as these help in predicting future sources of revenue and establishing communication channels to attract potential visitors to specific destinations [75]. Therefore, researchers also show considerable interest in tourist behavior [75,76,77,78].
Tourist behavior is the sum of all visible activities of the individual and the mental processes that result from social interaction [79]. According to Becken and Simmons [80], all activities of tourists are understood as behaviors that can take three forms: visiting attractions (i.e., visiting and sightseeing galleries, museums, squares, etc.), entertainment (i.e., going to cafés, shopping, concerts, etc.), and physical activity (i.e., sports and recreation).
It is widely accepted that destination image has a significant influence on the behavior of tourists before, during and after visits. According to Ozdemir [81], the influence of destination image is not only manifested in the choice of destination, but also in the behavior of tourists in general. Most studies conducted so far have focused on the impact of image on pre-travel behavior [15,82], while its impact during travel (at the destination) is a relatively neglected aspect of research. Chen and Tsai [22], showed that destination image had a significant effect on behavior (i.e., likeliness to revisit and willingness to recommend). Güçer [83], suggested that destination image impacts tourist behavior in the decision-making process, as well as after decisionmaking (during and after the visit: participation in activities, satisfaction, re-visit, and intention to recommend the destination to others). There are also several studies that confirm the impact of image on tourist behavior [22,23,69,84,85,86], but in terms of the intention to revisit and to recommend to friends, while the specific behavior at the destination was not explored. Therefore, it is necessary to investigate the influence of image on tourist behavior at the destination, including activity preferences, and the fourth hypothesis was as follows:
Hypothesis 4 (H4).
Destination image positively influences tourist activity preferences.
Similarly, as brand personality influences consumer behavior, destination personality also affects tourist behavior. Although previous studies did not directly explore the relationship between destination personality and activity preferences, destination personality’s influence on tourist behavior has been confirmed in many previous studies showing that perceived destination personality traits influence the formation of tourist behavior patterns [26,36,38,87,88]. For example, in his research, Malhotra [87], concluded that a well-established destination personality influences tourist preferences. Usakli and Baloglu [38], concluded that destination personality dimensions have a strong positive impact on return intentions and willingness to recommend the destination to others. Ekinci and Hosany [26], found that destination personality influences tourist behavior, especially behavior during decision making. In their study concerning the impact of destination personality on tourist behavior, Lee and Xie [8], came to the insight that sophistication and competence have the greatest impact on behavior, especially on the willingness to pay more and recommend the destination to friends. According to Kim and Stepchenkova [29], destination personality may be a significant indicator of tourist behavior, but this concept is insufficiently investigated in the tourism literature. Moreover, a study conducted by Jovanovic [51], confirmed that the perception of destination personality influenced tourists’ choice of activities. In addition, previous studies clearly indicate that a distinctive destination personality can influence travelers’ attitudes [88], and their preferences [89]. Therefore, hypothesis 5 was:
Hypothesis 5 (H5).
Destination personality perception influences tourist activity preferences.
Research has also explored the influence of individual characteristics on activity preferences. Tourist personality is expected to influence activity preferences at destinations. Although the influence of individual characteristics has not been analyzed in the context of activity preferences, the expectation of a positive influence is based on the fact that many authors have demonstrated the influence of tourist personality on behavior [15,16,90,91,92], with some authors clearly highlighting the influence of tourist personality on tourists’ choice of activities [93,94,95]. It should also be noted that the Big Five model has not been widely used so far for tourists, but rather, simplified psychographic models have been applied [96]. Based on this, hypothesis 6 was:
Hypothesis 6 (H6).
Tourist personality influences tourist activity preferences.
Several studies also highlight the direct impact of sociodemographic characteristics on tourist behavior [16,97]. Lu and Pas [98] found a significant impact of sociodemographic variables (gender, age, occupation) on participation in destination activities and tourist behavior. Their research was later confirmed by many studies [17,18] that have demonstrated the impact of these variables on tourist behavior. Additionally, Jovanovic [51] confirmed the dominant influence of sociodemographic characteristics on destination activity selection, as marital status and place of growing up have proven to be relevant predictors of entertainment choices and attraction visits. On this basis, it can be expected that sociodemographic characteristics influence the selection and participation in destination activities; thus, the seventh hypothesis was:
Hypothesis 7 (H7).
Sociodemographic characteristics influence the tourist activity preferences.
Figure 1 shows the expected relationships between variables and the seven hypotheses.

3. Methods

3.1. Study Sample

Participants in the survey were domestic tourists who had visited at least one site from the cultural route The Trail of Roman Emperors in Serbia. This cultural route is spread over 600 km and encompasses nine Roman heritage sites. A total of 550 questionnaires were distributed, of which 502 were validly completed, while 48 questionnaires were omitted from the statistical analyses due to large amounts of missing data (over 5%). The sampling method used in this study is convenient sampling as well as snowball sampling technique, as respondents who were reached online were asked to send a survey to other people who have visited the cultural route The Trail of Roman Emperors in Serbia.

3.2. Instrument

The questionnaire consisted of five parts. The first part included sociodemographic characteristics of the respondents (gender, age, education, employment status, income, marital status). The second part measured the cognitive and affective images of the last site along the cultural route the respondents visited. Scales developed by Echtner and Richie [99] and Gallarza et al. [59] were used as the basis for measuring cognitive image. However, the items of these scales were slightly modified to describe the cultural route as the specific tourist destination, since some of the original items did not fit the cultural route (such as water activities, winter sports, nightlife, etc.). The experts, having knowledge of the specificities of the cultural route, suggested modification of the items, which was later reviewed by the authors. The experts (faculty professors of tourism and employed tourist workers on the cultural route) suggested which items should be kept or dropped and which ones should be modified so that they measured the cognitive image of the cultural route. The scale’s reliability was than tested and confirmed. As a result, a scale containing 32 items was constructed and evaluated by respondents on a five-point Likert scale. Russell’s [100] bipolar pairs (exciting–depressing, interesting–boring, pleasant–uncomfortable, useful–harmful, and favorable–unfavorable) were used to measure affective image, on semantic differential scales (from −2 to +2) [101]. Russell’s bipolar pairs have been used in many tourism studies [15,102,103] to measure affective destination image, and proved to be a valid measure, so we applied it also in this research.
The third part of the questionnaire measured the personality of the respondents. As the original BPS model was developed based on Big Five Theory, this research used the same theory to test the relationships between tourist personality and destination personality. The scale used in this paper is the Big Five Inventory (BFI), a 44-item questionnaire developed by John, Donahue, and Kentle [96]. This instrument was used as it is one of the most cited Big Five personality questionnaires that proved to be reliable and valid for measuring human personality. The five model consists of the following five factors: Conscientiousness (responsible, organized, efficient); Emotional Stability (self-confident, resilient, well-adjusted), or on the opposite side of the scale: Neuroticism (low confidence, anxious, often in a bad mood, prone to worry, pessimism);—Extraversion (talkative, ambitious, assertive); Agreeableness (friendly, cooperative, loyal); and Openness to Experience (curious, imaginative, open-minded) [104].The statements were rated on a five-point Likert scale (1—strongly disagree; 5—strongly agree).
The fourth part of the questionnaire measured destination personality using the DPS (Destination Personality Scale) developed by Kovačić et al. [40].The scale consists of five dimensions which coincide with Aaker’s dimensions of brand personality, with 24 items generated to describe the specific nature of travel destinations: Excitement: energetic, funny, lively, dynamic; Sincerity: benevolent, sentimental, open, pleasant, convivial; Competence: reliable, responsible, dedicated, serious, organized, attentive; Sophistication: smooth, balanced, gentle, charming; and Ruggedness: mysterious, spontaneous, free, uncontrollable, resistant.
The fifth part of the questionnaire referred to activities at the destination. The respondents were offered a list of activities related to Roman heritage site (based on previous interviews with site managers and local tourism organizations). They were asked to check those activities they participated in and then rate their preferences toward those activities on a five-point Likert scale (1—totally disliked it, 5—I totally liked it).

3.3. Procedure and Data Collection

The survey was conducted using a classic paper-and-pen questionnaire at the sites, as well as through an online questionnaire (Google Forms). The research included respondents who have visited all nine locations at the cultural route “The Trail of the Roman Emperors” (there are nine sites on the route and all of them were encompassed by the study). Respondents completed surveys in person at the following locations: Sirmium, Singidunum, Viminacium, Romuliana, Median and Justinian Prima. On-site surveys were not conducted at the Roman sites in the Djerdap Gorge (Pontes, Diana, Trajan’s Bridge and Board), as there are no visitor centers or employed tourism workers at the site and because of poor site visitation. However, the visitors of these sites were included in the online survey.
The online questionnaire was conducted with tourists who had visited at least one of the sites along the cultural route, The Trail of Roman Emperors, in the last five years. The questionnaire was distributed through Facebook and via email through the researcher’s personal networks, who further distributed the questionnaire (snowball technique). A total of 164 completed questionnaires were collected online. All respondents were informed of the research objectives and that their participation was voluntary and anonymous. The survey was conducted from February to August 2015. Questionnaires were distributed to the sites by researchers, with the help of colleagues, while part of the questionnaire was collected by tourist guides at the sites. A total of 338 completed questionnaires were collected at the sites.

3.4. Statistical Methods

Structural equation modeling (SEM) was used to test the hypothesized model of this research. The analysis was conducted in the EQS 6.1 program for the Windows operating system. The Mardia index of multivariate kurtosis was above three for all models tested, indicating significant multivariate kurtosis. Therefore, it was justified to use robust methods and indices based on this method [105]. The fit of the model was estimated using the following indices: Sattora–Bentler χ2 (SB χ2)—if insignificant then the model has a good fit but as it is sensitive to the number of respondents, it is generally significant in a number of cases; Standardized Root Mean-Square Residual (SRMR), Root Mean-Square Error of Approximation (RMSEA)—SRMR and RMSEA should be less than 0.08 [106]; Comparative Fit Index (CFI); Normed Fit Index (NFI); Non-Normed Fit Index (NNFI)—if CFI, NFI and NNFI are over 0.90, the model has a good fit [107]. To obtain adequate fit indices, the Wald test was used to estimate redundant parameters and the LM (Lagrange multiplier) indicator was used to determine which links between variables should be added to the model. All the additional analyses, such as exploratory factor analysis (EFA), used to determine the factor structure of tourist activities, were carried out in SPSS version 23.

4. Results

4.1. Sociodemographic Characteristics of the Respondents

Table 1 shows descriptive statistics of the sociodemographic characteristics of the respondents. There were more female than male respondents in the sample and the average age of the respondents was 27.2 years. The highest percentage of respondents had completed secondary school (over 50%), while almost a quarter had completed college (23.3%). The largest percentages of respondents were students and employed persons.
For monthly income, almost half of the respondents stated that they did not have an income, which could be explained by the large number of students. Other income categories were quite evenly distributed. The largest number of respondents declared themselves as single or having a partner.

4.2. Exploratory Factor Analysis (EFA)

To identify the latent dimensions of tourist activities, an exploratory factor analysis (EFA) was conducted. Item analysis showed a high KMO = 0.908 and the statistical significance value of Bartlett’s test of sphericity was also confirmed (χ2 = 5614.75, df = 300, p < 0.000). Analysis of item correlations revealed a significant number of correlation relationships with values above 0.3, which led to the conclusion that the data were appropriate for EFA. To extract the factors, the principal components method with Promax rotation (due to established correlations between factors) and Kaiser normalization were used. As a result, and considering only factors whose eigenvalues were equal to or greater than one, three factors were extracted, which explained 50.2% of the variance.
The first factor was participation in organized events (F1). This factor referred to the active attendance and participation in events, workshops and related activities organized at the sites. This factor included nine items (Table 2). The second factor was thematic activities (F2) and referred to the activities that were directly related to the theme of the Roman Empire in this region and activities that provided an authentic experience of the way of life during the Roman times. This factor consisted of ten items (Table 2). The third factor was the passive visit (F3) and this factor referred to sightseeing and lectures related to the Roman Empire, which represented the passive acquisition of knowledge and information without active participation in events, workshops, and similar activities. This factor included six items (Table 2).

4.3. Descriptive Statistics and Measurement Model Validity

Descriptive statistics of variables is presented in Table 3. Reliability of the instruments is measured and presented by Cronbach’s alpha coefficient, which was above the recommended 0.7 for all variables [108] (p. 127), meaning that the items used in the study could be considered reliable and that they really measure the given constructs.
Before conducting the path model, convergent and divergent validity of the constructs was calculated to check the measurement model validity.
The convergent validity of each dimension was examined by calculating the score of the average variance extracted (AVE, see [109]). A substantial convergent validity is achieved when all item-to-factor loadings are significant and the AVE score is higher than 0.50 within each dimension, but AVE higher than 0.40 is still acceptable if composite reliability (CR) is higher than 0.60 [109]. Results showed that all dimensions had AVE higher than 0.40 and CR higher than 0.80 (Table 3) which indicates good convergent validity.
Discriminant validity was then checked by comparing the AVEs for each latent factor with the squared correlation estimates between latent constructs (Table 4). Fornell and Larcker [109] noted that discriminant validity is guaranteed when the AVEs are greater than the squared correlation estimates. All AVE values are greater than squared correlation, expect for Sincerity and Competence, where squared correlations (0.43) is slightly greater than AVE (0.42).

4.4. Structural Model

To examine the influence of personality traits and sociodemographic characteristics on the perceptions of destination image and personality, as well as their joint influence on tourist activity preferences, SEM was applied. Given that there is no theoretical model in the literature explaining the relationship of all selected variables, previous research was used to define the relationships among the individual variables examined.
After creating the first model, satisfactory fit indicators were not obtained, so appropriate changes had to be made. The Wald test suggested that the thematic visit should not be related to respondents’ gender and participation in organized activities, which resulted in the elimination of the gender variable from the model. Subsequently, all relationships that had a very low saturation (below 0.1) were removed from the model, which included the relationship between education and passive visit and participation in organized activities. After this, education was eliminated because it did not sufficiently explain the dependent variables in the model (Model 2). Then, the LM test suggested that the relationships between passive visit and conscientiousness, passive visit and agreeableness and passive visit and openness to experience should be inserted. Additionally, the Wald test suggested respondents’ age should be deleted from the model. This led to the satisfactory indicators of model fit for model 3, shown in Table 5.
The final model (Table 6) indicated that tourist personality influenced activity preferences. Openness to experience positively influenced passive visit, while agreeableness and conscientiousness negatively affected passive visit. Thus, the results showed that people who were open to experience preferred passive visits more, while people who were agreeable and conscientious preferred this type of tourist activity less. The model also revealed that extraversion positively influenced participation in organized events. Destination personality also influenced activity preferences. Honesty positively influenced passive visits, while ruggedness positively influenced the preference for participation in organized events. This finding means that if people perceived the destination as sincere and honest (convivial, sentimental, etc.), they preferred the passive visit. If they saw the destination as rugged (i.e., spontaneous, free, uncontrollable), they found it interesting to participate in organized events.
The analysis showed that place of residence (place of growing up) positively influenced the cognitive image of the destination, while employment status and monthly income positively influenced sophistication as a destination personality trait.
The results also confirmed that tourist personality influenced destination personality. Specifically, openness to experience affected all the dimensions of destination personality (honesty, competence, excitement, ruggedness, and sophistication). This personality trait is particularly interesting as it was also found to influence cognitive and affective images. Agreeableness negatively affected sophistication and excitement, while it positively impacted affective image. This means that agreeable persons perceived the destination as less exciting and sophisticated, while they had higher scores on affective image referring to the positive feelings about the destination. Conscientiousness positively affected excitement, while extraversion negatively affected sophistication. Conscientious people perceive destinations as more exciting, while extraverts see them as less sophisticated. Cognitive image affected all dimensions of destination personality, while affective image only affected excitement.
The model confirmed the influence of tourist personality and sociodemographic characteristics on the perceptions of destination personality (H1a and H1b), the influence of destination image on destination personality (H2), as well as the impact of tourist personality and sociodemographic characteristics on image perceptions (H3a and H3b). For activity preferences, the research confirmed influences of tourist personality and destination personality (supporting H5 and H6), while the influence of sociodemographic characteristics and destination image was not confirmed, thus resulting in the rejection of H4and H7.

4.5. Impact of Sociodemographic Characteristics on Destination Image and Destination Personality Perception

As the structural model confirmed the influence of sociodemographic characteristics on cognitive image and destination personality (sophistication), additional analysis was needed to obtain a deeper insight into the exact sociodemographic categories and how they influenced the constructs.
First, ANOVA tests were performed to analyze the differences between sociodemographic categories. The test indicated that there was a statistically significant difference (F = 11.621, p < 0.01) regarding respondents’ employment status and their perception of sophistication. Post hoc test results (LSD) indicated that students and pupils perceived the destination as less sophisticated than other categories of respondents (employees, unemployed, and retired). There were no statistically significant differences in the perception of sophistication among other categories, but the analysis showed that destination was the most perceived as sophisticated by the unemployed and retired.
The ANOVA test also indicated a statistically significant difference (F = 20.340, p < 0.01) in the perception of sophistication as a destination personality trait depending on respondents’ income. Post hoc test results (LSD) indicated that respondents without income, less than all other categories of respondents (who have below average, average, and above average incomes), perceived the destination as sophisticated. This may be related to the previous finding which tells us that students also perceive the destination as sophisticated, and they belong to a group of non-income respondents. The analysis showed that respondents with above average incomes perceived the destination as sophisticated the most, while there was very little difference between those with average and below average incomes.
Finally, the ANOVA test found that there was a statistically significant difference only between the respondents who spent their childhood in a village and in a city, in relation to the perception of cognitive image (F = 4.747, p < 0.01). This test indicated that respondents who spent their childhood in a village had a more positive perception of the cognitive image of the sites than those who had grown up in cities. To explain this finding, a chi-squared test (χ2 = 17.97, df = 10, p < 0.05) was subsequently conducted, indicating that respondents who spent their childhood in a village were less educated than those who spent their childhoods in towns, which might influence different perceptions of cognitive images (based on facts and information).

5. Discussion

This research addressed three important research questions referring to the influence of tourists’ individual characteristics on destination image and destination personality, their preferred activities at the destination, and also explaining how perceptions of destination image and destination personality influenced activity preferences. The results are discussed in the context of the research questions.

5.1. Impacts of Individual Characteristics on Destination Image and Personality

Individual characteristics were predictors of destination image and personality. For tourist personality, openness to experience was the best predictor of other constructs. It influenced all dimensions of destination personality as well as cognitive and affective images. This could be explained by the fact that people who are open to experience are open to fantasy, aesthetics, action, ideas and values [110], which can be linked to the very meaning of travel and tourism through which these concepts can be expressed and realized. Additionally, open-minded people are curious, intelligent, enjoy new things, knowledge and experiences [111], and it is not surprising that this trait is so closely related to perceptions of the destination. How open tourists are to the experience can also affect how much they learn about a destination and how they experience it, and how willing they are to attach personality traits and visualize a particular destination. Additionally, it might influence how they see the destination, i.e., if they are more open to the experience, they will experience the destination more positively.
Conscientiousness was shown to be a significant predictor of excitement. It is assumed that more conscientious people will spend greater time planning trips and gathering knowledge before they go to a certain place (about contents, activities, attractions), which could influence the perception of that destination as exciting, even before the trip. More information about a place could lead to a clearer perception of the destination’s offer, which can affect the experience of that destination as exciting.
Extraversion negatively affected the perception of sophistication. In terms of sophistication items, such as smooth, balanced, gentle and charming, the impression is that these traits are more characteristic of introverts than extraverts. Theory indicates that one chooses a destination that is similar to his/her personality, thus extraverts could perceive this particular destination as less sophisticated. Introverts tend to be quiet, slow, seek their own knowledge and may have no desire to meet others [112], perceiving cultural routes as destinations that are not visited often, with select clientele, and more smooth and suited for their characteristics. Extraverts tend to seek excitement, they are mainly carefree, spontaneous, like going out, and like to meet people, so a cultural route may not be a destination they perceive as sophisticated.
Agreeableness negatively affected sophistication, while it had a positive impact on excitement and affective image. An agreeable person is one who pleases others and could be described as “fundamentally altruistic”, sympathetic, empathetic and has a need to help. A person who scores low in this dimension is self-centered, skeptical of others, antagonistic and competitive [113], meaning that egocentric tourists may perceive the destination as more sophisticated, as they want prestige. On the contrary, people who are agreeable do not burden themselves with sophistication because prestige is not fundamentally important to them, so they may perceive a destination as less sophisticated. Agreeable people will perceive a destination as more exciting, as they are cooperative and sociable, and like to engage in activities and travel with other people, thus a tourist destination can be more fun and dynamic. Agreeableness also impacts the perception of affective image. As pleasant people are empathetic, sensitive and altruistic, this might reflect how they feel about a particular destination (affective image), leading to more positive feelings about the destination.
Neuroticism is the only personality trait that did not show any significant effects. It can be assumed that our emotional stability is not related to our perceptions of destination personality, image and activity preferences. Although the literature states that neuroticism has some influence on travel and tourism, it is mostly expressed in longer journeys, where some difficulties may occur for tourists due to changing environments, encountering new settings, isolation, and lack of activity [114]. Within this research, neuroticism did not have a significant impact, which may be because the focus was on domestic tourists on relatively close journeys within one country. Additionally, as Aaker’s brand personality dimensions are based on the Big Five Personality Theory, she points out that certain personality traits cannot be attributed to brands [31], which according to some authors [114] is neuroticism.
The analysis showed that the place where tourists grew up positively influenced cognitive images, while employment status and monthly income positively affected sophistication as a destination personality trait. Additional analyses also indicated that respondents who spent their childhood in the countryside had a more positive perception of cognitive image than those who spent their childhoods in the town and city. This could be explained by the greater exposure to information by the people living in the city [115] which could influence a more realistic picture of the destination and explain their less positive perception of the image. As the cognitive image is highly dependent on our knowledge and awareness of a particular destination, the difference in respondents’ education could explain the relationship between place of growth and perception of the cognitive image. Additionally, a chi-square test (χ2 = 17.97, df = 10, p < 0.05) was conducted, indicating that respondents who spent their childhoods in the countryside were less educated than those who spent their childhoods in the town and the city.
Students perceived the destination as less sophisticated than other categories of respondents (employed, unemployed and retired). Additionally, the results showed that non-income respondents differed from all other income categories in terms of the perception of sophistication, as they perceived the destination as the least sophisticated. This may be because a sophisticated destination is seen as a form of prestige for tourists. Students and pupils or those without income may find it less difficult to achieve prestige through travel so they pay less attention to sophistication, or they relate “prestigious travel” to only certain types of destinations. So, this could also mean that students do not perceive cultural heritage and routes as prestigious, and therefore did not perceive this destination as sophisticated. Moreover, visits to these sites are usually part of a field trip or an excursion, not being an exclusive trip. In contrast, those with above average incomes associated sophistication and prestige with culture and heritage. This would mean that the type of destination influenced such a relationship, which should be further tested in future research. Additionally, it should be mentioned that higher-income respondents are able to engage in more activities (which require extra money) at the destination, which can make them experience it as more sophisticated.

5.2. Impacts of Individual Characteristics on Activity Preferences

This research showed that personality traits were a better predictor of activity preferences than sociodemographic characteristics. Similarly, the research of Madrigal and Kahle [116] indicates that personal values better predict activity preferences than sociodemographic characteristics.
Tourists’ personality influenced activity preferences, showing that those who are open to experience preferred passive visits. Lectures and sightseeing tours of the site can stimulate the imagination and fantasy and provide unique experiences, and those open to experience will prefer the passive visit. Agreeable and conscientious tourists preferred this type of activity less. Highly conscientious individuals who probably spend more time preparing for trips [117] will be less engaged by lectures and sightseeing than those who have no prior knowledge of the site. Agreeable tourists found it less interesting to have passive visits. Agreeable people are considered open-minded, focused on others, and cooperative [117], so passive visits are less interesting than activities that involve other people. Extraverts preferred participating in organized events. They like to meet new people, searching for novel, exciting, and adventurous tourism activities [118], so organized events which include opportunities for interaction, socializing and communication at various events and workshops are an appropriate choice.

5.3. Impacts of Perception of Destination Image and Personality on Activity Preferences

The interrelationship between destination image and destination personality was examined. A high score for affective image implies that the destination is regarded as fun and a favorite, and people perceive the place as having an exciting destination personality. Cognitive image had a positive effect on all dimensions of destination personality. This supports previous findings on the positive influence of cognitive image on destination personality [66]. For example, the knowledge that there are many activities at a place contributes to the perception of the destination as exciting, friendly locals suggest the destination as honest, and the existence of cultural events suggest it is sophisticated.
Only destination personality influenced activity preferences. The model indicated that honesty positively affected the preference for passive visits, while ruggedness positively influenced the preference of participation in organized events. Those who perceived the destination as honest found passive visits more interesting. Ruggedness is more akin with the personality traits of a destination such as mysterious, spontaneous, free, and resilient. If experiencing a destination such as this, organized events might be something unexpected, so various festivals, camps, workshops, and similar activities might be surprising and a good experience for these tourists.

6. Conclusions

6.1. Theoretical Implications

The study makes several important contributions to the theory. Firstly, while there are plenty of studies dealing with activity choice, the current study deals with the antecedents of activity preference and, thus, contributes to the quite underexplored field in tourism. This is also the first study to prove that tourist personality and destination personality perception influence tourists’ activity preferences. Additionally, while sociodemographic characteristics may affect tourists’ choice of activities at the destination, the current study shows that they are not particularly important in terms of their activity preference. These findings thus shed light on tourist behavior at the destination.
The important conclusion of the study is also that the personality trait “openness to experience” is particularly important in tourism as it affects not only activity preference but also the perception of all destination personality factors as well as cognitive and affective destination images. An important contribution to the theory that the study also makes is in terms of exploring the influence of destination image on activity preference. Previous studies explored the effects of destination image on decisionmaking and pre-trip behavior, while this is the first study to come to the conclusion that destination image perception does not affect tourists’ activity preference at the destination.
Finally, the novelty of the study is also that it explores, for the first time, tourists’ personal characteristics, destination image, destination personality and activity preference in one model, explaining their complex interrelationships. Besides what has already been mentioned, the study confirmed the important role of individual characteristics of tourists for their activity preference and destination image and personality perception, which leads to some interesting practical recommendations for destination marketers.

6.2. Practical Implications

The study findings do not only contribute to the theoretical knowledge, but also have some practical implications.
Firstly, the study indicates that certain personality types of tourists tend to show more positive perceptions of destination image and destination personality, also tending to have preferences for certain activities. For instance, extraverts will be more attracted to destinations that offer organized events, introverts will prefer more sophisticated destinations, while conscientious people will be interested in detailed information and better promotion of the destination. Thus, destination managers should focus on making marketing campaigns that emphasize rational and emotional benefits for such personality types (tourists open to experience, agreeable and extraverts), in order to increase positive destination perceptions. Moreover, knowledge of the activities that are preferred by different personality types of tourists, that this study provides, can be used in destination marketing. The findings can assist activity-based segmentation, as a combination of tourists’ personality and activities they prefer. This is in line with Sung et al. [119], who suggest that activity-based segmentation can be used together with other psychographic, demographic and/or social variables to effectively segment, define and differentiate target markets.
Additionally, the study shows that activity preference is influenced by destination personality. Practically, this means that the tourists’ perception of destination as a person shapes their destination offer expectations, as well as their activity preferences. This means that constant research on destination personality perception could provide marketers with the information needed for shaping activities at the destination.
Knowledge on how sociodemographics affect destination perception and activity preference is also important from a practical point of view. The current research indicates that if a destination wants to attract people with higher income, it needs to promote its area as sophisticated—smooth, balanced, gentle. On the other hand, the promotion of certain types of activities can help in developing the desired brand and image. For instance, promoting organized events such as lectures and workshops will help tourists see destinations as honest and exciting. Or, if destination marketers want to present destination as honest and rugged, marketing emphasis should be on the passive visit in terms of sightseeing, lectures, and guided tours.
Finally, targeting tourists with specific demographic and psychographic profiles is an important way in which destination marketing can support sustainability [3], as it offers the opportunity for Destination Management Organizations to focus tourist activity in areas and in product segments that are aligned with their sustainability goals [6].This research provides practical information for DMOs on how the features of their destinations can be promoted to specific tourist segments, through the application of Destination Personality approaches in their marketing and branding. The insights from this research can help to DMOs to create both personalized tourism offers that focus on specific activities [2,7], and more general destination brands, which are a key feature of sustainable tourism destinations [4].

6.3. Limitations and Future Research Directions

The study has certain limitations. Firstly, the study used a convenience sampling method based on domestic tourists in Serbia, so the study sample was not international. Thus, it would be good to replicate the research on a wider international sample, for a greater generalizability. Moreover, due to the fact that the study was based on a domestic sample, nationality was not included in the model. Thus, some further research should explore whether tourists’ country of origin and culture impact destination image and personality perceptions, as well as activity preferences. This could contribute to the knowledge of sociodemographic effects on activity preference and destination image and personality perceptions.
Possible future research could also explore if tourists’ activity preference could affect destination image and personality perceptions that tourists had before being engaged into activities. In this way, the possible vice versa effect of activities on the tourists’ perceptions could be explored.
Finally, it is important that future research considers the perspectives of other target groups such as residents, as destination branding can only be sustainable when hosts, policy objectives and tourists’ demands are in harmony.

Author Contributions

Conceptualization, S.K. and T.J.; methodology, S.K. and T.J.; software, S.K.; validation, S.K., T.J., M.D.V. and A.M.M.; formal analysis, S.K., T.J.; investigation, S.K., T.J., M.D.V., A.M.M., data curation, S.K., M.D.V. and J.K., writing—original draft preparation, S.K., T.J., M.D.V., J.K.; writing—review and editing, J.K., A.M.M. and supervision, S.K. All authors have read and agreed to the published version of the manuscript.

Funding

This research was supported by The Science Fund of the Republic of Serbia, Project No. 7739076, Tourism Destination Competitiveness—evaluation model for Serbia—TOURCOMSERBIA.

Institutional Review Board Statement

Not applicable.

Informed Consent Statement

Informed consent was obtained from all subjects involved in the study.

Data Availability Statement

Not applicable.

Conflicts of Interest

The authors declare no conflict of interest. The funders had no role in the design of the study; in the collection, analyses, or interpretation of data; in the writing of the manuscript, or in the decision to publish the results.

References

  1. Hwang, E.; Kim, J.; Lee, J.C.; Kim, S. To Do or to Have, Now or Later, in Travel: Consumption Order Preference of Material and Experiential Travel Activities. J. Travel Res. 2019, 58, 961–976. [Google Scholar] [CrossRef]
  2. Vu, H.Q.; Li, G.; Law, R. Discovering implicit activity preferences in travel itineraries by topic modeling. Tour. Manag. 2019, 75, 435–446. [Google Scholar] [CrossRef]
  3. Vujičić, M.D.; Kennell, J.; Morrison, A.; Filimonau, V.; Štajner Papuga, I.; Stankov, U.; Vasiljević, D.A. Fuzzy modelling of tourist motivation: An age-related model for sustainable, multi-attraction, urban destinations. Sustainability 2020, 12, 8698. [Google Scholar] [CrossRef]
  4. Zouganeli, S.; Trihas, N.; Antonaki, M.; Kladou, S. Aspects of sustainability in the destination branding process: A bottom-up approach. J. Hosp. Mark. 2012, 21, 739–757. [Google Scholar] [CrossRef] [Green Version]
  5. Dos Anjos, F.A.; Kennell, J. Tourism, governance and sustainable development. Sustainability 2019, 11, 4257. [Google Scholar] [CrossRef] [Green Version]
  6. Gowreesunkar, V.G.; Séraphin, H.; Morrison, A. Destination marketing organizations: Roles and challenges. In The Routledge Handbook of Destination Marketing; Gursoy, D., Chi, C., Eds.; Routledge: Abingdon-on-Thames, London, UK, 2018; pp. 16–34. [Google Scholar]
  7. Finsterwalder, J.; Laesser, C. Segmenting Outbound Tourists Based on Their Activities: Toward Experiential Consumption Spheres in Tourism Services? Tour 2013, 68, 21–43. [Google Scholar] [CrossRef]
  8. Lee, J.; Xie, K. Cognitive Destination Image, Destination Personality and Behavioral Intentions: An Integrated Perspective of Destination Branding. In Proceedings of the Graduate Student Research Conference in Hospitality and Tourism, XVI, Hilton College of Hotel and Restaurant Management, University of Houston, Houston, TX, USA, 6–8 January 2011. [Google Scholar]
  9. Gertner, R.K.; Freire, J. The sun and beach myth: The impact of pull-based factors and ‘things-to-do’ on tourists’ motivations and place images. IJLTM 2019, 6, 194–213. [Google Scholar] [CrossRef]
  10. Božić, S.; Tomić, N. Developing the cultural route evaluation model (CREM) and its application on the Trail of Roman Emperors, Serbia. Tour. Manag. Perspect. 2016, 17, 26–35. [Google Scholar] [CrossRef]
  11. Lund, N.F.; Scarles, C.; Cohen, S.A. The Brand Value Continuum: Countering Co-destruction of Destination Branding in Social Media through Storytelling. J. Travel Res. 2019, 59, 1506–1521. [Google Scholar] [CrossRef]
  12. Rowley, J.; Hanna, S. Branding destinations: Symbolic and narrative representations and co-branding. J. Brand Manag. 2019, 27, 328–338. [Google Scholar] [CrossRef]
  13. San Martín, H.; Herrero, A.; García de los Salmones, M.D.M. An integrative model of destination brand equity and tourist satisfaction. Curr. Issues Tour. 2019, 22, 1992–2013. [Google Scholar] [CrossRef]
  14. Woosnam, K.M.; Stylidis, D.; Ivkov, M. Explaining conative destination image through cognitive and affective destination image and emotional solidarity with residents. J. Sustain. Tour. 2020, 28, 917–935. [Google Scholar] [CrossRef]
  15. Kovačić, S.; Mărgărint, M.C.; Ionce, R.; Miljković, Đ. What are the Factors affecting Tourist Behavior based on the Perception of Risk? Romanian and Serbian Tourists’ Perspective in the Aftermath of the recent Floods and Wildfires in Greece. Sustainability 2020, 12, 6310. [Google Scholar] [CrossRef]
  16. Šagovnović, I.; Kovačić, S. Influence of tourists’ sociodemographic characteristics on their perception of destination personality and emotional experience of a city break destination. Int. J. Tour. Cities 2020, 7, 200–223. [Google Scholar] [CrossRef]
  17. Jang, S.; Bai, B.; Hong, G.S.; O’Leary, J.T. Understanding travel expenditure patterns: A study of Japanese pleasure travelers to the United States by income level. Tour. Manag. 2004, 25, 331–341. [Google Scholar] [CrossRef]
  18. Walker, C.; Scott-Melnyk, S.; Sherwood, K. Reggae to Rachmaninoff: How and Why People Participate in Arts and Culture; Urban Institute: Washington, DC, USA, 1996. [Google Scholar]
  19. Chi, C.G.Q.; Pan, L.; Del Chiappa, G. Examining destination personality: Its antecedents and outcomes. J. Destin. Mark. Manag. 2018, 9, 149–159. [Google Scholar] [CrossRef]
  20. Khazaei Pool, J.; Khodadadi, M.; Asadi, A. The impact of congruence between self-concept and destination personality on behavioural intentions for visiting an Islamic-historical destination. Tour. Hosp. Res. 2018, 18, 378–387. [Google Scholar] [CrossRef]
  21. Castro, C.B.; Armario, E.M.; Ruiz, D.M. The influence of market heterogeneity on the relationship between a destination’s image and tourists’ future behaviour. Tour. Manag. 2007, 28, 175–187. [Google Scholar] [CrossRef]
  22. Chen, C.F.; Tsai, D. How destination image and evaluative factors affect behavioural intentions? Tour. Manag. 2007, 28, 1115–1122. [Google Scholar] [CrossRef]
  23. Sirgy, M.J.; Su, C. Destination image, self-congruity, and travel behaviour: Toward an integrative model. J. Travel Res. 2000, 38, 340–352. [Google Scholar] [CrossRef]
  24. Hallmann, K.; Zehrer, A.; Müller, S. Perceived destination image: An image model for a winter sports destination and its effect on intention to revisit. J. Travel Res. 2015, 54, 94–106. [Google Scholar] [CrossRef]
  25. Ćulić, M.; Vujičić, M.D.; Kalinić, Č.; Dunjić, M.; Stankov, U.; Kovačić, S.; Anđelković, Ž. Rookie Tourism Destinations—The Effects of Attractiveness Factors on Destination Image and Revisit Intention with the Satisfaction Mediation Effect. Sustainability 2021, 13, 5780. [Google Scholar] [CrossRef]
  26. Ekinci, Y.; Hosany, S. Destination Personality: An Application of Brand personality to Tourism Destinations. J. Travel Res. 2006, 45, 127–139. [Google Scholar] [CrossRef] [Green Version]
  27. Murphy, L.; Moscardo, G.; Benckendorff, P. Using brand personality to differentiate regional tourism destinations. J. Travel Res. 2007, 46, 5–14. [Google Scholar] [CrossRef]
  28. Bekk, M.; Spörrle, M.; Kruse, J. The benefits of similarity between tourist and destination personality. J. Travel Res. 2016, 55, 1008–1021. [Google Scholar] [CrossRef]
  29. Kim, H.; Stepchenkova, S. Understanding destination personality through visitors’ experience: A cross-cultural perspective. J. Dest. Mark. Manag. 2017, 6, 416–425. [Google Scholar] [CrossRef]
  30. Kim, W.; Malek, K.; Kim, N.; Kim, S. Destination personality, destination image, and intent to recommend: The role of gender, age, cultural background, and prior experiences. Sustainability 2018, 10, 87. [Google Scholar] [CrossRef] [Green Version]
  31. Aaker, J.L. Dimensions of brand personality. J. Mark. Res. 1997, 34, 347–356. [Google Scholar] [CrossRef]
  32. Azoulay, A.; Kapferer, J.-N. Do brand personality scales really measure brand personality? J. Brand Manag. 2003, 11, 143–155. [Google Scholar] [CrossRef]
  33. Caprara, G.V.; Barbaranelli, C.; Guido, G. Brand personality: How to make the metaphor fit? J. Econ. Psychol. 2001, 22, 377–395. [Google Scholar] [CrossRef]
  34. Hosany, S.; Ekinci, Y.; Uysal, M. Destination image and destination personality: An application of branding theories to tourism places. J. Bus. Res. 2006, 59, 638–642. [Google Scholar] [CrossRef]
  35. Ekinci, Y.; Sirakaya-Turk, E.; Baloglu, S. Host image and destination personality. Tour. Anal. 2007, 12, 433–446. [Google Scholar] [CrossRef]
  36. Murphy, L.; Benckendorff, P.; Moscardo, G. Destination brand personality: Visitor perceptions of a regional tourism destination. J. Tour. Anal. 2007, 12, 419–432. [Google Scholar] [CrossRef]
  37. Sahin, S.; Baloglu, S. Brand personality and destination image of Istanbul: A comparison across nationalities. In Proceedings of the 14th Annual Graduate Student Research Conference in Hospitality and Tourism, Las Vegas, NV, USA, 4–6 January2009. [Google Scholar]
  38. Usakli, A.; Baloglu, S. Brand personality of tourist destinations: An application of self-congruity theory. Tour. Manag. 2011, 32, 114–127. [Google Scholar] [CrossRef]
  39. Jovanović, T.; Božić, S.; Dinić, B.; Majstorović, N. Serbian adaptation of the Brand Personality Scale (BPS): An application to tourism destinations. Appl. Psychol. 2017, 10, 37–61. [Google Scholar] [CrossRef] [Green Version]
  40. Kovačić, S.; Jovanović, T.; Dinić, B.M. Development and validation of a new measure of travel destination personality. Psihologija 2020, 53, 65–85. [Google Scholar] [CrossRef] [Green Version]
  41. Aaker, D.A. Building Strong Brands; Free Press: New York, NY, USA, 1996. [Google Scholar]
  42. Milas, G.; Mlačić, B. Brand personality and human personality: Findings from ratings of familiar Croatian brands. J. Bus. Res. 2007, 60, 620–626. [Google Scholar] [CrossRef]
  43. Lin, L.Y. The relationship of consumer personality trait, brand personality and brand loyalty: An empirical study of toys and video games buyers. J. Prod. Brand Manag. 2010, 19, 4–17. [Google Scholar] [CrossRef] [Green Version]
  44. Huang, H.H.; Mitchell, M.W.; Rosenaum-Elliott, R. Are Consumer and Brand Personalities the Same? Psychol. Mark. 2012, 29, 334–349. [Google Scholar] [CrossRef] [Green Version]
  45. Dikcius, V.; Seimiene, E.; Zaliene, E. Congruence between brand and consumer personalities. Econ. Manag. 2013, 18, 526–536. [Google Scholar] [CrossRef] [Green Version]
  46. Kumar, V. Examining the role of destination personality and self-congruity in predicting tourist behavior. Tour. Manag. Perspect. 2016, 20, 217–227. [Google Scholar] [CrossRef]
  47. Chua, B.L.; Kim, H.C.; Lee, S.; Han, H. The role of brand personality, self-congruity, and sensory experience in elucidating sky lounge users’ behavior. J. Travel Tour. Mark. 2019, 36, 29–42. [Google Scholar] [CrossRef]
  48. Sop, S.A.; Kozak, N. Effects of brand personality, self-congruity and functional congruity on hotel brand loyalty. J. Hosp. Mark. Manag. 2019, 28, 926–956. [Google Scholar] [CrossRef]
  49. Su, N.; Reynolds, D. Effects of brand personality dimensions on consumers’ perceived self- image congruity and functional congruity with hotel brands. Int. J. Hosp. Manag. 2017, 66, 1–12. [Google Scholar] [CrossRef]
  50. Yang, S.; Mohd Isa, S.; Ramayah, T. A Theoretical Framework to Explain the Impact of Destination Personality, Self-Congruity, and Tourists’ Emotional Experience on Behavioral Intention. Sage Open 2020, 10, 2158244020983313. [Google Scholar] [CrossRef]
  51. Jovanović, T. The Importance of Individual Values and Personification of Destination for Choice of Destination and Tourist Contents. Ph.D. Thesis, Faculty of Philosophy, Novi Sad, Serbia, 2014. [Google Scholar]
  52. Lada, S.; Sidin, S. Moderating effects of demographic characteristics on the relationship between brand personality dimensions. In Proceedings of the BIMP-EAGA Conference, Kota Kinabalu, Malaysia, 9–11 July 2012. [Google Scholar]
  53. Awad, T.A. Environmental segmentation alternatives: Buyers’ profiles and implications. J. Islam. Mark. 2011, 2, 55–73. [Google Scholar] [CrossRef]
  54. Baloglu, S. The relationship between destination images and socio demographic and trip characteristics of international travelers. J. Vacat. Mark. 1997, 3, 221–233. [Google Scholar] [CrossRef]
  55. Baloglu, S.; McCleary, K.W. A model of destination image formation. Ann. Tour. Res 1999, 26, 868–897. [Google Scholar] [CrossRef]
  56. Gartner, W.C. Image formation process. J. Travel Tour. Mark. 1993, 2, 191–215. [Google Scholar] [CrossRef]
  57. Kim, H.; Richardson, L.S. Motion picture impacts on destination images. Ann. Tour. Res. 2003, 30, 216–237. [Google Scholar] [CrossRef]
  58. Crompton, J.L. An assessment of the image of Mexico as a vacation destination and the influence of geographical location upon that image. J. Travel Res. 1979, 17, 18–23. [Google Scholar] [CrossRef]
  59. Gallarza, M.G.; Saura, I.G.; Garcia, H.C. Destination image: Towards a conceptual framework. Ann. Tour. Res. 2002, 29, 56–78. [Google Scholar] [CrossRef]
  60. Campo-Martínez, S.; Garau-Vadell, J.B.; Martínez-Ruiz, M.P. Factors influencing repeat visits to a destination: The influence of group composition. Tour. Manag. 2010, 31, 862–870. [Google Scholar] [CrossRef]
  61. Mazursky, D.; Jacoby, J. Exploring the development of store images. J. Retail. 1986, 62, 145–165. [Google Scholar]
  62. San Martín, H.; Rodríguez del Bosque, A.I. Exploring the cognitive–affective nature of destination image and the role of psychological factors in its formation. Tour. Manag. 2008, 29, 263–277. [Google Scholar] [CrossRef]
  63. Pike, S.; Ryan, C. Destination Positioning Analysis through a Comparison of Cognitive, Affective, and Conative Perceptions. J. Travel Res. 2004, 42, 333–342. [Google Scholar] [CrossRef] [Green Version]
  64. Stepchenkova, S.; Mills, J. Destination image: A meta-analysis of 2000–2007 research. J. Hosp. Mark. Manag. 2010, 19, 575–609. [Google Scholar] [CrossRef]
  65. Chen, C.F.; Phou, S. A closer look at destination: Image, personality, relationship and loyalty. Tour. Manag. 2013, 36, 269–278. [Google Scholar] [CrossRef]
  66. Xie, K.L.; Lee, J.S. Toward the perspective of cognitive destination image and destination personality: The case of Beijing. J. Travel Tour. Mark. 2013, 30, 538–556. [Google Scholar] [CrossRef]
  67. Prayag, G. Exploring the relationship between destination image and brand personality of a tourist destination: An application of projective techniques. J. Travel Tour. Res. 2007, 2, 111–130. [Google Scholar]
  68. Souiden, N.; Ladhari, R.; Chiadmi, N.E. Destination personality and destination image. J. Hosp. Tour. Manag. 2017, 32, 54–70. [Google Scholar] [CrossRef]
  69. Chon, K. Self-Image/Destination-Image Congruity. Ann. Tour. Res. 1992, 19, 360–363. [Google Scholar] [CrossRef]
  70. Beerli, A.; Martin, J.D. Factors influencing destination image. Ann. Tour. Res. 2004, 31, 657–681. [Google Scholar] [CrossRef]
  71. Hui, T.K.; Wan, T.W.D. Singapore’s image as a tourist destination. Int. J. Tour. Res. 2003, 5, 305–313. [Google Scholar] [CrossRef]
  72. Stern, E.; Krakover, S. The Formation of a Composite Urban Image. Geogr. Anal. 1993, 25, 130–146. [Google Scholar] [CrossRef]
  73. Rafael, C.; Almeida, A. Socio-demographic tourist profile and destination image in online environment. J. Adv. Manag. Sci. 2017, 5, 373–379. [Google Scholar] [CrossRef] [Green Version]
  74. Shankar, S.R. The impact of tourists’ sociodemographic characteristics on perceived destination image. IUP J. Brand Manag. 2019, 16, 26–44. [Google Scholar]
  75. Petrick, J.F. The roles of quality, value, and satisfaction in predicting cruise passengers’ behavioral intentions. J. Travel Res. 2004, 42, 397–407. [Google Scholar] [CrossRef]
  76. Sirakaya, E.; Woodside, A.G. Building and testing theories of decision making by travelers. Tour. Manag. 2005, 26, 815–832. [Google Scholar] [CrossRef]
  77. Senbeto, D.L.; Hon, A.H. The impacts of social and economic crises on tourist behaviour and expenditure: An evolutionary approach. Curr. Issues Tour. 2020, 23, 740–755. [Google Scholar] [CrossRef]
  78. Moya Calderón, M.; Chavarría Esquivel, K.; Arrieta García, M.M.; Lozano, C.B. Tourist behaviour and dynamics of domestic tourism in times of COVID-19. Curr. Issues Tour. 2021. [Google Scholar] [CrossRef]
  79. Pearce, P. Tourist Behaviour: Themes and Conceptual Schemes (Aspects of Tourism); Channel View Publications: Clevedon, UK, 2005. [Google Scholar]
  80. Becken, S.; Simmons, D.G. Understanding energy consumption patterns of tourist attractions and activities in New Zealand. Tour. Manag. 2002, 23, 343–354. [Google Scholar] [CrossRef]
  81. Ozdemir, G. The role of resort planning in sustaining tourist destination image. Gazdálkodás Sci. J. Agric. Econ. 2008, 51, 246–250. [Google Scholar]
  82. Kovačić, S.; Jovanović, T.; Miljković, D.; Lukić, T.; Marković, S.B.; Vasiljević, D.A.; Vujičić, M.D.; Ivkov, M. Are Serbian tourists worried? The effect of psychological factors on tourists’ behavior based on the perceived risk. Open Geosci. 2019, 11, 273–287. [Google Scholar] [CrossRef]
  83. Güçer, E. Destinasyon Seçim Kararında Imajın Etkisi: Antalya Örneği. Ph.D. Thesis, Gazi Üniversitesi Eğitim Bilimleri Enstitüsü, Ankara, Turkey, 2010. [Google Scholar]
  84. Prayag, G.; Hosany, S.; Muskat, B.; Del Chiappa, G. Understanding the relationships between tourists’ emotional experiences, perceived overall image, satisfaction, and intention to recommend. J. Travel Res. 2017, 56, 41–54. [Google Scholar] [CrossRef] [Green Version]
  85. Stylidis, D.; Shani, A.; Belhassen, Y. Testing an integrated destination image model across residents and tourists. Tour. Manag. 2017, 58, 184–195. [Google Scholar] [CrossRef] [Green Version]
  86. Pan, X.; Rasouli, S.; Timmermans, H. Investigating tourist destination choice: Effect of destination image from social network members. Tour. Manag. 2021, 83, 104217. [Google Scholar] [CrossRef]
  87. Malhotra, N.K. Self-Concept and Product Choice: An Integrated Perspective. J. Econ. Psychol. 1988, 9, 1–28. [Google Scholar] [CrossRef]
  88. Kumar, V.; Nayak, J.K. Destination personality: Scale development and validation. J. Hosp. Tour. Res. 2018, 42, 3–25. [Google Scholar] [CrossRef]
  89. D’Astous, A.; Boujbel, L. Positioning countries on personality dimensions: Scale development and implications for country marketing. J. Bus. Res. 2007, 60, 231–239. [Google Scholar] [CrossRef]
  90. Frew, E.A.; Shaw, R.N. The relationship between personality, gender, and tourist behavior. Tour. Manag. 1999, 20, 193–202. [Google Scholar] [CrossRef]
  91. Plog, S.C. Why destination rise and fall in popularity. Cornell Hosp. Q. 1974, 14, 55–58. [Google Scholar] [CrossRef]
  92. Tepavčević, J.; Blešić, I.; Petrović, M.D.; Vukosav, S.; Bradić, M.; Garača, V.; Lukić, D. Personality Traits That Affect Travel Intentions during Pandemic COVID-19: The Case Study of Serbia. Sustainability 2021, 13, 12845. [Google Scholar] [CrossRef]
  93. Allen, L.R. The relationship between Murray’s personality needs and leisure interests. J. Leis. Res. 1982, 14, 63–76. [Google Scholar] [CrossRef]
  94. Martin, W.S.; Myrick, F.L. Personality and leisure time activities. Res. Q. 1976, 47, 246–253. [Google Scholar] [CrossRef] [PubMed]
  95. Driver, B.L.; Knopf, R.C. Personality, outdoor recreation, and expected consequences. Environ. Behav. 1977, 9, 169–193. [Google Scholar] [CrossRef]
  96. John, O.P.; Donahue, E.M.; Kentle, R.L. The Big Five Inventory Versions 4a and 54; University of California, Berkeley, Institute of Personality and Social Research: Berkeley, CA, USA, 1991. [Google Scholar]
  97. Slabbert, E.; du Plessis, L. The influence of demographic factors on travel behaviour of visitors to nature-based products in South Africa. In Proceedings of the Vol. 2—International Conference on Tourism and Management Studies, Algarve, Portugal, 26–29 October 2011. [Google Scholar]
  98. Lu, X.; Pas, E.I. Socio-demographics, activity participation and travel behavior. Transp. Res. 1999, 33, 1–18. [Google Scholar] [CrossRef]
  99. Echtner, C.M.; Ritchie, J.B. The measurement of destination image: An empirical assessment. J. Travel Res. 1993, 31, 3–13. [Google Scholar] [CrossRef]
  100. Russel, J.A. A Circumplex Model of Affect. J. Pers. Soc. Psychol. 1980, 39, 1161–1178. [Google Scholar] [CrossRef]
  101. Jenkins, O.H. Understanding and measuring tourist destination images. Int. J. Tour. Res. 1999, 1, 1–15. [Google Scholar] [CrossRef]
  102. Marine-Roig, E.; Ferrer-Rosell, B. Measuring the gap between projected and perceived destination images of Catalonia using compositional analysis. Tour. Manag. 2018, 68, 236–249. [Google Scholar] [CrossRef]
  103. Hidalgo-Alcazar, C.; Ruiz, S.; Sicilia, M. Emotions and Cognitions When Reading Online Reviews: Effect on Tourism Service Image. J. Technol. Manag. Innov. 2021, 16, 11–21. [Google Scholar] [CrossRef]
  104. Goldberg, L.R. The development of markers for the Big-Five factor structure. Psychol. Assess. 1992, 4, 26. [Google Scholar] [CrossRef]
  105. Bentler, P.M. EQS 6 Structural Equations Program Manual; Multivariate Software, Inc.: Encino, CA, USA, 2006. [Google Scholar]
  106. Browne, M.W.; Cudeck, R. Alternative ways of assessing model fit. In Testing Structural Equation Models; Bollen, K.A., Long, J.S., Eds.; Sage: Beverly Hills, CA, USA, 1996; pp. 136–162. [Google Scholar]
  107. Hoyle, R.H. Structural Equation Modeling: Concepts, Issues, and Applications; Sage: Thousand Oaks, CA, USA, 1995. [Google Scholar]
  108. Hair, J.F.; Black, W.C.; Babin, B.J.; Anderson, R.E.; Tatham, R.L. Multivariate Data Analysis; Pearson Education: Hoboken, NJ, USA, 2010. [Google Scholar]
  109. Fornell, C.; Larcker, D.F. Structural equation models with unobservable variables and measurement error: Algebra and statistics. J. Mark. Res. 1981, 18, 382–388. [Google Scholar] [CrossRef]
  110. Barrick, M.R.; Mount, M.K. The big five personality dimensions and job performance: A meta-analysis. Pers. Psychol. 1991, 44, 1–26. [Google Scholar] [CrossRef]
  111. Wang, C.C.; Yang, Y.J. Personality and intention to share knowledge: An empirical study of scientists in a R&D laboratory. Soc. Behav. Personal. 2007, 35, 1427–1436. [Google Scholar]
  112. Jackson, M.; Schmierer, C.; White, G. Is there a unique tourist personality which is predictive of tourist behaviour? In Tourism and Hospitality: Delighting the Senses; Molloy, J., Evans, J., Eds.; Bureau of Tourism Research: Canberra, Australia, 1999; pp. 39–47. [Google Scholar]
  113. Costa, P.T.; McCrae, R.R. Revised Personality Inventory (NE0 PI-R) and NE0 Five-Factor Inventory (NEO-FFI); Professional Manual; Psychological Assessment Resources: Odessa, FL, USA, 1992. [Google Scholar]
  114. Izadi, M.; Ahmadinejad, S.; Omid, S. A Survey of Cognitive and Psychological Factors Effective on Travelling. IJTMGH 2015, 3, 75–80. [Google Scholar] [CrossRef] [Green Version]
  115. Milgram, S. The experience of living in cities. In Crowding and Behavior; Loo, C.M., Ed.; MSS Information Corporation: New York, NY, USA, 1974. [Google Scholar]
  116. Madrigal, R.; Kahle, L.R. Predicting vacation activity preferences on the basis of value-system segmentation. J. Travel Res. 1994, 32, 22–28. [Google Scholar] [CrossRef]
  117. Jani, D. Relating travel personality to Big Five Factors of personality. Turiz. Međunarodni Znan. Stručni Časopis 2014, 62, 347–359. [Google Scholar]
  118. Li, C.-Y.; Tsai, B.-K. Impact of Extraversion and Sensation Seeking on International Tourism Choices. Soc. Behav. Personal. 2013, 41, 327–333. [Google Scholar] [CrossRef]
  119. Sung, H.Y.; Morrison, A.M.; O’leary, J.T. Segmenting the adventure travel market by activities: From the North American industry providers’ perspective. J. Travel Tour. Mark. 2000, 9, 1–20. [Google Scholar] [CrossRef]
Figure 1. Hypothesized relationships between variables.
Sustainability 14 01803 g001
Table 1. Sociodemographic profile of respondents (n = 502).
GenderAge
Male
Female
36.7%
63.3%
Average age = 27.22, Std. = 9.906
Age range (18–75)
EducationEmployment status
Elementary
Secondary school
Higher school
Faculty
Master studies
Ph.D.
2.4%
50.2%
4%
23.3%
16.3%
3.8%
Pupil
Student
Employed
Unemployed
Retired
3.2%
55.8%
35.1%
5%
1%
MaritalstatusMonthly income
Single
I have a boyfriend/girlfriend
Living with a partner
Married
Divorced
Widowed
39.6%
38.8%
3.2%
15.1%
2.8%
0.4%
Without income
Below average
Average
Above average
48%
17.5%
18.7%
15.7%
The place where respondents grew up
City (over 20,000 inhabitants)        58.2%
Town (between 5000–20,000 inhabitants)   18.7%
Village (bellow 5000 inhabitants)        23.1%
Table 2. Latent dimensions of activity (three-factor solution).
Participation in Organized Events (F1)Thematic Activities (F2)Passive Visit
(F3)
Participation in a conference held at the site0.816
Participation in a festival dedicated to the Romans0.788
Sleeping in an authentic Roman villa0.680
Participation in summer camp0.659
Participation in archeological workshops0.626
Watching multimedia content (movies, screenings) about the Roman site and cultural route in the visitor center0.622
Participation in the event “St. Emperor Constantine and Empress Jelena”0.619
Participation in the event “Roman Night” promoting Roman heritage in Serbia0.586
Workshops for children0.530
Attending Roman rituals performance 0.707
Visit exhibitions and museums dedicated to the Romans 0.688
Observing the race of horses and chariots at the racetrack, as well as riding the horses 0.677
Tasting of wine made from the authentic Roman grape variety 0.668
Meal at a restaurant with authentic Roman ambiance and food 0.656
Treatments in a Roman bath (thermal baths) 0.652
Riding the Roman galleys 0.649
Participation in Roman meal preparation workshops 0.646
Participation in the ancient Roman maze for play and education 0.633
Observing the simulation of gladiatorial fights in the amphitheater 0.585
Visiting the remains of Roman artworks (murals, mosaics, etc.) 0.743
Tour of Roman architectural heritage (palaces, amphitheater, aqueducts, spas, tombs) 0.742
Listening to lectures on Roman history and emperors 0.695
Visit the site with an audio guide 0.662
Listening to lectures on the latest discoveries and research on the site 0.662
Sightseeing tour with an expert guide 0.651
Table 3. Descriptive statistics and scale reliability.
VariableMeanStd.
Deviation
CronbachαAVECR
Tourist personality
Extraversion3.160.6260.7160.560.91
Agreeableness3.190.8200.8200.560.92
Conscientiousness3.140.6230.7210.490.89
Neuroticism2.650.5180.7180.590.92
Openness to experience3.660.4950.7430.600.93
Destination
personality
Excitement3.510.9480.8700.630.87
Sincerity3.820.8090.8610.550.86
Competence3.800.7570.8230.420.81
Sophistication3.600.9120.8460.490.83
Ruggedness3.480.8500.8210.570.84
Destination image
Cognitive image3.620.5650.9250.510.97
Affective image0.7640.7640.7380.520.84
Activity preferences
Participation in organized events3.760.7540.8320.440.87
Thematic activities4.030.7260.8640.430.88
Passive visit3.880.7690.7790.480.85
Table 4. Squared correlation estimates and average variances extracted.
123456789101112131415
1 Excitement0.63
2 Competence0.3520.42
3 Ruggedness0.1840.4070.57
4 Sophistication0.1910.1040.1200.49
5 Sincerity0.2490.4380.3680.1340.55
6 Extraversion0.0130.0100.0170.0530.0070.56
7 Agreeableness0.0360.0060.0080.1250.0010.3010.56
8 Conscientiousness0.0200.0060.0060.0430.0030.2990.3670.49
9 Neuroticism0.0080.0000.0010.0350.0020.0560.1460.1120.59
10 Openness to experience0.0660.0810.1230.0460.0830.0870.0490.0880.0080.60
11 Cognitive image0.1550.2250.1470.0710.2220.0300.0220.0130.0010.1240.51
12 Affective image0.0430.0570.0490.0020.0490.0620.1180.0840.0260.0730.0880.52
13 Organized events0.0070.0130.0300.0000.0120.0250.0230.0060.0020.0110.0070.0080.44
14 Thematic visits0.0020.0220.0140.0000.0120.0110.0030.0040.0010.0010.0010.0080.1810.43
15 Passive visits0.0100.0020.0010.0170.0030.0250.0610.0420.0030.0030.0050.0030.0000.0040.48
Note: Italics indicate average variances extracted (AVEs).
Table 5. Fit indices of measurement models.
ModelS–Bχ2dfχ2/dfRMSEASRMRCFI
1713.161425.020.090 (0.083–0.096)0.1070.844
2328.49953.450.070 (0.062–0.078)0.0750.900
3262.54793.320.068 (0.059–0.077)0.0860.925
Note: all values of S–B χ2 are significant at the level p < 0.001.
Table 6. The results of the structural model and hypothesis testing.
Confirmed RelationshipsBS.E.p-Value
H1a: Tourist personality→Destination Personalitysupported
Extraversion→Sophistication−0.1400.0350.003
Agreeableness→Excitement−0.2800.0330.000
Agreeableness→Sophistication−0.3040.0230.000
Openness→Sincerity−0.2830.0380.000
Openness→Excitement0.1920.0410.000
Openness→Competence0.1400.0370.003
H1b: Sociodemographic characteristics→Destination Personalitysupported
Monthly income→Sophistication0.1230.0250.004
Employment status→ Sophistication0.1540.0330.002
H2: Destination image→Destination Personalitysupported
Affective image→Excitement0.1600.0300.000
Cognitive image→Sincerity0.4320.0310.000
Cognitive image→Excitement0.3310.0380.000
Cognitive image→Competence0.4510.0410.000
Cognitive image→Sophistication0.3000.0370.000
Cognitive image→Ruggedness0.2740.0310.000
H3a: Tourist personality→destination imagesupported
Agreeableness→Affective image0.2920.0420.000
Openness→Affective image0.2130.0310.000
Openness→Cognitive image0.3500.0370.000
H3b: Sociodemographic characteristics→destination imagepartially supported
Place of growing up→Cognitive image0.1420.0270.001
H4: Destination image→tourist activity preferencesnot supported
H5: Destination personality→tourist activity preferencessupported
Sincerity→Passive visit−0.0910.0310.000
Ruggedness→Participation in organized events0.1530.0380.000
H6: Tourist personality→tourist activity preferencessupported
Extraversion →Participation in organized events0.1400.0310.004
Conscientiousness→Passive visit−0.1240.0370.001
Agreeableness→Passive visit−0.2100.0290.000
Openness→Passive visit0.1700.340.002
H7: Sociodemographic characteristics→tourist activity preferencesnot supported
Publisher’s Note: MDPI stays neutral with regard to jurisdictional claims in published maps and institutional affiliations.

