Article

Adopting Carbon Pricing Tools at the Local Level: A City Case Study in Portugal

by
Lurdes Jesus Ferreira
1,*,
Luís Pereira Dias
2 and
Jieling Liu
1
1
Centro de Engenharia e Desenvolvimento CEIIA, Av. D. Afonso Henriques, 1825, 4450-017 Matosinhos, Portugal
2
CENSE—Centre for Environmental and Sustainability Research Energy and Climate, Campus de Caparica, NOVA School of Science and Technology, NOVA University Lisbon, 2829-516 Caparica, Portugal
*
Author to whom correspondence should be addressed.
Sustainability 2022, 14(3), 1812; https://doi.org/10.3390/su14031812
Submission received: 22 November 2021 / Revised: 23 January 2022 / Accepted: 25 January 2022 / Published: 5 February 2022
(This article belongs to the Special Issue Energy Economics in Sustainability)

Abstract

:
Debates on carbon costs and carbon pricing to accelerate the reduction of greenhouse gas (GHG) emissions are emerging as cities develop local policies and programs to achieve carbon neutrality. This paper focuses on how cities formulate economic instruments and adopt carbon pricing experiments to support their climate objectives. Extensive literature is available on science-policymaking interface Integrated Assessment Models (IAM) and on the two mainstream approaches of carbon cost formulation—Social Cost of Carbon (SCC) and Marginal Abatement Cost (MAC). Although, the literature on how governments develop climate policy instruments, particularly towards a local carbon cost, is recent. We start by reviewing these essential concepts and tools for carbon cost formulation. We then critically review a set of local carbon pricing experiments, totaling fourteen international cities, and confirm a great demand for scientifically robust, verifiable, and transferable carbon cost methodologies at the local level. We thus propose an approach to assess the short-term technology cost of CO2 emission reduction in the mobility sector in Matosinhos municipality, Portugal. Our approach shows that a carbon cost methodology at the local level with robust, verifiable, and transferable results is possible. We advocate for a methodological advance to estimate versatile CO2 prices suitable for local conditions.

1. Introduction

Cities are entering the central debate on carbon pricing policies, as they are increasingly committed to climate action [1,2,3,4]. In 2021, 11,193 cities had some form of climate action [5], 733 cities committed to net-zero [6], and just 34 subnational jurisdictions, including cities, had carbon pricing initiatives [7]. The number of cities decreases as climate responses become more demanding, from policy to instruments and from instruments to actions for net-zero. Since the Paris Agreement encouraged the involvement of subnational actors and defined the next generation of carbon markets, whose rules were approved six years later in COP26 [8], pricing is gaining new strength as an efficient and effective policy instrument for reducing GHG emissions, as Baranzini et al. [9] anticipated.
The recognition of cities as key actors in reaching emission reduction targets drives local governance towards rapid institutional transformation, both in content and form [10,11]. However, carbon price at the local level has not received the same level of consideration as at the national or regional levels. The main motivations for a country to adopt a price on carbon are associated with the access to a new source of public revenue, avoiding climate damage, and obtaining additional co-benefits such as reducing air pollution and improving public savings. Historically, climate change models and concepts to support GHG emission mitigation policies were designed and developed for global, regional, and national scales. Cities with strong climate action objectives and plans, especially those with climate neutrality targets, are considering the use of carbon pricing, with similar motivations as countries, states, or regions.
This research aims to contribute to the study on how cities are addressing the challenge of localizing a carbon cost, using GHG emission mitigation policy cost assessment tools and carbon pricing mechanisms, and how they can adopt methodologies that enable reliable results. Section 2 presents the methods and materials for this research, and Section 3 reviews the main concepts of carbon costs—Social Cost of Carbon (SCC) and Marginal Abatement Costs (MAC), and the tools for carbon climate policy Integrated Assessment Models (IAMs) that enable the estimates of carbon costs that interest cities. Due to a lack of literature dedicated to how cities are “localizing” carbon costs, in Section 4 we critically review and discuss our selection of 14 pioneering carbon pricing initiatives in Western and Eastern cities and regions. Section 5 presents our original approach to assess the short-term technology cost of CO2 emission reduction at the local level, based on mobility transition, which will support a local voluntary carbon market in Matosinhos, a city in Portugal. In Section 6, we present our conclusions and recommendations.

2. Methods and Materials

We used a methodology to characterize how cities are adopting carbon pricing mechanisms and identify, through the case study, the potential for advancement. We started by constructing a theoretical framework which includes the concepts (SCC and MAC) and the tools (IAMs) related to the estimate of the cost of carbon and that are decisive for cities as emergent global climate actors experiencing carbon pricing initiatives. As literature on cities’ experience with carbon pricing initiatives is fairly recent and not yet allowing a comprehensive overview, following the theoretical framework, we conducted a wide-range internet search to identify pioneering carbon pricing initiatives at the local level. The main selection criterion was cities around the world associated with a carbon pricing experiment, implemented, scheduled, or under consideration, whatever the price mechanism adopted or considered. The critical review of these emerging local carbon pricing initiatives confirmed the urgent need for a scientifically robust, verifiable, and transferable carbon cost methodology at the local level.
Based on this, we present our case study in the city of Matosinhos in Portugal, which is an application of a short-term technology MAC model for the cost of CO2 emission reduction associated with low-carbon mobility adoption and which will support the voluntary carbon market. The assessment of the CO2 price emerged from the necessity to have a carbon price consistent with the practical circumstances of the case study. We used the dynamic linear optimization bottom-up energy system model TIMES_PT and considered different transportation and mobility modifications. We chose to adapt TIMES_PT to the scale of the city and present a methodological advance that allows the estimate of versatile CO2 prices connected with different mobility options. We considered the values of the Pack scenario under the Portuguese National Carbon Neutrality Roadmap project and developed 17 scenarios representing possible mobility choices by progressive Matosinhos citizens towards more sustainable options at the local level. Scenarios were grouped into three categories representing the different low-carbon mobility options, namely: public transportation (PT), active mobility (AM) (we included defined soft mobility modes, including any human-powered (non-motorized) or partially e-mobility (e.g., e-bike), and therefore pedestrian, bicycle, and small electric-assisted vehicles were included as feasible alternatives to car use for short distances), and shared mobility (SM). We further develop our findings in the following discussion, conclusions, and recommendations.

3. Concepts and Tools for Estimating the Cost of Carbon

Concepts and models of climate economics developed by researchers and modelers in recent decades have been suitable primarily for large scales of analysis and often in a top-down manner. The local dimension of climate policy is increasingly testing the adequacy of these concepts and models, as local governments begin to explore how to estimate the cost of carbon locally and thereby a local carbon price to formulate progressive climate policy. The question is what existing concepts, models, and methods can do for local climate governance and for incorporating local GHG emissions reduction into national targets.
The cost of carbon is the value attributed to one unit of carbon (per ton) and the price of carbon is the explicit price for that unit of carbon for the market. In climate policy, the cost of carbon should inform the price of carbon. Carbon pricing embraces these concepts as the “polluter pays” principle and in practice, carbon tax and the carbon market (e.g., emissions trading, carbon credits) are the most well-known carbon pricing mechanisms that reflect this principle.
The cost-benefit considerations and impact assessment of climate policies need to include carbon cost concepts such as the SCC or MAC, which also can influence the structure of a given IAM that analyzes the impacts and associated costs. SCC and MAC as concepts are different and complementary, while IAMs as tools operationalize these concepts inclusively. IAMs have been developed to expand and integrate additional components as scientific knowledge on the climate system and climate economics advances. Therefore, it is reasonable to expect that IAMs will include more features that take into account the increasing nuances required in carbon cost calculation and become more complex. The progresses of IAMs are expected to focus on microscales.

3.1. Social Cost of Carbon and Marginal Abatement Cost

The concepts Social Cost of Carbon (SCC) and Marginal Abatement Cost (MAC) represent two mainstream approaches for estimating the carbon cost. The SCC represents the economic cost (damage value) that society incurs for emitting an additional ton of CO2 into the atmosphere for the time it will remain there (or the benefit for reducing it). SCC includes considerations of climate change damages to agriculture, human health, and property, and non-market damage such as the services that natural ecosystems provide to society [12]. SCC has been used primarily by national government agencies or international organizations to calculate the impact of climate policies based on a cost–benefit analysis. Researchers initially used the concept of SCC for the global scale and over time discussed it at large regional and national scales [13,14,15]. SCC is generally considered to have some major weaknesses, namely: complexity, subjectivity of discount rate, and the uncertainty of climate change impacts. Stern proposed that the discount rate should be zero as an attempt to solve this variability of the SCC and to avoid disproportionate burdens for the future caused by climate damage today due to overestimation of the present value of economic damage caused. The SCC approach to mitigate or explain the uncertainty elements results in a large variability of values, depending on the parameters, ranging from less than 0 to 1909 EUR/tCO2 (0 to 2300 USD/tCO2) [16] (assuming 1 US$ = 0.82 €; and CO2 and carbon are used here interchangeably), and with concentration of results between 8.3 and 166 EUR/tCO2 (10 and 200 USD/tCO2). Pindyck [17,18] proposed the average SCC from an elicitation with experts after criticism of the “pure guesswork” on critical matters of climate and social science that are themselves uncertain (e.g., tipping points). His large survey of climate economists and scientists showed that the highest average value (163 EUR/tCO2 (200 USD/tCO2)) for economists was the lowest value for climate scientists. Wang et al. [16] proposed a revised SCC calculation method, and Tian, Ye and Zhen [19] created a new simplified model for SCC calculation. When assessing the SCC at the country level, Ricke et al. [20] identified inequality in climate change impacts geographically as well as the contribution of each country to global emissions and the risk of unilateral climate action. Tol [21] estimated the national SCC and the penalty on the poorest and most populous countries. An important criticism also comes from the environmental science: SCC leads to an underestimation of fundamental costs of climate change such as ocean acidification and humanitarian and social impacts [22], which are not quantified in terms of GDP.
The other method for carbon cost estimation is the MAC—the cost of reducing an additional unit of emissions and the basis for measuring the capacity of an economy to support the cost of decarbonization, in relation to energy technology sectors. It is cost-effective-driven and does not consider the climate damage cost component. The MAC approach was developed following the oil shocks of the 1970s and the need to reduce energy consumption (fossil fuels and electricity) and air pollutants. Afterwards, researchers started to integrate carbon emissions and other sectors with strong climatic impacts into analyses using the MAC approach, such as agriculture and water.
Interest in MAC increased dramatically when the Paris Agreement in 2015 shifted the political focus from a carbon tax extracted from SCC to a committed timeframe, CO2 concentration, and temperature targets [17], and even more so when nations began to commit to carbon neutrality by mid-century. Carbon neutrality corresponds to a state of “balance between anthropogenic emissions by sources and removals by sinks of greenhouse gases” [23]. One MAC model that the International Energy Agency (IEA) has been developing is TIMES, in collaboration with member countries and academic institutions in open source and for several decades. Country members of the IEA use TIMES to simulate short-term average technology costs from the energy transition to carbon neutrality in 2050.
Pezzey [24] points out that it is preferable to estimate the carbon price closer to the target-based climate policies, while also recognizing uncertainties that remain in the MAC. The focus on reduction targets strengthens the adequacy of MAC to capture the effort of emissions reduction. Kaufman et al. [25] advocate for an alternative to the carbon price definition in a carbon-neutral horizon in 2050, based on a short-term MAC model (near-term to net-zero, or NT2NZ). The approach results in prices around 103.75 EUR/tCO2 (125 USD/tCO2) in 2030. Stern and Stiglitz [26] considered this approach as imperfect and transparent, as the SCC is uncertain and complex, proposing an alternative approach to the classic SCC that puts it at 83 EUR/tCO2 (100 USD/tCO2) (Table S1 in the Supplementary Information). They include the 2 °C increase limit as an additional constraint to the model, assuming that climate damage from the maximum limit drawn in the Paris Agreement costs more than 2% of GDP/year.
Much of the literature on the complexity, uncertainty, and subjectivity of the SCC and the limitations of the MAC shows that there is not an ideal approach, and policymakers should instead use a set of tools to assess climate policy. The problems pointed out with the SCC at the global or country levels are amplified when applied at a subnational level and smaller scales. As a global value harmonized to maximize efficiency, SCC is highly aggregated, and the smaller the scale (from global to regional, from regional to national, or from national to local), the greater the possible error margin. Although Pindyck [18] finds a general preference among economists for the SCC, the complexity of the estimates represents a barrier for policymakers and practitioners to understand [27,28].
As for the impacts of carbon pricing, Best, Burke and Jotzo [29] found evidence that in countries with carbon pricing, the average annual growth rate of CO2 emissions from fossil fuel consumption is 2% lower than in countries that do not have carbon pricing. Green [30] found that most studies concern Europe, and that the aggregate reductions range is modest, ranging from 0% to 2% per year. Lilliestam, Patt, and Bersalli [31] state that there is still no empirical evidence of carbon pricing effectiveness in promoting the technological change necessary for full decarbonization.
To summarize, both methods share the economic concept of marginal cost, and while the SCC is the marginal cost of damages associated with carbon emissions (when emitting less, the cost decreases), the MAC is the marginal cost of reducing emissions (when emitting less, the cost rises). Both have advantages and disadvantages. Comparing SCC and MAC, economists agree that MAC is not as sensitive to the discount rate as SCC is and does not use the damage function. MAC responds to how to decarbonize a sector in a given time constraint, and it allows for the modeling of regions/countries, as Ibrahim and Kennedy [32] as well as others have previously shown.

3.2. Integrated Assessment Models

Integrated Assessment Models (IAM) as a type of science and policymaking interface have been developed to estimate the cost of carbon, in the form of SCC or MAC. They simulate and calculate the optimal level of implementation of decisions/policies, while dealing with highly complex natural (climate) and social (economic) systems. Historically, an IAM includes key elements of the climate change mitigation and climate impacts systems in order to project alternative future climates with and without various types of policies [33]. When IAMs began to be increasingly used in climate policy analysis and policymaking in the 1990s, the rationale was to support policy on climate change mitigation and adaptation at the global level [34]. Today, IAMs are increasingly needing to be improved to suit analysis at the regional, national, or subnational levels, especially since the shift of focus of the Paris Agreement from global action to bottom-up initiatives and national mitigation policies [35]. An example of IAM adaptations to incorporate specific characteristics is the new single-region model—DEMETER-CCPE (previously a global IAM), which addresses regional climate policies from the perspective of cost–benefit efficiency [36]. The current diversity of IAM reflects different perspectives of analysis supporting climate policy decisions, such as cost-effectiveness, cost–benefit efficiency, and technology abatement contribution [37,38], which are useful to estimate the cost of carbon. The main limitations pointed out for IAM (assumptions uncertainty, transparency, replicability, and information) derive from the complexity of the climate puzzle (tipping points) and the policy decision (discount rate). Their detractors call them a “black box”. The strength of these newly adapted models is the systematic exploration of model, value, and parameter uncertainties, which improves the transparency of results and is thereby more useful for subnational decision makers [33].
We focus on the practical perspective of the local-level carbon cost debate in the next two sections. First, we critically review how 14 pioneering cities are estimating their local costs of carbon and building carbon pricing schemes. Then, we present a comprehensive case study, in which we applied a short-term MAC model to estimate the local cost of carbon in the city of Matosinhos, Portugal.

4. Carbon Pricing Initiatives at the Local Level

In this section, we overview nine carbon pricing experiments at the subnational level across fourteen cities, five of which belong to the Chinese subnational pilot program We identified seven Western cities (Boulder, New York City, Ann Arbor, Oslo, Bologna, Aradippou, and Lahti) and seven Eastern cities (Tokyo) (Kojima and Asakawa [37] consider Tokyo’s first metropolitan cap-and-trade program for office buildings to be local, other authors consider it regional [39], given its population size of 13.3 million, and in this article, we assume that a metropolitan area is still a local level), Singapore, Beijing, Tianjin, Shanghai, Shenzhen, and Chongqing), corresponding to three regions: America, Europe, and Asia, respectively. One of the Eastern cities is an island city-state, and the other five (Beijing, Tianjin, Shanghai, Shenzhen, and Chongqing) form the Chinese pilot cities group within three provinces (Fujian, Guangdong, and Hubei), sharing a common and integrated program (the pilots in the Chinese cities are unique in that they are climate actions at the subnational level but are also designed and coordinated under a single pilot program at the national level). These 14 cities were identified primarily via internet research, and the main criterion for this selection was cities that have implemented, scheduled, or even just considered running a carbon pricing experiment, until April 2021 (For general introduction of these initiatives, please refer to Boxs S2–S11 in Supplementary Information).
We first present the distinctive aspects of each initiative (Table 1), including population size, geography, pricing mechanisms solutions (carbon price, trading scheme, or other), covered sectors (buildings, transportation, or other), and visibility (direct, indirect, or other). Other characteristics were considered, namely the average price, the revenues destination from collecting carbon taxes, the initiatives regime (experimental or mandatory), and the ambition of the emission reduction target, since these can be indicators of cities’ degree of commitment to climate action. We also introduced two countries’ indicators (country prevailing carbon signal and GDP per capita PPP) to contextualize the city ambition level in relation to the country.
All cities that adopted pricing mechanisms have committed to targets of climate neutrality, most of them after 2050, which is the case for the Chinese pilot cities and Singapore. Only two cities planned it for earlier (Oslo by 2030 and Lahti by 2040), with the rest planning for by 2050. Our review also shows that those cities experimenting with carbon pricing instruments belong to countries with an above global-average GDP per capita PPP (in current international dollars) of 14,000 EUR (17,100 USD), i.e., in the developed world. As developing countries begin to adopt carbon pricing measures [39] subnational carbon pricing initiatives can scale up and extend their scopes. Megacities are the majority and are also the ones establishing mandatory initiatives, in contrast to cities of smaller scales, where most of them are experimental. Thus, city population size appears to matter as a driver toward more ambitious climate actions. These cities also tend to have a mixed behavior regarding pricing mechanisms, with half tax and half ETS, while all megacities opt for ETS (NYC, Tokyo, the Chinese program), or seldomly use both instruments in a complementary way, such as in Singapore. In general, macro-socioeconomic drivers influence carbon prices, and local-level carbon markets could be more volatile given their relatively small scale [40].
In general, these cities apply a diversity of pricing mechanisms and prices, although there is scarce literature that ascertains whether these cities have designed their carbon pricing policy instruments and pilots based on IAM and SCC and/or MAC, or broadly, how the design process was conducted. None of the cities we reviewed have made public what kind of carbon cost methodology was applied, nor have they shown an explicit alignment with their respective countries. This lack of information is possibly due to their recent status, small number, and available public information in English. However, it also shows evidence that a robust, transferable local carbon cost methodology is still much needed. This finding is consistent with the few subnational-level carbon pricing cases indicated in the World Bank database. The exception is Lahti, which took a step forward towards a carbon pricing methodology, as since the beginning of its process, it considered different CO2 prices based on the literature or prices from national/supranational ETS (e.g., EU-ETS). The municipality adopted the “expert guess” method. As for Oslo, Lind and Espegren [41] analyzed the city’s low-carbon transition pathway using TIMES energy system model, and testing three different scenarios. Their research indicates 2050 Oslo energy system optimal solutions with an overall cost between NOK 2300/2370 (€223.5/€230.3) per ton of CO2e removed.
All of these cities have adapted traditional national and supranational market-based instruments that are top-down and regulated. Results do, however, show significant diversity in the specific configuration of each local carbon pricing experiment regarding the applied scheme. No two cases are alike between small and/or large cities, and differentiating aspects stand out, such as: pre-tax carbon (Boulder), local/regional market model for national ETS (China), indirect cost of carbon (Oslo), use of the international voluntary market for the local dimension (Aradippou), the world’s first local cap-and-trade program for office buildings (Tokyo), fines for non-compliance with emission ceiling such as de facto carbon ceiling (NYC), and global carbon crediting market (Singapore).
We found that the ambition for reducing emissions is also diverse, namely, the commitment of effort, time, and sectors covered. Ann Arbor has defined ambitious targets of reaching carbon neutrality in 2030, but has yet to develop a concrete price mechanism, Lahti in 2040, and Singapore after 2050. Cities also estimate their carbon pricing initiatives to cover between 20% and 70% of their total emissions, prevailing in construction (Boulder, Ann Arbor, Oslo, Aradippou, NYC, and Tokyo), mobility (Oslo, Bologna, and Lahti), and industry (the Chinese program and Singapore). Despite the ambition, these cities still need robust methodologies and process verification of the impacts of their pilots in order to unreservedly integrate the respective emission reduction contributions into national inventories. Data on impacts are scarcer than ex-ante information, and the Tokyo case is an example. Electricity prices, regulatory decisions, and extreme events are possible external causes to consider for emission reduction [42].
The above local carbon pricing and emissions trading experiments share a few common technical challenges. First, many of them share a price fluctuation problem, which is partially influenced by macro-socioeconomic factors. Excessive price fluctuation could negatively impact the participation of emitters and thereby the effectiveness of their schemes. However, the impact of macro-socioeconomic factors on the carbon prices at different levels is not constant, rather, local contextual specificities such as dependence on certain types of energy also influence carbon prices [43], making the price fluctuation problem a highly complex issue to resolve. Second, regional transfer of goods and services inevitably results in the distortions of carbon as well as pollutant emission records, creating boundary disputes or at least inaccuracy in emission coverage. Third, emission management via ETS can sometimes be conflictual to pollutant control [44]. This is because emission management via ETS is based on the “emitters pay” principle, and those who are willing to pay might acquire an additional emission allowance, which could still make the ETS effective in market terms, but could also potentially increase the emission of air pollutants. Fourth, few studies or considerations have been concerned with the potential spillover effect of costs and benefits on ordinary consumers in existing local ETS pilots worldwide. Furthermore, the premise of technical, time, and transboundary uncertainties will always be a challenge for the Monitoring, Reporting, and Verification (MRV) process, which is critical for an ETS to function properly and truly serve long-term emission reduction goals. Lastly, how to increase the level of citizen participation of regional or local ETS beyond financing channels such as carbon fund investing has been seldomly explored.
From a governance perspective, the comparison of these carbon pricing initiatives at the subnational and local levels makes the difference between the Chinese case and the rest of the group clear. For the Western cities, neither literature nor primary sources mention an articulation with other levels of governance, especially at the national level, suggesting a similarity with other past forms of municipal voluntarism [45] and insufficient multilevel governance (this governance model analysis does not apply to Singapore as a megacity state) articulation to leverage climate action [46].

5. Case Study—Assessment of a CO2 Price to Support City Transportation Mobility Decarbonization

Despite cities’ continuous effort and policy engagement towards decarbonization [47], their transformative capacity depends on economic sectors with a low direct influence capacity: residential and transportation sectors. Moreover, cities’ transition strongly depends on citizens’ behavior and/or technology changes, such as citizens/households’ available budget [48] and behavior factors such as acceptability and preferences [49].
In this context, AYR, the blockchain-based sustainability platform [50] aims to support cities in their carbon-neutral transition process by rewarding local citizens for their low-carbon mobility choices. The platform will reward people and communities that avoid emitting CO2 (as opposed to making them pay for their emissions) by creating and enabling voluntary local carbon markets in which green digital credits circulate as ‘eco-tokens’. Users can exchange these credits for sustainable services and companies can offset them to compensate for their local carbon footprint, altogether accelerating the global transition towards carbon-neutral cities.
One key component of the platform is the CO2 price, since it is the feature that will determine the revenue generated by the sustainable mobility choices of each citizen. The assessment of the CO2 price emerged from the necessity to have a carbon price consistent with the circumstances of the case study rather than values based only on the literature. This section aims to describe the approach applied to determine a CO2 price to be used in the AYR platform project in Matosinhos municipality in Portugal. The approach included three main steps: (1) setting a range of scenarios to simulate different and progressive local citizens’ mobility choices towards more sustainable options, (2) convert the mobility scenarios assumptions in energy system modeling inputs, and (3) result analysis.

5.1. Case Study Characterization

The municipality of Matosinhos is part of the Oporto metropolitan area (in northern Portugal). It is the sixth most populated area (2802 inhabitants/km2), with 174,870 (2019) inhabitants living in an area of 62.42 km2 (INE, 2020). Although the municipality has significant industry activity, the transportation sector was responsible for more than half of the total municipality GHG emissions in 2015 (Table 2).
The GHG emission per capita in Matosinhos municipality is between 5.6 and 7.0 tCO2e/capita (in 2015, considering, respectively, scope 1 and scope 1 and 2 emissions) and is above the national average of 4.75 tCO2e/capita [52].
Although the municipality shows a decreasing tendency in emissions (−25% between 2015 and 2019), it still demonstrates a high effort to further reduce its GHG emissions level, with the transportation sector at the core of the challenge. Moreover, the municipality has significant industrial activity, with a refinery located within the municipality administrative boundaries, which, if considered in the estimation, can correspond to a significant increase of 59% of total municipality GHG emissions in 2015.
The municipality has defined objectives under the covenant of mayors and recently committed to carbon neutrality in line with the 2050 national objectives. Therefore, with the recognition that local citizens have an active and determinant role in this municipality mitigation process, the AYR project aims to promote a behavior change of local citizens towards more sustainable mobility habits and choices [53].
Extensive literature suggests that the attribution of carbon price to pollutant activities is a cost-effective tool for reducing GHG emissions [54] and has been an essential component in climate policy formulation [30]. This is also evident in the extensive number of carbon prices (in different forms) across national and subnational jurisdictions [55]. There is also the recognition of the potential of local carbon markets for GHG emissions reduction in local areas [56] such as the examples from Lahti [57]. Nevertheless, as previously shown, there is a recognition of the importance of the carbon price value. Setting a CO2 cost was identified as a key element of the pilot study, since it can determine the adoption and fulfillment of the AYR platform and municipality climate mitigation objectives.
Based on the near-term to net-zero (NT2NZ) approach [25] the following methodology was adopted to estimate a CO2 price consistent with the national net-zero GHG emission target and different and incremental sustainable mobility adoption levels. This was made by assuming new national transportation and mobility sector transformations that represent low-carbon mobility objectives in Matosinhos that the AYR platform aims to support. This is perceived as a projection of Matosinhos municipality’s low-carbon mobility objectives to the national level.

5.2. TIMES_PT Model

To assess the CO2 costs associated with the Portuguese energy system reconfiguration, considering different transportation and mobility modifications we used the dynamic linear optimization bottom-up energy system model TIMES_PT (The Integrated MARKAL-EFOM System) [58,59,60,61]. TIMES is part of a family of MARKAL-TIMES optimization energy models developed by ETSAP (Energy Technology Systems Analysis Program) from the International Energy Agency, which are widely used for the analysis of climate and energy scenarios and policies. TIMES_PT incorporates the whole Portuguese energy system and is a peer-reviewed model that has been in use for more than 15 years [62,63,64], including its application in supporting the Portuguese energy and climate mitigation policies [64,65,66], and more recently, it was used to develop the Portuguese Carbon Neutrality Roadmap [67]. The model has also been applied at multiple levels of scale, from European [61,68], national [62,69], to local levels [49,70,71,72,73]. TIMES_PT represents the Portuguese energy system from 2005 to 2070 and is disaggregated in: primary energy supply, electricity generation, industry, residential, commercial, agriculture, and transportation. TIMES_PT represents the energy system of Portugal and its possible long-term developments. The actual system encompasses all the steps from primary resources in place to the supply of the energy services demanded by energy consumers, through the chain of processes which transform, transport, distribute, and convert energy into services. The ultimate goal of the model is the satisfaction of the energy services demand at the minimum total system cost (i.e., net surplus maximization), subject to technological, physical, and policy constraints. TIMES_PT defines an optimal combination of existing and emerging technologies, using different forms of energy, while respecting the framework of polices and measures imposed and the national potential of endogenous resources (including hydro, wind, solar thermal, and biomass). The model results provide insights on the climate mitigation transition cost for the full energy system and correspondent sectors. The model structure determines the energy system costs [74] consistent with the net-zero GHG emissions target. The model allows to develop scenarios that represent varying degrees of conditions associated with climate transition. In this work, the scenarios focus on the combination of strong climate mitigation objectives and variations of low-carbon mobility solutions’ deployment. The developed scenarios aim to assess complex energy system configurations and contextualize the associated costs to inform policy and local transition mechanisms design.
The transportation and mobility sector represented in the model included all the main transportation typologies and mobility services: passengers and freight transportation through road, railway, aviation, and navigation, expressed in pkm (passengers.kilometer) and tkm (ton.kilometer).
In the present work, the future mobility demand considered the values of the Pack scenario under the National Carbon Neutrality Roadmap project [48,75]. These projections were developed using a top-down approach by using the correlation between key macro-economic assumptions on GDP and demographic evolution associated with the Pack Scenario [67] with mobility activity and patterns.

5.3. Low-Carbon Mobility Scenarios

To assess the effect of various low-carbon mobility choices in the necessary energy system costs to comply with GHG emission targets, we defined a set of 17 scenarios representing progressive citizens’ mobility choices towards more sustainable options at the local scale (Table 3). This includes one reference scenario (REF) for the mobility demand projection trajectory to which the progressive alterations were applied. This assumes the alignment of the municipality climate mitigation objectives with national ones (i.e., GHG net-zero), allowing a robust correspondence with the necessary energy system transformation effort for all national municipalities.
The mobility scenarios were grouped into three categories representing the different low-carbon mobility options, namely: public transportation (PT), active mobility (AM), and shared mobility (SM). Within each group, five scenarios were defined representing incremental improvements of the correspondent mobility option (Table 4) compared to a reference situation. An additional intermodal (IM) scenario was developed considering a combined use of public transportation and active modes in the municipality. All the scenarios considered specific aspects of the municipality sustainable urban mobility plan (SUMP) [76,77,78] as a portrait of municipality action towards a low-carbon transportation sector. The various scenarios were discussed and validated with the Matosinhos municipality’s technical team, in order to articulate scenario assumptions and case study circumstances.
All the scenarios integrated a 2050 net-zero GHG emission target in line with both the 2030 National Energy and Climate Action Plan [79] and the 2050 Climate Neutrality Roadmap [67]. This objective corresponds to 60% GHG emission reduction in 2030 compared to the 2005 values. It was also necessary to consider scenarios without any climate mitigation targets to assess the total system cost associated with no long-term decarbonization.
The 2030 average CO2 cost corresponds to the quotient between the difference of the total system cost and GHG emissions between the different mobility scenarios with and without the net-zero GHG emission target and the correspondent difference in terms of GHG emissions (equation 1). This allows to obtain the near-term cost of reconfiguring the energy system to fulfill the 2050 net-zero GHG emission target.
A C C   y , s = Δ S y s t e m C o s t   γ , s Δ G H G e m i s s   γ , s
where ACC is the average CO2 cost, SystemCost is the total energy system cost, which can include the costs associated with investment, dismantling, fixed and variable operation, and maintenance of the energy system in year y, GHGemiss is the total GHG emitted, y is the corresponding year (present work is 2030), and s is the corresponding scenario.

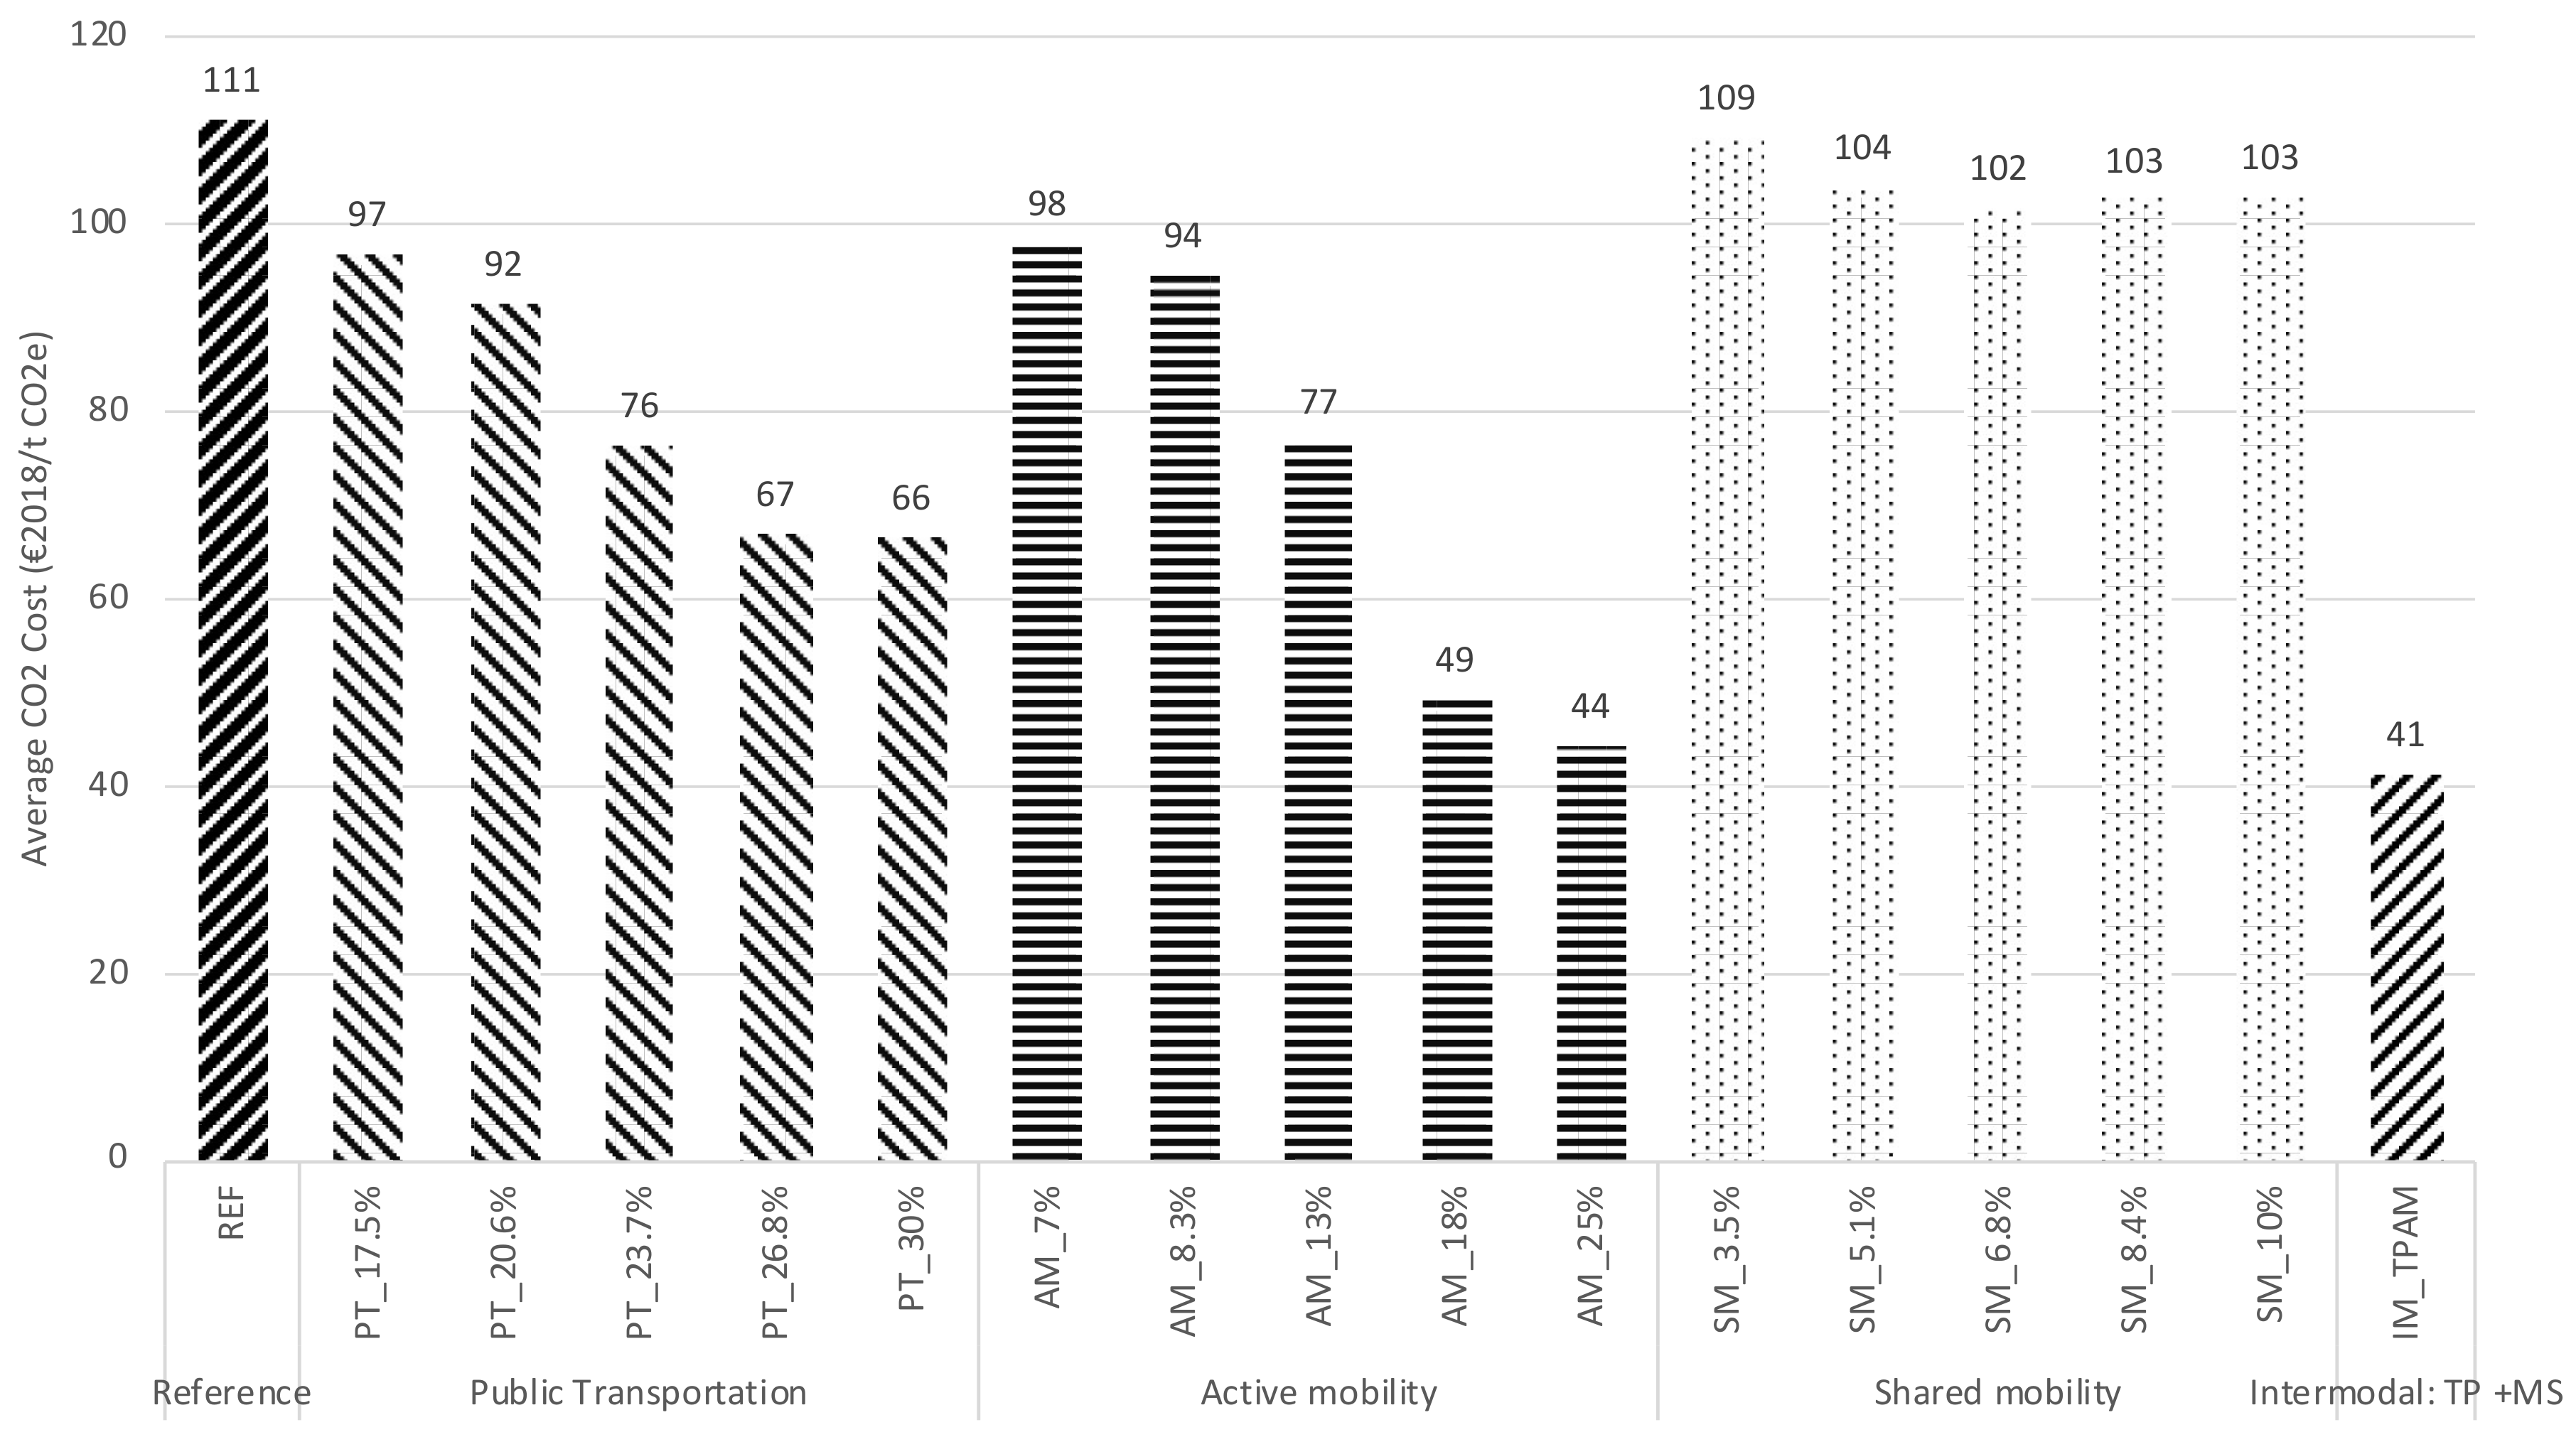
5.4. Case Study Results

This section presents the key results, focusing on the 2030 CO2 cost (Figure 1) calculated with model results of indicators of the total energy system cost and corresponding GHG emissions in 2030 (Table S12 in the Supplementary Information).
The optimization of the national energy system to comply with the 2050 net-zero GHG emissions target and reference energy service projections show a CO2 cost of 111 EUR2008/t CO2e in 2030. This value is a result of the necessary system reconfiguration costs to reduce the GHG emissions by 60% in 2030 (compared to 2005 values) to achieve GHG net-zero emission in 2050. This result is associated with all the new technology investment and operation (where the cost with energy consumption and maintenance is included) across the energy system. The total system costs associated with each of the scenarios is provided in Table S12, in the Supplementary Information.
This value is in line with Kaufman et al.’s [25] NT2NZ CO2 prices in 2030 of 102 EUR (assuming 1 USD = 0.82 EUR)/tCO2 (max. value) (124 USD) for the US. Additionally, the International Energy Agency 2050 Net-Zero Roadmap for the Global Energy Sector attributes a CO2 price (for electricity, industry, and energy production in the NZE) in 2030 of 107 EUR3/tCO2 (130 USD) for advanced economies. Liu et al. [80] show results of 103 EUR3/tCO2 (84.42 USD) for 2030 in the “Regional Rivalry” (SSP3) scenario. The results are also in line with the middle-range CO2 price used in the Lahti personal carbon trading scheme of 100 EUR/tCO2e [57], although the pilot project also tested at a minimum of 27 EUR/tCO2e (aligned with the EU-ETS carbon price at the time) and a maximum of 1000 EUR/tCO2e [81]. SCC has a strong importance at climate policy establishment and besides some limitations [82](even more relevant when considering the use at local scale), it provides an indication on the order of magnitude of the carbon price to be applied. Carleton and Greenstone [83] state that the explicit carbon price level consistent with achieving the Paris Agreement temperature target is at least between USD 50 and 100/t CO2e by 2030, and this is in line with the current study results.
All 16 mobility scenario results show a lower CO2 cost as a benefit of the various low-carbon mobility tested possibilities to the necessary energy system cost to comply with GHG objectives. According to the results, the lower CO2 cost (41.6 EUR2008/t CO2e) is associated with the mobility scenario that represents a complementary combination between higher public transportation use and active modes for short travelling distances (IM_PT_AM scenario). This shows the high benefit to the energy system configuration cost due to lower necessity for technology investment (mainly private vehicles) and energy consumption to satisfy mobility demand.
The active mobility group of scenarios showed an average CO2 cost of 72.6 EUR2008/t CO2e, with the lowest value of 44 EUR2008/t CO2e associated with 25% of the total short passenger distance found through pedestrian and bicycle modes. These results show that, the avoided vehicle investment and usage that benefit the GHG target fulfillment and correspondent technology, and energy consumption, are due to the lower energy and technology. Similarly, the public transportation scenarios group shows an average cost of 79.6 EUR2008/t CO2e, with the lowest value of 66 EUR2008/t CO2e in the PT_30% scenario, representing 30% of passengers satisfied using public transportation options. Additionally, a public transportation share of 26% and 30% scenarios shows similar CO2 costs, thus demonstrating that the higher use of public transportation induces a necessary investment in additional technology (e.g., more efficient buses) and in energy sources that can comply with GHG emission objectives. The high price and availability of technology and fuel alternatives (e.g., biofuels for blending or hydrogen) for decarbonizing heavy road passenger vehicles pose additional challenges to the energy system to comply with GHG emission objectives that in turn are reflected in the energy system costs.
The shared mobility scenarios group showed an average CO2 cost values range similar to the REF scenario, suggesting that the utilization of shared vehicles, although providing energy efficiency gains, can still induce relevant energy consumption. In this group, scenarios also showed a lower impact on the average CO2 cost between shared mobility values of 8.4% and 10%.

6. Discussion

Despite our concerted effort, our critical review of the carbon pricing initiatives in 14 pioneering cities is still incomplete, due to the lack of available data for a more comprehensive comparison on how the decision making took place in these pioneering cities up to the point of the newest development in their pricing mechanisms. The use of concepts, approaches, and tools for the definition and application of a carbon cost at a local level that we presented in the theoretical framework also provided a sense of complexity in local climate policymaking. Our case study of a Portuguese city, Matosinhos, took this at least one step further and explored the potential of a theoretical framework, initially created to be global, in guiding local economic instruments for climate. The city is designing its climate policy based on a low-carbon mobility scenario through applying a MAC assessment model, which also aimed to finance a local voluntary carbon market.
The range of carbon cost scenarios obtained in the Matosinhos case study with the TIMES_PT optimization model offers different possibilities of CO2 price application to establish different revenue allocation formats for citizens’ low-carbon mobility choices and to adapt to the various circumstances of city’s mitigation objectives:
  • Static and one-fits-all approach: the platform can apply a CO2 price fixed to all low-carbon mobility choices and with no price evolution across time.
  • Progressive and one-fits-all approach: the CO2 price will vary across time but will be fixed to all low-carbon mobility choices.
  • Fully dynamic approach: the CO2 price is differentiated by low-carbon mobility choices (e.g., if a citizen chooses to travel by bicycle the CO2 price will be different than if they chose public transportation) and also varies across time (e.g., starting high and decreasing with the rate of adoption).
Regarding the tools used to obtain the cost of carbon, technology-rich optimization IAM such as the TIMES_PT model have the advantages of integrating the newest technological advancements and energy efficiency measures up to the time of analysis. This makes the result credible and easily integrated into policies. On the other hand, like any IAM, the TIMES_PT model cannot anticipate the uncertainties of human behaviors nor potential technological innovations beyond the scientists’ foresight [41]. Nonetheless, for obtaining a cost of carbon feasible enough to encourage urban governments toward more practical, voluntary climate actions at the local level, the TIMES_PT model is still of great potential.

7. Conclusions and Recommendations

This paper contributes to the study of carbon cost estimation approaches that cities use to establish carbon pricing mechanisms. Our study can support Portuguese cities and other cities of similar contexts to establish robust, verifiable, and transferable methodologies that can integrate local climate effort results into National GHG Inventories. We began by sorting fundamental carbon pricing concepts, SCC and MAC, and models, IAM, as widely used practical tools for assessing carbon prices. We also reviewed a large set of carbon pricing experiments at the local level, which laid the foundation necessary for the Matosinhos case study to be understood from a better perspective. In the case study, we developed a technology-oriented approach to assess the short-term average carbon cost that will support the first local voluntary carbon market in Portugal.
High urban density megacities dominate pioneering carbon pricing initiatives, where market-based instruments such as carbon tax and ETS prevail to support climate neutrality commitments. Thus, megacities are more likely to pioneer local carbon pricing experiences. These initiatives seem to be running under sub-optimal conditions: On the one hand, the analysis revealed that bottom-up initiatives in the Western cities lack a clear multi-level bottom-up and top-down governance articulation and robust methodologies that can drive the results of local climate effort to integrate national GHG inventories. On the other hand, the development of actions at the subnational level (cities and provinces) in Eastern contexts such as in China is highly coordinated by the national government.
For cities adopting national and supranational carbon pricing instruments, the present work contributes to the design of local carbon trading schemes, namely the quantification of robust carbon prices coherent with local and national circumstances. The assessment emerged from the necessity to have a carbon price consistent with the circumstances of the case study rather than values based only on the literature. The presented methodology can be adopted by other municipalities with minor adaptation. The methodology enables a dynamic carbon price adequate for respective mobility options (e.g., differentiated prices per mobility option), making it a methodological advancement.
The results of the Matosinhos case study can also be used by other Portuguese municipalities with adjustments made to adequately associate between each mobility scenario and the municipality’s transportation characteristics and objectives. Portuguese municipalities should include similar frameworks in their energy and climate mitigating strategies to guide selection and deployment of effective and efficient solutions. The establishment and structure of economic instruments for climate action at the municipality level must be based on extensive scientific assessment processes to identify core aspects for effective objective fulfilment. Using integrated tools and scenario design, it is possible to assess and understand the implications of explicit policy decisions and instruments’ configuration. In particular, the results in our research show how different low-carbon mobility choices and levels of utilization can determine the corresponding CO2 price. Although there are different possibilities to use the present assessment results, the criteria of equity and justice should also be considered to promote social cohesion in the transformation process when allocating a carbon price to each low-carbon mobility choice.
An effort should be made by modelers, researchers, and local policymakers to make carbon mitigation models and costs more accessible. Cities should take advantage of the power of the demonstration of international city networks of which they are members in order to accelerate the application of carbon cost estimation models and scientific methods at the local level.
At least two dimensions of carbon pricing need further research: a comprehensive investigation on its emergence at the local level, namely the drivers for pioneering, and the ethical considerations of carbon price policy development.

Supplementary Materials

The following supporting information can be downloaded at: https://www.mdpi.com/article/10.3390/su14031812/s1, Table S1. Carbon cost range; Box S2. Carbon pricing initiative of Boulder, USA; Box S3. Carbon pricing initiative of New York City, USA; Box S4. Carbon pricing initiative of Anne Arbour, USA; Box S5. Carbon pricing initiative of Oslo, Norway; Box S6. Carbon pricing initiative of Lahti, Finland; Box S7. Carbon pricing initiative of Aradippou, Cyprus; Box S8. Carbon pricing initiative of Bologna, Italy; Box S9. Carbon pricing initiative of regional pilots in China; Box S10. Carbon pricing initiative of Tokyo, Japan; Box S11. Carbon pricing initiative of Singapore; Table S12. Total energy system cost and GHG emission in the modeled scenarios.

Author Contributions

Conceptualization, L.J.F. and L.P.D. and J.L.; methodology, L.J.F. and L.P.D. and J.L.; software, L.P.D.; validation, L.J.F. and L.P.D. and J.L.; formal analysis, L.J.F. and L.P.D. and J.L.; investigation, L.J.F. and L.P.D. and J.L.; writing—original draft preparation, L.J.F. and L.P.D. and J.L.; writing—review and editing, L.J.F. and L.P.D. and J.L.; visualization, L.J.F. and L.P.D.; supervision, L.J.F. All authors have read and agreed to the published version of the manuscript.

Funding

This research was funded by Fundação para a Ciência e a Tecnologia (FCT) grant number PTDC/CTA-AMB/6629/2020, and the scholarship PD/BD/128452/2017 and by PO Regional do Norte grant number RHAQ/CoLAB-NORTE-06-3559-FSE-000023. The APC was funded by CEiiA.

Institutional Review Board Statement

Not applicable.

Informed Consent Statement

Not applicable.

Data Availability Statement

Not applicable.

Acknowledgments

We would like to acknowledge the Fundação para a Ciência e a Tecnologia (FCT) for sponsoring the project PTDC/CTA-AMB/6629/2020 and the scholarship PD/BD/128452/2017, both were critical support for this research. We appreciate the two anonymous reviewers who provided us highly insightful and supportive comments to improve this manuscript.

Conflicts of Interest

The authors declare no conflict of interest.

References

  1. Díaz-Pont, J. Cities and the governance framing of climate change. Environ. Policy Gov. 2021, 31, 18–30. [Google Scholar] [CrossRef]
  2. Tang, K.; Liu, Y.; Zhou, D.; Qiu, Y. Urban carbon emission intensity under emission trading system in a developing economy: Evidence from 273 Chinese cities. Environ. Sci. Pollut. Res. 2020, 28, 5168–5179. [Google Scholar] [CrossRef] [PubMed]
  3. Castán Broto, V.; Westman, L.K. Ten years after Copenhagen: Reimagining climate change governance in urban areas. Wiley Interdiscip. Rev. Clim. Chang. 2020, 11, e643. [Google Scholar] [CrossRef] [Green Version]
  4. Mokhles, S.; Davidson, K. A framework for understanding the key drivers of cities’ climate actions in city networks. Urban Clim. 2021, 38, 100902. [Google Scholar] [CrossRef]
  5. GCAP-UNFCCC. GCAP UNFCCC—Home Page. Available online: https://climateaction.unfccc.int/ (accessed on 21 November 2021).
  6. UNFCCC. Race To Zero Campaign UNFCCC, 2021. Available online: https://unfccc.int/climate-action/race-to-zero-campaign (accessed on 21 November 2021).
  7. World Bank. Carbon Pricing Dashboard|Up-to-Date Overview of Carbon Pricing Initiatives. 2021. Available online: https://carbonpricingdashboard.worldbank.org/ (accessed on 21 November 2021).
  8. CMA. Glasgow Climate Pact ADVANCE VERSION. 2021. Available online: https://www.ipcc.ch/report/ar6/wg1/ (accessed on 21 November 2021).
  9. Baranzini, A.; van den Bergh, J.C.J.M.; Carattini, S.; Howarth, R.B.; Padilla, E.; Roca, J. Carbon pricing in climate policy: Seven reasons, complementary instruments, and political economy considerations. Wiley Interdiscip. Rev. Clim. Chang. 2017, 8, e462. [Google Scholar] [CrossRef] [Green Version]
  10. Grandin, J.; Haarstad, H.; Kjærås, K.; Bouzarovski, S. The politics of rapid urban transformation. Curr. Opin. Environ. Sustain. 2018, 31, 16–22. [Google Scholar] [CrossRef]
  11. Paravantis, J.; Tasios, P.; Dourmas, V.; Andreakos, G.; Velaoras, K.; Kontoulis, N.; Mihalakakou, P. A Regression Analysis of the Carbon Footprint of Megacities. Sustainability 2021, 13, 1379. [Google Scholar] [CrossRef]
  12. NASEM. Valuing Climate Damages: Updating Estimation of the Social Cost of Carbon Dioxide; The National Academies Press: Washington, DC, USA, 2017. [Google Scholar]
  13. Nordhaus, W.D.; Yang, Z. A Regional Dynamic General-Equilibrium Model of Alternative Climate-Change Strategies. Am. Econ. Rev. 1996, 86, 741–765. [Google Scholar] [CrossRef]
  14. Nordhaus, W.D. Economic aspects of global warming in a post-Copenhagen environment. Proc. Natl. Acad. Sci. USA 2010, 26, 11721–11726. [Google Scholar] [CrossRef] [Green Version]
  15. Nordhaus, W.D. Rolling the ‘DICE’: An Optimal Transition Path for Controlling Greenhouse Gases. Resour. Energy Econ. 1993, 15, 27–50. [Google Scholar] [CrossRef] [Green Version]
  16. Wang, P.; Deng, X.; Zhou, H.; Yu, S. Estimates of the social cost of carbon: A review based on meta-analysis. J. Clean. Prod. 2018, 209, 1494–1507. [Google Scholar] [CrossRef]
  17. Pindyck, R.S. The social cost of carbon revisited. J. Environ. Econ. Manag. 2019, 94, 140–160. [Google Scholar] [CrossRef] [Green Version]
  18. Pindyck, R.S. Coase Lecture-Taxes, Targets and the Social Cost of Carbon. Economica 2017, 84, 345–364. [Google Scholar] [CrossRef] [Green Version]
  19. Tian, L.; Ye, Q.; Zhen, Z. A new assessment model of social cost of carbon and its situation analysis in China. J. Clean. Prod. 2018, 211, 1434–1443. [Google Scholar] [CrossRef]
  20. Ricke, K.; Drouet, L.; Caldeira, K.; Tavoni, M. Country-level social cost of carbon. Nat. Clim. Chang. 2018, 8, 895–900. [Google Scholar] [CrossRef]
  21. Tol, l.R.S. A social cost of carbon for (almost) every country. Energy Econ. 2019, 83, 555–566. [Google Scholar] [CrossRef]
  22. Snyder, B.F. Beyond the social cost of carbon: Negative emission technologies as a means for biophysically setting the price of carbon. Ambio 2019, 49, 1567–1580. [Google Scholar] [CrossRef] [PubMed]
  23. IPCC. Global Warming of 1.5 °C. An IPCC Special Report on the Impacts of Global Warming of 1.5 °C Above Pre-Industrial Levels and Related Global Greenhouse Gas Emission Pathways, in the Context of Strengthening the Global Response to Eradicate Poverty; Masson-Delmotte, V., Zhai, P., Pörtner, H.-O., Roberts, D., Skea, J., Shukla, P.R., Pirani, A., Moufouma-Okia, W., Péan, C., Pidcock, R., Eds.; IPPC: Geneva, Switzerland, 2018. [Google Scholar]
  24. Pezzey, J.C.V. Why the social cost of carbon will always be disputed. Wiley Interdiscip. Rev. Clim. Chang. 2018, 10, e558. [Google Scholar] [CrossRef] [Green Version]
  25. Kaufman, N.; Barron, A.R.; Krawczyk, W.; Marsters, P.; McJeon, H. A near-term to net zero alternative to the social cost of carbon for setting carbon prices. Nat. Clim. Chang. 2020, 10, 1010–1014. [Google Scholar] [CrossRef]
  26. Stern, N.; Stiglitz, J.E. The Social Cost of Carbon, Risk, Distribution, Market Failures: An Alternative Approach; NBER Working Paper; National Bureau of Economic Research: Cambridge, MA, USA, 2021. [Google Scholar]
  27. Van den Bijgaart, I.; Gerlagh, R.; Liski, M. A simple formula for the social cost of carbon. J. Environ. Econ. Manag. 2016, 77, 75–94. [Google Scholar] [CrossRef] [Green Version]
  28. Craven, W.J. The Social Cost of Carbon. In Beyond One Health: From Recognition to Results; Wiley: Hoboken, NJ, USA, 2018; pp. 283–291. [Google Scholar] [CrossRef]
  29. Best, R.; Burke, P.J.; Jotzo, F. Carbon Pricing Efficacy: Cross-Country Evidence. Environ. Resour. Econ. 2020, 77, 69–94. [Google Scholar] [CrossRef]
  30. Green, J.F. Does carbon pricing reduce emissions? A review of ex-post analyses. Environ. Res. Lett. 2021, 16, 043004. [Google Scholar] [CrossRef]
  31. Lilliestam, J.; Patt, A.; Bersalli, G. The effect of carbon pricing on technological change for full energy decarbonization: A review of empirical ex-post evidence. WIREs Clim. Chang. 2020, 12. [Google Scholar] [CrossRef]
  32. Ibrahim, N.; Kennedy, C. A Methodology for Constructing Marginal Abatement Cost Curves for Climate Action in Cities. Energies 2016, 9, 227. [Google Scholar] [CrossRef] [Green Version]
  33. Weyant, J. Some Contributions of Integrated Assessment Models of Global Climate Change. Rev. Environ. Econ. Policy 2022, 11, 115–137. [Google Scholar] [CrossRef] [Green Version]
  34. Dowlatabadi, H. Integrated assessment models of climate change: An incomplete overview. Energy Policy 1995, 23, 289–296. [Google Scholar] [CrossRef]
  35. Robertson, S. Transparency, trust, and integrated assessment models: An ethical consideration for the Intergovernmental Panel on Climate Change. WIREs Clim. Chang. 2020, 12, e679. [Google Scholar] [CrossRef]
  36. Peng, P.; Zhu, L.; Fan, Y. Performance evaluation of climate policies in China: A study based on an integrated assessment model. J. Clean. Prod. 2017, 164, 1068–1080. [Google Scholar] [CrossRef]
  37. Kojima, S.; Asakawa, K. Expectations for carbon pricing in Japan in the global climate policy context. In Economics, Law, and Institutions in Asia Pacific; Springer: Singapore, 2021; pp. 1–21. [Google Scholar]
  38. World Bank. State and Trends of Carbon Pricing 2021; World Bank: Washington, DC, USA, 2021. [Google Scholar] [CrossRef]
  39. Arimura, T.H.; Abe, T. The impact of the Tokyo emissions trading scheme on office buildings: What factor contributed to the emission reduction? Environ. Econ. Policy Stud. 2021, 23, 517–533. [Google Scholar] [CrossRef] [Green Version]
  40. Hong, Z.; Chu, C.; Zhang, L.L.; Yu, Y. Optimizing an emission trading scheme for local governments: A Stackelberg game model and hybrid algorithm. Int. J. Prod. Econ. 2017, 193, 172–182. [Google Scholar] [CrossRef]
  41. Lind, A.; Espegren, K. The use of energy system models for analysing the transition to low-carbon cities—The case of Oslo. Energy Strateg. Rev. 2017, 15, 44–56. [Google Scholar] [CrossRef]
  42. Abe, T.; Arimura, T.H. An empirical study of the tokyo emissions trading scheme: An ex post analysis of emissions from university buildings. In Carbon Pricing in Japan. Economics, Law, and Institutions in Asia Pacific; Arimura, T.H., Matsumoto, S., Eds.; Springer: Singapore, 2021; pp. 97–116. [Google Scholar] [CrossRef]
  43. Chu, W.; Chai, S.; Chen, X.; Du, M. Does the Impact of Carbon Price Determinants Change with the Different Quantiles of Carbon Prices? Evidence from China ETS Pilots. Sustainability 2020, 12, 5581. [Google Scholar] [CrossRef]
  44. Li, X.; Hu, Z.; Cao, J. The impact of carbon market pilots on air pollution: Evidence from China. Environ. Sci. Pollut. Res. 2021, 28, 62274–62291. [Google Scholar] [CrossRef] [PubMed]
  45. Bulkeley, H.; Betsill, M.M. Revisiting the urban politics of climate change. Environ. Politics 2013, 22, 136–154. [Google Scholar] [CrossRef] [Green Version]
  46. Fuhr, H.; Hickmann, T.; Kern, K. The role of cities in multi-level climate governance: Local climate policies and the 1.5 °C target. Curr. Opin. Environ. Sustain. 2018, 30, 1–6. [Google Scholar] [CrossRef]
  47. Salvia, M.; Reckien, D.; Pietrapertosa, F.; Eckersley, P.; Spyridaki, N.-A.; Krook-Riekkola, A.; Olazabal, M.; Hurtado, S.D.G.; Simoes, S.G.; Geneletti, D.; et al. Will climate mitigation ambitions lead to carbon neutrality? An analysis of the local-level plans of 327 cities in the EU. Renew. Sustain. Energy Rev. 2020, 135, 110253. [Google Scholar] [CrossRef]
  48. Dias, L.P.; Simões, S.; Gouveia, J.; Seixas, J. City energy modelling—Optimising local low carbon transitions with household budget constraints. Energy Strat. Rev. 2019, 26, 100387. [Google Scholar] [CrossRef]
  49. Klenert, D.; Mattauch, L.; Combet, E.; Edenhofer, O.; Hepburn, C.; Rafaty, R.; Stern, N. Making carbon pricing work for citizens. Nat. Clim. Chang. 2018, 8, 669–677. [Google Scholar] [CrossRef]
  50. CEiiA. Are You Ready?|Home. 2021. Available online: https://weayr.com/#/home (accessed on 21 November 2021).
  51. DGEG. Natural Gas, Oil Products and Electricity Consumption per Sector and Municipality in Portugal for 2015; DGEG: Lisbon, Portugal, 2021.
  52. EDGAR/JRC. Emission Database for Global Atmospheric Research (EDGAR); EDGAR 4.2, FT2012; EDGAR/JRC: Brussels, Belgium, 2021.
  53. Matosinhos, M. Matosinhos by AYR, 2021. Available online: https://www.cm-matosinhos.pt/urbanismo/mobilidade-e-transportes/matosinhos-by-ayr (accessed on 3 August 2021).
  54. Barron, A.R.; Hafstead, M.A.C.; Morris, A.C. Policy Insights from Comparing Carbon Pricing Modeling Scenarios; Climate and Energy Economics Discussion Paper; The Climate and Energy Economics Project, Brookings: Washington, DC, USA, 2019; pp. 1–16. [Google Scholar]
  55. World Bank. State and Trends of Carbon Pricing October 2020, State and Trends of Carbon Pricing October 2020; World Bank: Washington, DC, USA, 2020. [Google Scholar]
  56. Peng, Y.; Bai, X. Financing urban low-carbon transition: The catalytic role of a city-level special fund in Shanghai. J. Clean. Prod. 2021, 282, 124514. [Google Scholar] [CrossRef]
  57. Kuokkanen, A.; Sihvonen, M.; Uusitalo, V.; Huttunen, A.; Ronkainen, T.; Kahiluoto, H. A proposal for a novel urban mobility policy: Personal carbon trade experiment in Lahti city. Util. Policy 2019, 62, 100997. [Google Scholar] [CrossRef]
  58. Goldstein, G.; Lehtilä, A.K.A.; Remme, U.; Wright, E. Documentation for the TIMES model: PART III; Energy Technology Systems Analysis Programme (ETSAP): Paris, France, 2016. [Google Scholar]
  59. Loulou, R.; Lettila, A.; Kanudia, A.; Remme, U.; Goldstein, G. Documentation for the TIMES model PART II; Energy Technology Systems Analysis Programme (ETSAP): Paris, France, 2016. [Google Scholar]
  60. Loulou, R.; Goldstein, G.; Kanudia, A.; Lettila, A.; Remme, U. Documentation for the TIMES model: PART I; Energy Technology Systems Analysis Programme (ETSAP): Paris, France, 2016. [Google Scholar]
  61. Simões, S.; Cleto, J.; Fortes, P.; Seixas, J.; Huppes, G. Cost of energy and environmental policy in Portuguese CO2 abatement—Scenario analysis to 2020. Energy Policy 2008, 36, 3598–3611. [Google Scholar] [CrossRef]
  62. Fortes, P.; Simoes, S.; Gouveia, J.P.; Seixas, J. Electricity, the silver bullet for the deep decarbonisation of the energy system? Cost-effectiveness analysis for Portugal. Appl. Energy 2019, 237, 292–303. [Google Scholar] [CrossRef]
  63. Monjardino, J.; Dias, L.; Fortes, P.; Tente, H.; Ferreira, F.; Seixas, J. Carbon Neutrality Pathways Effects on Air Pollutant Emissions: The Portuguese Case. Atmosphere 2021, 12, 324. [Google Scholar] [CrossRef]
  64. Seixas, J.; Fortes, P. Evaluation of the impact of CO2 taxes in the Portuguese energy system using TIMES_PT model, Annex III. In Study for the Green Tax Reform Commission; Center for Environmental and Sustainability Research (CENSE), FCT-UNL: Caparica, Portugal, 2014. [Google Scholar]
  65. Seixas, J.; Fortes, P.; Dias, L.; Barroso, J.E.; Martinho, S.; Gouveia, J.P.; Ferreira, F.; Gomes, P.; Tente, H.; Baptista, P. GHG Emission scenarios and technological options for decarbonization in Portugal in 2020 and 2030 Study for the Portuguese Environmental Agency. In Lasting Values, Lda and CENSE; FCT of NOVA University of Lisbon: Lisbon, Portugal, 2014. [Google Scholar]
  66. Seixas, J.; Fortes, P.; Ferreira, F.; Tente, H.; Monjardino, J.; Gouveia, J.P.; Dias, L.; Palma, P.; Lopes, R.; Avillez, F.; et al. Complex modelling to achieve Carbon Neutrality in Portugal. In Proceedings of the EU Conference on Modelling for Policy Support, Brussels, Belgium, 26–27 November 2019. [Google Scholar]
  67. CNR2050. Roadmap for Carbon Neutrality 2050 (RNC2050) Long-Term Strategy for Carbon Neutrality of the Portuguese Economy by 2050; Ministério do Ambiente e da Transição Energética: Lisbon, Portugal, 2019. Available online: https://www.portugal.gov.pt/download-ficheiros/ficheiro.aspx?v=%3d%3dBAAAAB%2bLCAAAAAAABACzMDexBAC4h9DRBAAAAA%3d%3d (accessed on 3 August 2021).
  68. Pavičević, M.; Mangipinto, A.; Nijs, W.; Lombardi, F.; Kavvadias, K.; Navarro, J.P.J.; Colombo, E.; Quoilin, S. The potential of sector coupling in future European energy systems: Soft linking between the Dispa-SET and JRC-EU-TIMES models. Appl. Energy 2020, 267, 115100. [Google Scholar] [CrossRef]
  69. Chiodi, A.; Taylor, P.G.; Seixas, J.; Simões, S.; Fortes, P.; Gouveia, J.P.; Dias, L.; Gallachóir, B. Energy policies influenced by energy systems modelling—Case studies in UK, Ireland, Portugal and G8. Lect. Notes Energy 2015, 30, 15–41. [Google Scholar] [CrossRef]
  70. Giannakidis, G.; Gargiulo, M.; de Miglio, R.; Chiodi, A.; Seixas, J.; Simões, S.G.; Dias, L.; Gouveia, J.P. Challenges Faced When Addressing the Role of Cities towards a Below 2-Degrees World. In Limiting Global Warming to Well Below 2 °C: Energy System Modelling and Policy Development; Lecture Notes in Energy; Giannakidis, G., Karlsson, K., Labriet, M., Gallachóir, B., Eds.; Springer: Cham, Switzerland, 2016; Volume 64, pp. 373–389. [Google Scholar] [CrossRef]
  71. De Miglio, R.; Chiodi, A.; Burioli, S.; Giovannini, E.; Gargiulo, M. Exploring Integrated Energy Action Plans for a Sustainable Transition of the Municipality of Cesena. Procedia Eng. 2017, 198, 541–548. [Google Scholar] [CrossRef]
  72. Gargiulo, M.; Chiodi, A.; De Miglio, R.; Simoes, S.; Long, G.; Pollard, M.; Gouveia, J.P.; Giannakidis, G. An Integrated Planning Framework for the Development of Sustainable and Resilient Cities—The Case of the InSMART Project. Procedia Eng. 2017, 198, 444–453. [Google Scholar] [CrossRef]
  73. Simoes, S.G.; Dias, L.; Gouveia, J.; Seixas, J.; De Miglio, R.; Chiodi, A.; Gargiulo, M.; Long, G.; Giannakidis, G. INSMART—Insights on integrated modelling of EU cities energy system transition. Energy Strat. Rev. 2018, 20, 150–155. [Google Scholar] [CrossRef]
  74. Paltsev, S.; Capros, P. Cost concepts for climate change mitigation. Clim. Chang. Econ. 2013, 4, 1340003. [Google Scholar] [CrossRef] [Green Version]
  75. Tente, H.; Dias, P.L.; Monjardino, J.; Fortes, P.; Ferreira, F.; Seixas, J. Decarbonising transports in Portugal up to 2050: Possible pathways. In Proceedings of the EU Conference on Modelling for Policy Support, Brussels, Belgium, 26–27 November 2019. [Google Scholar]
  76. Pinho, P.; Silva, C.; Lopes, M.; Altiery, M.; Pimentel, M. Plano de Mobilidade e Transportes de Matosinhos; Câmara Municipal de Matosinhos: Matosinhos, Portugal, 2018; Available online: https://www.cm-matosinhos.pt/cmmatosinhos2020/uploads/document/file/7123/2_a_fase___prioridades_e_visao_para_o_municipio.pdf (accessed on 3 August 2021).
  77. Pinho, P.; Silva, C.; Lopes, M.; Altieri, M.; Pimentel, M. Plano de Mobilidade e Transportes de Matosinhos 1a Fase-Anexos; Câmara Municipal de Matosinhos: Matosinhos, Portugal, 2016; Available online: https://www.cm-matosinhos.pt/cmmatosinhos2020/uploads/document/file/7124/1_a_fase___caracterizacao_e_diagnostico.pdf (accessed on 3 August 2021).
  78. Pinho, P.; Silva, C.; Lopes, M.; Vaz, R. Plano de Mobilidade e Transportes de Matosinhos 3a Fase Outubro 2017 Atualização de Maio 2018; Câmara Municipal de Matosinhos: Matosinhos, Portugal, 2016; Available online: https://www.cm-matosinhos.pt/cmmatosinhos2020/uploads/document/file/7125/3_a_fase___plano_de_acao.pdf (accessed on 3 August 2021).
  79. PCM. Resolução do Conselho de Ministros n.o 53/2020—Aprova o Plano Nacional Energia e Clima 2030 (PNEC 2030); Presidência do Conselho de Ministros: Lisbon, Portugal, 2020.
  80. Liu, N.; Song, F. Marginal Abatement Cost of Carbon Emissions under Different Shared Socioeconomic Pathways. Sustainability 2021, 13, 13693. [Google Scholar] [CrossRef]
  81. Uusitalo, E.; Kuokkanen, A.; Uusitalo, V.; von Wright, T.; Huttunen, A. Personal carbon trading in mobility may have positive distributional effects. Case Stud. Transp. Policy 2021, 9, 315–323. [Google Scholar] [CrossRef]
  82. Wagner, G.; Anthoff, D.; Cropper, M.; Dietz, S.; Gillingham, K.T.; Groom, B.; Kelleher, J.P.; Moore, F.C.; Stock, J.H. Eight priorities for calculating the social cost of carbon. Nature 2021, 590, 548–550. [Google Scholar] [CrossRef] [PubMed]
  83. Carleton, T.; Greenstone, M. Updating the United States Government’s Social Cost of Carbon. University of Chicago, Becker Friedman Institute for Economics Working Paper No. 2021-04. Available online: https://ssrn.com/abstract=3764255 (accessed on 3 August 2021).
Figure 1. Average CO2 cost in 2030 for the low-carbon mobility scenarios.
Sustainability 14 01812 g001
Table 1. Climate policy instruments at the subnational level.
Boulder (USA)New York City (USA)Oslo (Norway)Aradippou (Cyprus)Bologna (Italy)Lahti (Finland)Tokyo (Japan)Beijing, Tianjin, Shanghai, Shenzhen, Chongqing (Cities), Fujian, Guangdong, and Hubei (Provinces) (China)Singapore
Administrative levelCityMegacityCityCityCityCityMegacity/ regionCity and provinceCity-state
Population100,0008,400,000634,00020,000380,000 13,300,00092,200,000 (cities) 63,200,000 (provinces)5,700,000
Start year20072024201620162015–2018120,000201020132019/2021
Current climate policy instrument (Carbon Tax/ETS/Other/None)Other: CAP taxNoneOther: electricity feeETS: Local auction rewarding mechanism and international offset marketETS:2020Cap-and-trade (ETS)ETS city-level until June 2021Carbon tax/ETS
If ETS, No. of tradesN/AN/AN/AN/AN/ACap-and-trade30 (until 2020)N/AN/A
Planned policy instrumentComprehensive carbon tax in 2023Carbon trading program (ETS) credit system-based with no auctionsN/AN/ANoneN/AN/AETS (city level turned national scheme)N/A
Current covered sectorsBuildings electricity consumption (residential, commercial and industrial)NoneN/AResidential buildings: energy efficiency and renewable energyActive urban mobility (cycling)Personal Cap and Trading1200 buildings (1000 commercial and services plus 200 factories)Industry, active urban mobility (bike-sharing)Industry ≥25,000 tCO2/year; forests
% share of total city GHG emissions 70%70%N/A25%N/AN/A~20%40%N/A
Planned covered sectorsN/A50,000 buildings (commercial and residential)N/AN/AN/ATransport and mobilityN/AN/AN/A
Revenue destinationN/AN/ALocal fund for GHG emissions mitigation action fundingLocal fund for GHG emissions mitigation action fundingN/A25%N/AN/AN/A
Initiative (Experimental/Mandatory)MandatoryMandatoryMandatoryExperimentalExperimentalTransport and mobilityMandatoryExperimental/MandatoryMandatory
Average price (a) $/kWh or (b) $/gCO2/kWh or (c) $/tCO2) or (d) Other(a) 0.0020 $/kWh (of which 0.0049 residential tax)ETS (NA); Carbon tax: $55/tCO2One cent fee in electricity billN/A(d) Other: ~€17/tCO2Lahti (Finland)$5.06/tCO2~€6–~€7.5 tCO2Carbon tax: $5/tCO2
Carbon cost approach adopted for carbon pricing setting (SCC/MAC/other/NA)N/AN/AN/AN/AN/AExperimentalN/AN/AN/A
City carbon neutral deadline80% carbon reduction by 2050 compared to 200580% reduction by 2050, compared to 2005 levels95% reduction by 2030 compared to 200928% reduction by 202055% reduction 2030 and net zero emissions 2050€27/tCO2eqNet-zero by 2050Net-zero by 2060As soon as viable after 2050
Country carbon neutral deadline2050203020502050€100/tCO2eq20502060
Country prevailing carbon price signal (% of emissions priced ≥ €60/tCO2) *USA: 22%Norway: 68%Cyprus: N/AItaly: 51%€1000/tCO2eqJapan: 24%China: 9%Singapore: N/A
GDP per capita PPP, current international $ (17,100 $, World) **63,500 $63,100 $38,400 $41,800 $51,000 $42,100 $17,300 $
Source: * OECD 2021, ** World Bank (2021a), World Bank Data.
Table 2. Matosinhos municipality GHG emissions inventory in 2015 (values in Gg CO2e) (municipality GHG emission inventory was based on final energy consumption per sector and fuel type (data from [51]). GHG emissions from industrial processes and LULUCF were excluded. Scope 2 emissions associated with electricity consumptions considered national electricity mix in the corresponding year.
SectorScope 1Scope 2TotalShare
Transportation772.10.3772.463%
Industry a31.756.988.67%
Residential88.479.0167.414%
Services40.3109.3149.712%
Agriculture and fisheries43.22.745.94%
Other sectors b0.01.21.20%
Total975.7249.51225.2
a GHG emissions from power were excluded to avoid double counting. b Other sectors include municipal solid waste, water, and wastewater sectors.
Table 3. Sustainable mobility scenario assumptions used in TIMES_PT runs.
Scenario CategoryScenario DescriptionKey VariablesUnit
Reference (REF)Serves as the basis for benchmark analysis from the sustainable mobility scenarios.Not applicableNot applicable
Public transportation (PT)Aims to test the effect of a gradual modal shift from private vehicles to public transportation modes.Public transportation share (include urban and intercity bus, train, and tram).Percentage of passenger mobility satisfied by public transportation.
Active mobility (AM)Aims to test the effect of a gradual modal shift from private vehicle use to non-motorized transportation (NMT)/active mobility (covering principally walking and cycling).Short-distance passenger mobility demand satisfied by soft modes (e.g., bike or walking).Percentage of short-distance passenger mobility covered by pedestrian and cycling modes.
Shared mobility (SM)Aims to reflect a gradual increase in the use of sharing vehicle schemes for short-distance passenger demand.Passenger short-distance demand met using shared vehicles. Sharing schemes considering small and medium vehicles.Percentage of short-distance passenger mobility covered by sharing vehicles.
Intermodal (IM)Aims to assess the combined effect of active modes and public transportation.Both variables associated with AM and TP scenarios.Equal to AM and TP scenarios.
Table 4. Scenarios’ key variable assumptions (correspondent variable units presented in Table 3).
Scenario Category and NameScenario CodeIncrease from REF 1 | 2030 Value
Reference
Representing base-case conditionsREF -
Public transportation
Public Transportation: 17.5%PT_17.5%+3.9%18%
Public Transportation: 20.6%PT_20.6%+7.1%21%
Public Transportation: 23.7%PT_23.7%+10.2%24%
Public Transportation: 26.8%PT_26.8%+13.3%27%
Public Transportation: 30%PT_30.0%+16.4%30%
Active mobility
Active modes: 7%AM_7%+3.7%7%
Active modes: 8.3%AM_8.3%+5.0%8%
Active modes: 13%AM_13%+10.0%13%
Active modes: 18%AM_18%+15.0%18%
Active modes: 25%AM_25%+21.7%25%
Shared mobility
Shared mobility: 3.5%SM_3.5%+1.5%4%
Shared mobility: 5.1%SM_5.1%+3.1%5%
Shared mobility: 6.8%SM_6.8%+4.8%7%
Shared mobility: 8.4%SM_8.4%+6.4%8%
Shared mobility: 10%SM_10.0%+8.0%10%
Intermodal: PT + MS
PT 23.7% and AM 13%IM_PTAMEqual to PT 23.7%Equal to AM 13%
1 Correspond to the assumed increase of the correspondent key scenario group variable to the REF scenario circumstances in 2030: public transportation: 14%, active modes: 3%, and shared mobility: 2%.
Publisher’s Note: MDPI stays neutral with regard to jurisdictional claims in published maps and institutional affiliations.

