1. Introduction
One of the basic features of the functioning of all entities economically active in national economies is their participation in the tax system of the state and their own tax liability. For the comprehensive context of the tax system as a whole, it is important to know the impacts of the Slovak Republic’s accession to the European Union, as well as the financial administration in its states. The issue of taxation is one of the “most sensitive” areas. Each Member State’s tax revenue represents a substantial part of the revenue side of the state budget, which is why it is not easy to achieve any form of joint action by all stakeholders in this area [
1]. The Financial Administration (FA) is a state administration office in the area of taxes, fees, and customs whose main task is to ensure the collection of taxes and customs in order to secure revenues to the state budget of the Slovak Republic and the EU. The successful collection of taxes and customs, thanks to the elimination of fraud, has brought about 3.7 billion euros more into the state treasury in recent years. Financial administration is a modern, client-oriented institution with the aim of intensifying electronic communications.
The issue of the effective collection of tax revenues is today one of the most significant problems faced by individual states, as public levies are the primary source of budget revenues [
2]. At the same time, almost every state is obliged, to a greater or lesser degree, to pursue an overriding fiscal goal through shrinking excessive general government deficits in a manner that does not hamper the growth outlook for the state and simultaneously supports business activities [
3]. A lack of adequate budget revenues hinders, and at times prevents, the state from functioning effectively [
4].
The creation of a highly professional public sector and professional customs administration is a key issue for the sustainable development of national economies while employees are key persons for customs administration. Attracting and retaining talented employees are two of the strategic issues of the customs authorities in order to ensure the public good [
5]. Effective and efficient organization of public administration and reorganization are some of the goals of policymakers and practitioners. Petersone and Ketners examine the processes of reorganization in the State Revenue Service in Latvia as a tool for authorities to achieve strategic objectives in order to make proposals for the planning activities of structural reforms. The research is mainly based on the monographic descriptive method, as well as the methods of analysis and synthesis. The main results are related to the identification of procedures and approaches for reorganization and structural changes in tax and customs administration. It can be concluded that, for the organizational structure, which is modelled according to the processes linked with units, it is possible to make precise analyses showing how the reorganization process will change performance indicators and clarify important factors. This research identifies the need for internal regulation and the respective procedure for implementing structural changes [
6].
Quarantine economic conditions put forward new demands to tax administration’s efficiency as a priority source of the EU’s financial resources. The relationship between fair, efficient, sustainable taxation and budget revenues’ adequacy to finance social and economic investment, innovation, and development needs is evident. Therefore, ensuring tax administration’s efficiency and effectiveness in any EU country is of theoretical and practical importance [
7].
The study [
8] aims to deepen the theoretical and applied provisions of the VAT administration in e-commerce operations in a global convergence of the national economic systems. The analysis of the state and forecast of VAT mobilization in the EU countries’ e-commerce operations are presented. The research’s specific purpose is to assess the VAT tax base’s future size in the context of changes in EU tax legislation. According to the scientific literature analysis, in the framework of forecasting the studied tax, it is advisable to use econometric forecasting methods based on time series models. As the result of the study, the forecast volumes of the VAT base of Eastern Europe and the amount of approximate future tax revenues are presented. The obtained results confirm the relationship between the growth of e-commerce and VAT tax revenues under such transactions; the study presents author’s vision of the VAT administration ecosystem for e-commerce transactions and the allocation of its functional entities. The directions on achieving the maximum volumes of VAT mobilization following the EU tax legislation requirements in European integration and globalization were substantiated, and the conclusions can be used in tax administration processes in the matters of forecasting other tax payments [
8].
The current processes of globalization are characterized by complexity, inconsistency, uncertainty, and, often, the predominance of politics over common sense. Effective, highly professional reform of the tax authorities and customs structures is a convincing example, not so much of a technological breakthrough but of the prospects and harmony of the new, innovative thinking of country leaders, government representatives, businesses, and citizens. Krutikov [
9] reveals the features and problems present in the process of implementing digital economy technologies that prevent the provision of a level of cooperation adequate for modern requirements between national and foreign customs structures, as well as representatives of the business community. Proposals have been made to implement promising structural, institutional, and technological innovative approaches to creating customs activities using the positive experience of successful transformation of the tax authorities, which allowed for building a harmonious interaction with taxpayers, taking into account their expectations and needs. The rapid developments in the field of information and communication technologies (ICT) mean that tax authorities have to address the question of how to keep up with the latest trends in society. Digitalization is essential for providing better services to taxpayers, big data processing, and risk identification. It is also important for more efficient and effective tax collection.
One of the most important aspects of the sustainable development of tax and customs administration is the tax advantages of VAT, which provide an incentive for foreign trade participants and support their export activities [
10]. As the burden of VAT is borne by the final consumer, the key issue here is the interaction between the state (represented by its controlling authorities) and the business actors in the process of tax administration [
1].
The international scientific community actively debates various models of combatting fraudulent actions of entities leading to VAT gaps [
11,
12]. In particular, a team of authors analyze the factors defining the parameters of the VAT gap in an economy and conclude that three key categories of actors—final consumers, sellers, and the tax administration—must ensure the good-faith fulfilment of their duties [
13]. Noting the negative impact of VAT fraud, certain researchers conclude that this illegal activity creates some of the most dangerous consequences for an economy [
14,
15] and proclaim that such activity can be implicated in the direct or indirect financing of terrorism [
16]. The most important instrument for combatting VAT fraud is the development of international cooperation [
17] and use of modern technologies [
18].
Strengthening tax compliance is a key element of effective resource mobilization. Tax authorities are developing new strategies to promote voluntary compliance and to manage situations related to non-compliance or strategies to ensure cost minimization. The customs union plays an important role in protecting the external borders of the European Union and ensuring the fair and transparent collection of customs and other relevant taxes, such as excise duty and value-added tax. It also guarantees the smooth functioning of international trade between EU countries.
VAT is characterized as a tax defining the added value at an aggregate level and for a certain period; it imposes a tax on the difference between the total turnover and total purchases from different businesses [
19]. Research in the field of VAT application in recent years has been focused more on improving the efficiency of tax control [
20], improving the quality and efficiency of tax administration [
21], minimizing the risks of tax fraud, and developing methods of reducing the scope of shadow business in general [
22].
The European Commission is assisting EU Member States in reforming their tax policies and revenue management to ensure fair, sustainable, and efficient tax collection. It also supports EU Member States in reforming their public finance management and spending policies in order to achieve an efficient allocation of funds. A number of studies indicate that transformations in the field of taxation, including international taxation, ensure a sustainable development trend [
23,
24]. Kowal [
18] highlighted the demonstrated efficiencies of a tax system through the degree of resistance that system poses to tax evasion.
The motivation of our research efforts is to promote strategies of voluntary compliance for tax, custom, and levy duties. The novelty of this study lies in its approach from the clients’ point of view to the identification and elimination of redundancies and opacities in tax/customs/levies collection processes performed by institutions of tax and customs administration systems in Slovakia. It is important to achieve the efficient and successful collection of taxes and customs by strengthening the voluntary compliance of clients (taxpayers), not only through external tools (improving the efficiency of tax control and of tax administration, clarifying tax frauds), as was mentioned above. Due to the lack of such oriented studies, a survey performed in three regions of Slovakia, using the research tool (the questionnaire) developed by the authors, is presented in this article.
The academic contribution of this research study lies in the fact that it points to areas that receive little attention in the scientific literature: identification of problematic components of the tax/customs system in Slovakia from the clients’ point of view. The subsequent analysis (exploratory analysis, confirmatory factor analysis) of data obtained by empirical research also contributes to filling gaps in the field of given scientific interests that are related to strengthening the successful collection of taxes, customs, and levies.
To solve this complex problem, a solving strategy based on exploratory analysis (KMO = 0.641) and later confirmatory factor analysis is proposed to extract four key common factors from the items of the research tool (with a total value of 80.623% of the explained variability). The reliability of the used research tool, pre-tested in the pilot study, is demonstrated by the achieved Cronbach coefficient value of 0.827%. In order to evaluate the obtained data, the respondents were divided into groups by gender, residence, and occupation, in accordance with indications and outputs of the pilot study. Finally, experimentally obtained data are analyzed and compared. The significant differences in the respondents’ perceptions of the extracted factors between selected groups are confirmed by applied analysis, both between men and women and between respondents depending on the place of residence. The main differences are observed in the questionnaire items Q10 “Administrative complexity of the tax and customs agenda”, Q7 “Ease of tax collection”, Q16 “Labor costs for staff dealing with the tax and customs agenda”, and Q5 “Helpfulness and willingness of administrative workers”. The results indicate dissatisfaction with the overall tax and customs administration. In particular, labour costs and time costs for tax processing are considered critical; this is further detailed in the Results and Discussion Section. The performed analysis presented in this study is one of the partial research tasks on the path converging to the goals set within the project VEGA 1/0194/19 supporting this research.
3. Results and Discussion
Statistical data processing was performed by using Statistica 13.5 and IBM SPSS Amos 26. Factor analysis is a multidimensional statistical method that focuses on creating new variables in order to reduce large amounts of data with as little loss of information as possible. It is based on the assumption that the dependences between the observed variables are the result of the action of a certain smaller number of immeasurable quantities standing in the background, which are referred to as common factors. These common factors are defined as a linear combination of the original quantities.
Factor analysis has as its main goal to know and use the structure of common factors, which are considered to be hidden causes of mutually correlated variables, while it wants them to best explain and clarify the observed dependencies as simply as possible. This means that in the final solution, each variable should correlate with a minimum number of factors, and, at the same time, the number of factors should be as small as possible. The assumptions of factor analysis are more conceptual than statistical. Abnormality, heteroscedasticity, and nonlinearity do not affect the results of the factor analysis so much that we have to pay close attention to them. Some degree of multicollinearity is even desirable because the goal of factor analysis is to identify an internally bound, i.e., correlated group of features. The basic indicators of the suitability of using factor analysis are KMO statistics and the Bartlett test of sphericity. The Kaiser–Mayer–Olkin statistic (KMO) is an index that is used to compare the size of experimental correlation coefficients against the size of partial correlation coefficients. If the sum of squares of the partial correlation coefficients between all pairs of features is smaller than the sum of squares of the pairwise correlation coefficients, the KMO rate of the statistic is close to 1. Small values of KMO statistics indicate that factor analysis of original features will not be a good approach because it is not possible to explain correlation between pairs of features using other features. In our case, based on the value of the Keizer–Mayer–Olkin statistic (0.641) and based on the Kaiser definition for the correlation rate, it can be said that the choice of factor analysis for the analysis of data obtained using the above research tool is justified (
Table 3). Bartlett’s sphericity test is a statistical test of the correlation between the original features. It tests the null hypothesis
H0: “There is no correlation between the characters”, so the correlation matrix is a unit matrix. The achieved value of significance of the Bartlett test of sphericity
p = 0.000 is less than the chosen level of significance
α = 5%, and, thus, we can reject the null hypothesis expressing that the implementation of a sample correlation matrix with 12 considered variables (Q5 to Q16) is a unit matrix. Based on the above information, we can conclude that factor analysis is suitable for the analysis of the obtained data.
One of the basic tasks of factor analysis is to reduce the number of original features (characters). When reducing the number of usable factors, certain basic criteria are taken into account, one of which is to first obtain, for a large number of original characters, a combination of characters that clarifies as much of the variance as possible. Then, combinations that relate to smaller and smaller variance are sought. Based on the above criteria for selecting the number of factors, we extracted four factors from the original matrix of characters by the method of main components (
Table 4), whose eigenvalue is greater than 1 based on Kaiser’s criterion of statistical significance. Cumulatively, these four factors explain 80.623% of the total variance, with the first factor accounting for 20.760% of the variance, the second factor accounting for 20.530% of the variance, the third common factor accounting for 19.764% of the variance, and the fourth common factor accounting for 19.669% of the total variance by the factor model Varimax.
The factor matrix (
Table 5) contains the factor loads for each character and in each factor. The non-rotated factor matrix represents the best linear combination of the original characters, and the best in terms of including as many character variabilities as possible. However, if the non-rotated factor matrix does not provide a meaningful definition of common factors, its rotation is approached. Factor load is an explanation of the role of each original feature in defining a common factor. It is actually the correlation coefficient between each original feature and factor.
From
Table 5, we can see that the first common factor (Factor 1) significantly correlates with the questionnaire items Q14, Q10, Q8, and Q13. The values of the factor loads reach the value −0.606 for item Q14 and 0.422 for item Q13. From the analysis of the first common factor (Factor 1) presented in
Table 5, it is clear that 36.724% of the variability of item Q14, 29.485% of the variability of item Q10, 20.250% of the variability of item Q8, and 17.808% of the variability of item Q13 are explained by the first common factor. The second common factor (Factor 2) correlates with items Q15 (−0.735), Q11 (0.595), and Q12 (0.431) of the given research tool. As with the first common factor, we can say about the second common factor that 54.023% of the variability of item Q15, 35.403% of the variability of item Q11, and 18.576% of the variability of Q12 are explained by the second common factor. As we can see from
Table 5, in connection to the third common factor (Factor 3) it can be stated that 38.194% of the variability of item Q6, 32.376% of the variability of item Q16, and 22.658% of the variability of Q9 are explained by the third common factor. The last common factor (Factor 4) correlates with only two items of the research tool—item Q7 (0.668) and item Q5 (0.617). As shown in
Table 5, 47.334% of the variability of item Q7 and 38.069% of the variability of item Q5 are explained by the fourth common extracted factor. We have thus verified the assurance of the practical significance of all three extracted factors.
Confirmatory factor analysis (CFA) was implemented on a sample of 1500 respondents to verify the defined factor structure. Although the polychoric correlation method is preferred for ordinal variables, in the current study, we chose the maximum likelihood method. When choosing the CFA method, we based our research on the results [
26,
27], which accept the application of classical cut-off estimators by the ML method even in the case of ordinal variables if they have at least five response categories. In this case, they can be considered interval variables. The distribution of responses to all items of the research instrument corresponded to the normal distribution. The normality of respondents’ responses was tested by the Shapiro–Wilks test at a significance level of α = 0.05.
In the first step, based on the construction of the factor model (
Table 5), we defined the hypothetical structure of the data—factors, manifest variables, and relationships between them. We used basic and recommended indicators to test the suitability of the verified model. The basic recommended evaluation indicators [
28] and their real achieved values on the applied four-factor model are given in
Table 6. The model applied in the research part is shown in
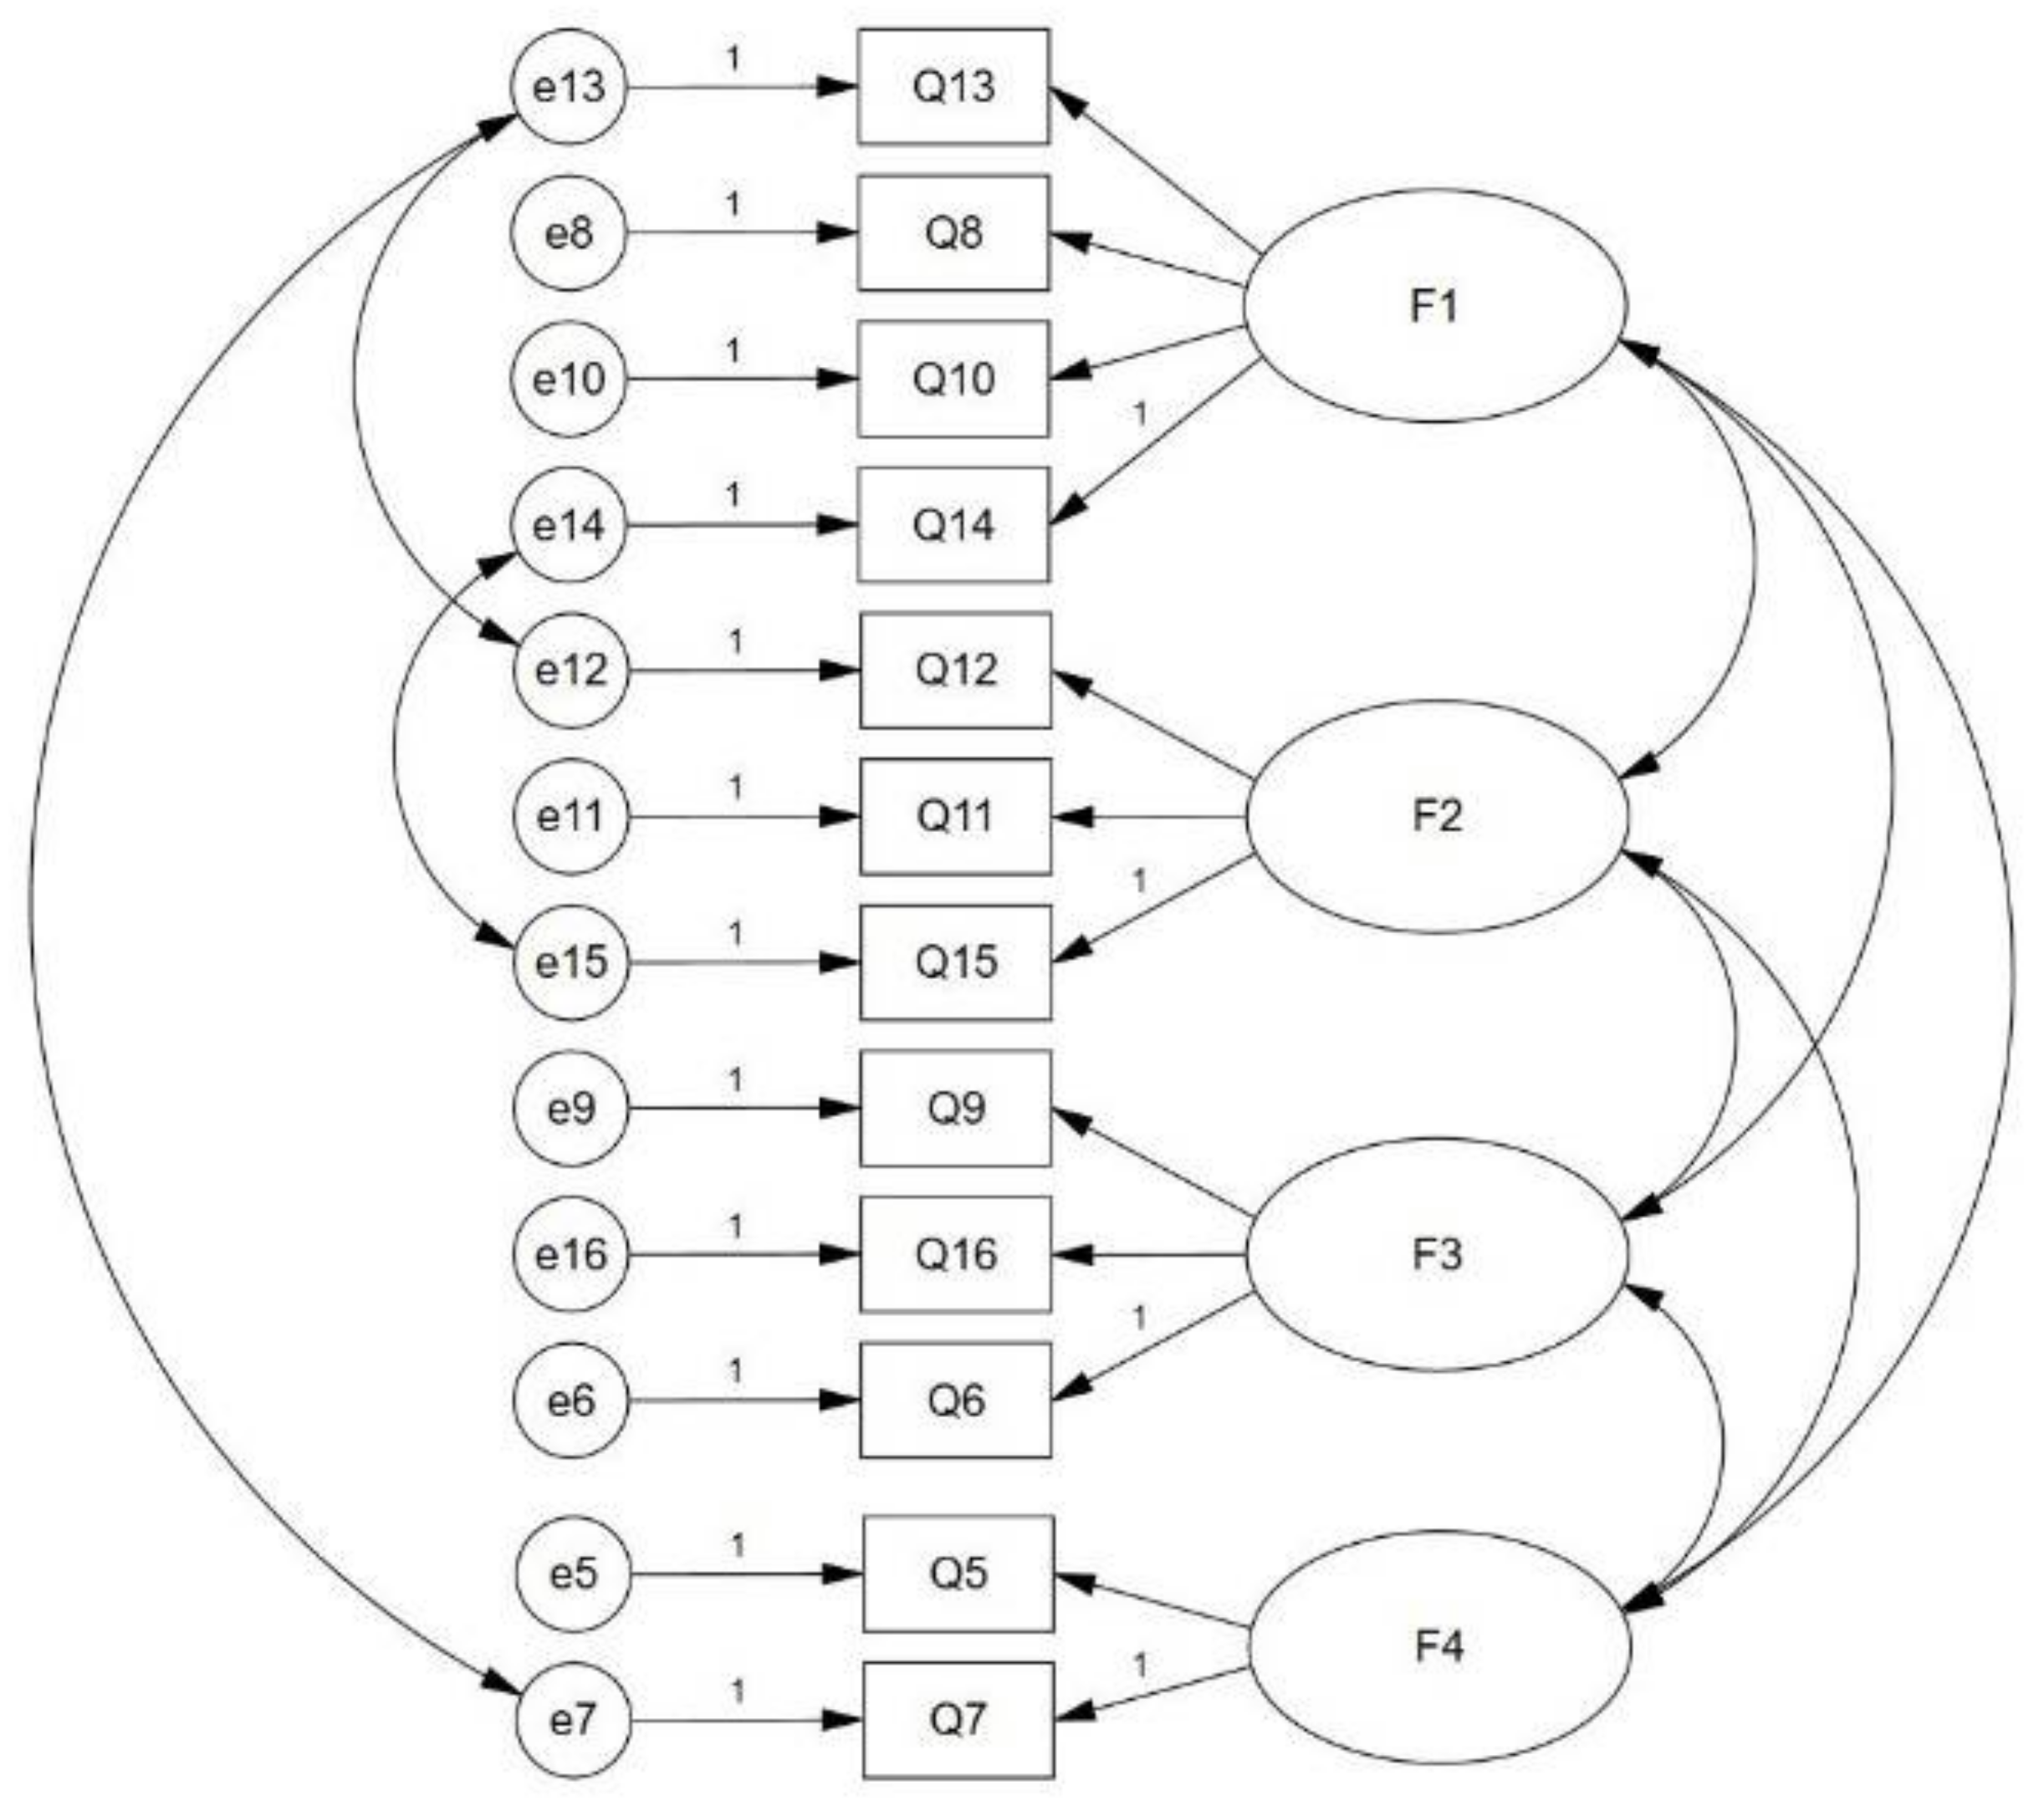
Figure 1. The model assumes that the 12 variables, which are presented by the research tool items Q5 to Q16, are explained using four common factors: Factor 1—difficulty of tax and customs administration, digitalization of tax, customs and levies administrations; Factor 2—availability of tax and customs administration, time savings in administration; Factor 3—competencies of tax and customs administration employees; and Factor 4—ease of taxes and customs collection.
From
Table 6, it is clear that the recommended indexes evaluating the factor model (
Figure 1) are acceptable and entitle us to state that the created hypothetical model presents a perfect degree of agreement with real data and is applicable in such a form.
The analysis of the four-factor model of the view of selected groups of the population of the Slovak Republic on the sustainable development of tax and customs administration for the entire research group (
N = 1500) is presented in
Table 7. From
Table 7, it is clear that for the first common extracted factor (F1), concerning attitudes toward the complexity of tax and customs administration and toward digitalization, all exogenously directly measured variables are significant at the selected level of significance
α = 0.05. The interrelationships between the exogenous variables, the items of the research tool in relation to the first common factor (F1), are positive for items Q10 and Q14. Based on the above, it can be said that the respondents agree with the claims that the system of tax and customs administration is administratively demanding, and they also perceive the transaction costs of bank fees this way. On the other hand, research tool items Q8 and Q13 are negative. It is therefore possible to conclude that the respondents do not consider the collection of duties to be simple and, at the same time, do not agree that the digitalization of tax and customs administration has increased user comfort. From the point of view of absolute value, they attach the greatest weight to the transaction costs of bank fees (0.322).
For the second common extracted factor (F2), in the sense of
Figure 1, all bonds between endogenous and exogenous variables are also significant. It is interesting that we find negative links in the research tool items Q11 and Q12. Here, again, it can be concluded that respondents do not perceive time savings in the administration of the the tax and customs agenda and also do not consider tax and customs administrations to be available. For the third common extracted factor (F3), we observe a positive attitude towards the competence of tax and customs administration staff (Q6) and an equally positive attitude towards simplifying the collection of levies (Q9), but we also observe a negative attitude towards labor costs and customs agenda (Q16). In the case of the last, the fourth extracted factor (F4), we note the positive attitude of respondents to the willingness of employees of tax and customs offices (Q5) and, at the same time, a positive perception of the simplification of tax collection (Q7).
Table 8 shows the values of the coefficients of covariance and correlation between the extracted exogenous variables, i.e., factors. It is obvious that all mutual relations in terms of the factor model (
Figure 1) are significant at the chosen level of significance
α = 0.05. Based on the analysis presented in
Table 8, we observe negative dependencies between the extracted factors F1 and F3 (−0.718), between the factors F1 and F4 (−0.487), between the factors F2 and F3 (−0.609), and between the factors F2 and F4 (−0.335). On the contrary, positive dependences on high levels are observed in the relationship between the extracted factors F1 and F3 (0.656) and the factors F3 and F4 (0.615). Additionally, the analysis of variance points to the fact that all factors are significant at the significance level α = 0.05, F1 (
p = 0.000), F2 (
p = 0.002), F3 (
p = 0.015), and F4 (
p = 0.005).
In the next analysis, we will focus on the basic differences in the perception of extracted factors according to the model shown in
Figure 1, from the perspective of respondents’ gender and residence. The basic indicators of individual partial models, which define the correctness and applicability of individual models, are given in
Table 9. Permissible values of individual indices are given in
Table 6.
Table 10 contains estimates of standardized regression weights and their statistical significance for the categories of male and female respondents. The main differences can be seen in the perception of item Q16 of the research tool (labor costs for staff dealing with the tax and customs agenda). While women consider this item to be statistically significant in terms of perceptions of the functioning of tax and customs administration, men consider this item to be irrelevant. Men consider item Q7 (0.497) as the most important, and, therefore, for them, from the point of view of tax and customs administration, the most important is the simplicity of tax collection, followed by item Q11 (−0.464), which concerns time savings in tax and customs administration and, finally, item Q14 (0.429)—transaction costs for bank charges. For women, the most important item is Q9 (0.484), which concerns the area of simplicity of levies collection, followed by the research tool item Q12 (−0.409) focusing on the availability of tax and customs administration and, finally, item Q11 (−0.318), to which men attach the greatest importance. From the differences in point of view on the significance of individual items between men and women, we observe the largest difference in the perception of item Q7, where the value of the difference between men and women is 0.239. Men attach more importance to this item. The second largest difference is observed in the research tool item Q12 (0.226), where, again, men give it more weight. For item Q6, which concerns the competence of tax and customs administration staff, the difference is −0.177, which means that the competence of employees is more important for women than for men, and, at the same time, the competence of employees is perceived more positively by women. As in the previous case, Q9 is perceived more positively by women than men, with the value of the difference between the two groups being −0.151. Other significant differences in the perception of the importance of the individual items of the research instrument are observed between men and women in item Q16 (0.149), which concerns labor costs dealing with the the tax and customs agenda, with women perceiving this area more negatively than men. For item Q5, focusing on the perception of the willingness of tax and customs administration staff, the value of the difference is at the level of −0.147, with women attaching more importance to this item. The last significant difference in the respondents’ answers is in the item of research tool Q11 (−0.146), wherein this item is perceived more negatively by men than women.
The analysis of mutual relations between extracted factors is given in
Table 11. We can see that the fundamental difference between men and women is in the perception of the relationship between factors F2 and F3. This relationship is insignificant for men (
p = 0.052) in contrast to women, who attach importance to this relationship (
p = 0.011). We see the opposite trend in the relationship between factors F2 and F4. In contrast to the previous case, this relationship is insignificant for women (
p = 0.060), but men attach importance to it (
p = 0.048). Other significant differences between men and women are observed in the interrelationships between the F1 and F2 factors. While men attach medium importance to this relationship at the level of the correlation coefficient of 0.446, and the relationship is positive, i.e., if the first factor was perceived positively by the respondents, then the second extracted factor was also positively perceived. In women, with the same relationship, we observe a very strong (−0.849) but negative relationship. Thus, the tendency of women to perceive the common relationship of the F1 and F2 factors is the opposite of that of men. We also observe a conflicting perception of the relationship between factors between men and women in the correlation of factors F1 and F3. While men perceive this relationship of factors very negatively (−0.844), women perceive this relationship positively but at a medium level of strength (0.590). We also observe an ambivalent perception of the interrelationships between the extracted factors between men and women in the relationship between factors F3 and F4. In both comparison groups, this relationship is statistically significant, but men perceive it very positively (0.712) in contrast to women, who perceive this relationship negatively (−0.478).
The second part of the analysis deals with the description of differences in the perception of tax and customs administration between respondents depending on their place of residence. The aim is to identify differences in the perception of the observed issue in relation to the region where respondents live or work. Both regions of eastern Slovakia were selected in a targeted manner: the Prešov and Košice self-governing regions. Furthermore, one representative of Central Slovakia was selected: the Banská Bystrica self-governing region. Western Slovakia was represented by the Bratislava elf-governing region. We start from the assumption that the respondents of the Prešov and Košice self-governing regions will show a high degree of agreement in the perception of individual extracted factors and the relationships between them. On the other hand, we assume relatively large differences in the perception of tax and customs administration between the respondents of the Prešov and Košice self-governing regions and the respondents from the Bratislava self-soverning region. The answers of the respondents from the Banská Bystrica self-governing region should coincide with the answers in the perception of individual factors with the respondents from eastern Slovakia. Individual indicators of the suitability of partial models, which are based on the basic factor model presented in
Figure 1, are defined in
Table 6. Based on
Table 6, it can be stated that all partial models of the perception of tax and customs administration based on the respondents’ residence place are correct. Estimates of standardized regression weights and their achieved level of significance are given in
Table 12.
The initial assumption that the opinions and attitudes of respondents from the Prešov and Košice self-governing regions will be similar can be rejected. As we can see from
Table 12, the most significant difference is in item Q10 of the research tool, namely in the opinions of respondents on the administrative complexity of the tax and customs agenda. Respondents from the Košice self-governing region attach importance to item Q10 (
p = 0.000), unlike to respondents from the Prešov self-governing region, for whom this item is not important (
p = 0.055). The second significant difference can be seen in item Q5, namely the perception of the willingness of employees of tax and customs offices, where this willingness is not statistically significant for respondents from the Prešov self-governing region (
p = 0.096) as opposed to respondents from the Košice self-governing region. Here it should be said that all items of the research tool and factor model (
Figure 1) are significant at the level of significance α = 0.05 for respondents from the Košice self-governing region. In terms of the importance of significant items of the research tool, it can be stated that while item Q15 is the most important item for respondents from the Prešov self-governing region, for respondents from the Košice self-governing region, it is item Q11, i.e., time savings in the administration of the tax and customs agenda, which respondents perceive negatively (−0.473).
When asking about the assumption of a high level of consent of respondents from the Prešov and Košice self-governing regions, it is necessary to state several facts. In terms of industry and economy, there are differences in real life between the various regions of Slovakia. It is interesting to observe, for example, the distribution of major manufacturing companies. The industry is concentrated mainly in the area of western and central Slovakia, while there are only a few large employers in the area of eastern Slovakia compared to the other regions. A complementary phenomenon to the previous statement is the similarity of the unemployment rate and the average wage in the Prešov and Košice self-governing regions. There are also observable/evident large differences in other evaluated items between the regions of eastern Slovakia and the rest of Slovakia, of course to the detriment of eastern Slovakia. The obvious presence of these facts led us to assume that the attitudes of respondents from the Prešov and Košice self-governing regions would be similar
When examining the answers of respondents from the Banská Bystrica self-governing region, we can see that in comparison with the previous two groups, there are differences in the perception of the importance of individual items, in particular in the following items: Q8—expressing the simplicity of customs collection (p = 0.053) and Q6 (p = 0.075), dedicated to the competence of tax and customs administration staff. We also record differences in item Q16 (p = 0.493) focused on labor costs dealing with the tax and customs agenda and finally in item Q9 (p = 0.608), which deals with the simplicity of the levies collection. These listed items of the research tool are not significant for respondents from the Banská Bystrica region. The most important item of the research tool for respondents from the Banská Bystrica region is the time saving in the administration of the the tax and customs agenda (Q11) with the value of the standardized regression coefficient at the level of −0.467. As in the other groups mentioned above, we observe a negative perception of this item, but with the greatest weight for respondents from the Banská Bystrica self-governing region during all compared groups. We observe a certain similarity in the perception of tax and customs administration among respondents from the Banská Bystrica and Bratislava self-governing regions, in view of the simplicity of customs collection. It is declared by item Q8 which is statistically insignificant for both groups, unlike to respondents from the Prešov and Košice self-governing regions. In a similar sense, respondents also perceive item Q16, namely labor costs that deal with the tax and customs agenda. Respondents from the Prešov (p = 0.044) and Košice (p = 0.003) self-governing regions consider these costs to be important and significant in contrast to the respondents from the Banská Bystrica (p = 0.493) and Bratislava (p = 0.375) self-governing regions, who do not attach importance to them.
A certain degree of similarity in the perception of tax and customs administration among respondents from the Košice and Bratislava self-governing regions can be seen in item Q10, concerning the administrative complexity of tax and customs administration. These respondents consider the item to be significant at the level of significance α = 0.05 in contrast to the respondents from the Prešov and Banská Bystrica self-governing regions, who do not attach importance to it. The willingness of employees of tax and customs offices represented by item Q5 is important for respondents from the Bratislava (
p = 0.039) and Košice (
p = 0.007) self-governing regions in contrast to respondents from the Prešov (
p = 0.096) and Banskobystrický (
p = 0.096) self-governing regions, for whom this item is irrelevant. For the respondents from the Bratislava self-governing region, the most important item of the research tool is Q9 (0.485), the simplicity of the collection of levies. The second most important indicator of the perception of tax and customs administration by respondents from the Bratislava self-governing region is the simplicity of tax collection, which is represented by item Q7 (0.387). The third most important item is item Q14 (0.375), which concerns the transaction costs of bank fees. Within the mutual similarity of the perception of tax and customs administration by all groups of respondents, they hold equally significant positions in Q14 (transaction costs for bank fees), Q13 (user comfort due to digitalization), Q15 (postage costs), and Q7 (ease of tax collection). Other differences in the perception of respondents’ attitudes to the tax and customs administration are described in
Table 12.
From the point of view of mutual relations between the extracted factors in the form of their mutual correlation, in
Table 13, we see significant differences in their perception across individual groups of respondents. Respondents from the Prešov self-governing region consider the relationship between factors F1 and F2 (
p = 0.033) to be important, with a medium strength of the mutual relationship with the value
p = 0.519. The second significant relationship is observed between factors F2 and F3 (
p = 0.024), but a strong but negative relationship is evident here. For the respondents from the Košice self-governing region, we observe all correlations in
Table 13 as significant, except for the relationship between factors F2 and F4 (
p = 0.283). The mutual significance of factors F1 and F3 (−0.951), followed by the relation of factors F3 and F4 (0.937) is of the greatest importance for the respondents.
Many developed countries have and continue to address the issue of uniform collection of taxes and levies. Some states have managed to translate the answers to the problematic questions into a functioning system, while others still remain in the well-established ways of separate tax collection from premium collection.
Increasing administrative costs, in conjunction with a system that has separate collection of taxes and levies, reduces the efficiency of their collection, thus significantly reducing the scope (area) for permanently reducing tax and levy rates or providing better, higher quality public services. We currently consider the selection system to be complicated, administratively and financially demanding not only for public finances, but also for those it is intended to serve, i.e., for citizens and businesses. Entrepreneurs, or more accurately, employers have to fulfill certain obligations in reporting and paying taxes and levies every month they are obliged (in most cases) to communicate with three institutions that, however, differ materially. These are the tax office, the social insurance agency, and the health insurance company, creating another complication in connection with health insurance because there is a need to communicate with a certain health insurance company depending on where the individual employees are insured.
The collection of taxes and individual levies takes place in three different institutions, which, as mentioned above, reduces the efficiency of the collection of taxes and levies and reduces the success of the recovery of individual receivables in the event of non-payment of taxes and levies. At the same time, such a system helps to utilize methods of debt collection and assignment. The increase in operating costs of individual institutions is a consequence of the lack of interconnection of their information systems. As a result of these facts, we observe a negative impact on the ever-increasing growth in bureaucracy and enlargement of the administrative apparatus, which, of course, also reflects in the negative direction the expenditure part of the country’s budget. Three ministries, three factually different institutions, and three different laws also cause different approaches to solving the same—annual settlement of income tax by tax authorities, annual settlement of health contributions by health insurance companies, non-settlement of social contributions by the social insurance agency, different assessment bases for social and health contributions, different databases, different information systems, and so on.
Based on the aforementioned factors, it is clearly more advantageous and contributes to the effectiveness of the PS (pension system) to implement a joint collection of taxes and levies through one institution. A much simpler system, which would allow the calculation of taxes and levies within a single form, would be an advantage for payers (citizens and businesses). In this case, all payments and information about them would go to only one institution, which would be the only partner of natural and legal persons. After the approval and implementation of the reform, there would be only one central database of citizens—tax entities and policyholders at the same time. This institution should also be the single point of contact in the event of collection problems, which will make it easier for taxpayers or, to be more accurate, premium payers, to access the private sector and reduce the complexity of complicated administrative processes for the public sector.
In the optimal case, it is possible to simultaneously implement the unification of the payment of taxes and social security and health insurance. The issue of the unification of health contributions would require additional analyses in view of the larger number of health insurance companies. However, the fact is that, despite the initial problems, a similar model for pension management companies is proving to be effective, even from the point of view of the pension management companies themselves.
There are two basic areas of concern that complicate the transition to a single collection of taxes, duties, and insurance levies. The first is the preparation of institutions that will collect taxes and insurance levies. However, the reform of the uniform collection of taxes, duties, and insurance levies is a relatively complicated process. A change in the method of collecting levies is considered in the first place to be a substantive decision which should ensure, as far as possible, the highest possible payment discipline at the lowest administrative costs. This optimization of the collection of taxes and levies is not related to any politically sensitive issues such as the number of levies or the design of the relevant benefits. The merging of the collection of levies will be a significantly effective step in properly ensuring the implementation and enforcement of the planned reform, regardless of the degree of solidarity or merit or how much these aspects will be incorporated into the calculation of benefits. The decision on the number of levies or benefits will also have no effect on this.
The primary expectation for the implementation of the reform of the unification of the collection of taxes and levies is the absolute reliability and quality of the financial administration information system, which should have the task of transferring funds and a database with information on payments of individual policyholders and employers to the social insurance agency. The individual accounts of taxpayers and policyholders must be prepared very carefully. The information will be extremely sensitive, as it will form the basis for the payment of benefits to the Social Insurance Agency. Already at the beginning of the implementation of the reform, it is necessary to clearly state that only the collection of insurance contributions, including the control and subsequent recovery of receivables, would pass to the financial administration, while the expenditure part, especially the calculation and payment of benefits, would remain within the competence of the social insurance agency.
The main difference in the perception of tax and customs administration between men and women is observed in the questionnaire item Q16 (labor costs for staff dealing with the tax and customs agenda), which women consider significant (p = 0.000) while men consider this item insignificant (p = 0.092). From the point of view of respondents’ gender, the most significant difference in the attitudes of respondents occurs in item Q7 (ease of tax collection) with the value of difference significance at the level of 0.239, wherein this item is more important for men (0.497) than for women (0.258). The most significant difference between the two self-governing regions of eastern Slovakia is in item Q10, “Administrative complexity of the tax and customs agenda.” Respondents from the Košice self-governing region attach the importance of Q10 (p = 0.000) in contrast to respondents from the Prešov self-governing region, for whom this item is not important (p = 0.055). The second significant difference can be observed for item Q5, “Helpfulness and willingness of administrative workers”, where this item is not statistically significant for respondents from the Prešov self-governing region (p = 0.096) as opposed to the respondents from the Košice self-governing region (p = 0.007).
The present study assesses the current situation. Thus, it was implemented 4 years after the last major reform of the tax and customs administration. The aim was to verify the respondents’ views on the functioning of the tax and customs administration 4 years apart and to find out the key significant factors. It is also necessary to mention the fact that within the Slovak Republic, there are frequent changes in the field of research. This causes changes in respondents’ views on the functioning of the tax and customs administration over time.
It would certainly be necessary and interesting to compare the results with other countries in the EU and especially in the V4 countries (Hungary, Poland, Czech Republic), which are closest to Slovakia both in terms of very similar historical development and in terms of economic development as post-communist countries. However, we do not have similar data from these countries because the research tool (the questionnaire) was created by the authors of the presented study. However, as part of the project solution, thanks to which we carry out the research, we plan to expand the research and compare with the Czech Republic. This project intention is proposed for the second half of 2022.
The limitations of this study are given primarily by the nature of the research focus. Due to the frequent changes in the laws that affect the tax and customs administration, the study is limited to evaluating the functioning of the tax and customs administration only through the subjective perception of the respondents, i.e., through their views and attitudes. As a result, we have reduced the number of items in the research tool and tried to simplify them as much as possible. Other limitations of this study were caused by unexpected events that occurred during the implementation of data collection in the period from 01 June 2019 to 01 June 2021. Due to the COVID-19 pandemic, changes and restrictions were unexpectedly and purposefully adopted, which greatly complicated the already complex system of tax and customs administration and made it even more confusing. The government of the Slovak Republic took steps that significantly worsened the perception of the functioning of the tax and customs administration, especially among entrepreneurs, which we observed in their answers during 2021. We mean such steps as the government extending/postponing the deadlines for levies and taxes. However, the tax authorities made entries in the list of debtors, imposed penalties, and executions. Other limits can also be perceived from the point of view of the geographical location of the respondents. In principle, more negative answers were from entrepreneurs in the east of Slovakia (the Prešov and Košice self-governing regions). However, due to changes in the course of the study (especially the turn of 2020 and 2021 and the whole period until 1 June 2021), the results are heterogeneous in time, which allowed us to capture the time change in the perception of the tax and customs administration. The next direction of research will be to capture the perception of tax and customs administration in the period of the global pandemic COVID-19 in a smaller sample of about 1100 respondents and, after the adoption and implementation of tax reform, to conduct new research in this area and define key factors that affect how it is perceived by selected groups.


