Article

Evaluation of the Water Resource Carrying Capacity on the North Slope of the Tianshan Mountains, Northwest China

1
School of Economics and Management, Shihezi University, Shihezi 832000, China
2
Key Laboratory of Xinjiang Production and Construction Corps for Ecological and Water Conservancy Engineering in the Cold and Drought Area, College of Water and Architectural Engineering, Shihezi University, Shihezi 832000, China
3
College of Water Resources and Architectural Engineering, Northwest Agriculture and Forestry University, Xianyang 712100, China
4
Department of Earth and Planetary Sciences, University of Texas at San Antonio One UTSA Circle, San Antonio, TX 78249, USA
*
Authors to whom correspondence should be addressed.
Sustainability 2022, 14(3), 1905; https://doi.org/10.3390/su14031905
Submission received: 3 January 2022 / Revised: 26 January 2022 / Accepted: 3 February 2022 / Published: 7 February 2022

Abstract

:
Water resource carrying capacity (WRCC) is essential for characterizing the harmony between humans and water resources in an area. Investigation of the WRCC is useful for guiding the sustainable development of a region. The northern slope of the Tianshan Mountains is an important area for the economic development of Xinjiang, China. In recent years, the supply of water in the area barely satisfies the demand. To quantitatively evaluate the WRCC, data for four indicators including the water resources, social and economic development, and ecological environment of the area were utilized. The comprehensive weighting method, which combines the entropy and analytic hierarchy processes, was used to assess these indicators. A fuzzy comprehensive evaluation model was employed to evaluate the urban WRCC of the northern slope of the Tianshan Mountain for 2018. The results showed urban WRCC values varying between good and moderate for the northern slope of the Tianshan Mountains, and this indicates that the study area is in a loadable state. Although the water supply can meet the development of cities on the northern slope of the Tianshan Mountains to a certain extent at this stage, because it is located in the arid region of western China, the shortage and uneven distribution of water resources are one of the biggest limiting factors for the future development of this region. The findings of the present study provide a basis for the development, rational allocation, and sustainable utilization of urban water resources on the northern slope of the Tianshan Mountains.

1. Introduction

The water resource carrying capacity (WRCC) refers to the scale of water resources that can support the sustainable economic and social and ecological development of a region [1]. The WRCC of a region often reflects the environmental conditions, and its evaluation is vital to ensure a balance between the water supply and demand in an area for rational societal, ecological, and economic development. Further, understanding of the WRCC is useful for preventing environmental degradation and maintaining a spatial balance of water resources in a region. Therefore, adequate evaluation of the WRCC can promote the sustainable social and economic development of a region [2,3]. In the 1990s, Engelman [4] and others proposed the population, growth rate, distribution, and consumption patterns as factors for the assessment of the WRCC of a region. Based on such factors, the relationship between the supply from freshwater resources and three main areas of demand was analyzed. In the 21st century, Michiel [5] and others studied safety evaluation and management systems of urban water resources and concluded that the urban WRCC guarantees the safety of urban water resources. In 2015, Koop [6] proposed WRCC evaluation indexes associated with the chemical industry, water pollution, and other aspects, and this improved the management of water resources in urban areas.
In China, studies on the WRCC commenced in the arid and water-deficient northwestern regions, and Xinjiang is among the most investigated areas. Xinguang [7], for example, utilized eight indexes to construct a fuzzy comprehensive evaluation model for the assessment of the WRCC of Xinjiang. Mingbo et al. [8] used the fuzzy comprehensive discrimination method to highlight the controlling factors and membership functions of the WRCC in the Yili Mine area and predicted the impact of mining on the WRCC for three subsequent years with and without the protection of water resources. Aman et al. [9] employed the system dynamics theory to construct a WRCC model for Xinjiang based on the evaluation, simulation, and predictions for five scenarios. Overall, a combination of a medium-speed economic and population development, efficient water saving, and cross-regional water transfer was proposed as the best approach to safeguard water resources in Xinjiang, while ensuring sustainable social and economic development.
The fuzzy comprehensive evaluation method [10,11] is a quantitative multifactor approach utilized for solving decision-making problems. It involves the use of principles of fuzzy mathematics for enhanced scientific, accurate, and realistic quantitative evaluation of fuzzy information using precise digital means. Therefore, this approach has been widely employed to analyze and evaluate the WRCC in different regions. He [12], for example, utilized eight indicators to establish an evaluation system of the ecological environment in the Liaohe River Basin. The method was used to evaluate the impact of the ecological environment in the Tieling section on the WRCC of the Liaohe River. In addition, Wenping et al. [13] applied the fuzzy comprehensive evaluation method to assess the quality of karst groundwater in Cengong County, while Ge [14] combined the fuzzy comprehensive evaluation method and a system dynamics model to highlight the WRCC trend associated with development in Changchun City. The study revealed that, if the existing development model was adopted, the WRCC will continue to decline, and thus, reasonable measures were required to preserve an adequate WRCC.
In the context of a global water crisis, China will inevitably face difficulties in water supply. Xinjiang is an arid area in western China, and its water resources are continuously declining. Cities on the northern slope of the Tianshan Mountains [15], which form an urban cluster in Xinjiang, are important for the economy of the frontier area, the maintenance of stability, and protection of the border. Water resources currently represent the critical limiting factor in the evolution and development of the eco–economic systems of regions. In recent years, rapid industrial and agricultural developments have accentuated the urban water resource utilization problem on the northern slope of the Tianshan Mountains. For example, the contradiction between supply and demand of water resources is prominent, the structure of water use does not conform to the actual situation, the efficiency of water use is low, and the groundwater is severely overexploited. These problems lead to fragile regional ecological environment, which significantly restricts sustainable development of the local economy, society, and environment. Therefore, studying the urban WRCC on the northern slope of the Tianshan Mountains is vital for the future development of the region.
Considering previous studies [16,17], nine cities on the northern slope of Tianshan Mountains are involved in the present study. Among the four subsystems including water resources, the society, economy, and ecological environment, 15 representative indicators established using statistics in 2018 were examined in the present study. The comprehensive entropy method, which combines the analytic hierarchy process (AHP) and entropy method, was utilized to assign weights to various indicators. A fuzzy comprehensive evaluation model was then constructed, and this was used to assess the urban WRCC of the northern slope of the Tianshan Mountains. This study aims to provide a scientific reference for the rational allocation, development, and utilization of water resources in cities on the northern slope of the Tianshan Mountains and to support sustainable development of the administrative regions. Due to the special geographical location and climatic and environmental characteristics of the study area, this study is not only an important theoretical basis for the rational allocation and sustainable development of water resources in the study area. It also provides a certain reference value for related research work in other inland river areas in arid regions.

2. Study Area and Data

2.1. Study Area

The study area (Figure 1) is in the central section of the northern slope of the Tianshan Mountains, along the southern margin of the Junggar Basin in Xinjiang. Specifically, it includes nine administrative regions including Urumqi, Karamay, Shihezi, Turpan, Hami, Changji, Ili, Tacheng, and Boertala. It is between longitudes 79°88′ and 96°39′E and latitudes 40°87′ and 46°21′N, and it comprises desert, oasis, and mountainous areas from north to south. The study area covers 9.54 × 10⁴ km2, and it hosts approximately 23.3% of the total population of Xinjiang [18]. It represents a typical inland arid area characterized by scarce rainfall, with an average annual temperature of 6.9 °C, and the average annual rainfall from 2000 to 2019 was 220 mm. The spring and summer account for 66% of the annual precipitation. The region is characterized by an enormous evaporation potential, with an average annual evaporation of 1871 mm. This densely populated area hosts 77.6% of the heavy and 66.5% of light industries in Xinjiang. Consequently, it is the engine for the development of modern industries including agriculture, information science, and technology in Xinjiang.

2.2. Data Sources

Data utilized in the present study were obtained from the Xinjiang Water Resources Bulletin, Xinjiang Statistical Yearbook, and Xinjiang Production and Construction Corps Statistical Yearbook. (Evaluation index parameters. xlsx; http://www.yearbookchina.com; http://tjj.xinjiang.gov.cn/ accessed on 20 September 2021). These data included the total water resources volume, total water supply, total water consumption, annual precipitation, tertiary production water consumption, ecological environment water consumption, land area, cultivated land area, area of afforestation, total population, urban population, gross domestic product, total industry output, agriculture, and other data relevant for the water resources, social, economy, and ecology.

2.3. Water Resources and Economic Conditions in the Study Area

Water resources are crucial for the social and economic development of arid zone oases. The study area is a typical inland arid area, and thus, its water resources will significantly impact sustainable development of the region in the future. Statistical methods were used for analysis, and data were processed with the help of Excel software. Socioeconomic data for cities on the northern slope of the Tianshan Mountains from 2009 to 2019 were analyzed. Changes in the population, GDP, total water resources volume, and per capita water resources for these cities during the interval studied are shown in Figure 2. Evidently, the population and economic growth rates of the region continuously increased from 2009 to 2018. However, although the total amount of water resources in the study area is high, the per capita amount is relatively low. The main reason is that, on the one hand, although the total amount of water in the region is large, most of these water resources exist in uninhabited places in the form of glacial solid water. There is no way for humans to use it directly. On the other hand, the study area is the most economically developed region in Xinjiang. In recent years, the total water volume has changed slightly, but the population has grown rapidly, and the population size has continued to expand, resulting in a decrease in the per capita water availability.

3. Methods

3.1. Fuzzy Comprehensive Evaluation Model

In the fuzzy evaluation, factors that affect the WRCC were initially evaluated, and then the evaluation was extended to multiple factors using a comprehensive evaluation matrix. The WRCC of the study area was obtained based on the following principle: the establishment of a factor set for the evaluation object U = { u 1 , u 2 , , u n } and a comment set V = { v 1 , v 2 , , v m } . The parameter U represents a collection of comprehensive evaluation factors, while V is a collection of reviews. The fuzzy comprehensive evaluation results were calculated according to the following expression [19]:
B = A · R
where A = { a 1 , a 2 , , a n } for 0 a i 1 , with a i denoting the degree of membership of U to A , that is, the weighted value of the index. This indicates the magnitude of the influence of the factor u i in the evaluation factor to satisfy i = 1 n a i = 1 ; B = { b 1 , b 2 , , b m } for 0 b i 1 , where b i is the degree of membership of v i to the fuzzy subset B obtained from the comprehensive evaluation. This represents the result of the fuzzy comprehensive evaluation R, which represents the degree of membership (decision of the evaluation factor) matrix, as follows:
R = [ r 11 r 1 n r m 1 r m n ]
where r i j is the degree of membership of the evaluation of v i to the level of v i and R i = ( r i 1 , r i 2 , , r i m ) is the fuzzy subset of the comment set V , that is, the single-factor evaluation result of u i .

3.2. Creation of the Evaluation Index System and Grading Standard

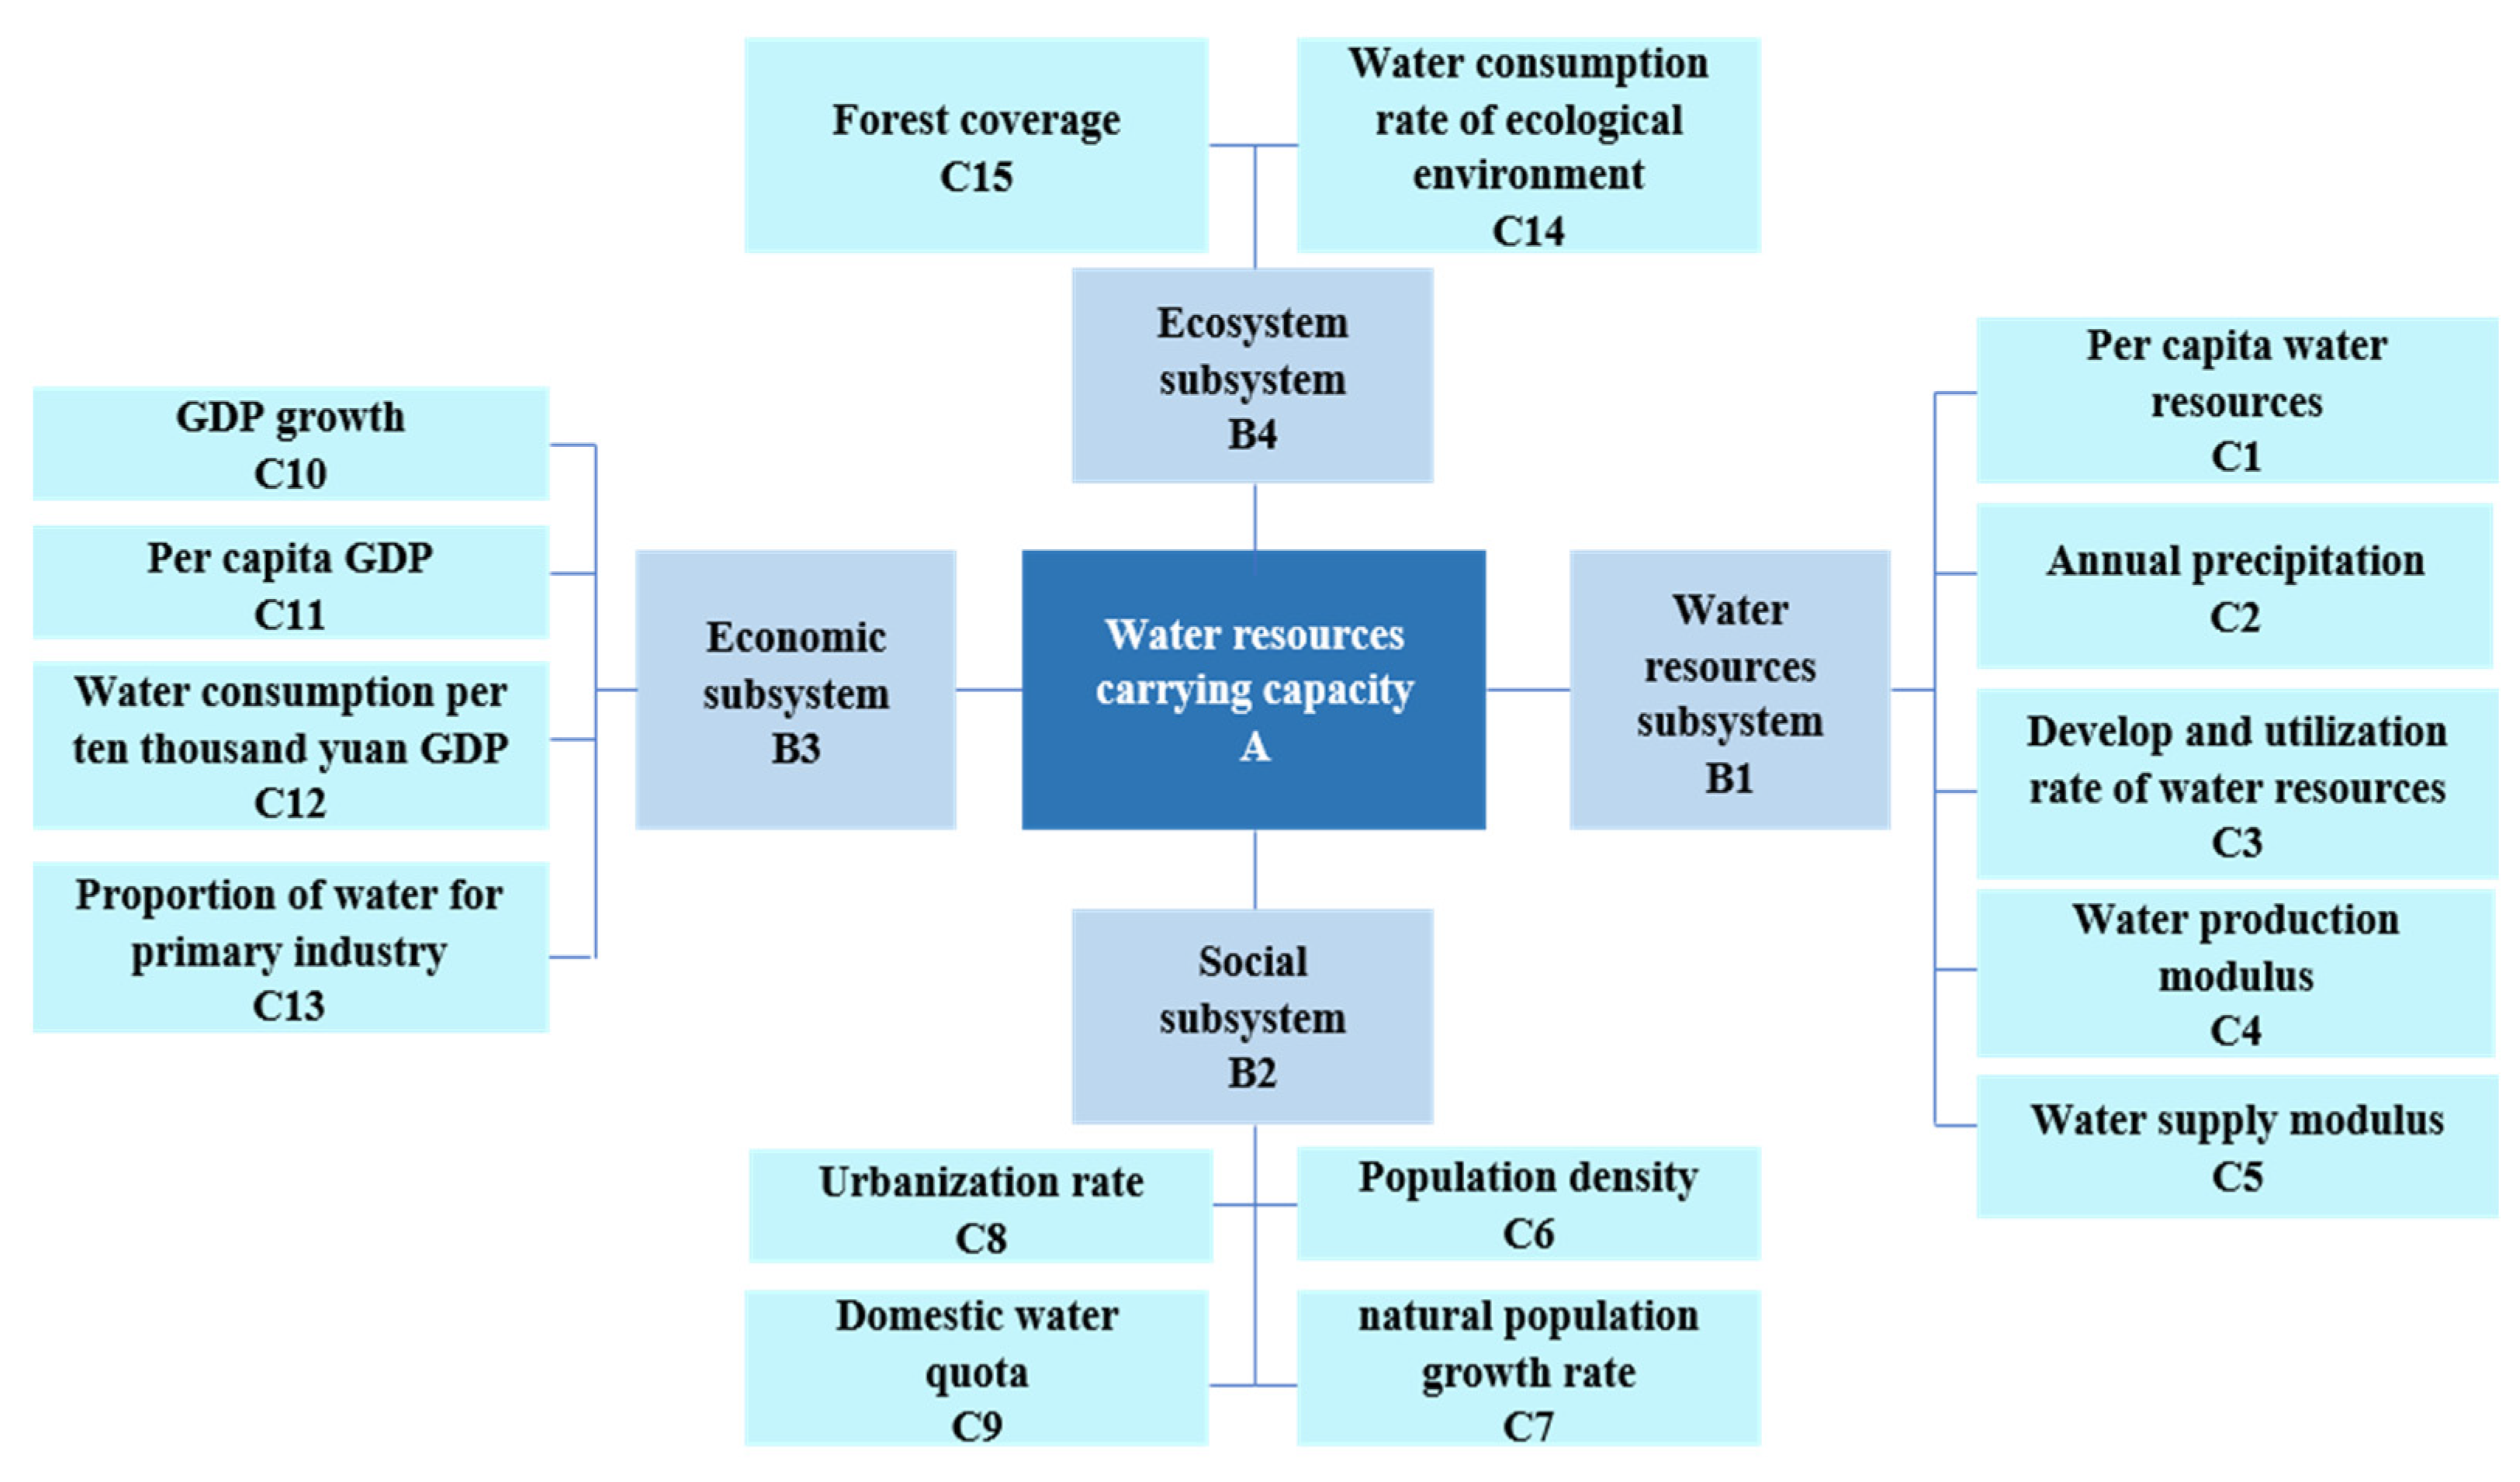
In selecting evaluation indicators, the following were considered: comprehensiveness, hierarchy, operability, and data availability. According to the concept of the WRCC, the comprehensive impact of water resources, socioeconomic, and ecological environment systems are considered. Therefore, when measuring or evaluating the WRCC of a region, consideration of the influence of factors such as the water resource conditions, social scale, economic structure, technical level, and ecological environment of the region is paramount. In the present study, the WRCC evaluation index involved the following subsystems: water resources, social, economic, and ecological. These subsystems produced 15 indicators that were utilized to produce an indicator system (Figure 3).
The WRCC evaluation index standards were determined by referring to the international and domestic sustainable development and other indexes [20,21] as well as related previous studies [22,23]. Each evaluation index was divided into three grades [10], and the evaluation index and grade classification data are presented in Table 1.
The v 1 indicates that the WRCC is at a favorable level, which means that the water resources in the region are associated with a high carrying capacity. Accordingly, the supply of water resources is sufficient to meet the demand. Conversely, the v 3 signifies that the WRCC is at a sensitive level, and this implies that the WRCC of the area is low. In this case, the lack of sustainability of the relationship between the water resources supply and demand is prominent, and this restricts the social and economic development. Relatedly, the v 2 indicates that the WRCC is at a critical level, and this status is between the v 1 and v 3 , which means that the WRCC remains adequate for effective social and economic development of the region. Although the development and utilization of water resources in the study area are at advanced stages, some potential for development remains [24].

3.3. Determination of the Evaluation Index Weight

The WRCC evaluation index weight calculations can be divided into subjective and objective methods [25,26]. Subjective methods, such as the AHP and comparative matrix, require decision makers to determine the importance of each indicator. Conversely, objective methods, such as the entropy weight, overly rely on the shortcomings of the index change rate. Therefore, in the present study, a method integrating the AHP and the entropy method was utilized to determine the weight of the evaluation index.
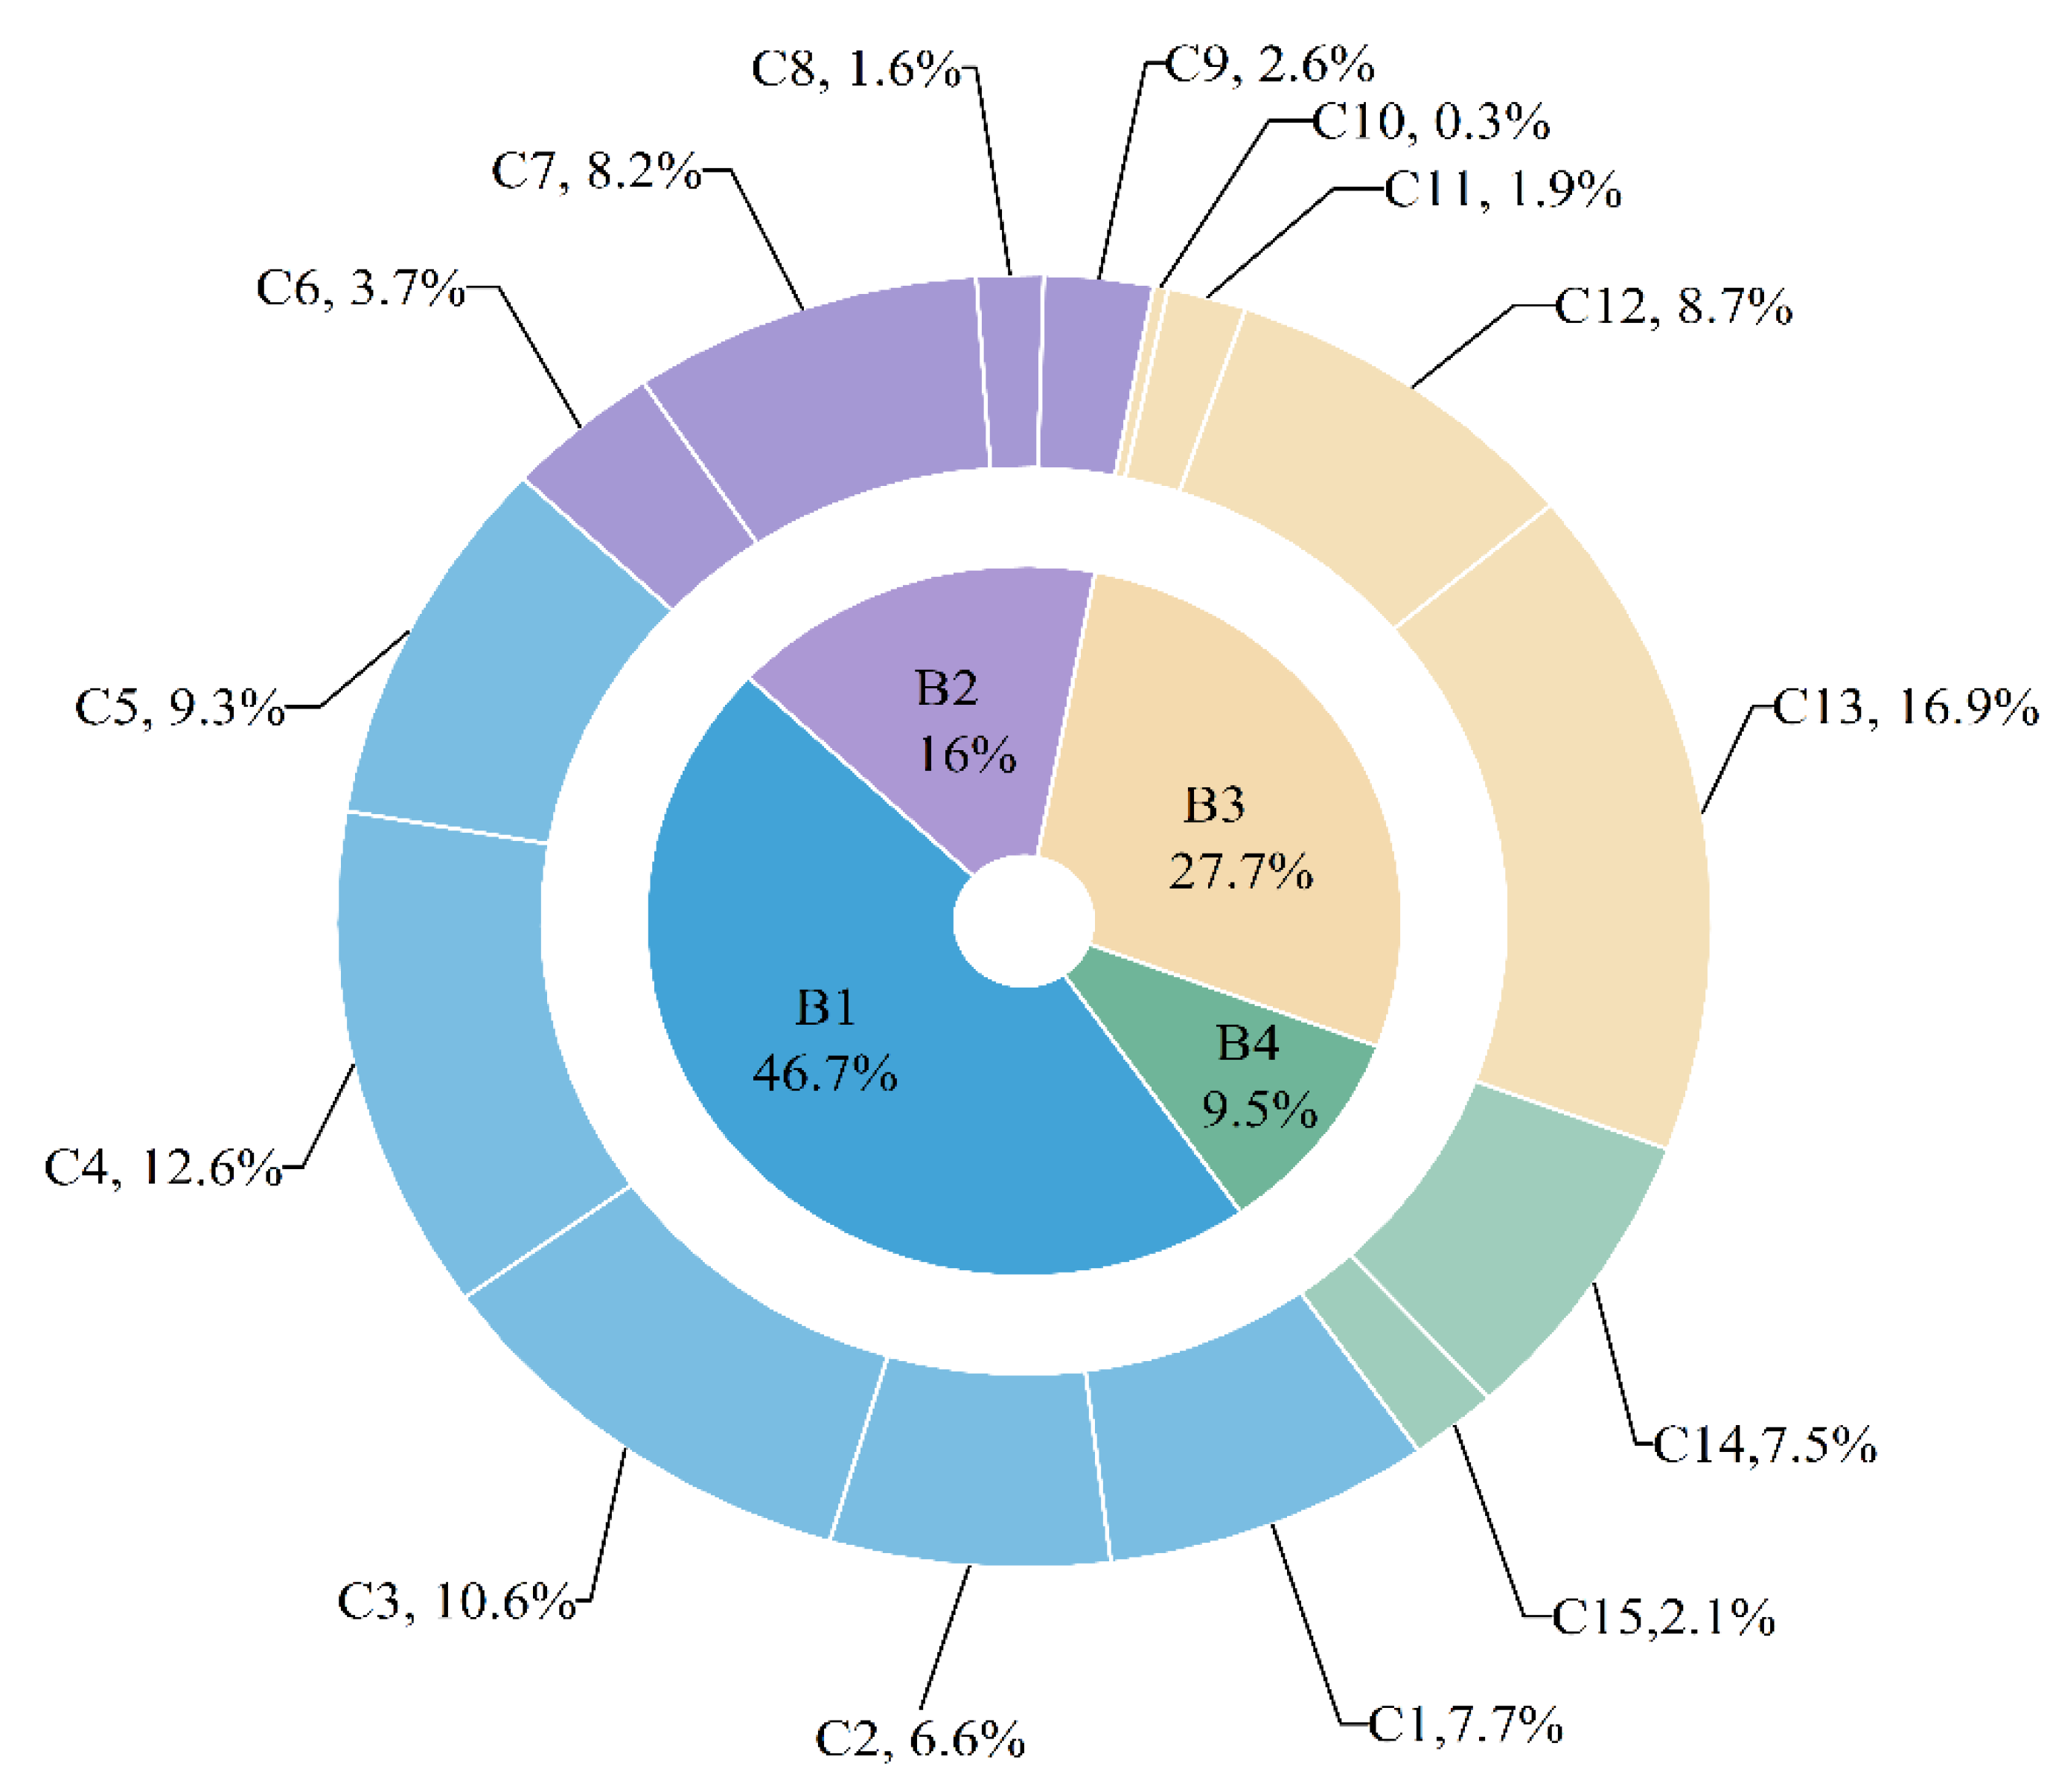
First, the AHP was used to compute the weights W j 1 of the water resources, society, economy, and ecology at the criterion level [26,27,28]. The W B 1 , W B 2 ,   W B 3 , and W B 4 obtained were correspondingly 0.4673, 0.1601, 0.2772, and 0.0954, for a C I of 0.0103 and R I of 0.8879, yielding a C R   ( C I / R I ) of 0.0116, which was <0.1 and thus satisfied the consistency test.
The weight of each evaluation index in the criterion layer was then determined using the entropy method. Since the original data cannot be directly compared, it is necessary to standardize the data to objectively analyze the regional WRCC. First of all, the selected 15 indicators are beneficial to the coordination and sustainable development of urbanization and water resources. The positive index transformation formula is used for normalization processing. In contrast, the negative index transformation formula is used for standardization processing to obtain a standardized matrix. The entropy value of the index was then determined, and details on the process for calculating the index weight W j were provided in previous studies [29,30]. The results for W 1 ,   W 2 ,   W 3 ,   and   W 4 were {0.1647, 0.1409, 0.2257, 0.2699, 0.1988}, {0.2282, 0.5137, 0.0981, 0.1600}, {0.012 3, 0.0671, 0.3124, 0.608 2}, and {0.7805, 0.2195}, respectively. The weight of each subsystem was multiplied by the weight of each evaluation index to obtain the final weight of the evaluation index.

3.4. Model Calculation Subsection

The steps utilized to calculate the WRCC evaluation index are summarized as follows:
(1) A fuzzy judgment matrix R was created via the calculation of r i j in the evaluation matrix R and by comparing the actual values of the evaluation factors with the grading indicators (Table 1) for the corresponding factors. The membership functions of the evaluation factors c 1 ,   c 2 ,   c 4 ,   c 8 ,   c 10 ,   c 11   ,   c 14 , and c 15 were determined using the following expressions:
r 1 = { 0.5 ( 1 + k 1 c i k 2 c i ) ( c i k 1 ) 0.5 ( 1 c i k i k 2 k 1 ) ( k 2 c i < k 1 ) 0 ( c i < k 2 )
r 1 = { 0.5 ( 1 k 1 c i k 2 c i ) ( c i k 1 ) 0.5 ( 1 + c i k i k 2 k 1 ) ( k 2 c i < k 1 ) 0.5 ( 1 + k 3 c i k 3 k 2 ) ( k 3 c i < k 2 ) 0.5 ( 1 + c i k 3 c i k 2 ) ( c i < k 3 )
r 3 = { 0.5 ( 1 + c i k 3 c i k 2 ) ( c i < k 3 ) 0.5 ( 1 k 3 c i k 3 k 2 ) ( k 3 c i < k 2 ) 0 ( c i k 2 )
Similarly, the membership functions of the evaluation factors c 3 ,   c 5 ,   c 6 ,   c 7 ,   c 9 ,   c 12 , and c 13 were obtained from the following:
r 1 = { 0.5 ( 1 + k 1 c i k 2 c i ) ( c i < k 1 ) 0.5 ( 1 c i k i k 2 k 1 ) ( k 1 c i < k 2 ) 0 ( c i > k 2 )
r 2 = { 0.5 ( 1 k 1 c i k 2 c i ) ( c i < k 1 ) 0.5 ( 1 + c i k 1 k 2 k 1 ) ( k 1 c i < k 2 ) 0.5 ( 1 + k 3 c i k 3 k 2 ) ( k 2 c i < k 3 ) 0.5 ( 1 c i k 3 c i k 2 ) ( c i k 3 )
r 3 = { 0.5 ( 1 + c i k 3 c i k 2 ) ( c i k 3 ) 0.5 ( 1 k 3 c i k 3 k 2 ) ( k 2 c i < k 3 ) 0 ( c i < k 2 )
where k 1 is the critical value of the evaluation levels v 1 and v 2 ; k 3 denotes the critical value of the evaluation levels v 2 and v 3 ; and k 2 represents the mean of the evaluation level v 2 , that is, k 2 = k 1 + k 2 2 .
(2) The comprehensive evaluation index of the WRCC was calculated by considering B = A · R , where b j = i = 1 n a i r i j ,( j   = 1, 2, …, m ). Through substitution of the value of the membership degree b j into Equation (9), the total score of the WRCC was obtained.
a = j = 1 3 b j α j j = 1 3 b j
In Equation (9), α j denotes the numerical value of each evaluation grade I-point system after the quantification of grade j for α j = {0.95, 0.5, 0.05}, and a is the score of the comprehensive evaluation result matrix B of the WRCC [31].

4. Results

4.1. Analysis of the WRCC Evaluation Index Weight

Weights for the 15 indicators that were calculated based on the approach presented in Section 2.3 are shown in Figure 4. According to data shown in Figure 4, in the evaluation system of the WRCC on the northern slope of the Tianshan Mountains, the water resources (B1), social (B2), and economic (B3) subsystems are characterized by higher weights relative to the ecological subsystem (B4). Data for the evaluation index factors reveal that the utilization rate of water resources development (C3), modulus of water production (C4), modulus of water supply (C5), population growth rate (C7), and water consumption per ten thousand yuan GDP (C12) account for more than 40% of the weights. In addition, the industrial water consumption (C13) represents greater than 15% of the total weight, and its value significantly surpasses those of other evaluation index factors. Consequently, evaluation factors with high weights are associated with the water resources, social, and economic subsystems. Therefore, these subsystems significantly impacted the urban WRCC obtained for the northern slope of the Tianshan Mountains. In fact, the water resources and economic subsystems dominated in the evaluation system [32].

4.2. Analysis of the WRCC Evaluation Results

The evaluation matrix R of each urban WRCC evaluation index for the northern slope of the Tianshan Mountains and the comprehensive evaluation results are shown in Figure 5 and presented in Table 2. According to data in Figure 5, the water resources development and utilization rate (C3) and the primary industry water–use ratio (C13) for Turpan display membership degrees of 0.705 and 0.729, respectively, relative to v 3 . These results indicate that the agricultural water consumption is high and that the water resources industry allocation is irrational. This explains the low WRCCs, which restrict sustainable development in these regions. The degree of subordination of the resource development utilization rate (C3) and the ecological environment water–use rate (C14) are, correspondingly 0.452 and 0.869, relative to v 1 . Obviously, sustainable development of the ecological environment significantly improves the WRCC. The comprehensive evaluation results of urban WRCC on the northern slope of the Tianshan Mountains are sorted from high to low (Table 2). The table shows that Ili is the highest and Turpan the lowest. The comprehensive evaluation results of the nine administrative regions are all above 0.3, indicating that the urban WRCC on the northern slope of the Tianshan Mountains has attained a high scale. At this stage, the supply of water resources is partially adequate for the development of cities on the northern slope of the Tianshan Mountains. Therefore, shortage and uneven distribution of water resources will be limiting factors for the development of the region in the future.

5. Discussion

Through the research results, it can be seen that although the WRCC in most areas of the northern slope of Tianshan is in a bearable state, in the process of regional development, the regional water resources development has already reached a large scale. Therefore, it is necessary to formulate a scientific water resource utilization plan that conforms to the actual situation of the region. These plans can prevent deterioration of the ecological environment in the river basin if the limit of the carrying capacity is exceeded. Figure 6 shows that the degrees of subordination of WRCCs for the cities of Turpan and Hami to v 3 are higher relative to v 1 and v 2 . These results demonstrate that the development and utilization of water resources in these two regions are at advanced scales. In fact, these cities are characterized by scarcity of water resources, and thus, the inadequacy of the supply relative to the demand is obvious.
In contrast, the degrees of subordination of WRCCs for Urumqi, Karamay, Shihezi, Changji, Tacheng, and Boertala to v 2 and v 3 are higher relative to v 1 . These results demonstrate that the WRCCs of these cities are in a moderate state, and these are adequate for the needs of production, life, and ecology. However, the supply of and demand for water resources also exhibit a relationship of concern because the scales of development and utilization of water resources are high, and accommodation for further development and utilization is limited. Conversely, for the city of Ili, the membership degrees are v 1 ( 0.3106 ) ,     v 2   ( 0.3895 ) , and v 3   ( 0.3009 ) . Although the membership degrees of v 1 and v 2 are higher than v 3 , the difference between v 1 and v 3 is small. This indicates that the WRCC of the city is relatively high, and the potential for development and utilization of water resources is great.
In the study area, the WRCC is uneven, as shown by the spatial distribution. Regarding the water resources subsystem, Ili produced the highest score (0.8), while Turpan yielded the lowest (0.47). Figure 7 clearly shows that the evaluation indexes for Ili, Boertala, and Tacheng are significantly higher than those for other cities. According to results for the social subsystem, the highest value was obtained from Changji, while the least is associated with Urumqi. Relatedly, for the economic subsystem, the highest value of 0.87 is linked to Urumqi, while the lowest value of 0.4 is associated with Tacheng. Overall, scores of the economic subsystems for cities on the northern slope of the Tianshan Mountains are relatively high. Areas with high scores indicate high levels of socioeconomic development, and water saving linked to agriculture exerts a significant influence. In contrast, areas exhibiting low scores require rational plans for the structure of industries, and adjustment of the urban water–use structure is necessary. In addition, from the evaluation results of the water resources subsystem alone, the scores of cities on the northern slope of Tianshan Mountains in 2018 were relatively high, all above 0.4. The main reason is that it is obviously affected by the total amount of water resources in this year. At the same time, the influence of water resources subsystem in the comprehensive evaluation system is larger than that of other subsystems, and the weight of the evaluation indicators included is also high. As displayed in Figure 7, scores for the ecological subsystem for cities on the northern slope of the Tianshan Mountains are low. These low values are attributed to the ongoing rapid development, which mainly involves the social and economic subsystems. Therefore, management of the construction of the ecological environment and the water ecological basin in the future must be strengthened.
Figure 8 shows the composition of the comprehensive score value of regional WRCC, which is obtained by comprehensive calculation of the respective carrying capacity values of the four subsystems. It can be seen from the figure that the differences in ecological and social subsystems among cities are smaller than those in economic and water resources subsystems, and the economic and water resources subsystems account for a large proportion in the composition of the comprehensive score. These differences reflect the relative importance of the water resources and economic subsystems in the WRCC evaluation system for the study area. Owing to actual conditions in the study area, higher weights were assigned to these subsystems during the weighting process.
By examining the degree of membership of each evaluation index to v 1 ,   v 2 , and v 3 , targeted measures and suggestions for improving the water resource utilization can be proposed. The data in Figure 5 were combined to analyze the WRCC associated with nine cities on the northern slope of Tianshan Mountains in 2018, and this leads to interesting conclusions. For example, the subordination degree of the water consumption per 10,000 yuan of GDP (C12) to v 1 for Hami City is 0.555, while those for the proportion of water consumed by primary industries (C13) to v 2 and v 3 are, correspondingly, 0.339 and 0.661, and those for forest coverage (C15) relative to v 2 and v 3 are 0.307 and 0.693, respectively. These results suggest that irrigation involving high water consumption or a low water management efficiency is restricting sustainable development of the region. Therefore, measures to reduce water consumption via agriculture are required. For example, the water pricing system can be adjusted to suit the situation in the region and thus ensure it is rational and scientific.
The comprehensive evaluation values for the nine cities in the study area are between 0.3 and 0.6, but these can be discriminated, as shown in Figure 9. The unsustainable relationship between the water supply and demand in the central part of the economic belt on the northern slope of the Tianshan Mountains (Urumqi, Shihezi, Changji) and that for the western part (Boertala, Karamay) are prominent. Therefore, the water use structure requires adjustment to enhance the water use efficiency. In fact, effective measures are urgently needed to ensure coordinated development of the social, economic, and ecological environments.
In the western part of the northern slope of the Tianshan Mountains, which hosts Ili, the WRCC is high, and this reflects a significant potential for development. However, to accommodate the coordinated development of the region and the sustainable use of water resources, further development and utilization of water resources in the region require adequate planning. In the eastern part of the northern slope of the Tianshan Mountains (Turpan and Hami), WRCCs are low because of advanced development and utilization. Therefore, the potential for further development and utilization of water resources in these areas is low, and this is associated with a fragile ecological environment. To strengthen the ecological environment, coordination of the development of production, life, and ecology is necessary. Overall, the area urgently requires rational planning to protect water resources.

6. Conclusions

  • The carrying capacities of urban water resources on the northern slope of Tianshan Mountains were overall good, and these were all in a bearable state. Among these, Ili City produced a high WRCC, and thus, its potential for water resource development is great. Conversely, the WRCC for Turpan City was relatively low, which indicated a limited potential for the development of water resources. Despite the relatively low WRCCs for other regions, these areas retain some potential for the development of water resources.
  • Regarding various subsystems, overall, the condition of the water resources and economic subsystems were better than those of the social and ecological subsystems. The highest evaluation value for the water resources subsystem was obtained from data for Ili City, while the lowest was linked to Turpan City. Conversely, the evaluation values for the economic subsystem were highest for Urumqi and least for Tacheng. In general, cities on the northern slope of the Tianshan Mountains produced low evaluation values for the ecological subsystem in 2018.
  • The evaluation results can be used as a guide for the planning, sustainable development, and utilization of urban water resources on the northern slope of the Tianshan Mountains. Water resources are vital for urban development on the northern slope of the Tianshan Mountains. Therefore, henceforth, various cities in this region must adopt a rational development model based on local conditions. In Turpan and Hami, for example, which are areas characterized by low WRCCs, water associated with industrial and domestic sewage can be reclaimed for utilization in urban greening construction. In addition, industries can be located in areas with low water resources to reduce water consumption and pollution.

Author Contributions

Conceptualization, G.Y. and C.W.; methodology, G.Y.; software, X.Z.; validation, X.Z., G.A., G.Y. and Y.G.; formal analysis, C.L. and X.L.; investigation, P.L. and Y.L.; resources, G.Y.; data curation, X.Z.; writing—original draft preparation, X.Z. and G.A.; writing—review and editing, X.Z. and G.A.; visualization, P.G. and C.Q.; supervision, G.Y. and C.Q.; project administration, G.Y.; funding acquisition, G.Y. All authors have read and agreed to the published version of the manuscript.

Funding

This research was funded by the National Natural Science Foundation of China (grant number U1803244, 51769030); Xinjiang Production and Construction Corps (grant numbers 2021AB021, CZ027204, 2018AB027); and Shihezi University (grant number CXRC201801, RCZK2018C22).

Institutional Review Board Statement

Not applicable.

Informed Consent Statement

Not applicable.

Data Availability Statement

Not applicable.

Acknowledgments

We acknowledge support Xinjiang Production and Construction Group Key Laboratory of Modern Water-Saving Irrigation.

Conflicts of Interest

Authors declare no conflict of interest.

References

  1. Lv, A.; Han, Y.; Zhu, W.B.; Zhang, S.; Zhao, W. Risk assessment of water resources carrying capacity in China. Am. Water Resour. Assoc. 2021, 57, 539–551. [Google Scholar] [CrossRef]
  2. Yang, Y.H.; Liu, Y.; Cao, S.L.; Cheng, Y. A method of evaluating water resource assets and liabilities: A case study of Jinan City, Shandong Province. Water 2017, 9, 575. [Google Scholar] [CrossRef] [Green Version]
  3. Meng, L.Y.; Li, W.J. Fuzzy comprehensive evaluation model for water resources carrying capacity in Tarim River Basin, Xinjiang. Chin. Geogr. Sci. 2009, 19, 89–95. [Google Scholar] [CrossRef]
  4. Engelman, R.; Leroy, P.J. Population and the future of renewable water supplies. Sustain. Water 1993, 23, 296. [Google Scholar]
  5. Rijsberman, M.A.; van de Ven, F.H.M. Different approaches to assessment of design and management of sustainable urban water systems. Environ. Impact Assess. Rev. 2000, 20, 333–345. [Google Scholar] [CrossRef]
  6. Koop, S.; Leeuwen, C.J. Assessment of the sustainability of water resources management: A critical review of the city blueprint approach. Water Resour. Manag. 2015, 29, 5649–5670. [Google Scholar] [CrossRef] [Green Version]
  7. Duan, X.; Luan, F. Evaluation of water resources carrying capacity in Xinjiang based on fuzzy comprehensive model. J. China Popul. Resour. Environ. 2014, 24, 119–122. (In Chinese) [Google Scholar]
  8. Chi, M.B.; Zhang, D.S.; Fan, G.W.; Zhang, W.; Liu, H. Prediction of water resource carrying capacity by the analytic hierarchy process-fuzzy discrimination method in a mining area. Ecol. Indic. 2019, 96, 647–655. [Google Scholar] [CrossRef]
  9. Aman, R.; Fang, C. Research on development model sthatare suitable for water resources based on system dynamics model. Environ. Sci. Technol. 2020, 43, 205–215. (In Chinese) [Google Scholar] [CrossRef]
  10. Hou, G.Y.; Tang, D.S. Fuzzy Comprehensive Evaluation of Water Resources Carrying Capacity Based on Vague Method. In Proceedings of the 3rd International Conference on Civil Engineering and Transportation (ICCET 2013), Kunming, China, 14–15 December 2013. [Google Scholar] [CrossRef]
  11. Gao, Y.; Zhang, H.M.; Xu, G.W.; Su, H. Fuzzy Comprehensive Evaluation of Water Resources Carrying Capacity in Suzhou City of Anhui Province. In Proceedings of the 3rd International Symposium On Multi-Field Coupling Theory of Rock and Soil Media and Its Applications, China Three Gorges University, Yichang, China, 20–21 October 2012. [Google Scholar] [CrossRef]
  12. Wang, H. Fuzzy Comprehensive Evaluation model for eco-environmental carrying capacity related to water in Tie Ling section of Liao River Basins, China. In Proceedings of the International Conference on Chemical, Material and Food Engineering (CMFE), Kunming, China, 25–26 July 2015. [Google Scholar]
  13. Zhang, W.P.; Li, B.; Liu, Z.J.; Zhang, B. Application of improved fuzzy comprehensive evaluation method in Karst groundwater quality evaluation: A case study of Cengong county. Earth Sci. Inform. 2021, 14, 1101–1109. [Google Scholar] [CrossRef]
  14. Wang, G.; Xiao, C.L.; Qi, Z.W.; Meng, F.; Liang, X. Development tendency analysis for the water resource carrying capacity based on system dynamics model and the improved fuzzy comprehensive evaluation method in the Changchun City, China. Ecol. Indic. 2021, 122, 107232. [Google Scholar] [CrossRef]
  15. Fang, C.L.; Gao, Q.; Zhang, X.L.; Cheng, W. Spatiotemporal characteristics of the expansion of an urban agglomeration and its effect on the eco-environment: Case study on the northern slope of the Tianshan mountains. Sci. China-Earth Sci. 2019, 62, 1461–1472. [Google Scholar] [CrossRef]
  16. Gong, L.; Jin, C.L. Fuzzy comprehensive evaluation for carrying capacity of regional water resources. Water Resour. Manag. 2009, 23, 2505–2513. [Google Scholar] [CrossRef]
  17. Jia, Y.Z.; Shen, J.Q.; Wang, H. Calculation of water resource value in Nanjing based on a fuzzy mathematical model. Water 2018, 10, 920. [Google Scholar] [CrossRef] [Green Version]
  18. Tian, H.; Liu, L.; Zhang, Z.; Ning, S.; Kang, Z.W.; Wang, T.X. Evaluation on the critical ecological space of the economic belt of Tianshan north slope. Acta Ecol. Sin. 2021, 41, 401–414. (In Chinese) [Google Scholar]
  19. Wu, Y.; Ma, Z.Y.; Li, X.; Sun, L.; Sun, S.; Jia, R. Assessment of water resources carrying capacity based on fuzzy comprehensive evaluation—Case study of Jinan, China. Water Supply 2021, 21, 513–524. [Google Scholar] [CrossRef]
  20. Wu, X.L.; Hu, F. Analysis of ecological carrying capacity using a fuzzy comprehensive evaluation method. Ecol. Indic. 2020, 113, 106243. [Google Scholar] [CrossRef]
  21. Zhang, J.D.; Fu, J.T.; Liu, C.Y.; Qu, Z.; Li, Y.; Li, F.; Yang, Z.; Jiang, L. Evaluating water resource assets based on fuzzy comprehensive evaluation model: A case study of Wuhan city, China. Sustainability 2019, 11, 4627. [Google Scholar] [CrossRef] [Green Version]
  22. Wang, Y.; Shi, R.; Qiao, C. Evaluation of water resources carrying capacity based on fuzzy comprehensive evaluation method in northern slope economic belt of Tianshan mountains. Bull. Soil Water Conserv. 2018, 38, 206–212. (In Chinese) [Google Scholar] [CrossRef]
  23. Zhang, Q.; Li, S.; Xia, H. A study on water resources carrying capacity of three provinces in northeast China based on fuzzy comprehensive evaluation model. Bull. Soil Water Conserv. 2019, 39, 179–188. (In Chinese) [Google Scholar] [CrossRef]
  24. Yin, J.J.; Cui, Y.L.; Liu, F.P. Study on water resources carrying capacity in Ganfu plain irrigation district based on fuzzy comprehensive evaluation. Water Sav. Irrig. 2016, 140, 131–134. [Google Scholar]
  25. An, Q.; Wei, C.; He, H.; Cui, Y.; Nie, Q. Evaluation of water resources carrying capacity of central plains urban agglomeration in Henan province based on fuzzy comprehensive evaluation method. Water Sav. Irrig. 2019, 12, 65–71. (In Chinese) [Google Scholar]
  26. Gao, C.; Mei, Y.D.; Sun-Yun, L.V.; Wang, Y.; Yuan, J.-B. Assessment and prediction of water resources carrying capacity based on AHP-fuzzy method: A case study on Hanjiang river basin. J. Tangtze River Entific Res. Inst. 2014, 31, 21–28. [Google Scholar] [CrossRef]
  27. Ren, C.F.; Li, Z.H.; Zhang, H.B. Integrated multi-objective stochastic fuzzy programming and ahp method for agricultural water and land optimization allocation under multiple uncertainties. J. Clean. Prod. 2019, 210, 12–24. [Google Scholar] [CrossRef]
  28. Wang, H.Y.; Liu, C.Y.; Zhao, Z.H.; Zhang, J.; Li, Z.; Li, F.; Liu, M. Efficiency evaluation of an internet plus university student affairs system based on fuzzy theory and the analytic hierarchy process. J. Intell. Fuzzy Syst. 2016, 31, 3121–3130. [Google Scholar] [CrossRef]
  29. Dai, M.; Wang, L.; Wei, X. Spatial Difference of water resources carrying capacity of Guangxi using fuzzy comprehensive evaluation model based on entropy weight method. Res. Soil Water Conserv. 2016, 23, 193–199. (In Chinese) [Google Scholar] [CrossRef]
  30. Wang, T.; Chen, J.S.; Li, L. Entropy analysis of stable isotopes in precipitation: Tracing the monsoon systems in China. Sci. Rep. 2016, 6, 30389. [Google Scholar] [CrossRef] [Green Version]
  31. Wang, X.; Pan, H.J. Fuzzy Comprehensive evaluation of water quality management information system. Adv. Mater. Res. 2014, 1044, 486–489. [Google Scholar] [CrossRef]
  32. Ge, Y.X.; Wu, J.; Zhang, D.S.; Jia, R.; Yang, H. Uncertain analysis of fuzzy evaluation model for water resources carrying capacity: A case study in Zanhuang county, north China plain. Water 2021, 13, 3804. [Google Scholar] [CrossRef]
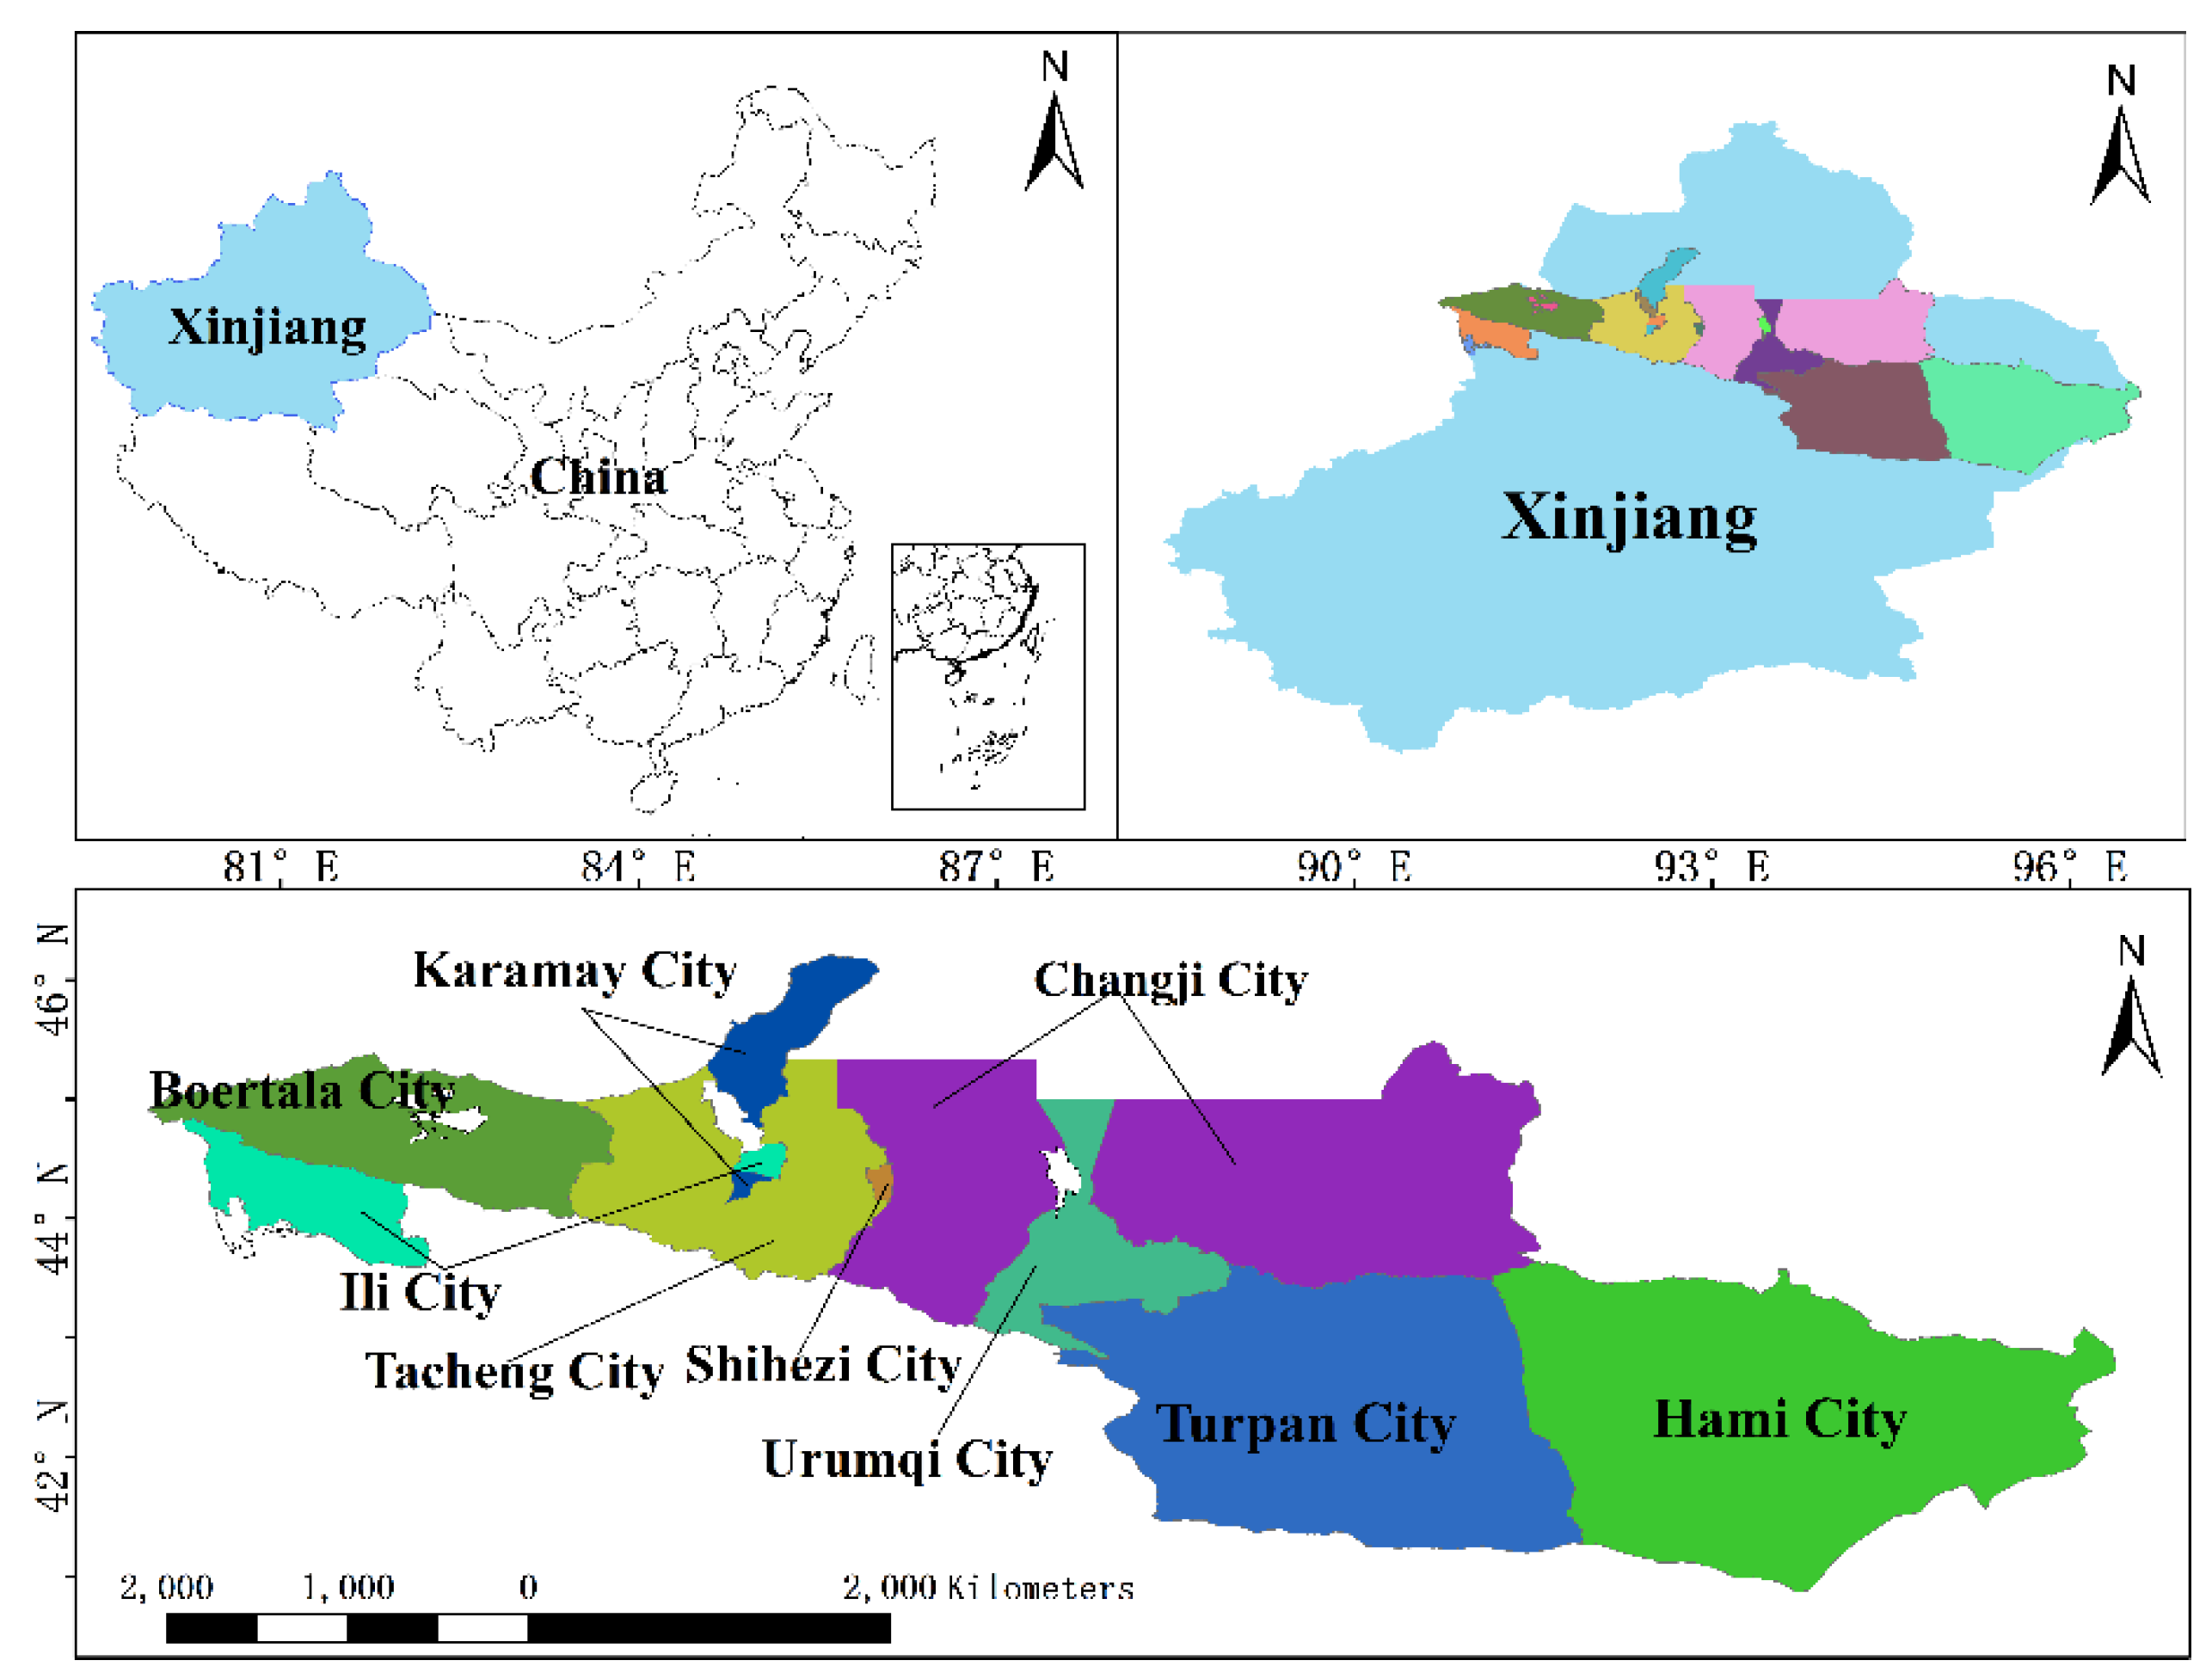
Figure 1. Map showing the location of Xinjiang in China, the study area in Xinjiang, and the cities constituting the study area.
Sustainability 14 01905 g001
Figure 2. Plots showing changes in the population, GDP, total water resources, and per capita water resources for cities on the north slope of the Tianshan Mountains from 2009 to 2019.
Sustainability 14 01905 g002
Figure 3. Framework of the evaluation index system used for the assessment of the urban WRCC on the north slope of the Tianshan Mountains. (In the figure, A represents the target layer, and B represents the four subsystems in the criterion layer. Indicators were designated C1–C15 and are arranged into four subsystems and represented by the bright blue boxes.).
Sustainability 14 01905 g003
Figure 4. Plot showing weights for indexes that affect the evaluation of the water resources carrying capacity.
Sustainability 14 01905 g004
Figure 5. Plot displaying the membership degree (evaluation) matrix R of each grade for cities on the north slope of Tianshan Mountains. (r1, r2 and r3 in the figure are the membership values corresponding to the three level).
Sustainability 14 01905 g005
Figure 6. Plot displaying the membership distribution of each grade utilized for evaluation of the water resources carrying capacity. (In the figure, v1-v3 indicate that the water resources carrying capacity is attributed to a single evaluation value of each level).
Sustainability 14 01905 g006
Figure 7. Plot showing scores for cities for each subsystem influencing the urban WRCC on the north slope of the Tianshan Mountains.
Sustainability 14 01905 g007
Figure 8. Plot showing components of scores for the WRCC of cities on the north slope of the Tianshan Mountains.
Sustainability 14 01905 g008
Figure 9. Map showing a comparison of the urban WRCC in 2018 for cities on the north slope of Tianshan Mountains.
Sustainability 14 01905 g009
Table 1. Data utilized for grading of the evaluation indexes for the water resources carrying capacity.
Criterion LayerIndex Layer v 1 v 2 v 3
water resources subsystem
B 1
per capita water resources>4000500–4000<500
annual precipitation>450300–450<300
development and utilization rate of water resources<3030–80>80
water production modulus>4510–45<10
water supply modulus<55–7>7
social subsystem
B 2
population density<2525–100>100
natural population growth rate<0.80.8–1.6>1.6
urbanization rate>8040–80<40
domestic water quota<7070–130>130
economic subsystem
B 3
GDP growth>82–8<2
per capita GDP>72–7<2
water consumption per 10,000 yuan GDP<200200–300>300
proportion of water for primary industry<4545–75>75
ecosystem subsystem
B 4
water consumption rate of ecological environment>52–5<2
forest coverage>3010–30<10
Table 2. Data for the evaluation of the urban WRCC on the north slope of the Tianshan Mountains.
Region Name v 1 v 2 v 3 Comprehensive   Score   a
Ili0.31060.38950.30090.5049
Boertala0.17460.61680.20860.4847
Urumqi0.2368 0.45670.30640.4687
Tacheng0.26280.39450.34280.4641
Changji0.20160.43730.36110.4282
Hami0.22170.37550.40280.4185
Karamay0.15760.47250.3700.4045
Shihezi0.1380.50970.35230.4036
Turpan0.15250.3500.49690.3447
Publisher’s Note: MDPI stays neutral with regard to jurisdictional claims in published maps and institutional affiliations.