Article

Fresh Air–Natural Microclimate Comfort Index: A New Tourism Climate Index Applied in Chinese Scenic Spots

1
Economics and Management College, Minjiang University, Fuzhou 350108, China
2
Fujian Meteorological Service Center, Fuzhou 350001, China
3
School of Economics and Management, Beijing University of Posts and Telecommunications, Beijing 100876, China
4
Department of Geography, Minjiang University, Fuzhou 350108, China
*
Authors to whom correspondence should be addressed.
Sustainability 2022, 14(3), 1911; https://doi.org/10.3390/su14031911
Submission received: 4 December 2021 / Revised: 27 January 2022 / Accepted: 30 January 2022 / Published: 8 February 2022
(This article belongs to the Special Issue Sustainability with Changing Climate and Extremes)

Abstract

:
Severe air pollution in China has caused significant tourism transformation for pursuing fresh air in microclimate tourism markets. Contemporary practices simply measure the air freshness of destinations and scenic spots using a single index, i.e., primarily negative oxygen ions (O2). This index cannot comprehensively reveal scenic spots’ air freshness degree and determine the dynamic interactions between air freshness and scenic spots’ tourism development, thus inducing an illusion of air freshness for the target scenic spots. Meanwhile, the current fresh air index primarily ignores connections with the microclimate index of scenic spots and cannot provide a multidimensional index for scenic spots to take advantage of both air and microclimate resources for diverse tourism products and service production. Therefore, this study proposes a multidimensional index, the fresh air–natural microclimate comfort index (FAI-NMCI), connecting the fresh air index with the natural microclimate comfort index of scenic spots together from transdisciplinary and multidisciplinary perspectives. This study utilizes FAI-NMCI to measure four scenic spots of Fujian Province, and reveals in-depth results of scenic spots’ air freshness and natural microclimate comfort degree together. The results demonstrate that the four scenic spots in Fujian province of China had different levels of air freshness degree and natural microclimate comfort degree in 2018. The natural scenic spots were mostly distributed in Healing Fresh, Very Fresh, and Super Fresh levels of FAI with the most comfortable and comfortable levels of NMCI. The cultural scenic spots were mostly distributed in Relatively Fresh and Healing Fresh levels of FAI with the most comfortable and comfortable levels of NMCI. Meanwhile, the FAI-NMCI of natural and cultural scenic spots also had significant differences within 24 Jieqi, which will promote dynamic and creative utilization of those resources in microclimate tourism development.

1. Introduction

Air pollution influences tourists’ and residents’ (potential tourists’) health, which will directly or indirectly affect demand in the tourism market [1]. Exposure to air-polluted environments leads to various health problems [2], such as respiratory infections [3,4], asthma [5,6], stroke, and even lung cancers [7]. Additionally, air pollution, especially fog and haze pollution, also impacts the psychological health [8,9] and mental disorders [10] of tourists and potential tourists, which directly increases healthcare expenditures [11], health costs [12], and other socioeconomic burdens [13,14] and socioeconomic costs [15] for tourists and local residents. Meanwhile, the factors of natural microclimate and the comfort of the natural microclimate as a whole also influence tourists’ decision-making for specific destinations or scenic spots, impacting tourists’ behavior and the constant and dynamic tourist flow [16] from one region to another because of dynamic natural microclimate changes [17,18]. Under an air pollution background, the increasing fresh air demand of tourists in China has attracted tourists to destinations with fresh air to experience comfort in natural microclimates. Fresh air and natural microclimate together provide friendly, healthy, and comfort natural tourist attractions in the contemporary Chinese tourism market. Air freshness and microclimate comfort degree together as vital environmental information have significantly influenced tourists, destination and scenic spot management, as well as tourism market development, which has seldom been explored by contemporary research and practice.
Actually, the most popular index for measuring air freshness and air quality is the air quality index (AQI), which utilizes primary air pollutant components such as PM2.5, PM10, SO2, NO2, CO, or O3 to measure air quality. AQI studies have developed according to specific research purposes or considering practical utilization; for example, many studies have explored relationships between the AQI and years of life lost [19] and the aggregated effects of internal indicators at a short-term scale [20]. However, AQI reveals the degree of air pollution situations of cities or some air-polluted areas, such as factories or streets, rather than scenic spots. It also neglects the degree of air freshness through adding indicators of O2 to measure the health and beneficial degree of fresh air [21]. Moreover, current studies of the fresh air index primarily utilize singular indicators, only O2, to measure air freshness, without considering air pollutants’ influence on the comprehensive air freshness degree [22].
For the natural microclimate of scenic spots, many studies primarily utilize one index or two indexes to analyze and reveal the natural microclimate comfort degree, which can mainly be summarized as the temperature-humidity index (THI) [23], wind-cold index (WCI) [24], index of cloth loading (ICI) [25], and human comfort index (HCI) [26]. However, it is vital to note that current indexes do not consider rain factors to measure the influence of rain volume on the comfort degree, which provides an opportunity to establish a rain comfort index and construct a new comprehensive index including all primary factors of the natural microclimate of scenic spots. Additionally, the natural microclimate comfort degree of scenic spots has seldom been integrated with the fresh air index in contemporary studies due to a lack of comprehensive air freshness data and natural microclimate factor data at the same time, along with the existence of some research barriers.
Integration embraces the power to reveal the actual distribution of real scenic spot air freshness and natural microclimate resources. Based on individual economic development trends of different places, it is essential to point out that the air freshness degree of scenic spots needs to be classified according to WHO standards [27] and actual situations together, which calls for stricter standards of fresh air, with gradual improvement in standards. For more in-depth exploration and development of scenic spots with fresh air and natural microclimate tourism resources, it is indispensable to classify different levels or add more actual levels of air freshness degree and natural microclimate degree in future research because the current classification needs to be developed based on more accurate research.
For sustainable development of destinations and scenic spots with fresh air and natural microclimate comfort resources, this paper establishes a fresh air index (FAI) based on comprehensive identification of fresh air components and the index construction methods and experiences of AQI, constructs natural and cultural FAI according to the different threshold standards, and creatively constructs a natural microclimate comfort index of scenic spots through taking advantage of the current index and adding a rain comfort index, connecting the fresh air index (FAI) and the natural microclimate comfort index (NMCI) together to assess the air freshness degree of destinations and the natural microclimate comfort degree. For in-depth air and microclimate resource distributions in the tourism market, this paper proposes an improved fresh air–natural microclimate comfort index to systematically analyze fresh air resources and natural microclimate comfort resources together in Chinese scenic spots by classifying seven levels of the fresh air index (FAI) and seven levels of the natural microclimate comfort index (NMCI). Based on the comparative advantages of embracing relatively fresher air, this paper takes four scenic spots of Fujian Province, China, as an example and analyzes the natural and cultural scenic spots’ fresh air–natural microclimate comfort degree to promote the sustainable utilization and development of fresh air and natural microclimate comfort resources in the microclimate tourism market.

2. Materials and Methods

This study utilizes the comprehensive index construction method to construct one fresh air–natural microclimate comfort index (FAI-NMCI), then creatively applies this index to four scenic spots of Fujian Province to reveal the actual air freshness and microclimate comfortable degree at the same time.

2.1. Methodology of Fresh Air–Natural Microclimate Comfort Index Construction and Evaluation

2.1.1. Definition and Essence of Fresh Air

Different from polluted air, fresh air not only contains basic air components and air structures, but also contains more beneficial air components, such as negative oxygen ions (O2), which are also treated as “air vitamins” for promoting human health [28,29] and include no harmful, or less harmful air components, such as PM2.5, PM10, SO2, NO2, CO, or O3, that are harmless standards. Therefore, fresh air has beneficial and no harmful characteristics and can be simply defined and summarized as follows:
Fresh air (FA) = beneficial air components (BAC) + no harmful air components (NAC)
According to the aforementioned analysis, fresh air could be summarized as having health essences from protecting and promoting human health perspectives, which could be represented by a higher concentration of healthy air components and a lower concentration of polluted air components.
In this study, negative oxygen ions (O2) were adopted to represent beneficial air components and were selected to reveal general nonharmful air components that severely caused air pollution in China. SO2, NO2, CO, or O3 was chosen to represent local special air contaminants in different regions of China. Therefore, to illustrate fresh air in specific scenic spots of China, this study constructed a fresh air structure with selected air components, which can be summarized as follows:
Fresh Air = Beneficial Air Components (O2) + No Harmful Air Components {PM2.5+PM10+(SO2, NO2, CO or O3)}

2.1.2. Improved Fresh Air Index of Natural and Cultural Scenic Spots

We compared the contemporary single-factor fresh air index of Fujian, Hubei, and Zhejiang provinces of China, utilizing only negative oxygen ion (O2) degree and PM2.5, to assess scenic spots’ air freshness (Table 1). The Meteorological Service Center of Fujian Province, China, and the authors of this paper have creatively proposed a comprehensive fresh air index by considering both the healthy air component factor negative oxygen ion (O2) and the low degrees of PM2.5 and PM10 as general polluted air components that exist in different regions of China, and NO2, SO2, CO, and O3 as particular air pollutant factors in specific regions of China, determined by local geological and economic structure features.
The subindices of the beneficial air component IFAIB are expressed as the ratio of the negative oxygen ion (O2) concentration to the 24 h average standard O2 level (1000 ions/cm3) (Table 2) recommended by the World Health Organization Air Quality Guidelines for fresh air [30,31,32]. That is, IFAIB can be written as:
IFAI B = C B S B
where IFAIB represents the subindices of the beneficial air component in scenic spots, CB represents the negative oxygen ion (O2) concentration of scenic spots, and SB represents the 24 h average standard O2 level (1000 ions/cm3) of scenic spots.
The subindex IFAIpi of nonharmful air components is expressed as the negative ratio of air pollutant concentrations, Cpi, to the recommended short-term Ambient Air Quality Standards of China (GB3095-2012) [33], Spi. That is, IFAIpi can be written as:
IFAI pi = C pi S pi
where IFAIpi represents the subindices of no harmful air components in scenic spots, Cpi represents air pollutant concentrations of scenic spots, and Spi represents the recommended short-term air pollutant concentration standards of scenic spots.
The short-term Ambient Air Quality Standards of China [34] used in natural scenic spots are defined as concentrations with average times of 24 h means of 50 μg/m3 for PM10, 35 μg/m3 for PM2.5, 50 μg/m3 for SO2, 80 μg/m3 for NO2, and 4 mg/m3 for CO, and running an 8 h mean of 100 μg/m3 for O3. The short-term Ambient Air Quality Standards of China used in cultural scenic spots are defined as concentrations with average times of 24 h means of 150 μg/m3 for PM10, 75 μg/m3 for PM2.5, 150 μg/m3 for SO2, 80 μg/m3 for NO2, and 4 mg/m3 for CO, and running an 8 h mean of 160 μg/m3 for O3. The 24 h average standard O2 level recommended by the World Health Organization Air Quality Guidelines for fresh air is 1000 ions/cm3 in category I and II regions (Table 2).
The natural and cultural fresh air index is the sum of IFAIB and the sum of subindices of no harmful air components, IFAIPi, which can be written as:
FAI = IFAI B + IFAI pi = IFAI j
where FAI refers to the fresh air index, IFAIB refers to subindices of beneficial air components, ∑IFAIpi indicates the sum of subindices of no harmful air components, and ∑IFAIj indicates the sum of subindices of fresh air components j.
The classifications of natural and cultural FAIs of scenic spots and their levels were explored in this paper. According to Table 1, the FAI of natural scenic spots utilizes category I region standards to further explore different threshold levels, while the FAI of cultural scenic spots utilizes category II region standards (Table 2).
According to the China Industrial Technical Regulation on Grade of Air Negative (Oxygen) Ion Concentration (QX/T 380-2017) [32] and Local Technical Regulation on Grade of Air Negative (Oxygen) Ion Concentration of Hubei Province (DB42/T 1198-2016) [30], the concentration degree of negative oxygen ion (O2) increase per 500 ions/cm3 will enhance air freshness and have a beneficial influence on human health.
According to the World Health Organization (WHO) air freshness grading standard of the negative oxygen ion index, when 1800 ≤ O2 ≤ 2100, O2 has natural healing power, and when O2 > 2100, it has therapeutic and rehabilitation effects [35]. Therefore, on the basis of a higher standard than the WHO standard for negative oxygen ion therapy, this paper proposes that when 2500 ≤ O2 ≤ 3000, PM2.5, PM10, O3, NO2, SO2, and CO decreased in proportion, and the air freshness degree is at the Healing Freshness Level, the resulting air freshness level of the scenic spot reaches the healing standard. Then, when 3000 ≤ O2 ≤ 3500 and when O2 > 3500, the air could have a more active influence on human health, which could further promote the air freshness degree to very fresh and super fresh levels.
According to the World Health Organization Air Quality Guideline (WHO AQG), a PM2.5 and PM10 decrease of 5 μg/m3 will reduce mortality risk by approximately 3% [31], an O3 decrease of 5 μg/m3 will reduce daily mortality by approximately 0.12–0.25% [31], an SO2 decrease of 5 μg/m3 will reduce daily mortality by approximately 0.09–0.29% [31], a CO decrease of 0.5 mg/m3 will also reduce mortality risk or health risk [31], and an NO2 decrease of 5 μg/m3 will reduce daily mortality by approximately 0.29% [36].
This paper further classifies the FAI threshold range of natural and cultural scenic spots according to the different standards of natural and cultural scenic spot air quality standards in China and the WHO standards, which are summarized in Table 2 and Table 3, respectively. The air freshness degree of natural and cultural scenic spots could be classified into seven levels: Not Fresh, General, Fresh, Relatively Fresh, Healing Fresh, Very Fresh, and Super Fresh (Table 3 and Table 4).

2.1.3. Improved Natural Microclimate Comfort Index

It is obvious that those indices usually assess two or three factors of natural microclimate, such as THI analyzes temperature and humidity factors, WCI analyzes wind and temperature factors, ICI analyzes wind, temperature, and solar radiation factors, and HCI analyzes temperature, humidity, and wind factors. Therefore, it is a trend in Chinese tourism research to utilize the indices mentioned above to comprehensively analyze the degree of natural microclimate comfort in tourists’ destinations [37,38,39,40]. However, there is also a lack of consideration of the influence of precipitation factors on the degree of natural microclimate comfort in contemporary Chinese tourism research. According to climate comfort analysis of scenic spots, when precipitation < 1.0 mm, there is nearly no influence on tourists. When precipitation < 3.0 mm, it is within tourists’ precipitation comfort range, which will provide a rainfall microclimate for tourists to experience and appreciate rainfall scenery in scenic spots, while when precipitation > 10.0 mm, tourism will decrease dramatically because large volumes of rainfall make tourists feel uncomfortable and cause them to stop tourism activities and leave scenic spots [41].
Therefore, this paper proposes a rain comfort index (RCI) to assess the comfort degree to which different volumes of rainfall influence tourists in scenic spots. The RCI refers to the influence of rainfall on the extent of human comfort in a natural microclimate environment. According to the Chinese grade of precipitation standard (GB/T 28592-2012) and considering tourism activities usually within a 12 h range, this paper chose a 12 h precipitation standard to measure rainfall levels; that is, drizzle < 0.1 mm, light rain 0.1~4.9 mm, moderate rain 5.0~14.9 mm, and heavy rain 15.0~29.9 mm. Based on the above analysis, this paper defined the comfort range of precipitation as between 0.1 (drizzle) and 10.00 mm (moderate rain) for tourists in scenic spots and then constructed the RCI as follows:
RCI = R / R 0
where RCI refers to the rain comfort index, R refers to actual rainfall, and R0 refers to standard rainfall, that is equal to 0.1 mm (drizzle) in this paper. Then, seven levels of RCI of different comfort degrees were classified, which are summarized in Table 5.
By considering all factors of the natural microclimate, this paper proposes the natural microclimate index (NMCI):
NMCI = THI + WCI + ICI + HCI + RCI 5
By assessing each subindex of the NMCI (THI, WCI, ICI, HCI, RCI) and defining them into their own comfort levels, the results are summarized in Table 6. For subindices of NMCI, such as THI, WCI, ICI, HCI, and RCI, which have their own levels of standards and classification patterns, it is essential to standardize each subindex of NMCI for further calculation of NMCI. This paper summed up and calculated their average comfort levels through reclassifying each subindex of NMCI into seven levels (d, c, b, A, B, C, D) and assigning values (that is, d = 2, c = 3, b = 4, A = 5, B = 6, C = 7, D = 8). Then, the average THI + WCI + ICI + HCI + RCI/5 value was calculated to determine the final levels of NMCI in Table 7.
When 5 ≤ NMCI < 6, the NMCI is at the most comfortable level; when 4 ≤ NMCI < 5, the NMCI is at the comfortable (cool comfort) level; when 6 ≤ NMCI < 7, the NMCI is at the comfortable (warm comfort) level; when 3 ≤ NMCI < 4, the NMCI is at the less comfortable (cold less comfortable) level; when 7 ≤ NMCI < 8, the NMCI is at the less comfortable (hot less comfortable) level; when 2 ≤ NMCI < 3, the NMCI is at the uncomfortable (very cold uncomfortable) level; when NMCI > 8, the NMCI is at the uncomfortable (very hot uncomfortable) level (Table 7).

2.1.4. Combined Fresh Air–Natural Microclimate Comfort Index
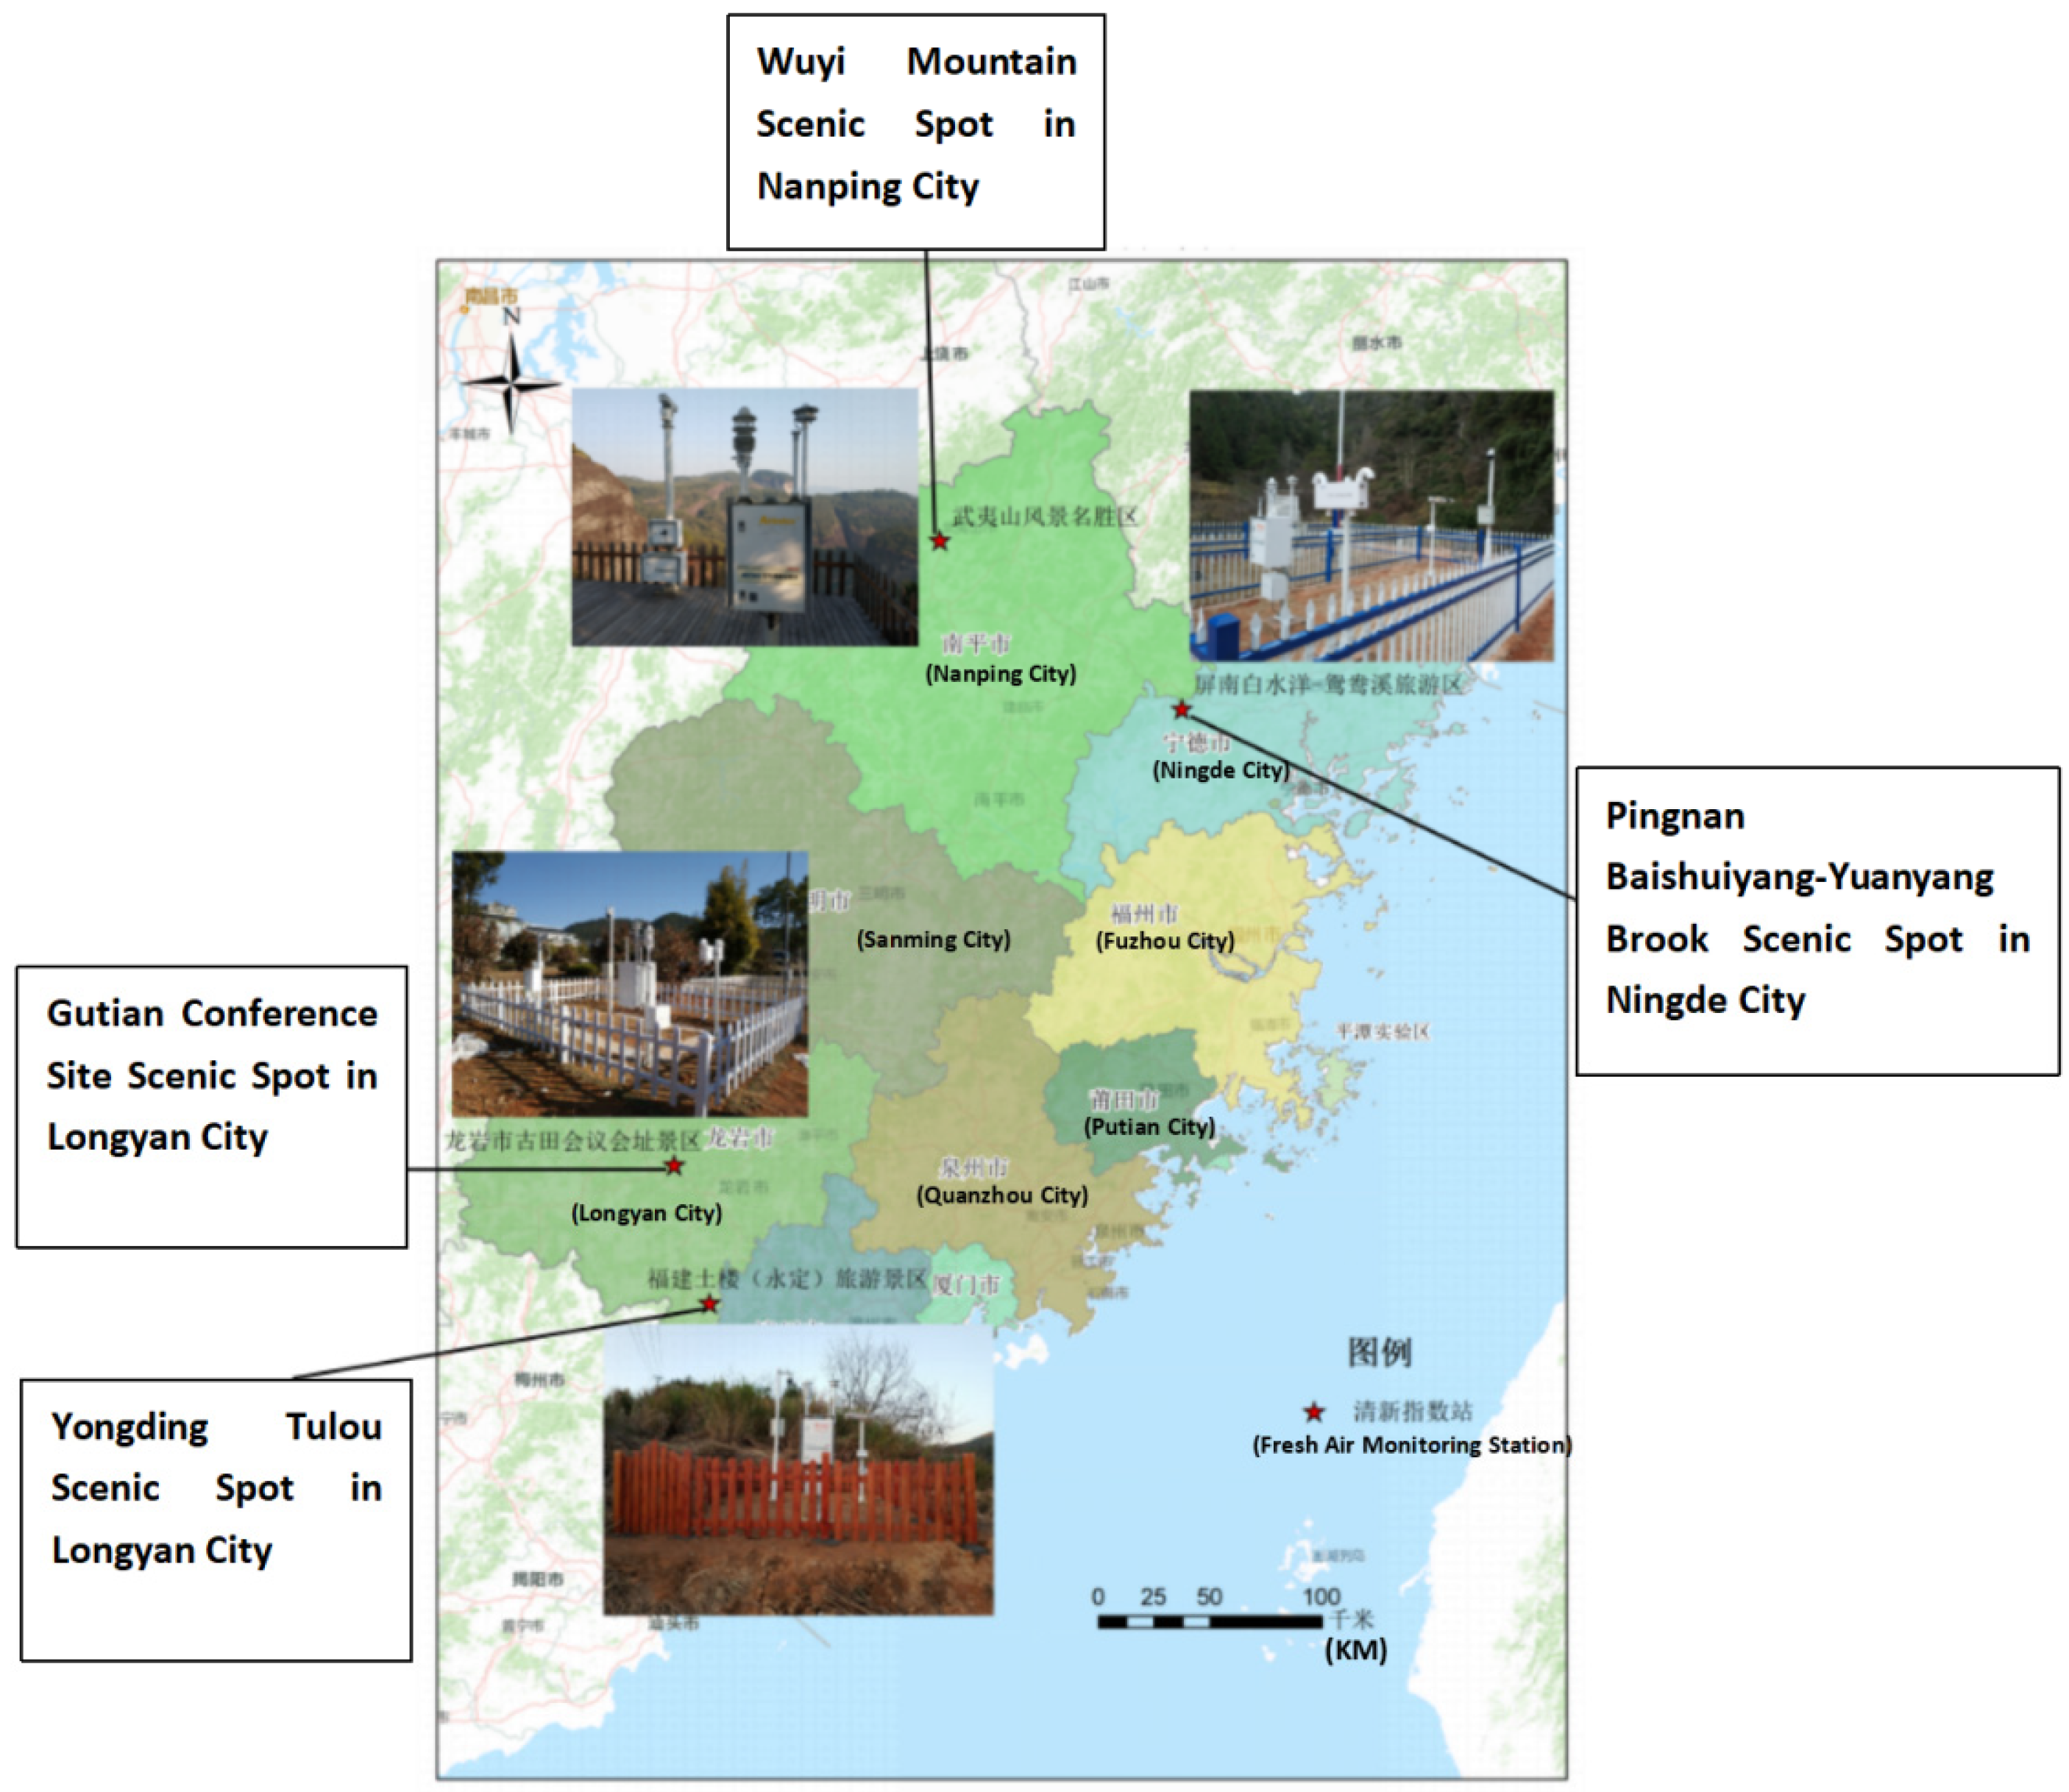
After the construction of the fresh air index (FAI) and the natural microclimate comfort index (NMCI), this paper comprehensively constructed a parallel fresh air–natural microclimate index for assessing the air freshness degree and natural microclimate comfort degree of specific scenic spots in China. This approach utilizes the fresh air index and natural microclimate comfort index to analyze scenic spots and then connects them together to explore fresh air and natural microclimate tourism resources in depth (Table 8).

2.2. Data Source

This study chose four fresh air index monitoring stations within four scenic spots of Fujian Province, China. That is, the Pingnan Baishuiyang-Yuanyang Brook Scenic Spot in Ningde City, the Gutian Conference Site Scenic Spot in Longyan City, the Yongding earth building (Tulou) Scenic Spot in Longyan City, and the Wuyi Mountain Scenic Spot in Nanping City (Figure 1 and Table 9).
Pingnan Baishuiyang-Yuanyang Brook Scenic Spot is a natural scenic spot. It has a total area of 66 square kilometers, integrating streams, peaks, rocks, waterfalls, caves, lakes, and other landscapes. There are more than 10 kinds of national protected animals, such as Silver Pheasant, Python, and Pangolin, which are found in the “Natural Animal and Botanical Garden” (Figure 1 and Table 9).
Gutian Conference Site Scenic Spot is a cultural scenic spot. It is located in the south of Meihua Mountain, with a planned area of 7.6 square kilometers. In October 2015, it was successfully promoted to a national 5A tourist attraction and won the honorary titles of “National Top Ten Excellent Patriotism Education Bases” and “National Red Tourism Classic Scenic Spots” (Figure 1 and Table 9).
Yongding earth building (Tulou) Scenic Spot is a cultural scenic spot. It is a unique magical mountain residential building. It has a long history, unique style, large scale, and exquisite structure. In July 2008, it was successfully listed in the world heritage list (Figure 1 and Table 9).
Wuyi Mount Scenic Spot is a natural scenic spot. It is located at the junction of Jiangxi and northwest Fujian Provinces and at the southeast foot of the north section of Wuyi Mountain vein, with a total area of 999.75 square kilometers. It is a famous scenic spot and summer resort in China (Figure 1 and Table 9).
Since the PM2.5, PM10, and O3 standards in natural and cultural scenic spots have different regulations in practice, this paper attempts to establish natural and cultural scenic spot FAIs to distinguish air freshness evaluations. In addition, natural and cultural scenic spots have different environmental backgrounds and social interaction intensities, which will significantly influence the air freshness degree of scenic spots. Meanwhile, for tourists, the fresher the air in scenic spots, the better the traveling experience, so they could utilize the FAI of natural scenic spots to measure all scenic spots in practice. For destination and scenic spot management, it is vital to distinguish the difference between natural and cultural scenic spots and to evaluate the related and compared freshness within natural scenic spots and cultural scenic spot categories. This paper chose the Wuyi Mountain scenic spot and Baishuiyang scenic spot as natural scenic spots of Fujian Province and the Yongding Tulou scenic spot and Gutian Conference Site scenic spot as cultural scenic spots of Fujian Province.
According to local air characteristics, O3 is a special air component that influences the local air freshness of Fujian Province. Therefore, data on four indicators, O2, PM2.5, PM10, and O3, from 1 January to 31 December 2018 were collected. Temperature, relative humidity, wind speed, solar radiation, and precipitation data of the four scenic spots were collected from 1 January to 31 December 2018. Therefore, this paper utilized negative oxygen ion (O2), PM2.5, PM10, and O3 data for each day of 2018 of the four scenic spots to calculate their fresh air index (FAI). Then, temperature, relative humidity, wind speed, solar radiation, and precipitation data were utilized on each day of 2018 to calculate the natural microclimate comfort index (NMCI) of the four scenic spots.
The data for natural microclimate factors were collected from the National Meteorological Information Center of China (http://data.cma.cn/, accessed on 1 February 2022) and provided by the Fujian Meteorological Service Center, China (http://fj.cma.gov.cn/, accessed on 1 January 2022), and the data for fresh air index subindices were provided by the Fujian Meteorological Service Center, China (http://fj.cma.gov.cn/, accessed on 1 January 2022). The data were generated from the four scenic spots’ microclimate and air freshness index monitoring equipment. More precisely, one set of negative oxygen ion monitoring stations (model HuaTron FR500) and one set of air index stations (model HuaTron AEI365) were built in the above four scenic spots (Figure 1 and Table 8).

3. Results

3.1. FAI-NMCI of Natural Scenic Spots

In the Wuyi Mountain scenic spot, the FAI levels were mainly distributed in the upper levels; for example, the Super Fresh level was approximately 164 days (accounting for 47%), the Very Fresh level was approximately 67 days (accounting for 19%), and the Healing Fresh level was approximately 56 days (accounting for 16%), which was approximately 287 days in 2018, accounting for almost 82% (Figure 2A). Meanwhile, the NMCI primarily included three levels. The comfortable level was approximately 246 days (accounting for 67%), which also embraced the cool comfort level (168 days, 46%) and the warm comfort level (78 days, 21%). The most comfortable level was approximately 116 days (accounting for 32%), while the less comfortable level was approximately 3 days (accounting for only 1%) (Figure 2B). Therefore, in the Wuyi Mountain scenic spot, the FAI-NMCI was mainly distributed within the upper fresh-comfort range, which was approximately 246 days of upper freshness levels and 362 days of comfort in 2018 (Figure 2A,B).
In the Baishuiyang scenic spot, the FAI levels were distributed from the Not Fresh level to the Super Fresh level. More precisely, the Fresh level was approximately 86 days (accounting for 25%), the Relatively Fresh level was approximately 74 days (accounting for 21%), the Super Fresh level was approximately 51 days (accounting for 15%), the Healing Fresh level was approximately 40 days (accounting for 11%), and the Very Fresh level was approximately 36 days (accounting for 10%), which indicated the dynamic fluctuation of FAI in the Baishuiyang scenic spot, and the FAI reached or exceeded the Fresh level for approximately 287 days, accounting for approximately 78.63% (Figure 2C). At the same time, the NMCI was mainly distributed at the comfortable level (185 days, 51%), among which the cool comfort level was 117 days (accounting for 32%) and the warm comfort level was 68 days (accounting for 19%). Meanwhile, the most comfortable level was also in a large proportion (45%) and was approximately 165 days. The less comfortable level was approximately 15 days and accounted for 4% (Figure 2D). Therefore, in Baishuiyang scenic spot, the FAI-NMCI was mainly distributed within the middle fresh-comfort range, which was approximately 160 days of middle freshness and 185 days of comfort in 2018 (Figure 2C,D).
In Wuyi Mountain scenic spot, the FAI mainly fluctuated between −2.69 and 32.7, that is, it fluctuated between Not Fresh and Super Fresh levels. The NMCI mainly fluctuated between 3.6 and 7.2, that is, it fluctuated between cold less comfortable and hot less comfortable levels. Within the whole year of 2018, from January to April, the NMCI gradually increased from 4 to 5 (in the cool comfort level), while the FAI was mostly more than 5 (in the Super Fresh level) in the second half of January, decreased dramatically to −1.87 (in General level) in early February, then slightly increased to Relatively Fresh, Healing Fresh, and Very Fresh levels, and some Super Fresh levels, which also fluctuated in this period. From May to the first half of July, the NMCI increased from 5 to 6 and 6 to 7, which generally entered into the most comfortable level and increased into the warm comfort level in this period, which fluctuated mainly within these two levels; meanwhile, the FAI mainly fluctuated between Fresh and Super Fresh levels and reached the highest FAI of approximately 3.7 in June, which was more than the threshold value of Super Fresh (FAI > 2) by approximately 16.35 times. From the second half of July to the first half of September, the NMCI remained at the warm comfort level, while the FAI decreased gradually from more than 5 to lower than 3, although it was also mainly within the Super Fresh level. Then, the FAI increased to more than 5 in the second half of August and increased to more than 20 in the first half of September. From September to October, the NMCI decreased gradually from the warm comfort level to the most comfortable level, while the FAI also decreased to lower levels, such as the Fresh level and Relatively Fresh level, although some days reached the Healing Fresh level and Very Fresh level. When entering November and December, the NMCI decreased from 5 to lower than 4, which is a decrease from the cool comfort level to the cold less comfortable level, while the FAI increased gradually to the Super Fresh level in the middle of November and then decreased dramatically in the second half of November and the first half of December. When the NMCI decreased to the cold less comfortable level in December, the FAI fluctuated, while most fluctuated between the Healing Fresh and Super Fresh levels (Figure 3A).
In Baishuiyang scenic spot, the FAI mainly fluctuated between −2.83 and 34.27, which fluctuated between the Not Fresh level and Super Fresh levels, while the NMCI mainly fluctuated between 3.4 and 7.2, which fluctuated between cold less comfortable and hot less comfortable levels. Within the whole year of 2018, from January to early June, the NMCI gradually increased from 4 to nearly 7, namely, it increased from cool comfort to the most comfortable level and then to the warm comfort level, while the FAI was mostly below 0, namely, it fluctuated between the Not Fresh level and the Relatively Fresh level. From the middle of June to August, the NMCI fluctuated and gradually increased from 6 to more than 7, that is, from the warm comfort level to the hot less comfortable level; meanwhile, the FAI increased from 0 to between nearly 5 or more than 5 on some days, which mainly fluctuated between the General level and the Super Fresh level. From September to November, the NMCI fluctuated mainly between 6.5 and 5, which indicated that the natural microclimate fluctuated from the warm comfort level to the most comfortable level from early September to late November. The FAI slightly and gradually increased in September and then decreased drastically below 0 from late September to early October, namely, decreased from the Super Fresh level to the Not Fresh or General level, mainly during the National Holiday of China (approximately seven-day long holiday). After the seven days of the National Holiday of China, the FAI increased dramatically and reached the highest level of the year (FAI = 34.27), then fluctuated within the Super Fresh level (mainly between 2 and 14). From late November to December, the NMCI decreased below 5 but higher than 4, namely, at the cool comfort level, and the FAI also decreased to a lower level of the year, which primarily fluctuated between the General level and the Healing Fresh level (Figure 3B).
It is essential to point out that the FAI of the Wuyi Mountain and Baishuiyang scenic spots have some higher FAI values, such as more than 30 or even higher, which is primarily because of the higher O2 levels and the lower PM2.5, PM10, and O3 levels in scenic spots. When scenic spots have a high O2 concentration, it will significantly influence the entire FAI value.
More precisely, within 24 Jieqi of Wuyi Mountain scenic spot and Baishuiyang scenic spot, the FAI-NMCI can be summarized as in Figure 4. For example, it is obvious that in Lesser Cold and Greater Cold Jieqi, both the Wuyi Mountain and Baishuiyang scenic spots were at the cool comfort level, although Wuyi Mountain was at the Super Fresh level and was fresher than Baishuiyang, which was only at the Fresh level. At the start of Spring, the FAI of both Wuyi Mountain and Baishuiyang decreased, which was not because of the decrease in negative oxygen ions (O2) at the two scenic spots but because of the increase in PM2.5 and PM10 due to the large number of tourists and tourism transportation entering those two scenic spots (Figure 4).
From Rain Water to Spring Equinox Jieqi, although the two scenic spots were also within the cool comfort level, the FAI both experienced a drastic increase from the General to the Super Fresh level in Wuyi Mountain and from the Not Fresh to the Relatively Fresh level in Baishuiyang. In Pure Brightness and Grain Rain Jieqi, Baishuiyang entered into the most comfortable level while Wuyi Mountain remained at the cool comfort level. Meanwhile, for more tourist travel to Baishuiyang, the FAI was at a relatively lower level, that is the General level, than Wuyi Mountain (Super Fresh and Healing Fresh level). At the Start of Summer Jieqi, Wuyi Mountain was at the Super Fresh and warm comfort levels, while Baishuiyang was only at the Fresh level and was still within the cool comfort level. In Grain Full Jieqi, Baishuiyang had increased freshness and became warm. In the Grain in Ear Jieqi, Wuyi Mountain entered the most comfortable level and was in a Super Fresh situation (Figure 4).

3.2. FAI-NMCI of Cultural Scenic Spots

In the Yongding Tulou scenic spot, the FAI levels were mainly distributed in Healing Fresh (159 days, 38%) and Relatively Fresh (74 days, 18%), while they were also distributed in Not Fresh (115 days, 27%). The Super Fresh (29 days, 7%), Very Fresh (31 days, 7%), and Fresh (14 days, 3%) levels were in small proportions (Figure 5A).
The NMCI was distributed in the comfort domain, that is, the most comfortable domain (149 days, 41%), and the comfort domain (216 days, 59%), which included the cool comfort domain (133 days, 36%) and the warm comfort domain (83 days, 23%) (Figure 5B). In the Gutian Conference Site scenic spot, the highest levels of FAI were at the Healing Fresh level (166 days, 48%) with a large proportion, and the Relatively Fresh level (146 days, 42%), while the Very Fresh (24 days, 7%) and Fresh (12 days, 3%) levels had a small proportion, and the Super Fresh level was not reached (Figure 5C). Meanwhile, the NMCI included three levels: the most comfortable (110 days, 30%), and the comfort (250 days, 69%), which embraced the cool comfort level (160 days, 44%) and the warm comfort level (90 days, 25%) (Figure 5D).
In the Yongding Tulou scenic spot, the FAI mainly fluctuated between −0.97 and 14.81, which fluctuated between Fresh and Super Fresh levels. The NMCI mainly fluctuated between 3.80 and 6.80, which fluctuated between cold less comfortable and warm comfort levels (Figure 6A). Throughout 2018, the FAI and NMCI of the Yongding Tulou scenic spot experienced dynamic fluctuations. From January to March, the NMCI increased gradually from 3 to above 4, that is from cold less comfortable to the cool comfort level, and the FAI mainly fluctuated between −0.35 and 0.48, that is mainly at the Relatively Fresh level. From late March to the middle of April, the NMCI continued to increase from 4 to above 5, that is from cool comfort to the most comfortable level. Meanwhile, the FAI increased dramatically above 2 and reached the Very Fresh level and fluctuated into the high level of Relatively Fresh. From May to September, the NMCI fluctuated from 5 to above 6, that is from the most comfortable to the warm comfort level, and the FAI mainly fluctuated within the Relatively Fresh level. When entering October, the NMCI decreased from above 6 to below 5, that is from warm comfort to the most comfortable level. The FAI increased drastically and reached the highest level (14.81) of the year, and most of FAI values were higher than 6 in the second half of October, that is it mainly fluctuated at the Very Fresh level. From November to December, the NMCI decreased from above 5 to below 4, that is from the most comfortable to the cold less comfortable level, while the FAI primarily fluctuated within the Relatively Fresh level until in the middle of December, when it increased dramatically to more than 12, namely, in the Very Fresh level, then decreased quickly and fluctuated between the Fresh and Relatively Fresh levels (Figure 6A).
In the Gutian Conference Site scenic spot, the FAI mainly fluctuated between −0.76 and 2.03, that is it fluctuated between Fresh and Super Fresh levels, while the Super Fresh level was lower than the Yongding Tulou scenic spot by approximately 7 times. The NMCI mainly fluctuated between 3.20 and 7.2, that is it fluctuated between cold less comfortable and hot less comfortable levels (Figure 5B). For the first five months of 2018, from January to May, the NMCI increased from more than 4 to more than 6, that is from cool comfort to the most comfortable level, and then to the warm comfort level. The FAI fluctuated between below −0.5 and 1, that is it fluctuated between the Fresh and Healing Fresh levels. From June to August, the NMCI increased from above 6 to above 7, that is from warm comfort to the hot less comfortable level. The FAI was mainly above 0.5 and some days even above 1, that is primarily at the Healing Fresh level. From September to November, the NMCI decreased from above 6 to 5, that is from warm comfort to the most comfortable level, while the FAI mainly fluctuated between 1 and 1.5, that is it fluctuated between Healing Fresh and Very Fresh levels. In December, the NMCI decreased and mainly varied between 4 and 4.2, that is mainly at the cool comfort level, while the FAI also decreased and mainly fluctuated above 0.5 or below 0.5, that is mainly at the Relatively Fresh and Healing Fresh levels (Figure 6B).
More precisely, within 24 Jieqi of the Yongding Tulou scenic spot and Gutian Conference Site scenic spot, the FAI-NMCI could be summarized as in Figure 7 for satisfying tourists’ diverse fresh air–natural microclimate comfort preferences and demands through the provision of proper microclimate tourism products and services in each Jieqi, or different Jieqi with approximately similar air freshness and natural microclimate comfort degrees.

4. Discussion and Conclusions

Comparing FAI-NMCI in natural scenic spots of Fujian province, the Wuyi Mountain scenic spot had more days of upper-level air freshness and natural microclimate comfort degree than Baishuiyang scenic spot, which was mainly distributed within the middle fresh-comfort range. In cultural scenic spots of Fujian province, the Gutian Conference Site scenic spot had more days of middle-level air freshness and natural microclimate comfort degree than Yongding Tulou scenic spot, which had even more days of air freshness at the Not Fresh level.
Comparing fluctuating ranges of FAI of the four scenic spots in Fujian Province, the natural scenic spots had wider FAI fluctuation ranges, which was primarily determined by the higher concentration of negative oxygen ions and lower concentrations of PM2.5, PM10, and O3, while, the cultural scenic spots had relatively shorter FAI fluctuation ranges, which was profoundly influenced by the relatively lower concentration degree of negative oxygen ions and higher concentration degree of PM2.5, PM10, and O3.
Comparing fluctuating ranges of NMCI of four scenic spots in Fujian province, the NMCI mainly fluctuated between 3.20 and 7.2, which indicated that their natural microclimate comfort degree primarily fluctuated between cold less comfortable and hot less comfortable levels, except the Yongding Tulou scenic spot, which fluctuated between cold less comfortable and warm comfort levels.
In short, the four scenic spots in Fujian Province of China had different levels of air freshness degree and natural microclimate comfort degree in 2018. The natural scenic spots were mostly distributed in Healing Fresh, Very Fresh, and Super Fresh levels of FAI, with the most comfortable and comfortable levels of NMCI. The cultural scenic spots were mostly distributed in Relatively Fresh and Healing Fresh levels of FAI, with the most comfortable and comfortable levels of NMCI. Meanwhile, the FAI-NMCI of natural and cultural scenic spots also had significant differences within 24 Jieqi, which will promote dynamic and creative utilization of these resources in microclimate tourism development.
Therefore, the fresh air–natural microclimate of scenic spots has become a vital tourist attraction in the contemporary Chinese tourism market under the background of severe air pollution. Tourists with different physiological and psychological conditions will be more suited to different levels of air freshness and natural microclimate comfort levels, such as elderly tourists, pregnant women tourists, and children tourists will be vulnerable to polluted air environments and require more fresh and comfortable natural microclimates, such as Super Fresh and the most comfortable level of scenic spots, which has more negative oxygen ions (O2) and lower PM2.5, PM10, and O3, with a more comfortable temperature, humidity, wind speed, solar radiation, and precipitation.
Moreover, the dynamic fresh air–natural microclimate fluctuation revealed by FAI-NMCI of scenic spots will properly indicate the air freshness and natural microclimate comfort degree information for both the demand side and the supply side of the tourism market, which will profoundly promote fresh air–natural microclimate tourism resources’ distribution and redistribution, accelerate fresh air–natural microclimate in-depth tourism resources combination and integration from a creative microclimate tourism development perspective, and further drive fresh-microclimate tourism development in destinations and scenic spots with comparative advantages of fresh air and a comfortable natural microclimate for triggering their in-depth transformation and improvement.
From a theoretical contribution perspective, this paper constructed the FAI-NMCI to harmoniously combine air resources and microclimate resources together, which could empirically evaluate air and microclimate tourism resource values for tourists, the tourism market, and the society as a whole. Moreover, it could figure out overlapping study areas of air tourism, climate tourism, health tourism, ecological tourism, and so forth, which have significant theoretical innovation through transdisciplinary, multidisciplinary, and interdisciplinary integration research in China’s tourism market. This is a new research trend that has seldom been explored by researchers and could become an important research domain for future multidisciplinary, transdisciplinary, and interdisciplinary exploration.
From a socioeconomic practical application perspective, the creation and utilization of FAI-NMCI is significant for fresh air and comfortable microclimate tourism resources’ distribution and redistribution in the tourism market. Meanwhile, it could also become a vital health tourism market indicator, which simply reveals the air freshness degree and microclimate comfort degree for tourists and some potential tourists pursuing health tourism experiences and long-term health-improving vacations. FAI-NMCI could indicate a scenic spot’s air freshness and microclimate comfort levels specifically on different days of a year, which also could be calculated and summarized into 24 Jieqi, 12 months, 4 seasons, and so forth. Under contemporary China’s high-quality tourism development background, this could provide accurate information not only for demand and supply sides of the tourism market but could also become an important and comprehensive index for related governmental management and NGOs.
The limitation of this paper is we only applied the FAI-NMCI to four scenic spots of China because of data collection limitations and the short time construction of the air freshness index infrastructure, with only 1–2 years of data sources. This new index has only been applied in Fujian Province rather than other provinces of China, which need to be explored in the future. This index could reveal not only the natural conditions of tourism resources but could also indicate tourism practices, tourists’ and destinations’ social behavior patterns, as well as socioeconomic development patterns of some destinations, which could be explored through introducing multidisciplinary methods in future research.

Author Contributions

Conceptualization, X.Y., C.L. and S.J.; methodology, X.Y. and C.L.; software, X.Y. and C.L.; validation, X.Y., M.B. and C.L.; formal analysis, X.Y. and C.L.; investigation, X.Y. and C.L.; resources, X.Y. and C.L.; data curation, X.Y. and C.L.; writing—original draft preparation, X.Y., C.L. and S.J.; writing—review and editing, X.Y., M.B., C.L. and S.J.; visualization, X.Y. and C.L.; supervision, C.L.; project administration, C.L.; funding acquisition, C.L. and S.J. All authors have read and agreed to the published version of the manuscript.

Funding

This work was financially supported by the National Science Foundation of China (42101238), the start-up funding of Minjiang University (32304307), and the Project of Central Leading Local “Fujian Mental Health Human–Computer Interaction Technology Research Center” (2020L3024).

Institutional Review Board Statement

Not applicable.

Informed Consent Statement

Not applicable.

Data Availability Statement

The data are not publicly available due to the privacy of data policy of Fujian Meteorological Service Center.

Conflicts of Interest

The authors declare no conflict of interest.

References

  1. Yang, T.; Liu, W. Does air pollution affect public health and health inequality? Empirical evidence from China. J. Clean. Prod. 2018, 203, 43–52. [Google Scholar] [CrossRef]
  2. Schmid, D.; Korkmaz, P.; Blesl, M.; Fahl, U.; Friedrich, R. Analyzing transformation pathways to a sustainable European energy system—Internalization of health damage costs caused by air pollution. Energy Strat. Rev. 2019, 26, 100417. [Google Scholar] [CrossRef]
  3. Jones, B.A.; Fleck, J. Shrinking lakes, air pollution, and human health: Evidence from California’s Salton Sea. Sci. Total Environ. 2020, 712, 136490. [Google Scholar] [CrossRef]
  4. Liu, K.; Yang, B.-Y.; Guo, Y.; Bloom, M.S.; Dharmage, S.; Knibbs, L.D.; Heinrich, J.; Leskinen, A.; Lin, S.; Morawska, L.; et al. The role of influenza vaccination in mitigating the adverse impact of ambient air pollution on lung function in children: New insights from the Seven Northeastern Cities Study in China. Environ. Res. 2020, 187, 109624. [Google Scholar] [CrossRef]
  5. Ding, L.; Zhu, D.; Peng, D.; Zhao, Y. Air pollution and asthma attacks in children: A case–crossover analysis in the city of Chongqing, China. Environ. Pollut. 2017, 220, 348–353. [Google Scholar] [CrossRef]
  6. Li, Z.; Xu, X.; Thompson, L.A.; Gross, H.E.; Shenkman, E.A.; DeWalt, D.A.; Huang, I.-C. Longitudinal Effect of Ambient Air Pollution and Pollen Exposure on Asthma Control: The Patient-Reported Outcomes Measurement Information System (PROMIS) Pediatric Asthma Study. Acad. Pediatr. 2019, 19, 615–623. [Google Scholar] [CrossRef]
  7. Raaschou-Nielsen, O.; Beelen, R.; Wang, M.; Hoek, G.; Andersen, Z.J.; Hoffmann, B.; Stafoggia, M.; Samoli, E.; Weinmayr, G.; Dimakopoulou, K.; et al. Particulate matter air pollution components and risk for lung cancer. Environ. Int. 2016, 87, 66–73. [Google Scholar] [CrossRef]
  8. Wei, F.; Wu, M.; Qian, S.; Li, D.; Jin, M.; Wang, J.; Shui, L.; Lin, H.; Tang, M.; Chen, K. Association between short-term exposure to ambient air pollution and hospital visits for depression in China. Sci. Total Environ. 2020, 724, 138207. [Google Scholar] [CrossRef] [PubMed]
  9. Tzivian, L.; Winkler, A.; Dlugaj, M.; Schikowski, T.; Vossoughi, M.; Fuks, K.; Weinmayr, G.; Hoffmann, B. Effect of long-term outdoor air pollution and noise on cognitive and psychological functions in adults. Int. J. Hyg. Environ. Health 2015, 218, 1–11. [Google Scholar] [CrossRef]
  10. Buoli, M.; Grassi, S.; Caldiroli, A.; Carnevali, G.S.; Mucci, F.; Iodice, S.; Cantone, L.; Pergoli, L.; Bollati, V. Is there a link between air pollution and mental disorders? Environ. Int. 2018, 118, 154–168. [Google Scholar] [CrossRef]
  11. Zeng, J.; He, Q. Does industrial air pollution drive health care expenditures? Spatial evidence from China. J. Clean. Prod. 2019, 218, 400–408. [Google Scholar] [CrossRef]
  12. Bai, R.; Lam, J.C.; Li, V.O. A review on health cost accounting of air pollution in China. Environ. Int. 2018, 120, 279–294. [Google Scholar] [CrossRef]
  13. Zhang, X.; Ou, X.; Yang, X.; Qi, T.; Nam, K.M.; Zhang, D.; Zhang, X. Socioeconomic burden of air pollution in China: Province-level analysis based on energy economic model. Energy Econ. 2017, 68, 478–489. [Google Scholar] [CrossRef]
  14. Hao, Y.; Peng, H.; Temulun, T.; Liu, L.-Q.; Mao, J.; Lu, Z.-N.; Chen, H. How harmful is air pollution to economic development? New evidence from PM2.5 concentrations of Chinese cities. J. Clean. Prod. 2018, 172, 743–757. [Google Scholar] [CrossRef]
  15. Xia, Y.; Guan, D.; Jiang, X.; Peng, L.; Schroeder, H.; Zhang, Q. Assessment of socioeconomic costs to China’s air pollution. Atmos. Environ. 2016, 139, 147–156. [Google Scholar] [CrossRef]
  16. Lopes, H.S.; Remoaldo, P.C.; Ribeiro, V.; Martín-Vide, J. Perceptions of human thermal comfort in an urban tourism destination—A case study of porto (portugal). Build. Environ. 2021, 205, 108246. [Google Scholar] [CrossRef]
  17. Yang, X.; Dong, L.; Li, C. Microclimate tourism and microclimate tourism security and safety in China. Tour. Manag. 2019, 74, 110–133. [Google Scholar] [CrossRef]
  18. Jeuring, J.H.G. Weather perceptions, holiday satisfaction and perceived attractiveness of domestic vacationing in The Netherlands. Tour. Manag. 2017, 61, 70–81. [Google Scholar] [CrossRef]
  19. Zeng, Q.; Fan, L.; Ni, Y.; Li, G.; Gu, Q. Construction of AQHI based on the exposure relationship between air pollution and YLL in northern China. Sci. Total Environ. 2020, 710, 136264. [Google Scholar] [CrossRef]
  20. Ruggieri, M.; Plaia, A. An aggregate AQI: Comparing different standardizations and introducing a variability index. Sci. Total Environ. 2012, 420, 263–272. [Google Scholar] [CrossRef]
  21. Yuan, M.; Liu, X.; Guo, J.; Huang, Y.; Song, W. Analysis of Eco-Tourism Climate Resources in Xingwen, China Based on the Comfort Index and the Negative Air (Oxygen) Ion. J. Geosci. Environ. Prot. 2021, 9, 154–163. [Google Scholar] [CrossRef]
  22. Tan, J.; Chen, Z.; Luo, X.; Yang, W.; Shu, S.; Xu, J. Distribution characteristics of atmospheric negative oxygen ions in scenic spots of Hubei Province and the influence of meteorological conditions. Resour. Environ. Yangtze River Basin 2017, 26, 314–323, (In Chinese with English abstract). [Google Scholar]
  23. Luceño, N.L.; Angrimani, D.D.S.R.; Bicudo, L.D.C.; Szymańska, K.J.; Van Poucke, M.; Demeyere, K.; Meyer, E.; Peelman, L.; Mullaart, E.; Broekhuijse, M.L.; et al. Exposing dairy bulls to high temperature-humidity index during spermatogenesis compromises subsequent embryo development in vitro. Theriogenology 2019, 141, 16–25. [Google Scholar] [CrossRef] [PubMed]
  24. Oliver, J.E. Climate and Man’s Environment: An Introduction to Applied Climatology; John Wiley & Sons: New York, NY, USA, 1973; pp. 145–147. [Google Scholar]
  25. Fischer, W.H. Human climates of northern China. Atmos. Environ. (1967) 1979, 13, 747–748. [Google Scholar] [CrossRef]
  26. Yu, Y.; Wang, X.; Bründlinger, R. Improved Elman Neural Network Short-Term Residents Load Forecasting Considering Human Comfort Index. J. Electr. Eng. Technol. 2019, 14, 2315–2322. [Google Scholar] [CrossRef]
  27. World Health Organization. WHO Global Air Quality Guidelines: Particulate Matter (PM2.5 and PM10), Ozone, Nitrogen Dioxide, Sulfur Dioxide and Carbon Monoxide. License: CC BY-NC-SA 3.0 IGO. 2021. Available online: https://apps.who.int/iris/handle/10665/345329 (accessed on 4 February 2021).
  28. Liu, R.; Lian, Z.; Lan, L.; Qian, X.; Chen, K.; Hou, K.; Li, X. Effects of negative oxygen ions on sleep quality. Procedia Eng. 2017, 205, 2980–2986. [Google Scholar] [CrossRef]
  29. Nimmerichter, A.; Holdhaus, J.; Mehnen, L.; Vidotto, C.; Loidl, M.; Barker, A.R. Effects of negative air ions on oxygen uptake kinetics, recovery and performance in exercise: A randomized, double-blinded study. Int. J. Biometeorol. 2013, 58, 1503–1512. [Google Scholar] [CrossRef] [Green Version]
  30. DB42/T1198-20162016; Hubei Province Air Negative Oxygen Ion Concentration Grade. Hubei Provincial Bureau of Quality and Technical Supervision: Wuhan, China, 2016.
  31. WHO. WHO Air Quality Guidelines for Particulate Matter, Ozone, Nitrogen Dioxide and Sulfur Dioxide–Global Update 2005; Druckpartner Moser: Rheinbach, Germany, 2005; pp. 217–415. [Google Scholar]
  32. QX/T380-2017; Air (Negative) Oxygen Ion Concentration Grade, Meteorological Industry Standard of The People’s Republic of China, Compilation of Meteorological Industry Standard of The People’s Republic of China. China Meteorological Administration: Beijing, China, 2017.
  33. GB3095-2012; Ministry of Environmental Protection and General Administration of Quality Supervision, Inspection and Quarantine, Ambient Air Quality Standard. China Environmental Science Press: Beijing, China, 2012.
  34. Wu, R.; Song, X.; Bai, Y.; Chen, J.; Zhao, Q.; Liu, S.; Xu, H.; Wang, T.; Feng, B.; Zhang, Y.; et al. Are current Chinese national ambient air quality standards on 24-hour averages for particulate matter sufficient to protect public health? J. Environ. Sci. 2018, 71, 67–75. [Google Scholar] [CrossRef]
  35. Yao, Y. Distribution characteristics of air anion concentration in Zhejiang Province. Meteorol. Sci. Technol. 2019, 47, 1006–1013. [Google Scholar]
  36. Liu, N.M.; Liu, L.Q.; Xu, M.-M.; Liang, F.C.; Pan, X.C. Relationships between ambient nitrogen dioxide and population mortality of respiratory disease in Beijing. J. Environ. Health 2014, 31, 565–568. [Google Scholar]
  37. Lam, C.K.C.; Gallant, A.; Tapper, N. Perceptions of thermal comfort in heatwave and non-heatwave conditions in Melbourne, Australia. Urban Clim. 2018, 23, 204–218. [Google Scholar] [CrossRef]
  38. Martín, M.B.G. Weather, climate and tourism a geographical perspective. Ann. Tour. Res. 2005, 32, 571–591. [Google Scholar] [CrossRef]
  39. Nasrollahi, N.; Hatami, Z.; Taleghani, M. Development of outdoor thermal comfort model for tourists in urban historical areas; A case study in Isfahan. Build. Environ. 2017, 125, 356–372. [Google Scholar] [CrossRef]
  40. Lai, D.; Lian, Z.; Liu, W.; Guo, C.; Liu, W.; Liu, K.; Chen, Q. A comprehensive review of thermal comfort studies in urban open spaces. Sci. Total Environ. 2020, 742, 140092. [Google Scholar] [CrossRef] [PubMed]
  41. Cui, X.; Liang, C.; Wu, J.; Wang, C.; Chen, L.; Liu, H. Forecasting method of tourism meteorological index in Kaiping Diaolou scenic spot. Guangdong Meteorol. 2018, 40, 57–60, (In Chinese with English Abstract). [Google Scholar]
Figure 1. The four scenic spots and their monitoring stations in Fujian Province, China.
Sustainability 14 01911 g001
Figure 2. FAI and NMCI levels of Wuyi Mountain (A,B) and Baishuiyang scenic spot (C,D) of Fujian Province, China.
Sustainability 14 01911 g002
Figure 3. FAI and NMCI of Wuyi Mountain (A) and Baishuiyang scenic spots (B) of Fujian Province on each day of 2018.
Sustainability 14 01911 g003
Figure 4. 24 Jieqi FAI-NMCI of Wuyi Mountain and Baishuiyang scenic spots.
Sustainability 14 01911 g004
Figure 5. FAI and NMCI levels of Yongding Tulou (A,B) and Gutian Conference Site scenic spots (C,D) of Fujian Province, China.
Sustainability 14 01911 g005
Figure 6. (A) FAI and (B) NMCI of Yongding Tulou and Gutian Conference Site scenic spots of Fujian Province on each day of 2018.
Sustainability 14 01911 g006
Figure 7. 24 Jieqi FAI-NMCI Index of Yongding Tulou and Gutian Conference Site scenic spots.
Sustainability 14 01911 g007
Table 1. Comparison of methods and classification of air freshness in different provinces of China.
Measurement MethodLevelsPM2.5
Concentration (μg/m3)
O2 Concentration
(N Ions/cm3)
Level Evaluation
Measurement method of fresh air in FujianLevel 1≤351500 ≤ NVery Fresh
Level 2≤351000 ≤ N < 1500Fresh
Level 3≤35500 ≤ N < 1000Relatively Fresh
Level 4≤35100 ≤ N < 500General
Level 5≤350 < N < 100Not Fresh
Measurement method of fresh air in HubeiLevel 1≤351200 ≤ NHigh Concentration, Air Fresh
Level 2≤35500 ≤ N < 1200High Concentration, Air Relatively Fresh
Level 3≤35300 ≤ N < 500Middle Concentration, Air Generally Fresh
Level 4≤35100 ≤ N < 300Relatively Low Concentration,
Air Relatively Not Fresh
Level 5≤350 < N < 100Low Concentration, Air Not Fresh
Measurement method of fresh air in ZhejiangLevel 1≤350 ≤ N < 50Not Fresh
Level 1≤3550 ≤ N < 200Not Fresh
Level 1≤35200 ≤ N < 500Not Fresh
Level 2≤35500 ≤ N < 900General
Level 3≤35900 ≤ N < 1200Relatively Fresh
Level 4≤351200 ≤ N < 1800Fresh
Level 5≤351800 ≤ N < 2100Fresh
Level 6≤35≥2100Very Fresh
Table 2. Standard concentration degree of indicators of fresh air components.
DimensionIndicatorsAverage TimeConcentration DegreeUnit
III
Beneficial Air ComponentsNegative Oxygen Ion (O2)24 h mean10001000ions/cm3
No Harmful Air ComponentsSulfur Dioxide (SO2)24 h mean50150μg/m3
Nitrogen Dioxide (NO2)24 h mean8080
Carbon Monoxide (CO)24 h mean44mg/m3
Ozone (O3)day maximum 8 h mean100160μg/m3
Particulate Matter 10 (PM10)24 h mean50150
Particulate Matter 2.5 (PM2.5)24 h mean3575
Notes: Data source from Ambient Air Quality Standards of China (GB3095-2012). The category I region used I concentration degree, and the category II region used II concentration degree. The category I region is the place of natural conservation, famous scenic spots, and other special conservation regions that need special protection. The category II region is the residential regions, the mixed region with commercial, transportation, and residents, the cultural regions, industrial regions, and rural regions.
Table 3. Threshold range of natural scenic spot FAI levels.
SBSpiFAI (Fresh Air Index)
In Natural
Scenic Spot
Levels
O2 (Ion/cm3)PM2.5
(μg/m3)
PM10
(μg/m3)
O3
(μg/m3)
SO2
(μg/m3)
NO2
(μg/m3)
CO (mg/m3)
≥3500≤10≤25≤75≤25≤55≤1.5FAI ≥ 2Super Fresh
3000153080306021.2 ≤ FAI < 2Very Fresh
250020358535652.50.4 ≤ FAI < 1.2Healing Fresh
200025409040703−0.4 ≤ FAI < 0.4Relatively Fresh
150030459545753.5−1.2 ≤ FAI < −0.4Fresh
1000355010050804−2 ≤ FAI < −1.2General
<1000>35>50>100>50>80>4FAI < −2Not Fresh
Table 4. Threshold range of cultural scenic spot FAI levels.
SBSpiFAI (Fresh Air
Index)
In Cultural Scenic Spot
Levels
O2 (Ion/cm3)PM2.5
(μg/m3)
PM10
(μg/m3)
O3
(μg/m3)
SO2
(μg/m3)
NO2
(μg/m3)
CO (mg/m3)
≥3500≤25≤75≤85≤75≤55≤1.5FAI ≥ 2.14Super Fresh
30003590100906021.31 ≤ FAI < 2.14Very Fresh
250045105115105652.50.48 ≤ FAI < 1.31Healing Fresh
200055120130120703−0.35 ≤ FAI < 0.48Relatively Fresh
150065135145135753.5−1.17 ≤ FAI < −0.35Fresh
100075150160150804−2 ≤ FAI < −1.17General
<1000>75>150>160>150>80>4FAI < −2Not Fresh
Table 5. Threshold range of RCI levels.
RCI LevelsRCI
Very Uncomfortable≥100
More Uncomfortable80 ≤ RCI < 100
Relatively Uncomfortable60 ≤ RCI < 80
Comfortable0 ≤ RCI < 30
Relatively comfortable30 ≤ RCI < 40
Less comfortable40 ≤ RCI < 50
Uncomfortable50 ≤ RCI < 60
Table 6. Threshold range of each NMCI subindex and its corresponding levels and values in the NMCI context.
Subindices 1: THISubindices 2: WCISubindices 3: ICISubindices 4: HCISubindices 5: RCILevels and
Values of NMCI Subindices
Value RangeLevelsValue RangeLevelsValue RangeLevelsValue RangeLevelsValue RangeLevelsLevelsValues
40 < THI < 45ColdWCI ≥ 1000Cold WindICI ≥ 1.0Cold25 < HCI < 35Cold, UncomfortableRCI ≥ 100Very Uncomfortabled2
UncomfortableUncomfortable
45 < THI < 55Relatively cold 800 < WCI < 1000Relatively1.5 < ICI < 1.8Thick coat sweater35 < HCI < 45Relatively cold
Relatively
Uncomfortable
80 < RCI < 100More Uncomfortablec3
RelativelyCold Wind
Uncomfortable
55 < THI < 60Cool, Relatively Comfortable600 < WCI < 800Cool Wind1.3 < ICI < 1.5Coat, thick shin45 < HCI < 55Cool, Relatively Comfortable60 < RCI < 80Relatively Uncomfortableh4
60 < THI < 65Comfortable300 < WCI < 600Comfortable Wind0.7 < ICI < 1.3Thin coal shirt55 < HCI < 65Comfortable0 < RCI < 30ComfortableA5
65 < THI < 70Warm,
Relatively
200 < WCI < 300Warm Wind0.5 < ICI < 0.7Shirts (long sleeves)65 < HCI < 75Warm, Relatively Comfortable30 < RCI < 40Relative ComfortableB6
Comfortable
70 < THI < 75Slightly hot, Less
Comfortable
50 < WCI < 200Slightly Hot0.35 < ICI < 0.5Shirts (short sleeves)75 < HCI < 80Slightly hot, Less Comfortable40 < RCI < 50Less comfortableC7
75 < THI < 80Stuffiness,
Uncomfortable
−80 < WCI < 50Hot wind0.1 < ICI < 035Summer clothes with short sleeves80 < HCI < 85Stuffiness,50 < RCI < 60UncomfortableD8
Uncomfortable
Table 7. Threshold range of NMCI Levels.
Value RangeLevels
2 ≤ NMCI < 3Very cold uncomfortable
3 ≤ NMCI < 4Cold less comfortable
4 ≤ NMCI < 5Cool comfort
5 ≤ NMCI < 6The most comfortable
6 ≤ NMCI < 7Warm comfort
7 ≤ NMCI < 8Hot less comfortable
NMCI > 8Very hot uncomfortable
Table 8. Threshold range of FAI-NMCI Levels.
FAI Value Range
in Cultural
Scenic Spot
FAI Value Range
in Natural
Scenic Spot
FAI LevelsNMCI Value RangeNMCI Levels
FAI ≥ 2.14FAI ≥ 2Super Fresh2 ≤ NMCI < 3Very cold uncomfortable
1.31 ≤ FAI < 2.141.2 ≤ FAI < 2Very Fresh3 ≤ NMCI < 4Cold less comfortable
0.48 ≤ FAI < 1.310.4 ≤ FAI < 1.2Healing Fresh4 ≤ NMCI < 5Cool comfort
−0.35 ≤ FAI < 0.48−0.4 ≤ FAI < 0.4Relatively Fresh5 ≤ NMCI < 6The most comfortable
−1.17 ≤ FAI < −0.35−1.2 ≤ FAI < −0.4Fresh6 ≤ NMCI < 7Warm comfort
−2 ≤ FAI < −1.17−2 ≤ FAI < −1.2General7 ≤ NMCI < 8Hot less comfortable
FAI < −2FAI < −2Not FreshNMCI > 8Very hot uncomfortable
Table 9. Four scenic spots and their location information.
Scenic SpotsSite NumberLongitudeLatitudeAltitudeLocated CityLocated
Specific Site
Wuyi Mountain Scenic SpotF9269117.9624527.6677408Nanping CityWuyi Mountain
Gutian Conference Site Scenic SpotF7490116.837625.2261730Longyan CityGutian County
Pingnan Baishuiyang-Yuanyang Brook Scenic SpotF3749119.05827.0736679.2Ningde CityPing’nan County
Yongding earth building (Tulou) Scenic SpotF7590117.01524.667431Longyan CityYongding County
Publisher’s Note: MDPI stays neutral with regard to jurisdictional claims in published maps and institutional affiliations.

