
A Review of Heat Batteries Based PV Module Cooling—Case Studies on Performance Enhancement of Large-Scale Solar PV System

 , ,
, ,  ,
,  , ,
, ,
Abstract
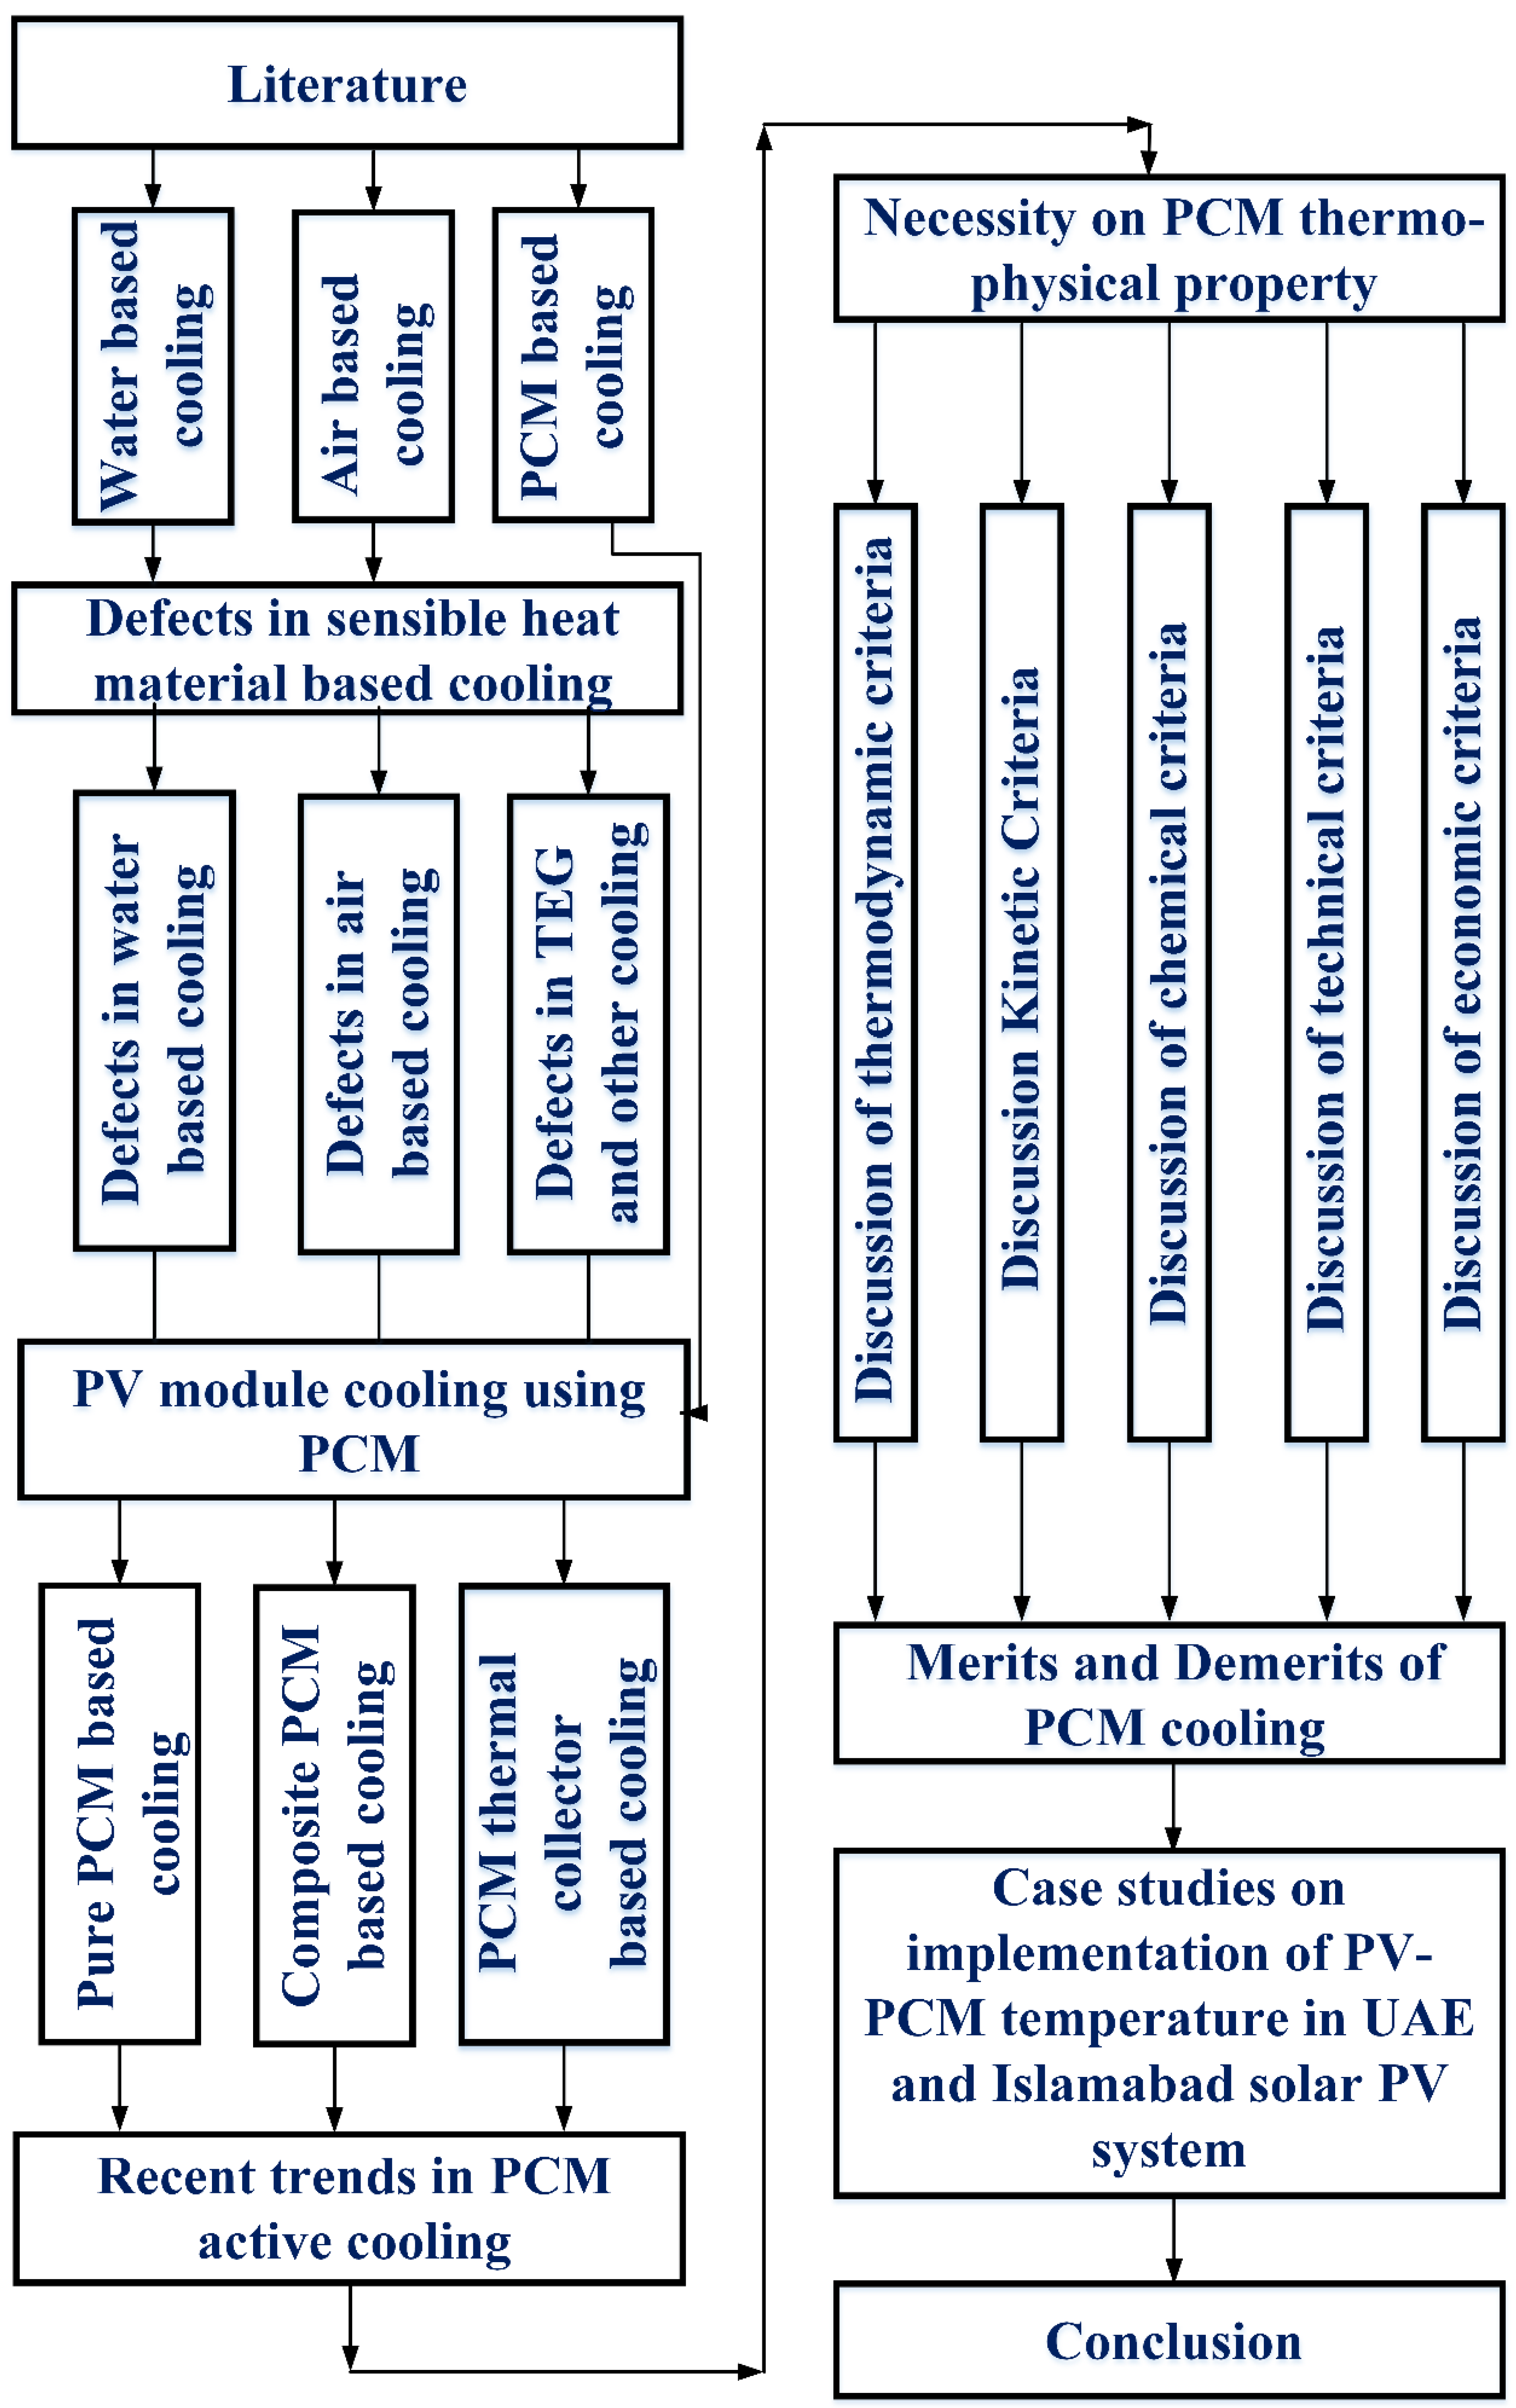
:1. Introduction
- Non-PCM-based cooling technique defects are reviewed.
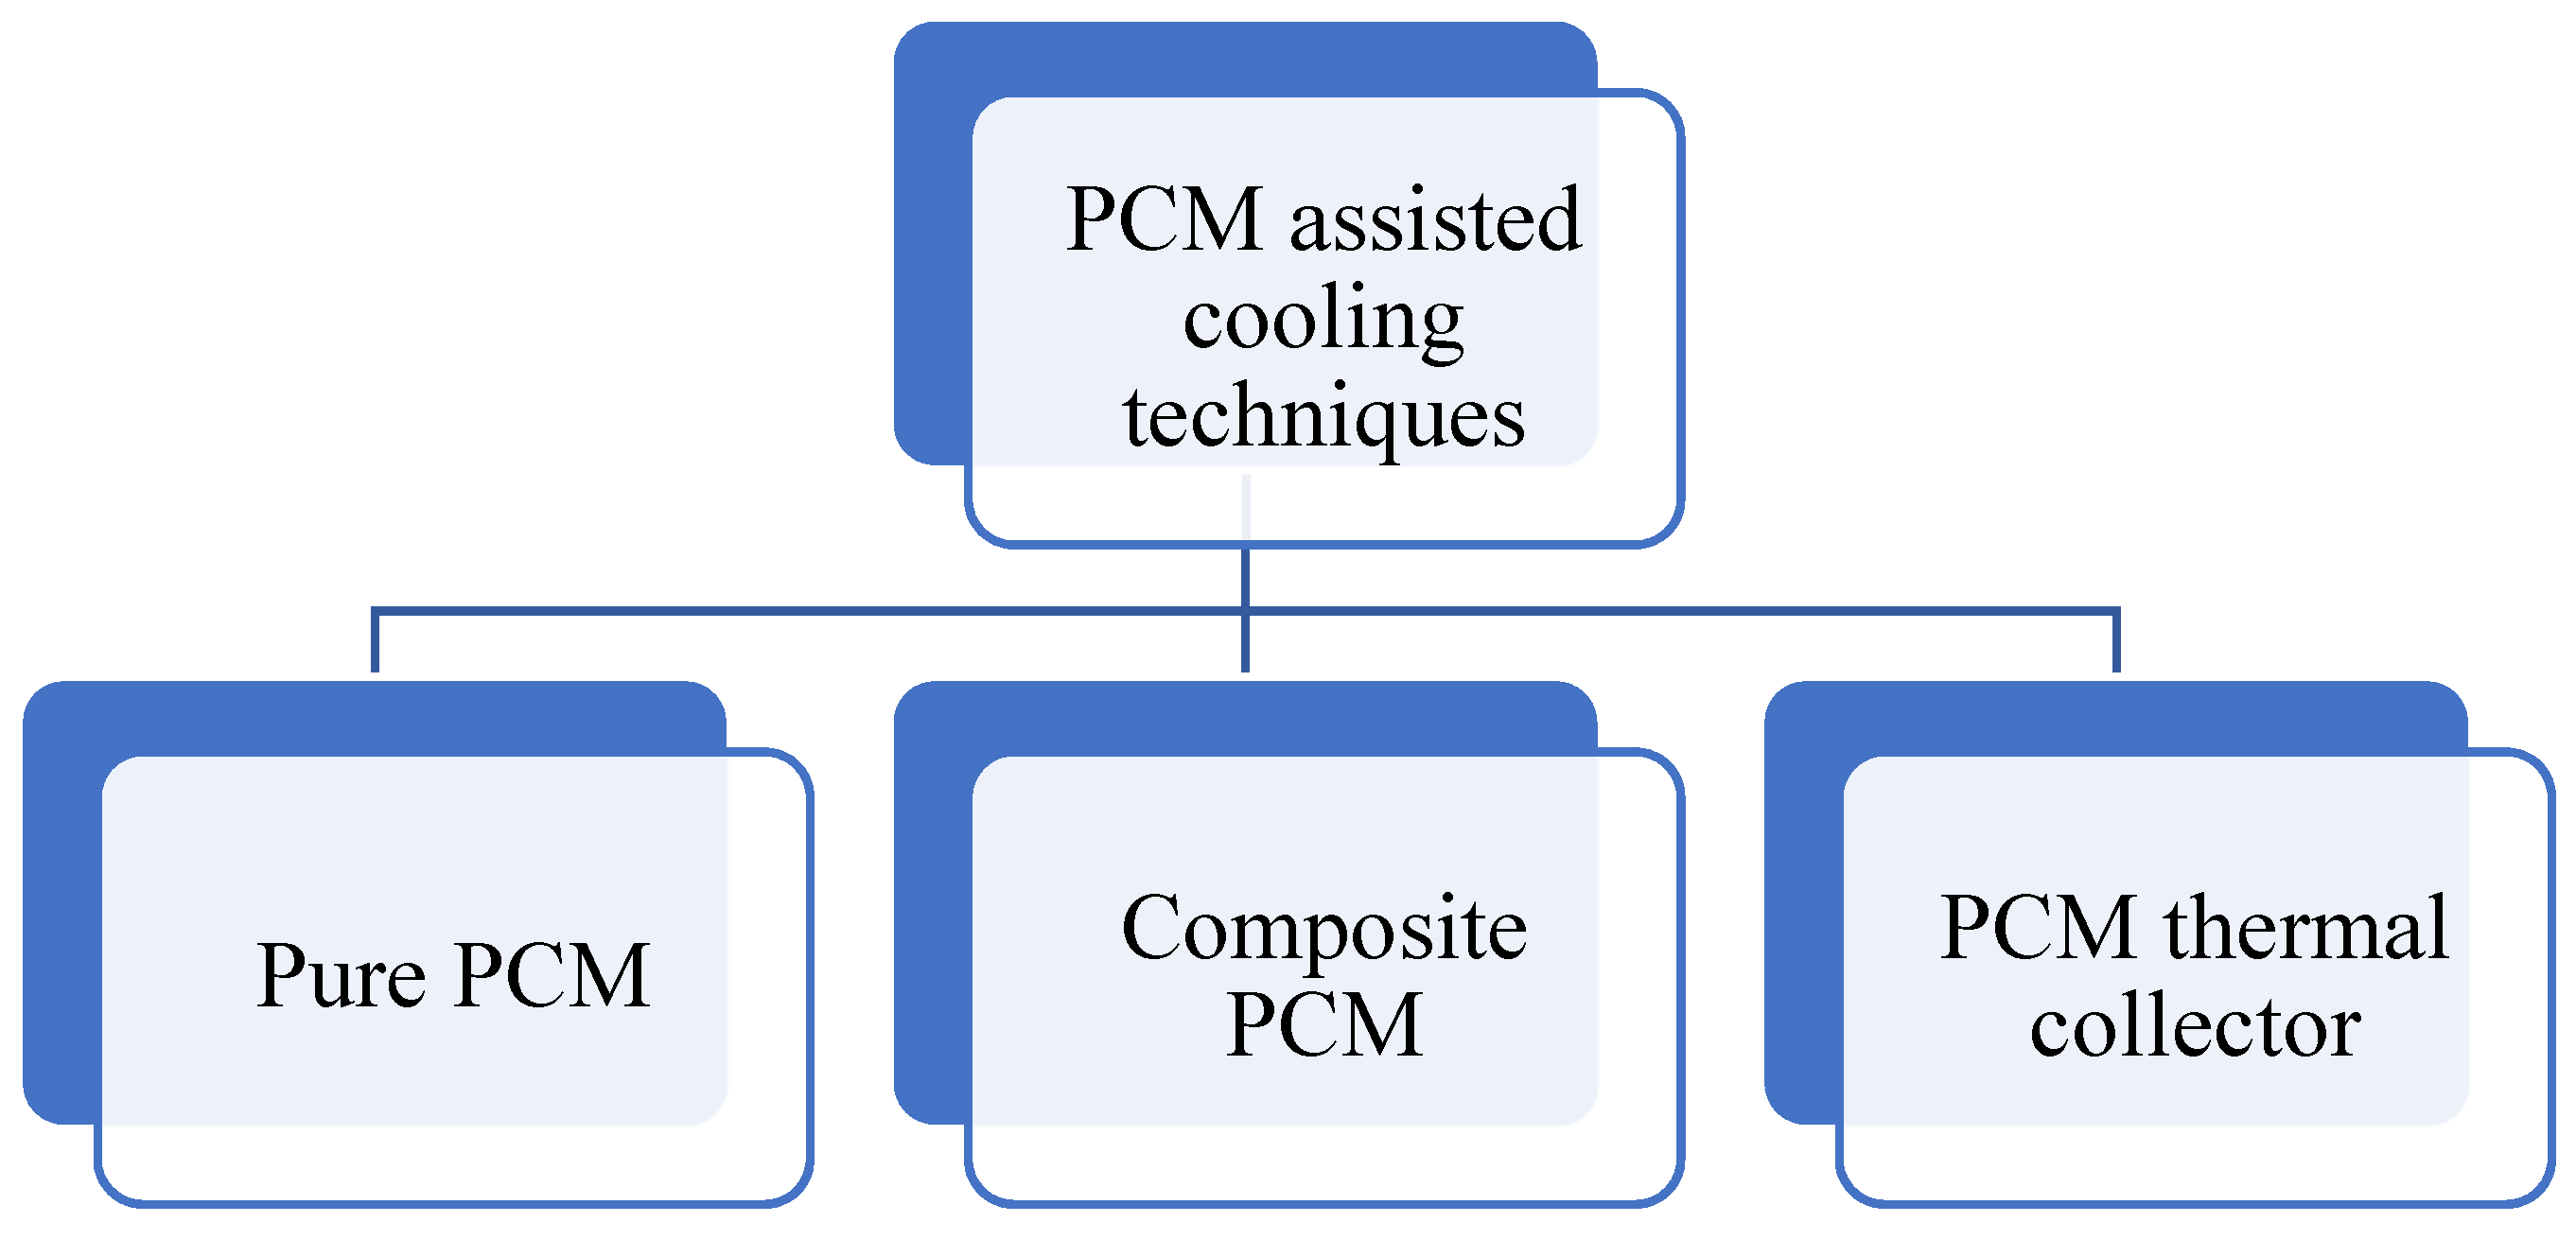
- PCM based cooling techniques are majorly classified into pure PCM, composite PCM, and PCM thermal collectors.
- The benefits and drawbacks of PCM thickness studies are reviewed.
- Recent trends in PCM-based active cooling techniques are studied.
- PCM thermophysical properties are exclusively studied especially, PCM Tmelt necessity and economic viabilities.
- Merits and demerits of the PCM-assisted cooling techniques are explored.
- Research gaps and recommendations are identified for further development in PV module cooling.
- Typical meteorological year (TMY) data from National renewable energy laboratory (NREL) data source in 1 h frequency enables studying the sites’ weather condition over a year. This would benefit in determining the PCM for varying environmental conditions.

| Author | Objective | Key Findings |
|---|---|---|
| Senthil et al. [58] | Different types of solar thermal heat pipes are reviewed. |
|
| Velmurugan et al. [54] |
|
|
| Anand et al. [59] |
|
|
| Kumar et al. [60] | PCM and nano-PCM based cooling techniques are reviewed. |
|
| Browne et al. [61] | A comprehensive review was conducted on BIPV and concentrated PV cooling methods using PCM. |
|
| Kandeal et al. [62] | Conductive, convective, and radiative cooling techniques are reviewed. |
|
| Ghadikolaei et al. [63] | A detailed review of water, jet impregnation, and PCM based cooling. |
|
| Maleki et al. [64] | Active and passive cooling methods are reviewed. |
|
| Mahian et al. [65] | Building-integrated PCM-based PV module cooling techniques are reviewed. |
|
| Present study |
|
|
2. Technical Barriers and Defects in Existing PV Module Cooling Techniques
2.1. Defects in Water-Based Cooling
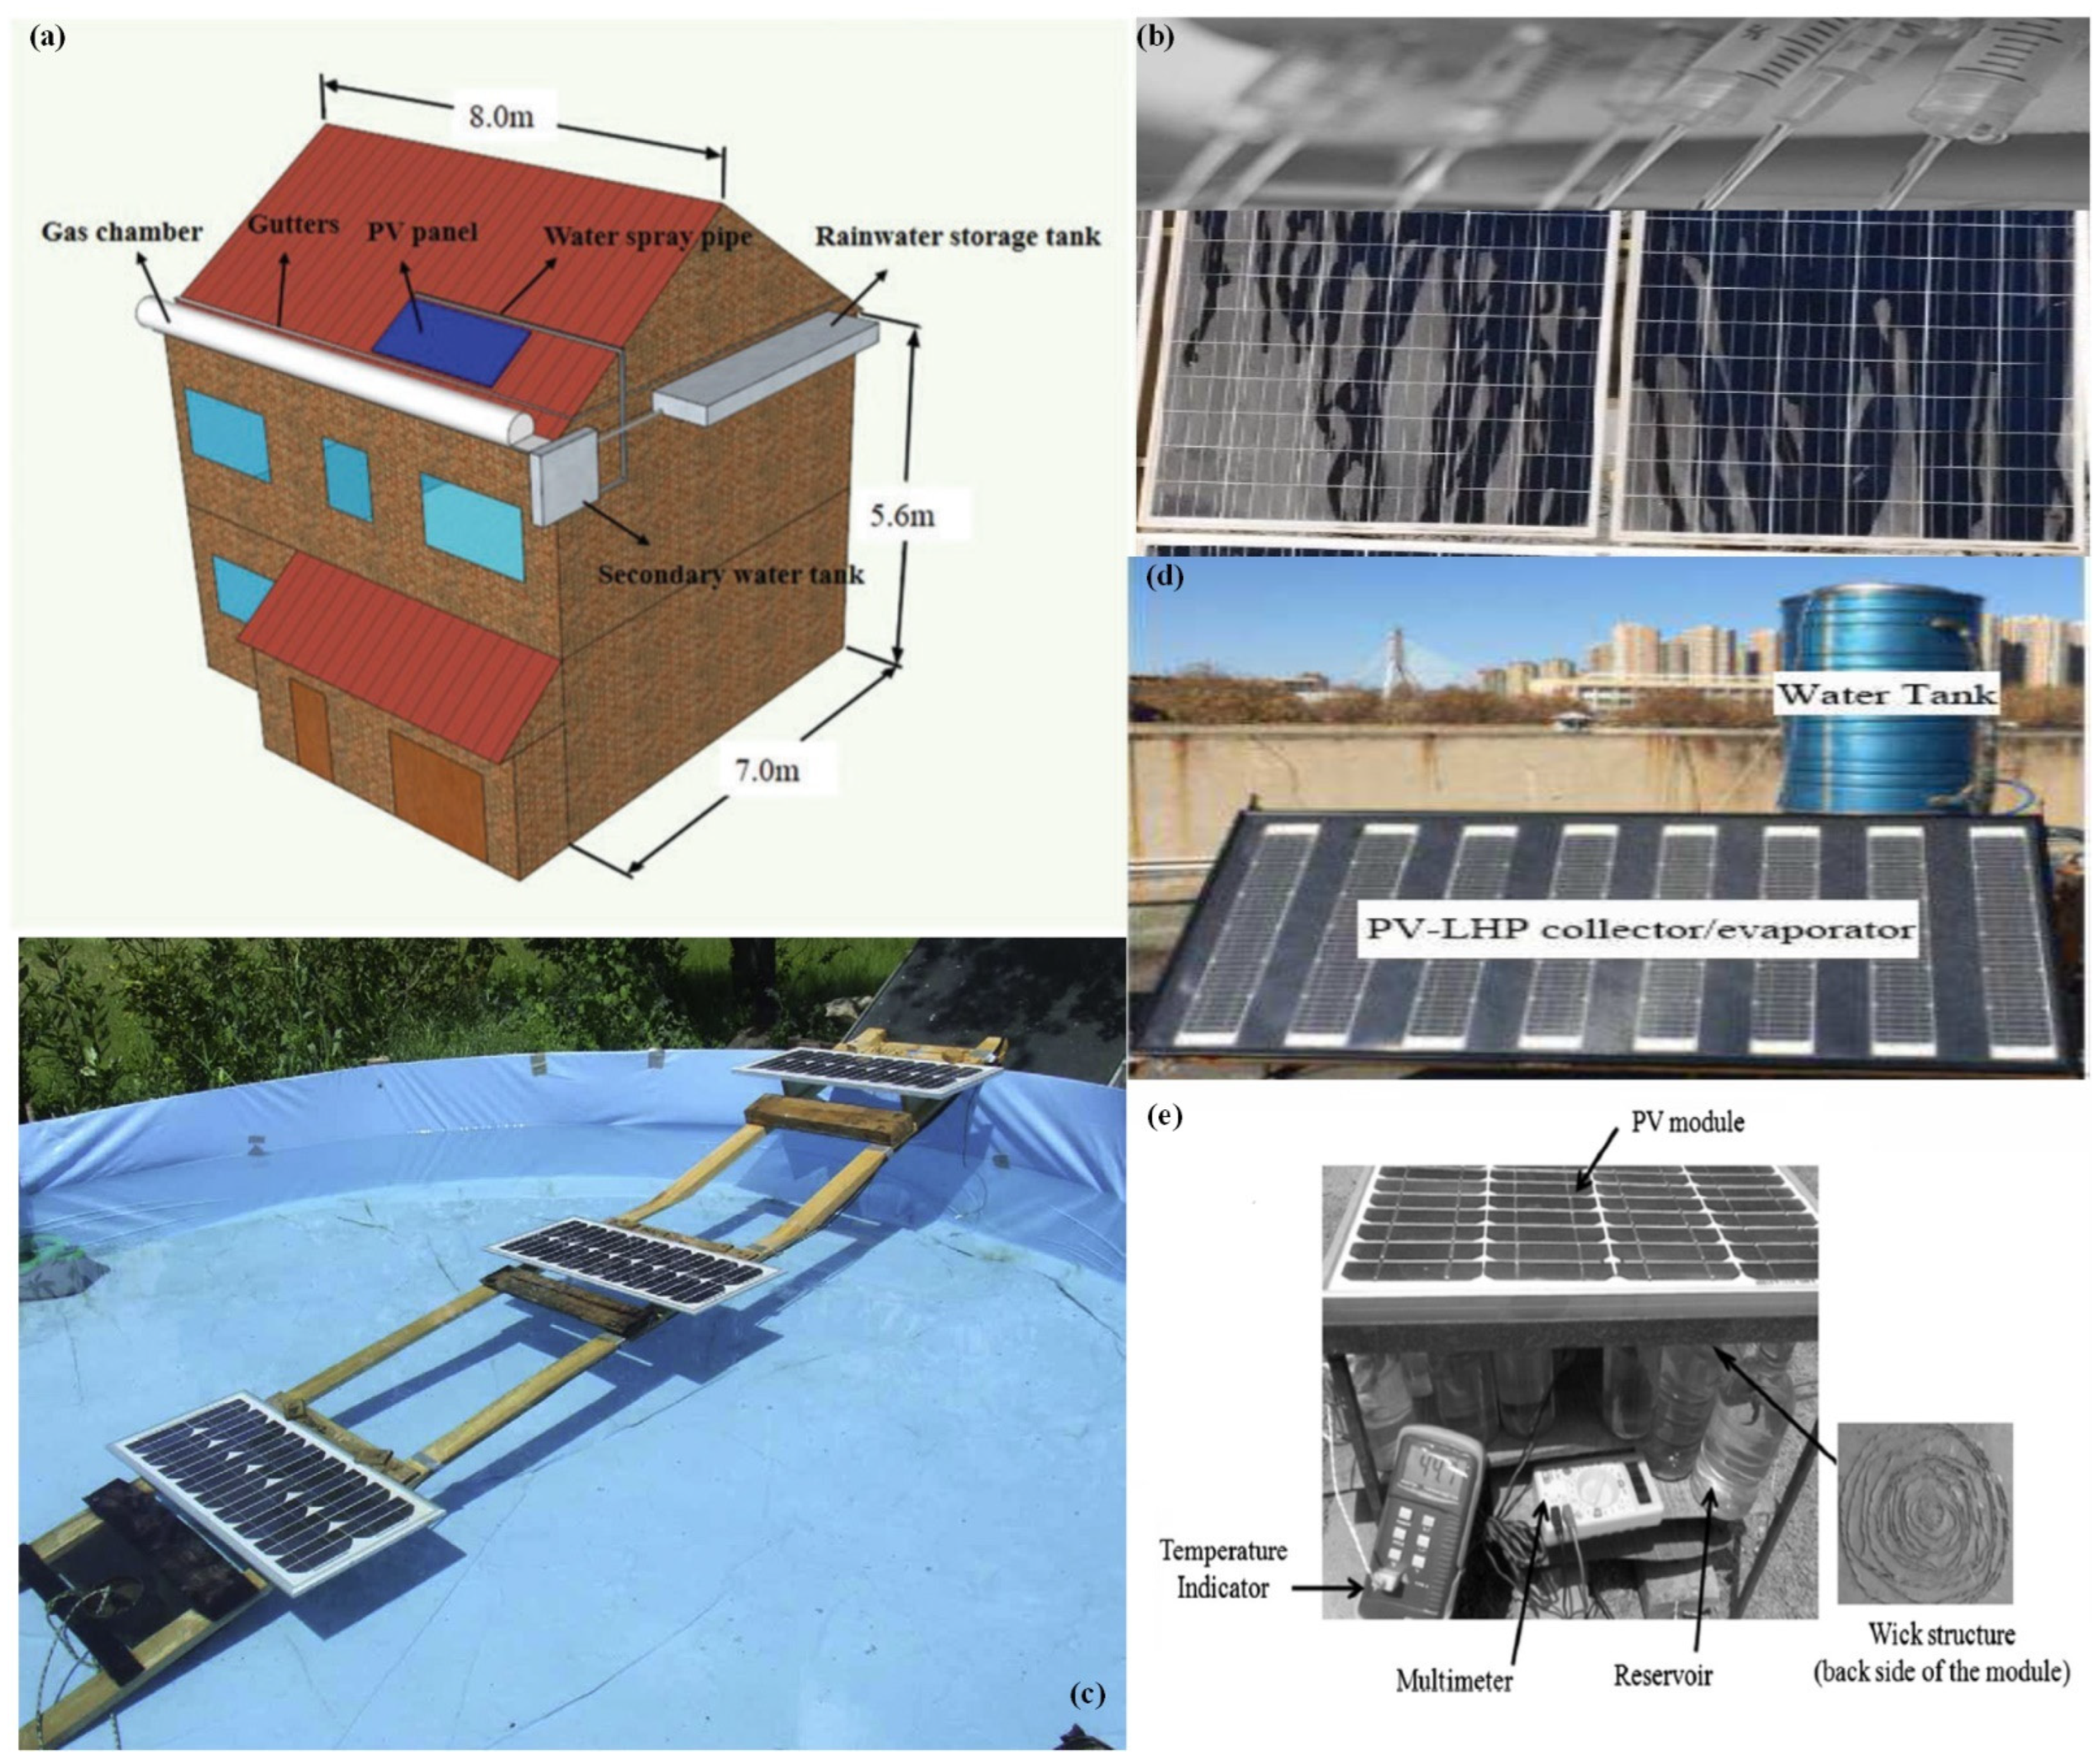
2.1.1. Water Spraying Technique
2.1.2. Syringe-Type Water Spraying Technique
2.1.3. Cotton Wick Cooling Technology
2.1.4. Immersing Cooling Technique
2.1.5. Heat Pipe Cooling Technique
2.2. Defects in Air-Based Cooling
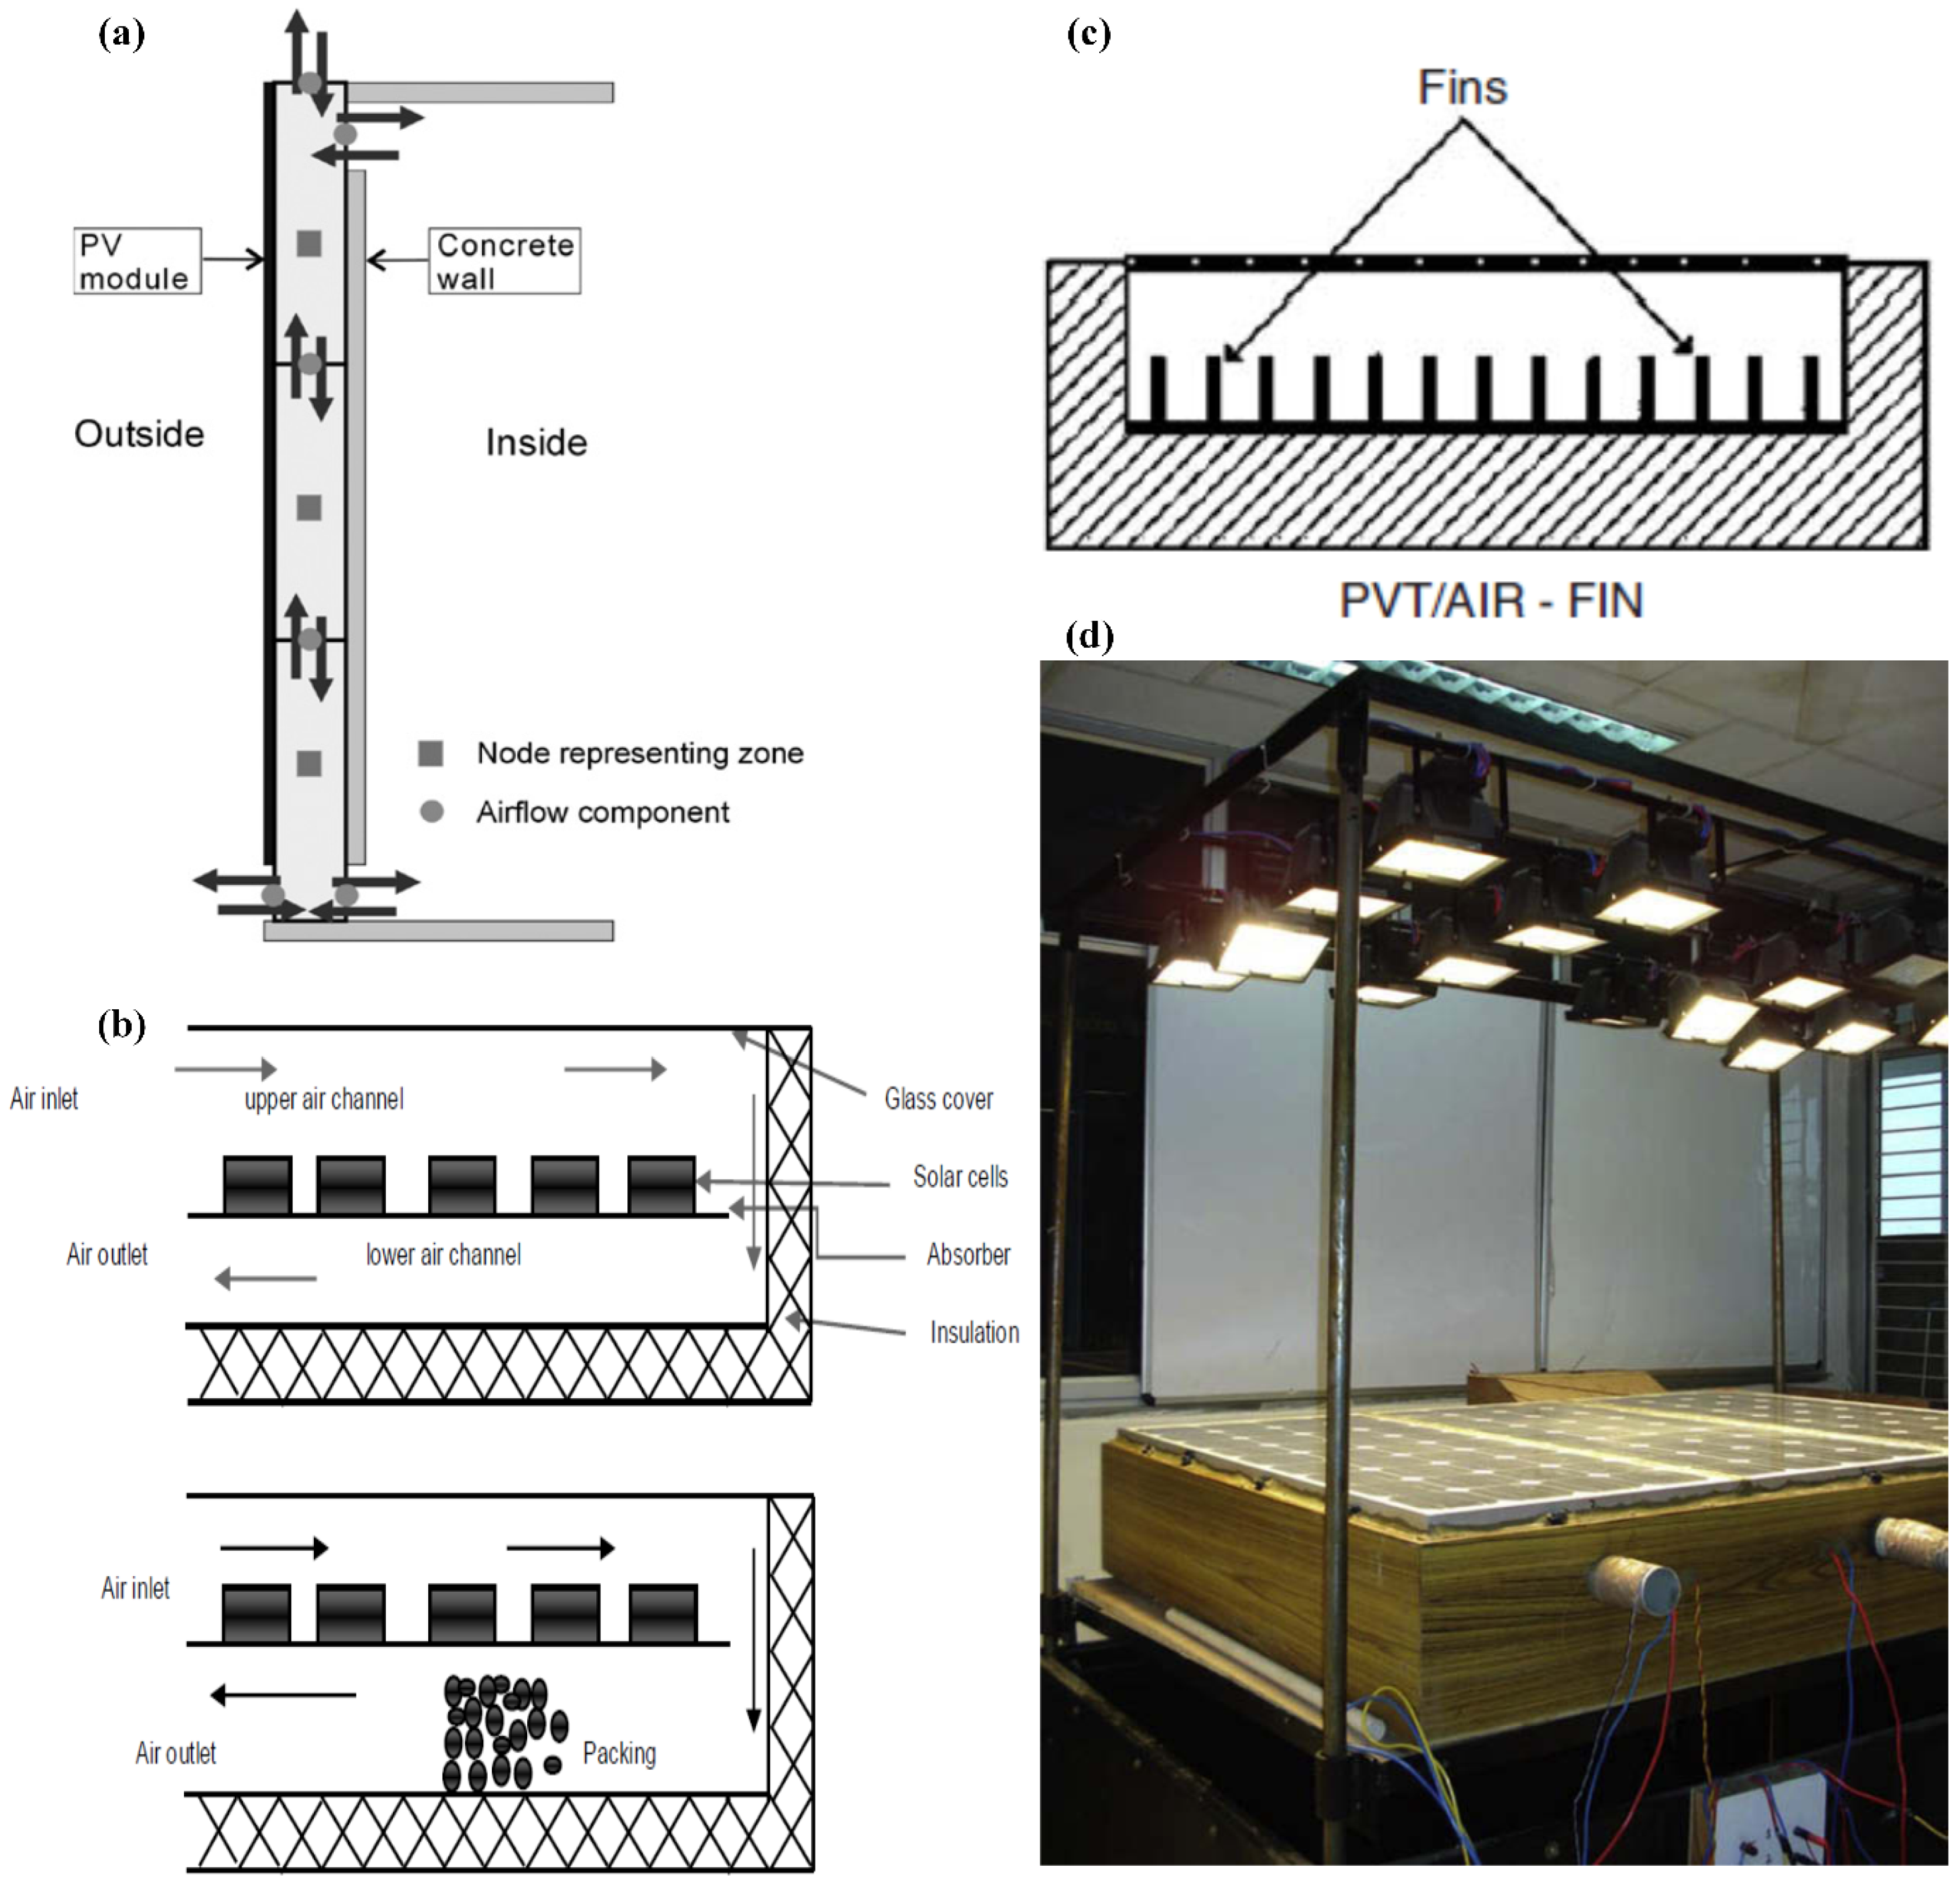
2.2.1. Forced Air Flow Technique
2.2.2. Double Side Air Passing Technique
2.3. Defects in TEG and Others
2.4. Drawbacks of Non-PCM Technique
3. Outline of PV Module Cooling Using PCM
3.1. Overview of Pure PCM-Based PV Module Cooling
3.1.1. PV-PCM Construction
3.1.2. PV-PCM Operational Difficulties

| Authors | PCM Thickness | PCM Name | Major Findings |
|---|---|---|---|
| Ahmad et al. [89] | 20 mm, 40 mm, 70 mm, 90 mm, 110 mm | RT42, RT31, RT25 |
|
| Gan and Xiang [90] | 20 mm, 30 mm, 50 mm | Plus ice S25 |
|
| Darkwa et al. [91] | 2.5 mm, 5 mm, 10 mm, and 20 mm | n-Octadecane |
|
| Liu et al. [92] | 20 mm, 30 mm, and 40 mm | CaCl2.6H2O |
|
| Siyabi et al. [93] | 30 mm and 60 mm | RT46, RT49, RT52, RT55, RT58 |
|
3.2. Overview of Composite PCM Based PV Module Cooling
3.2.1. PV-PCM Interfin
3.2.2. PV-PCM Metal Scrap
3.2.3. PV-PCM Nano-Compounds
3.2.4. PV-PCM Graphite
3.2.5. PV-PCM Metal Foam

3.3. Overview of PCM-Thermal Collector Based PV Module Cooling
3.3.1. PVT-PCM-Air
3.3.2. PVT-PCM-Water
3.3.3. PVT-PCM-Nanofluid

4. Recent Trend in PCM Based Active Cooling Technology
5. PCM Thermo-Physical Property Necessity on PV Module Cooling
5.1. Discussion of Thermodynamic Criteria
5.1.1. PCM Tmelt
5.1.2. Latent Heat of Fusion
5.1.3. Density
5.1.4. Specific Heat Capacity
5.1.5. Thermal Conductivity
5.1.6. Congruent Melting
5.2. Discussion of Kinetic Criteria
Supercooling
5.3. Discussion of Chemical Criteria
5.3.1. Chemical Stability and Decomposition
5.3.2. Corrosive
5.3.3. Toxic
5.3.4. Flammable and Explosive
5.4. Discussion of Technical Criteria
Compactness, Reliability and Simplicity
5.5. Discussion of Economic Criteria
Large Scale Availability and Low Cost
6. Benefits and Drawbacks of PV Module Cooling Using PCM
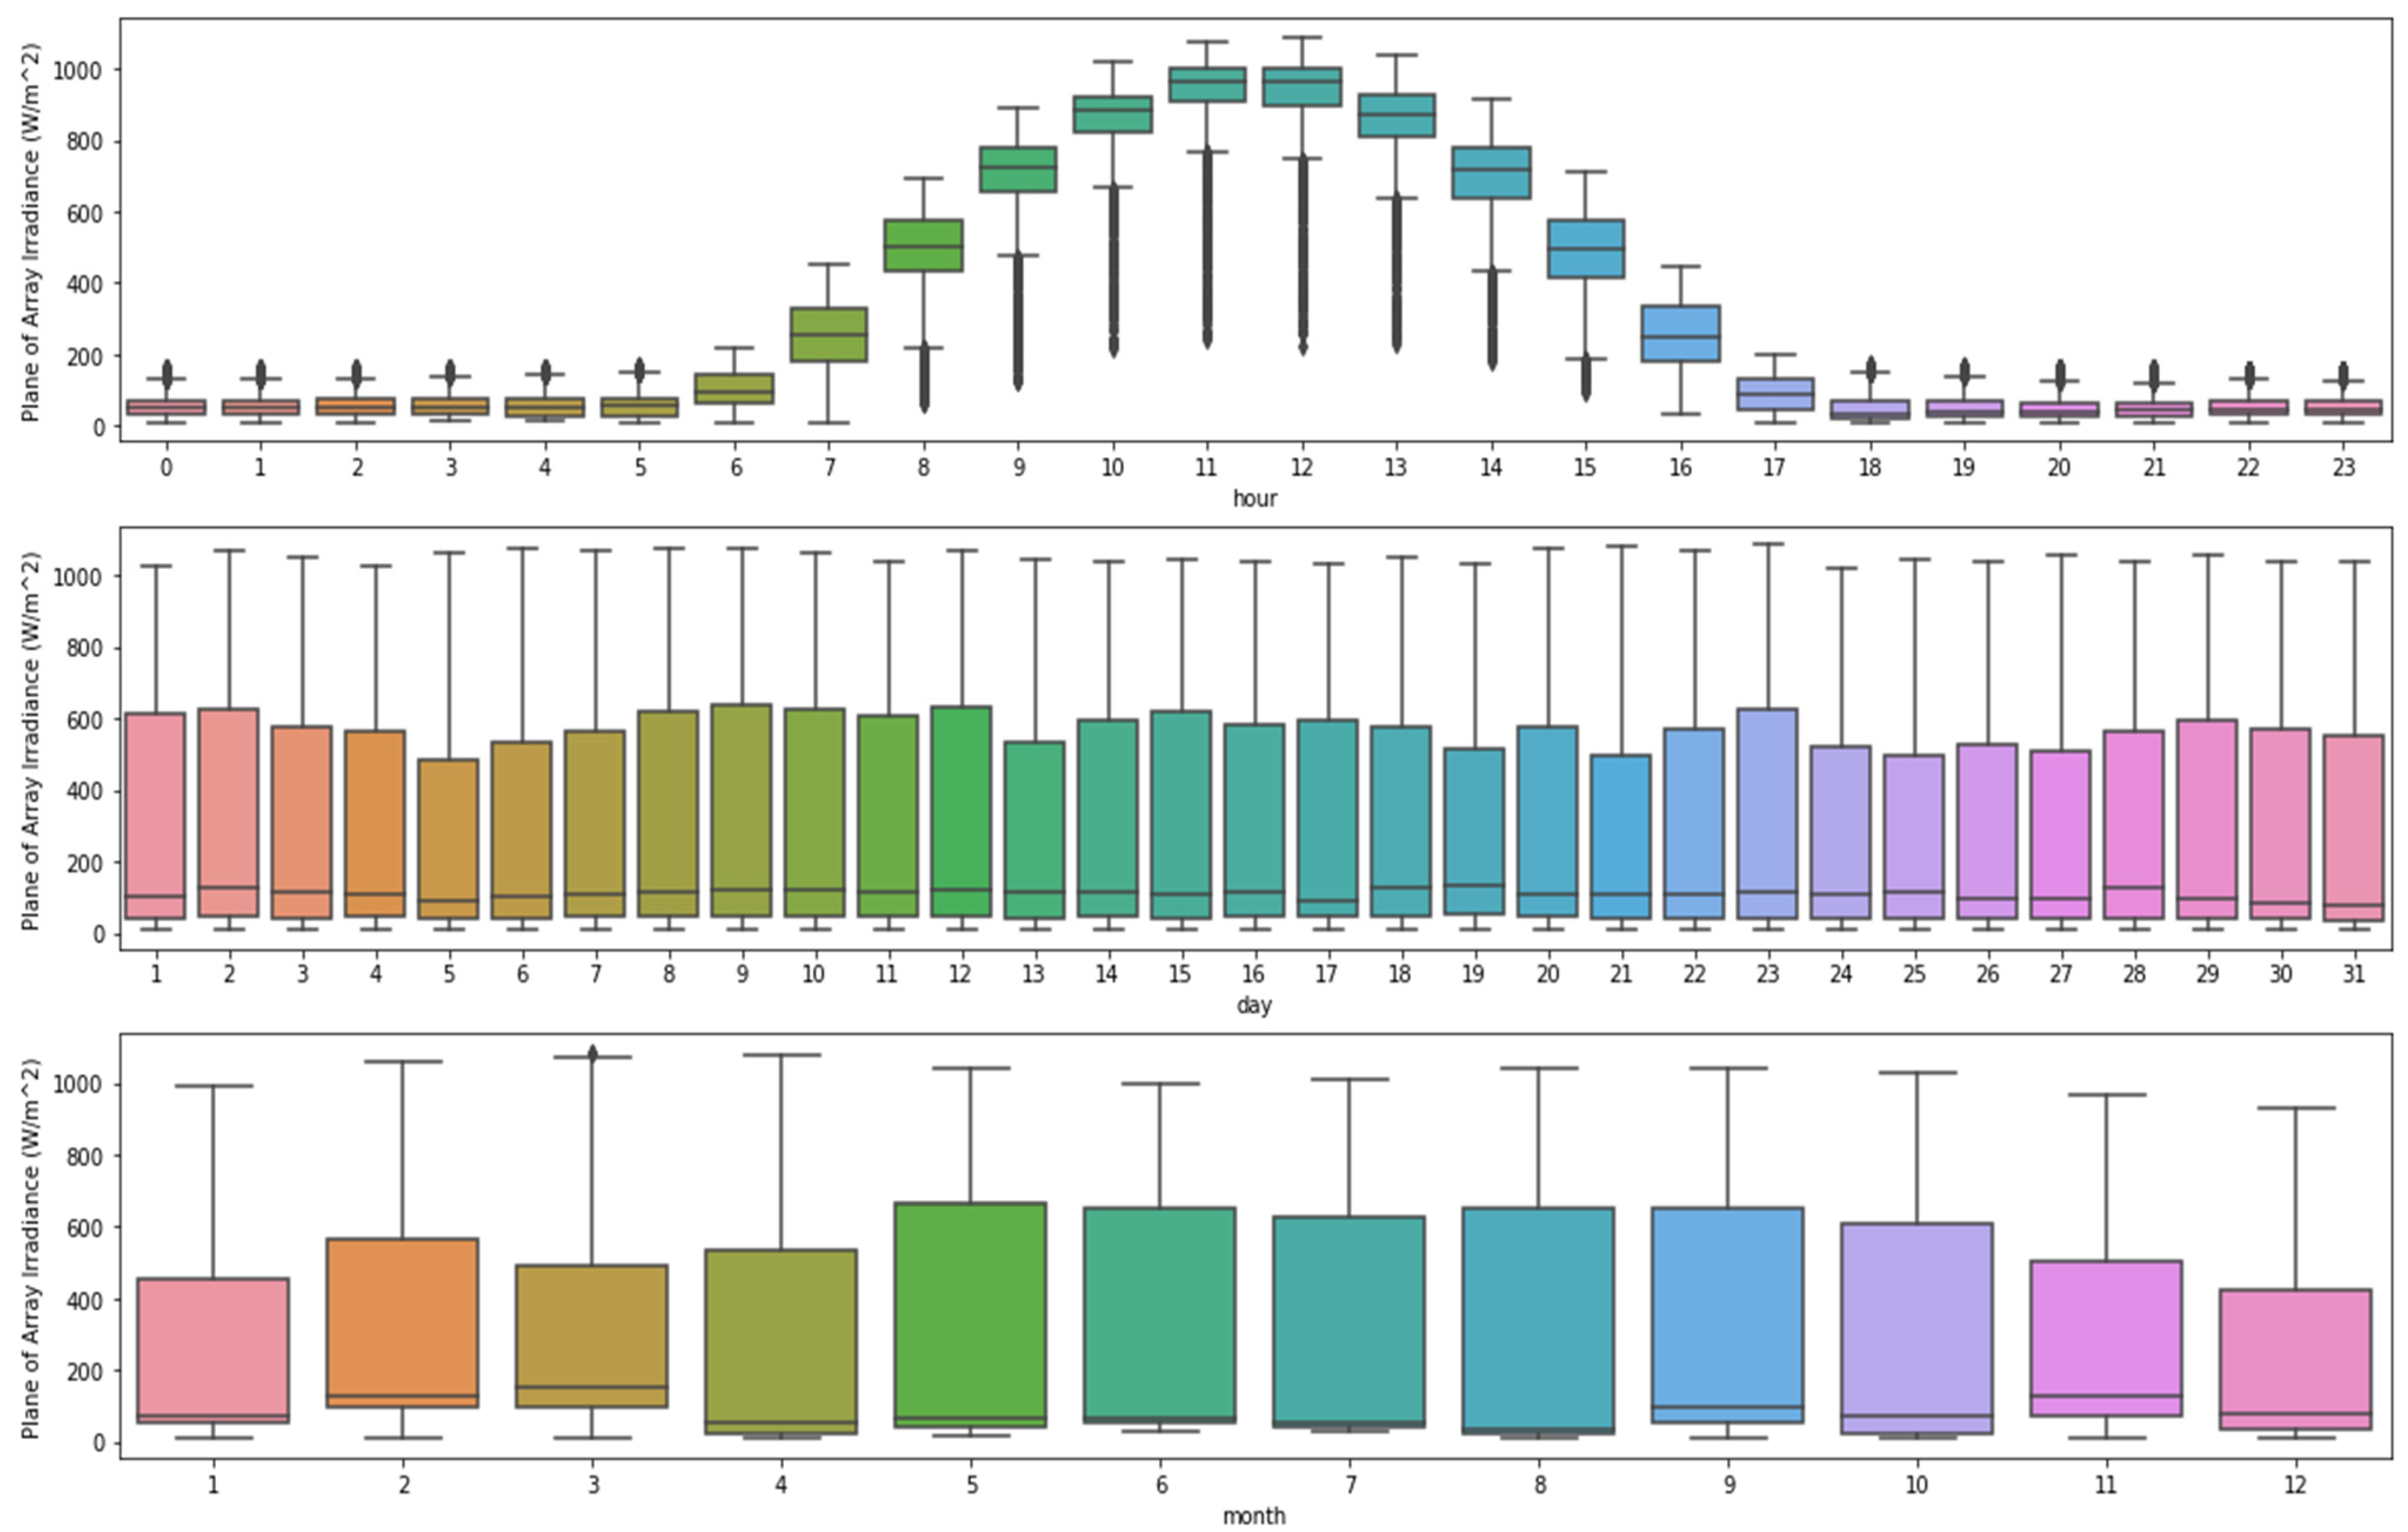
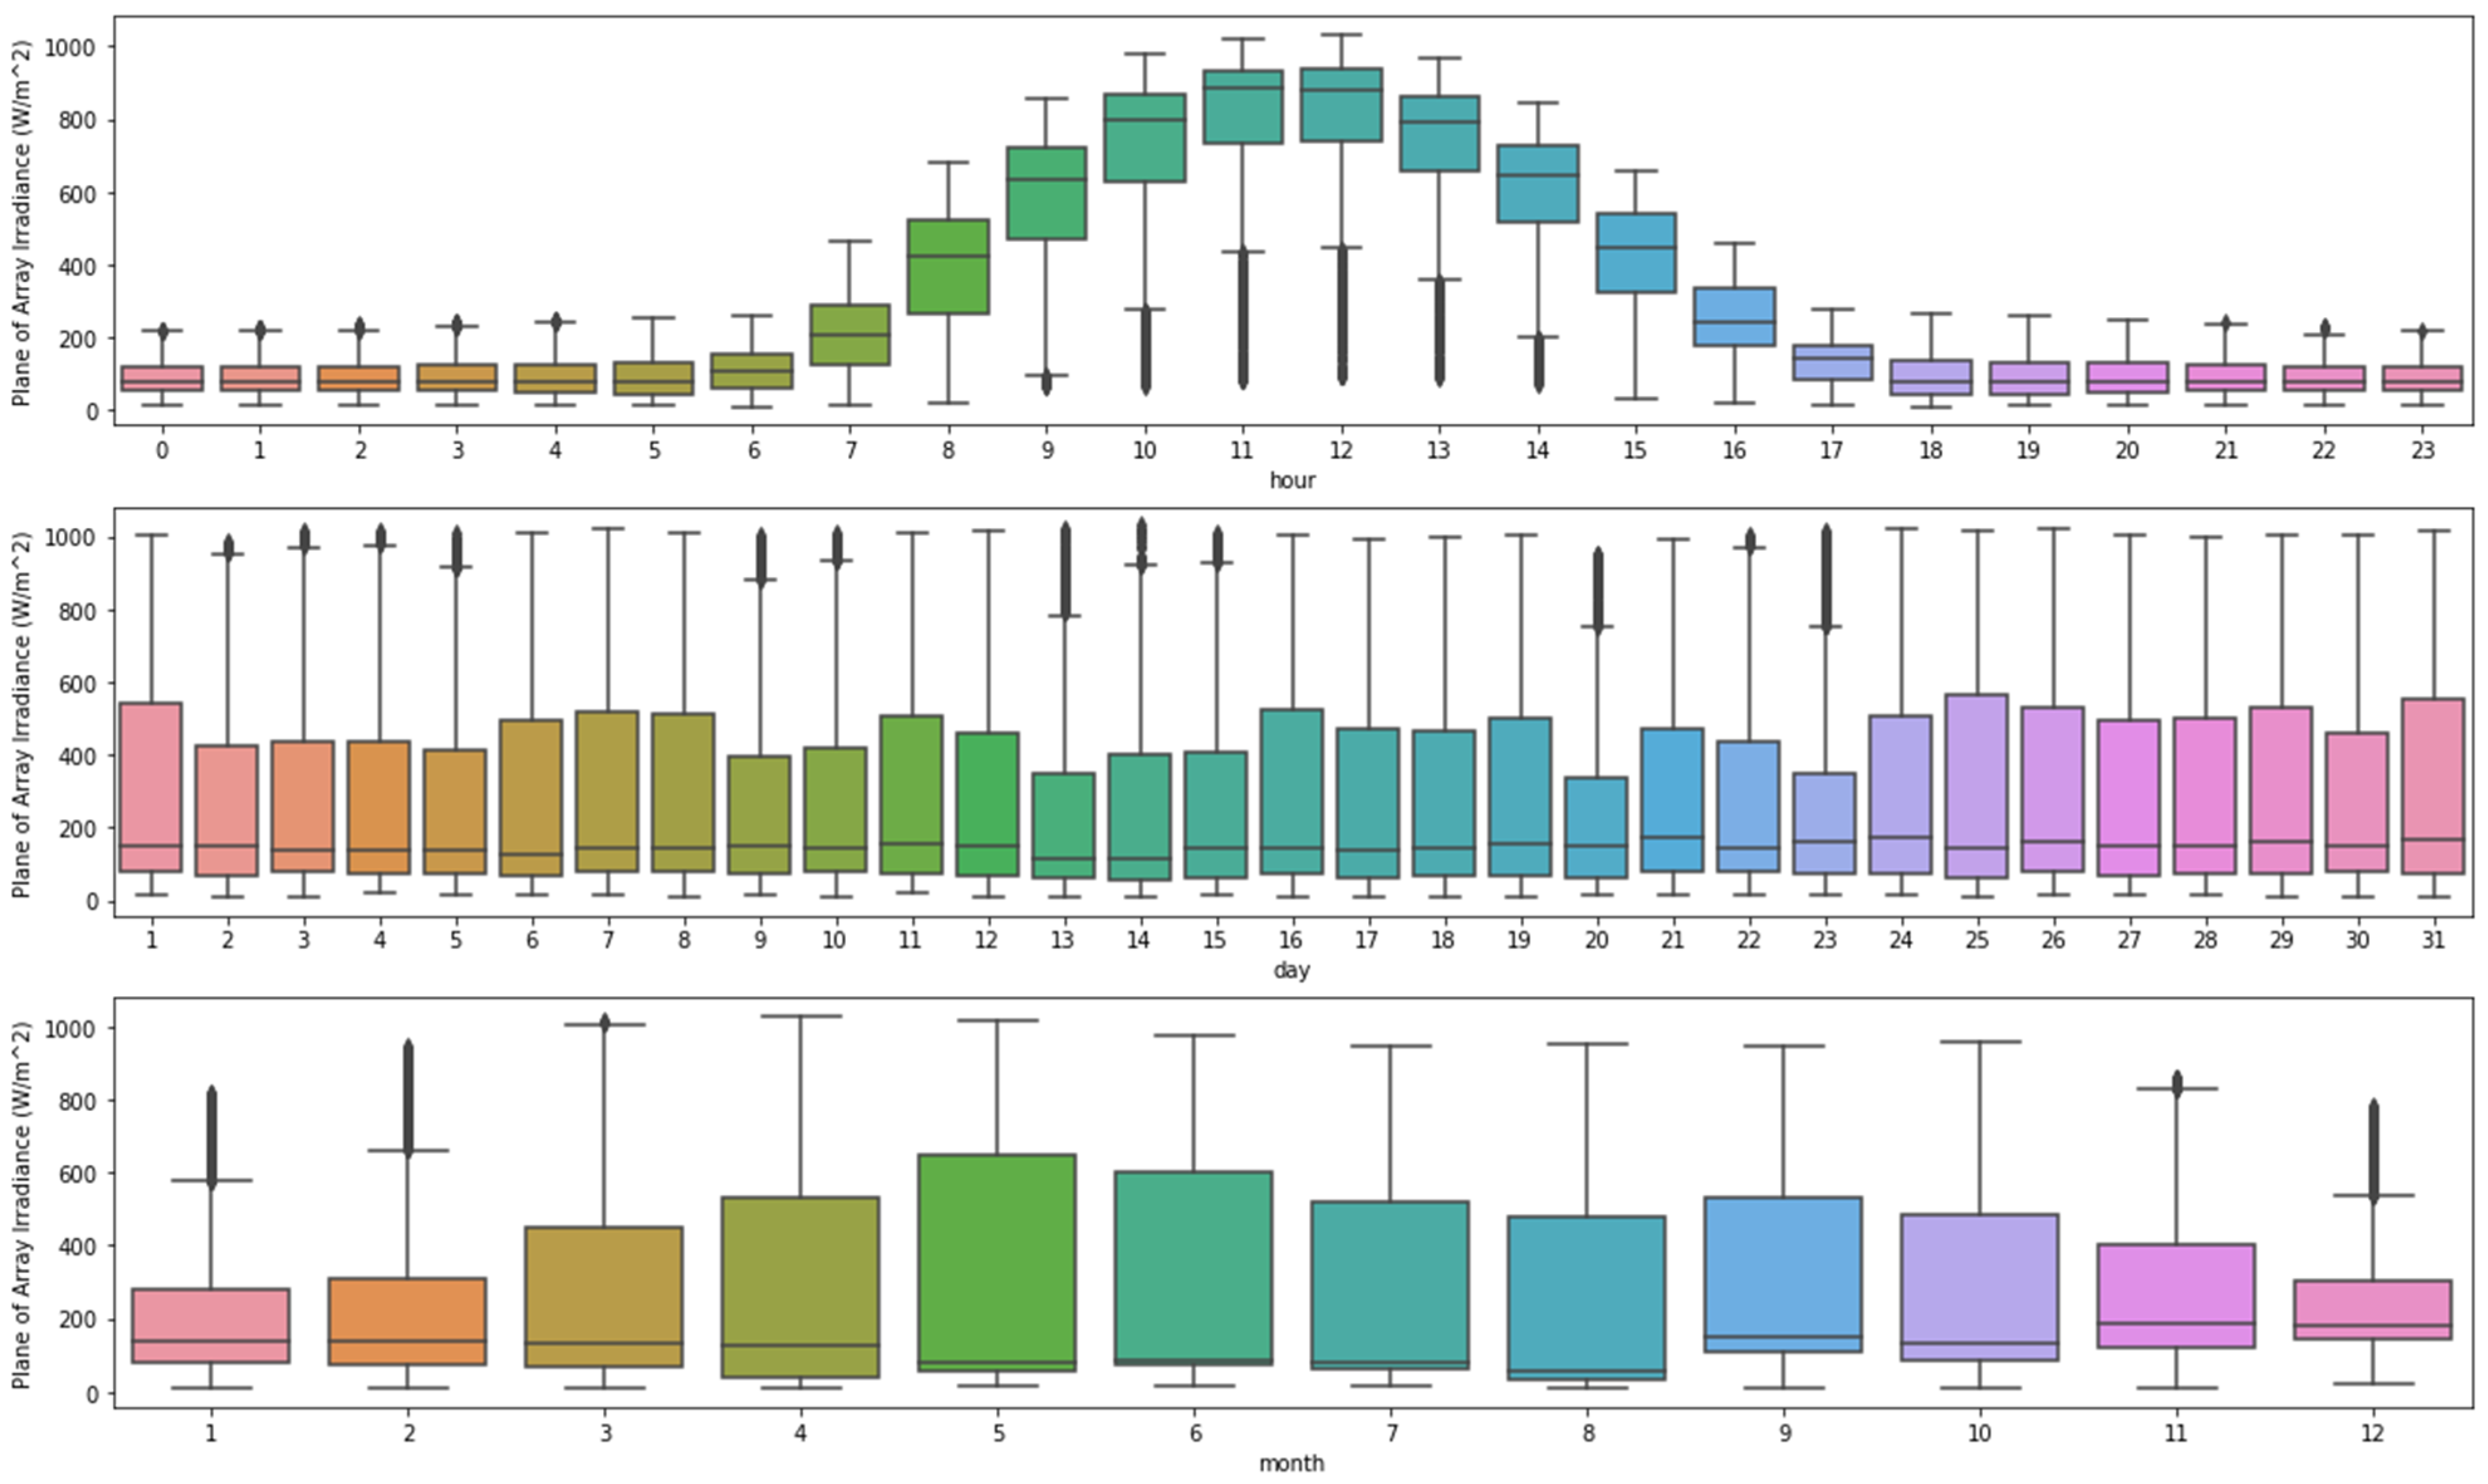
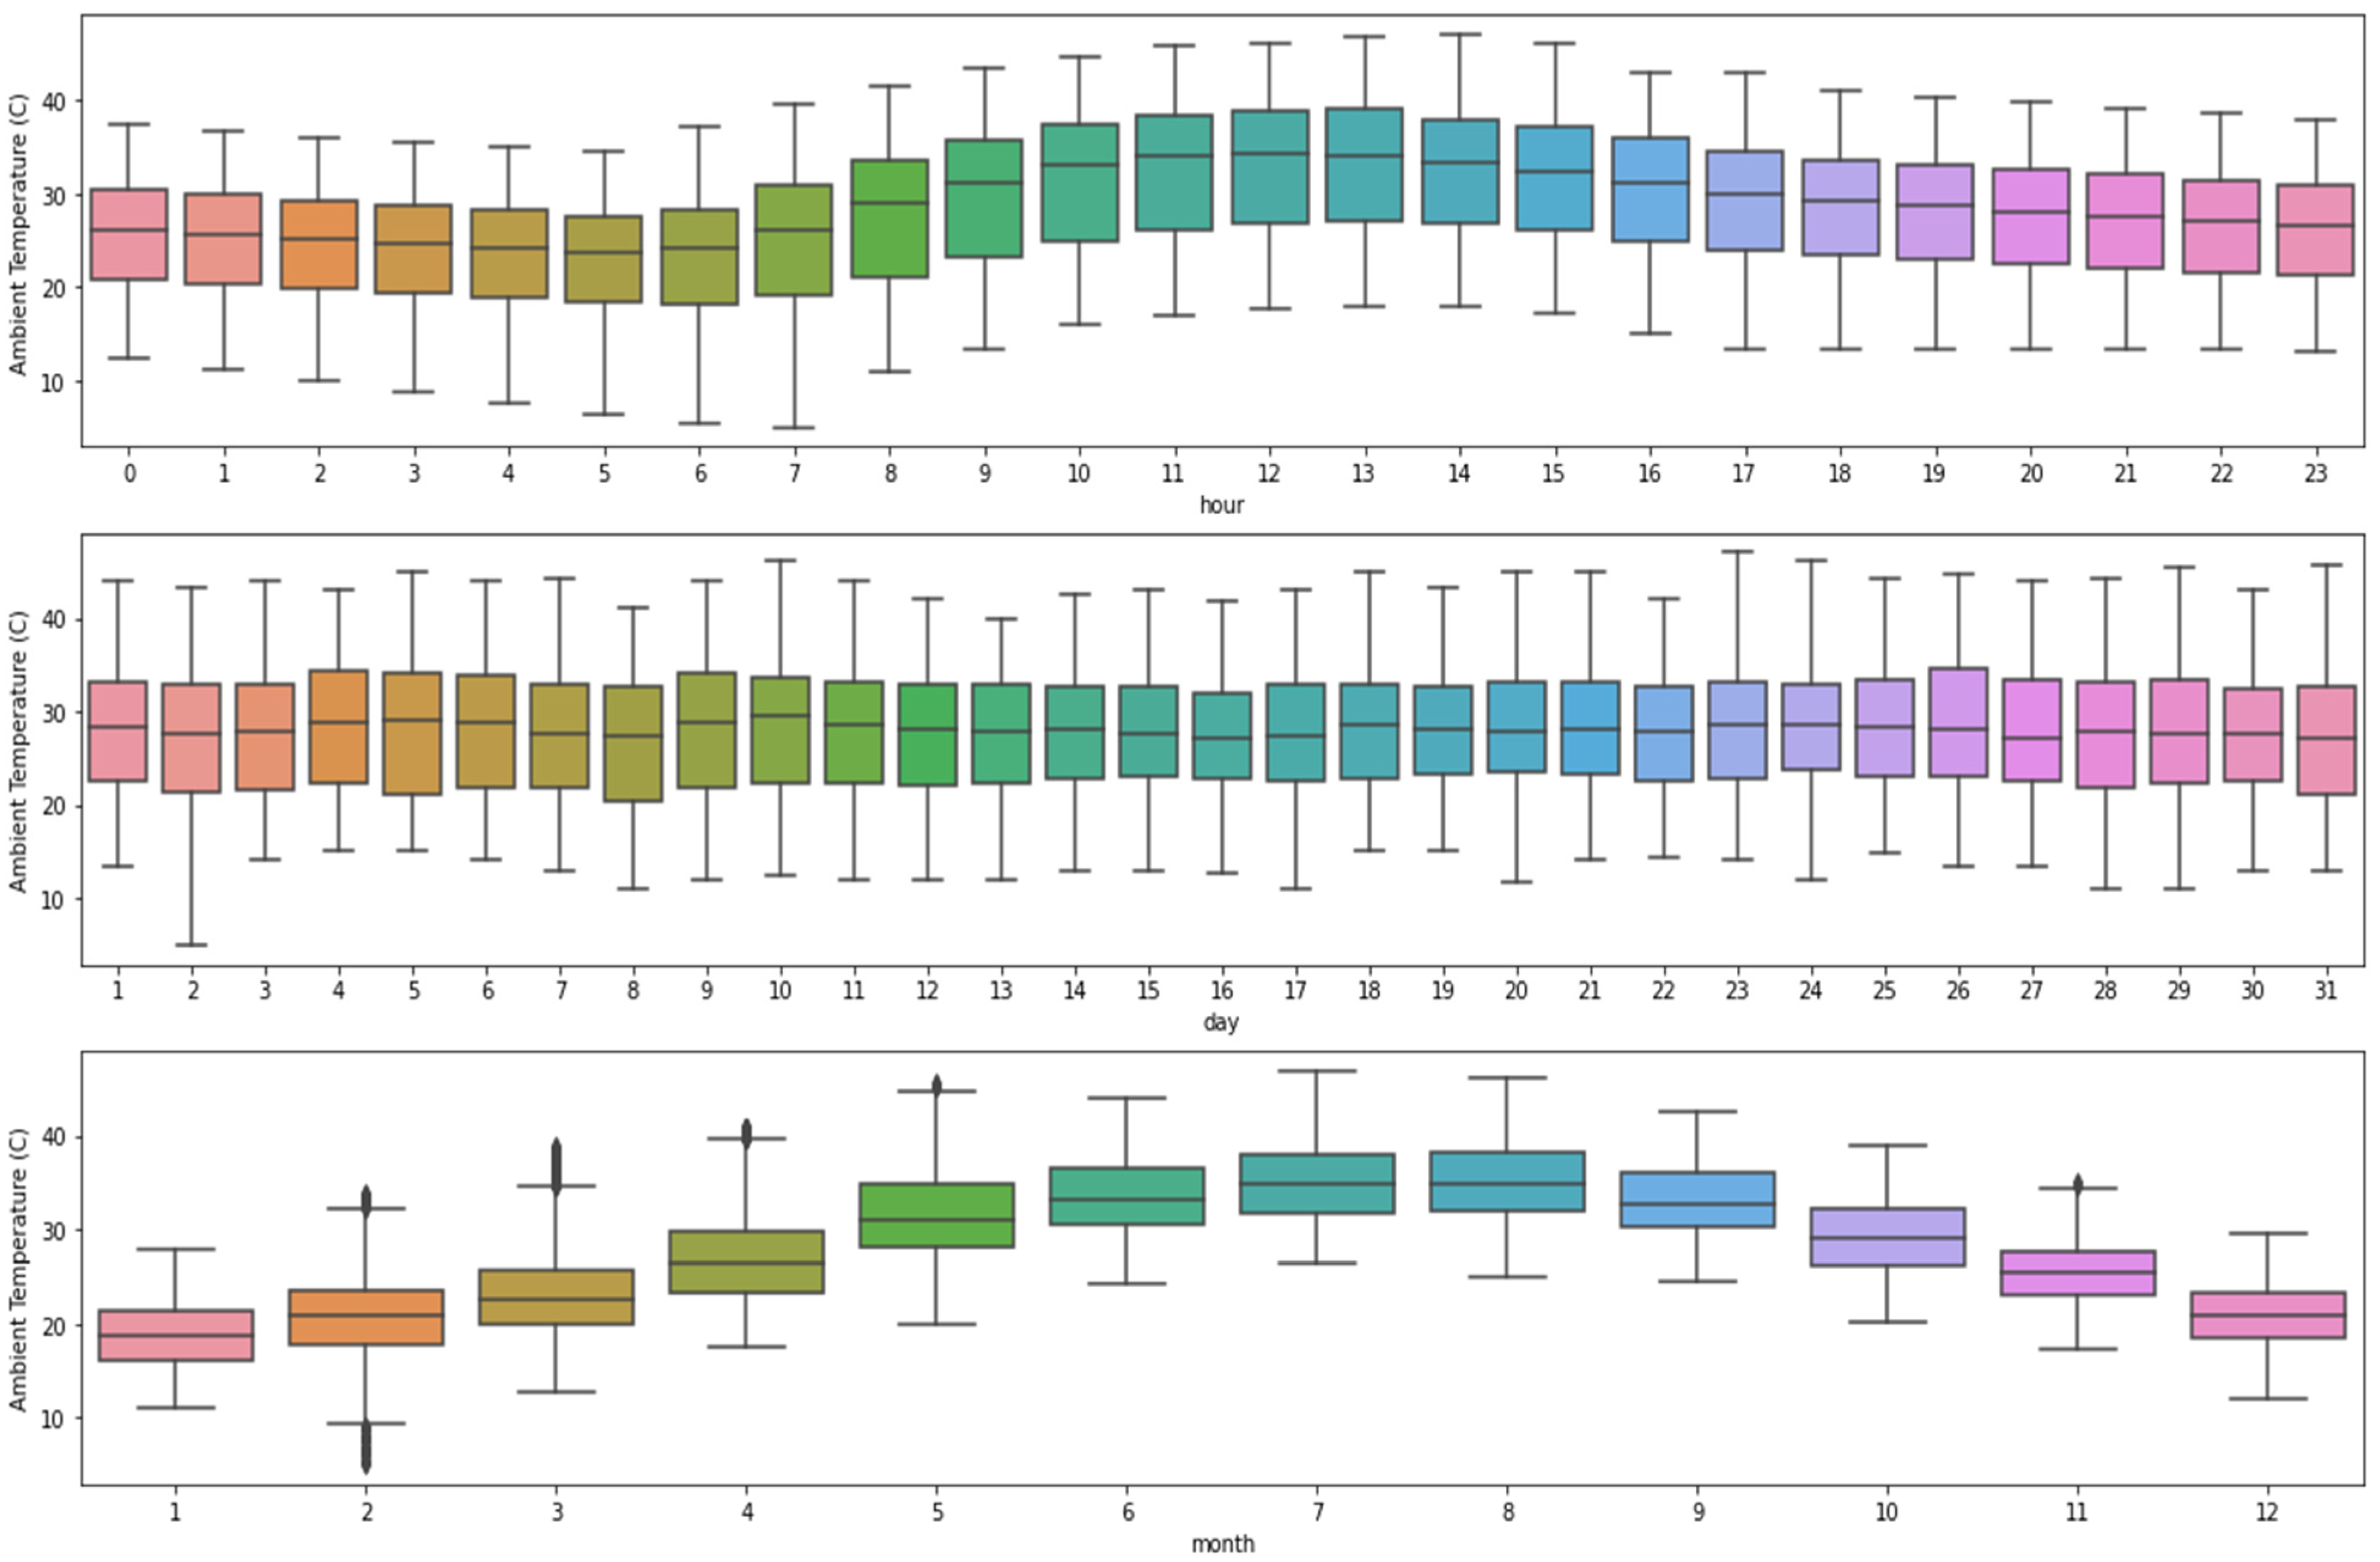
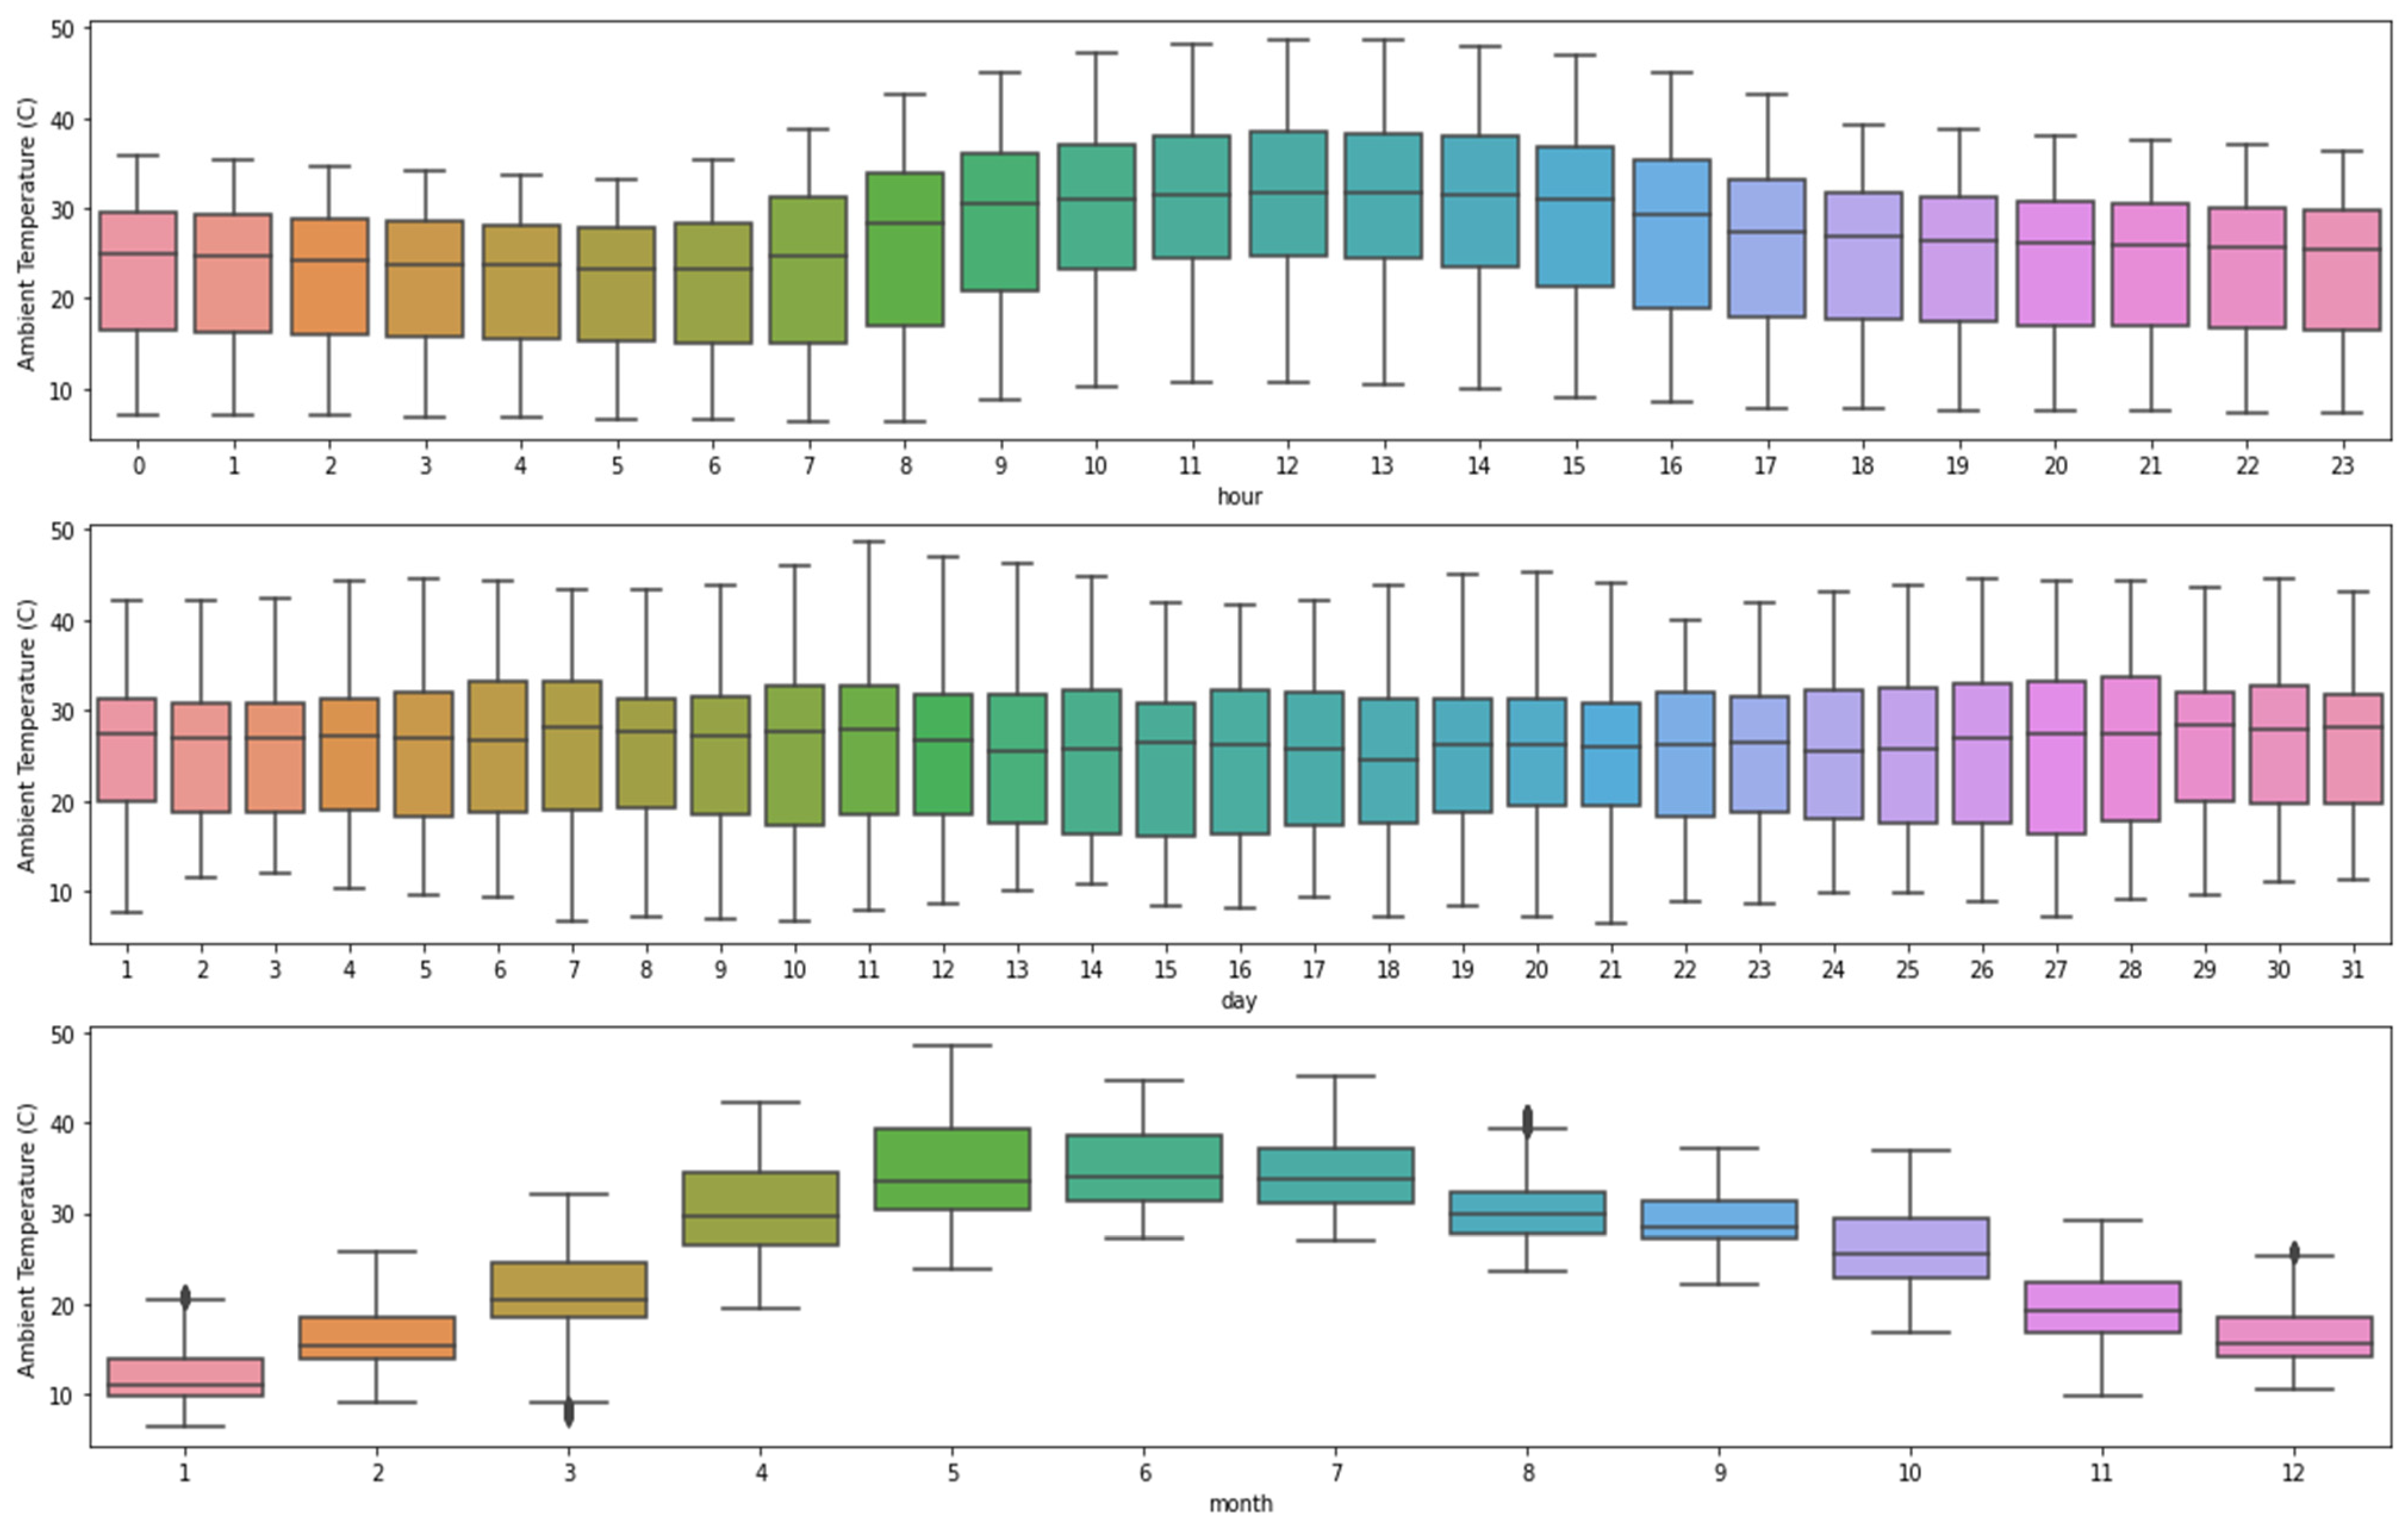
7. Case Studies on Implementation of PV and PV PCM Temperature in Solar PV System for Two Different Geographical Locations UAE and Islamabad
- Beam irradiance (W/m2)
- Diffuse irradiance (W/m2)
- Ambient temperature (°C)
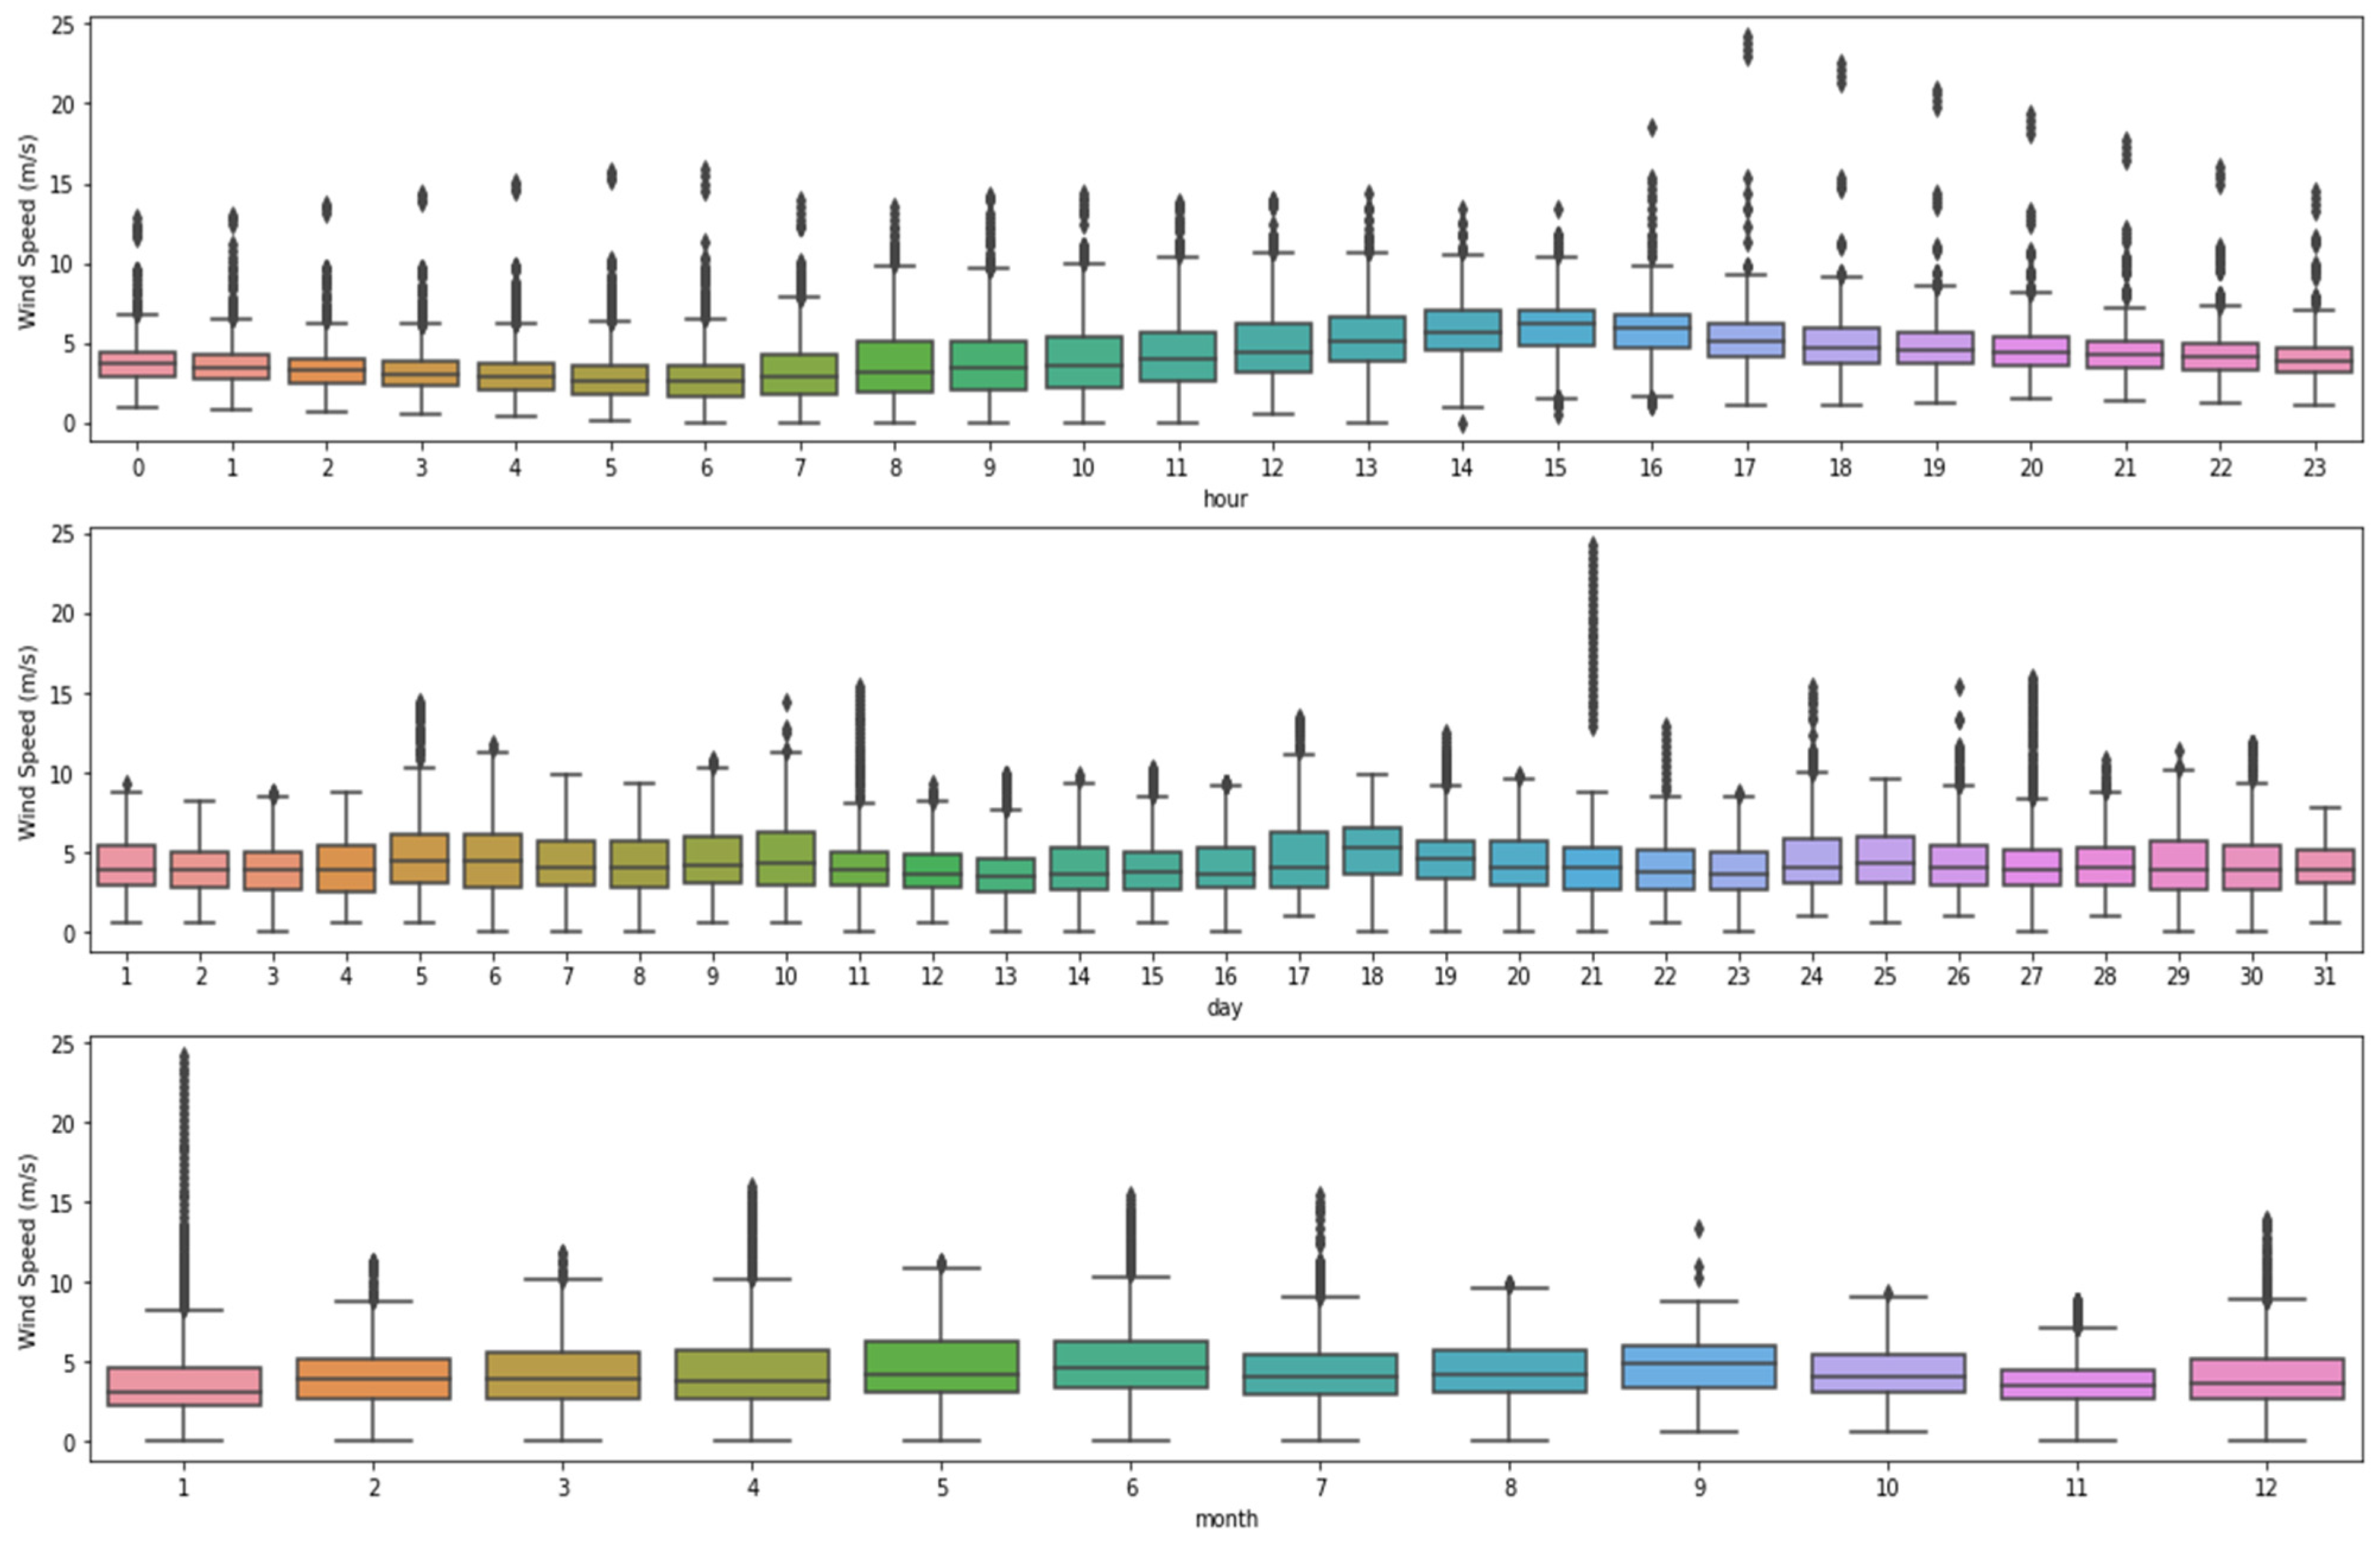
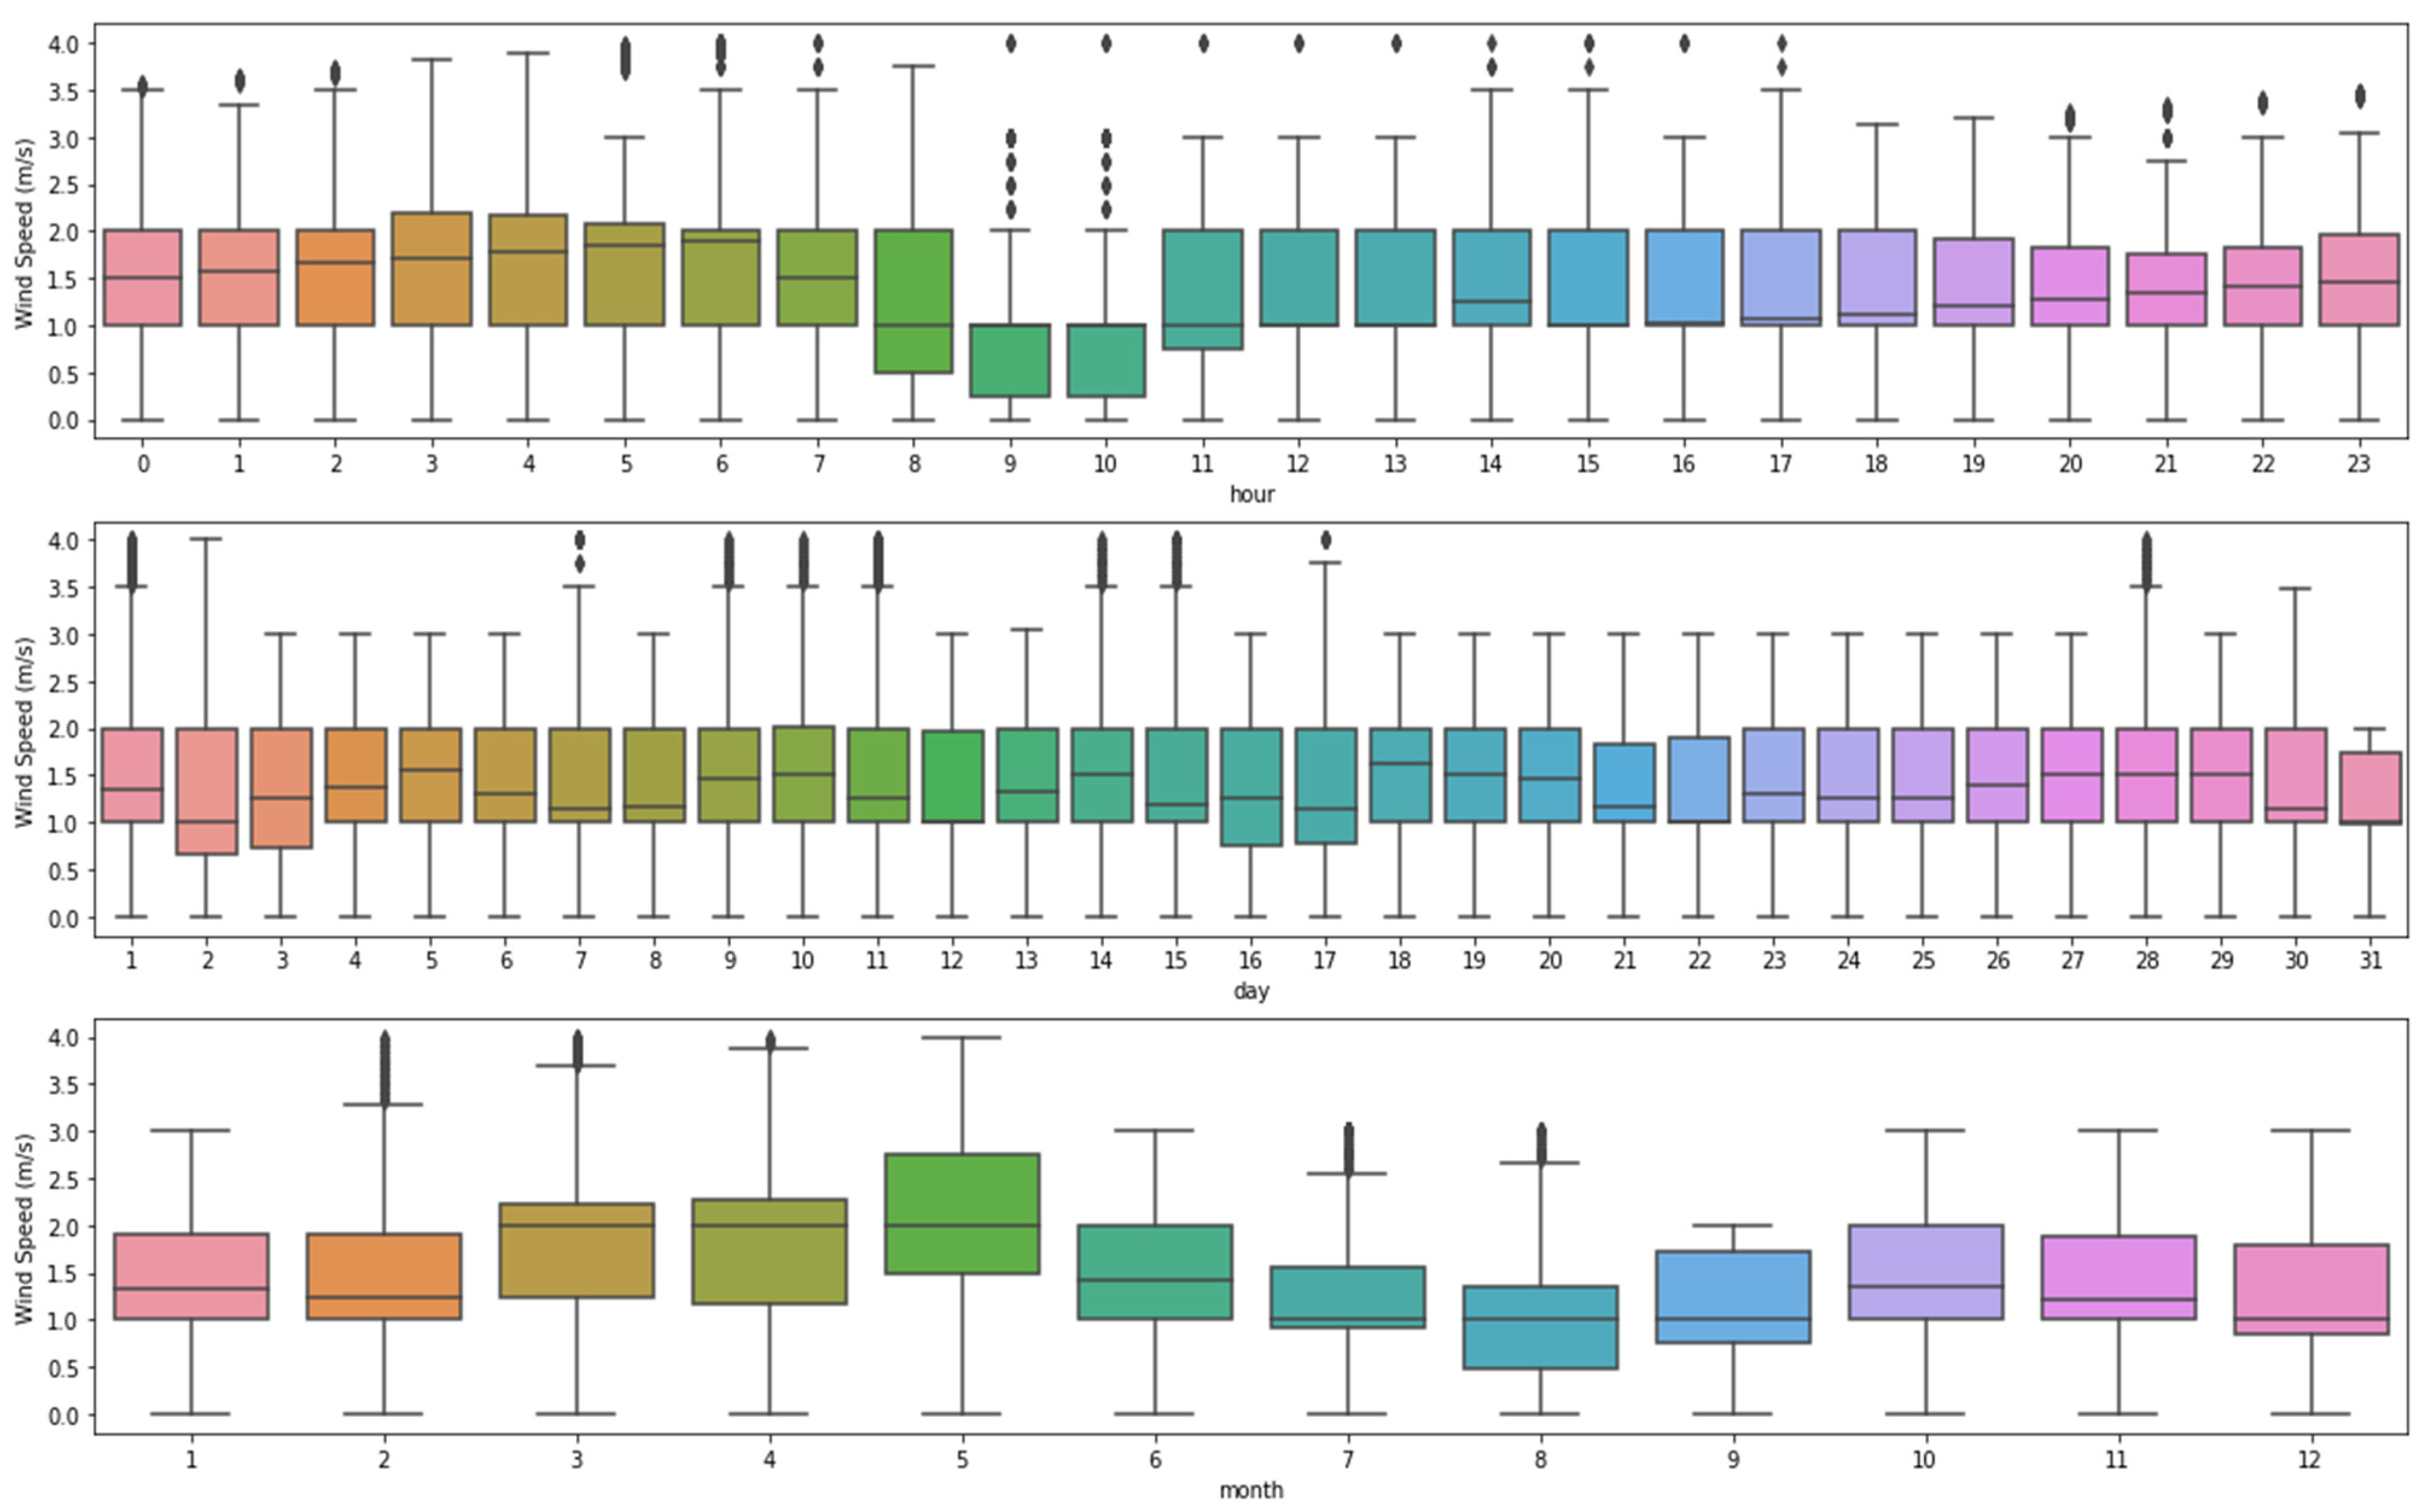
- Wind speed (m/s)
- Plane of array irradiance (W/m2)
7.1. UAE and Islamabad Irradiance
7.2. Ambient Temperature of UAE and Islamabad
7.3. Wind Speed of UAE and Islamabad
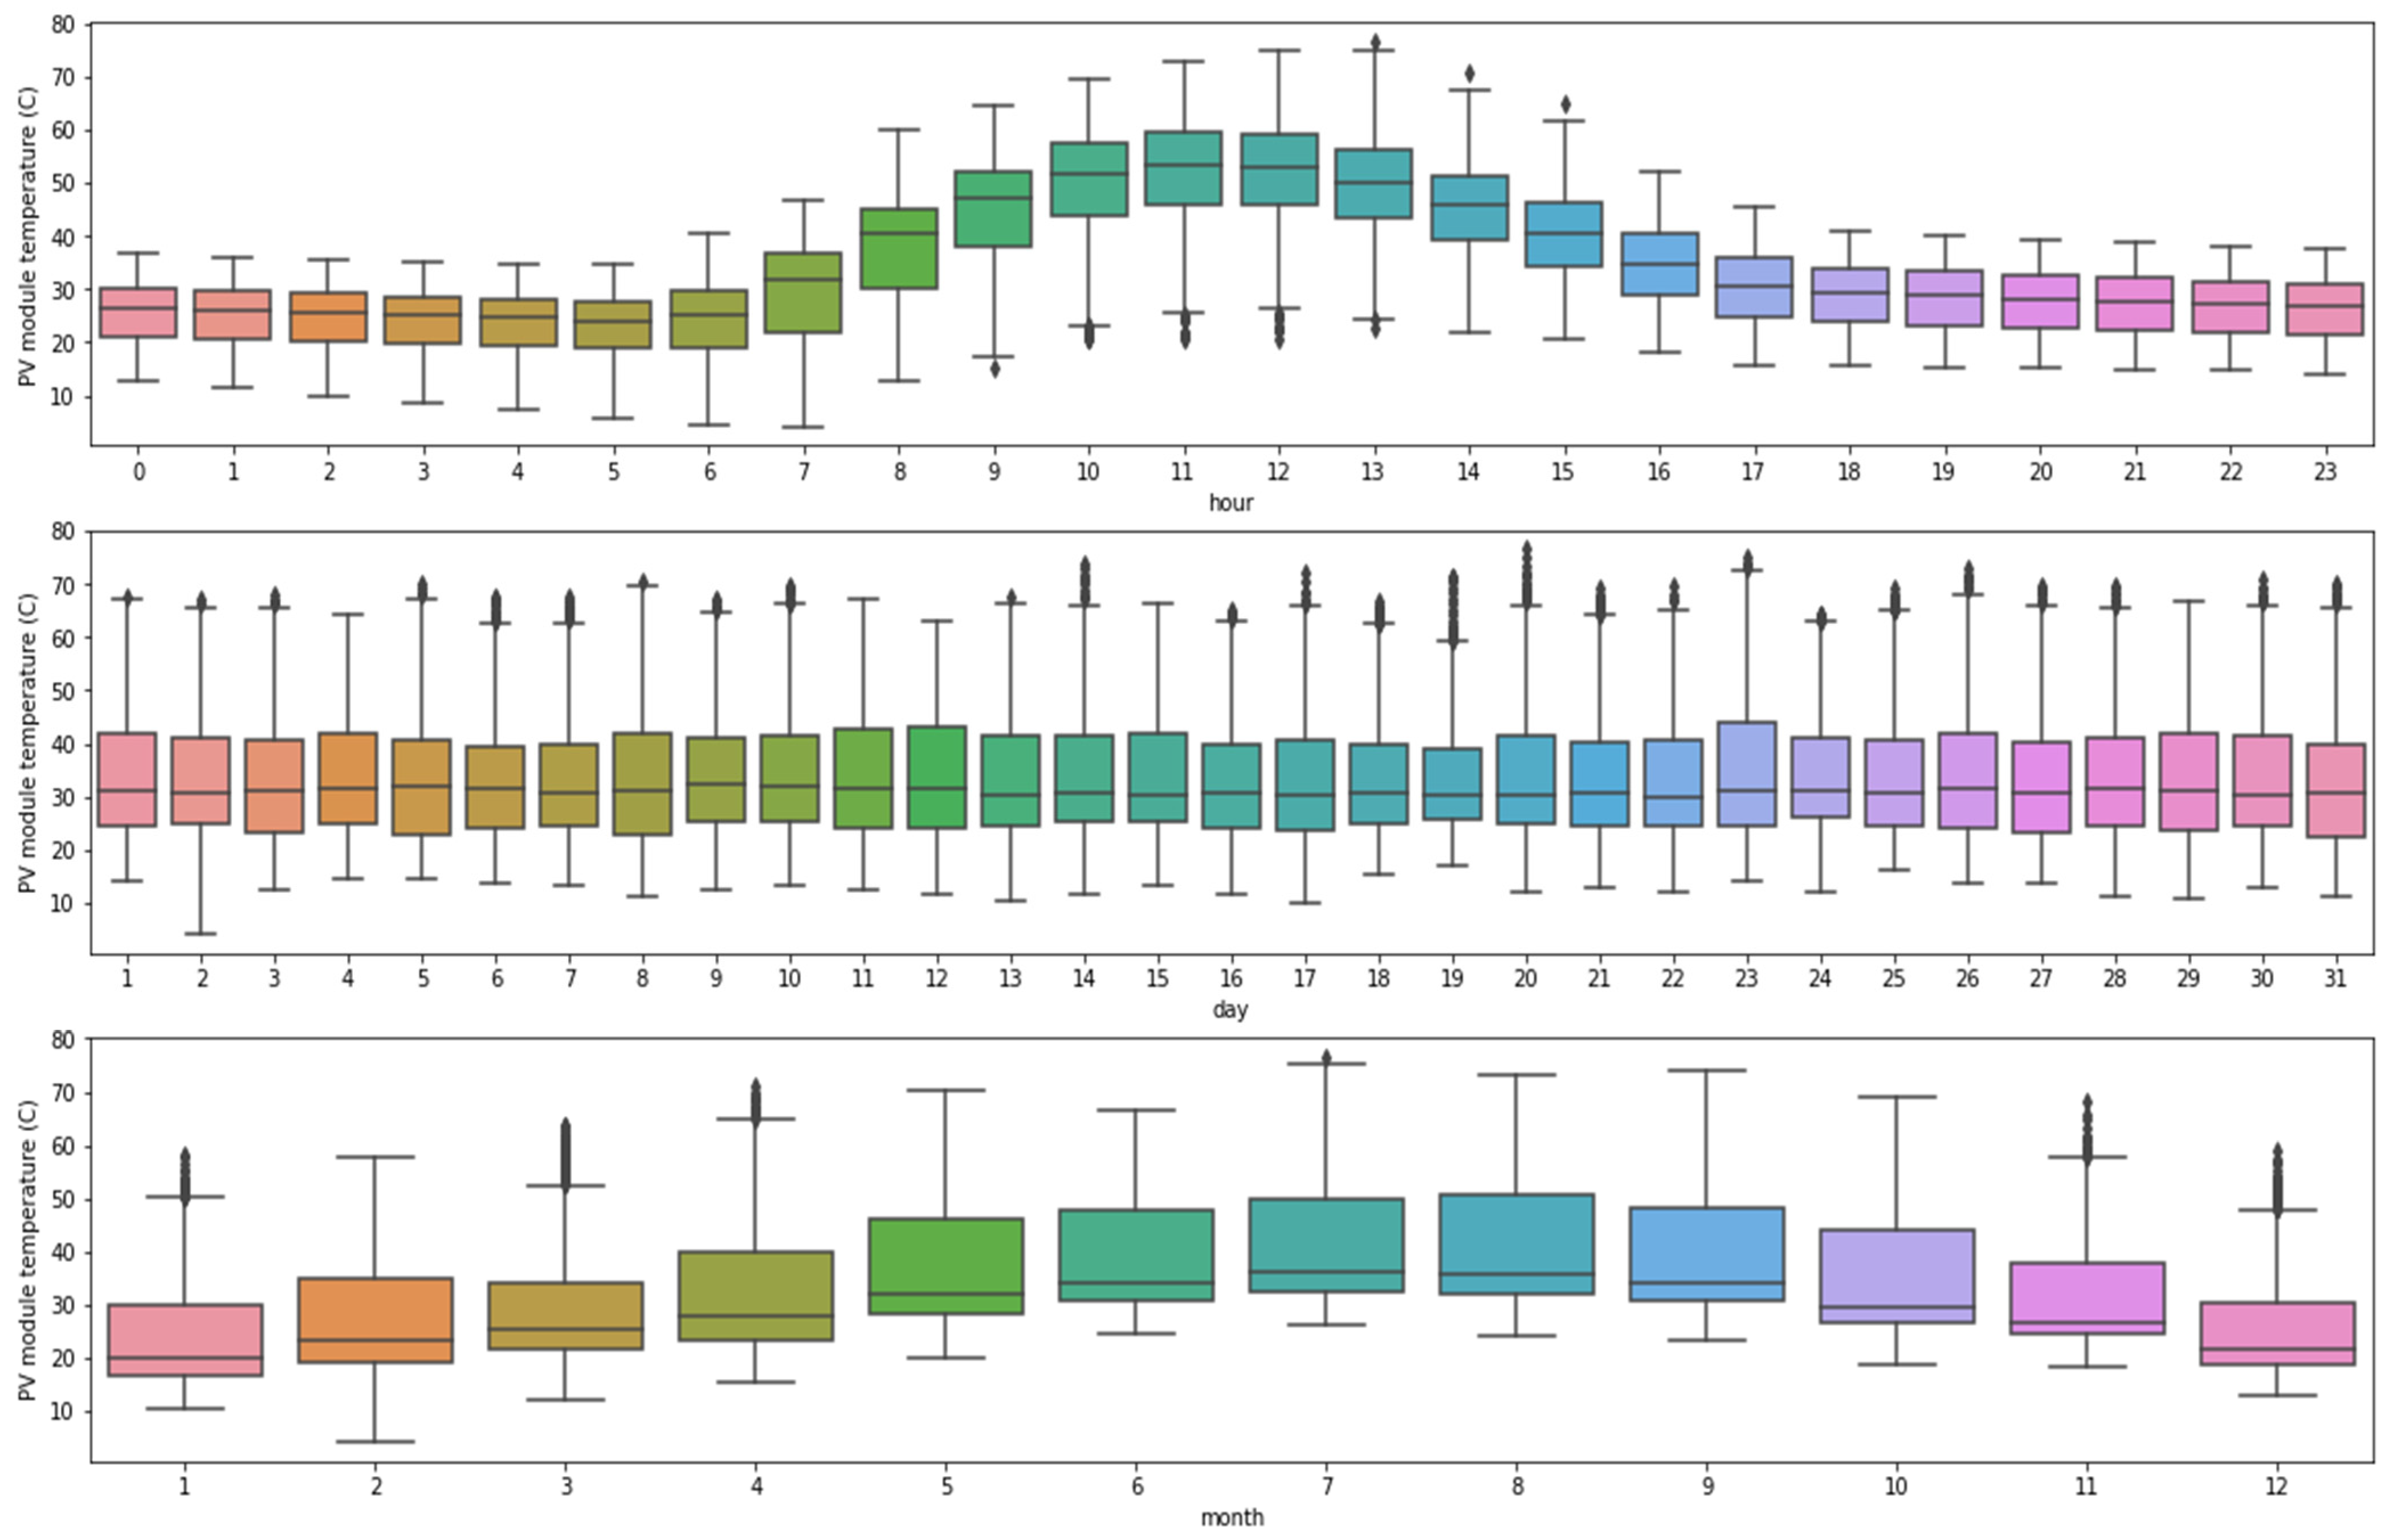
7.4. PV Module Temperature of UAE and Islamabad
7.5. PV-PCM Performance Assessment
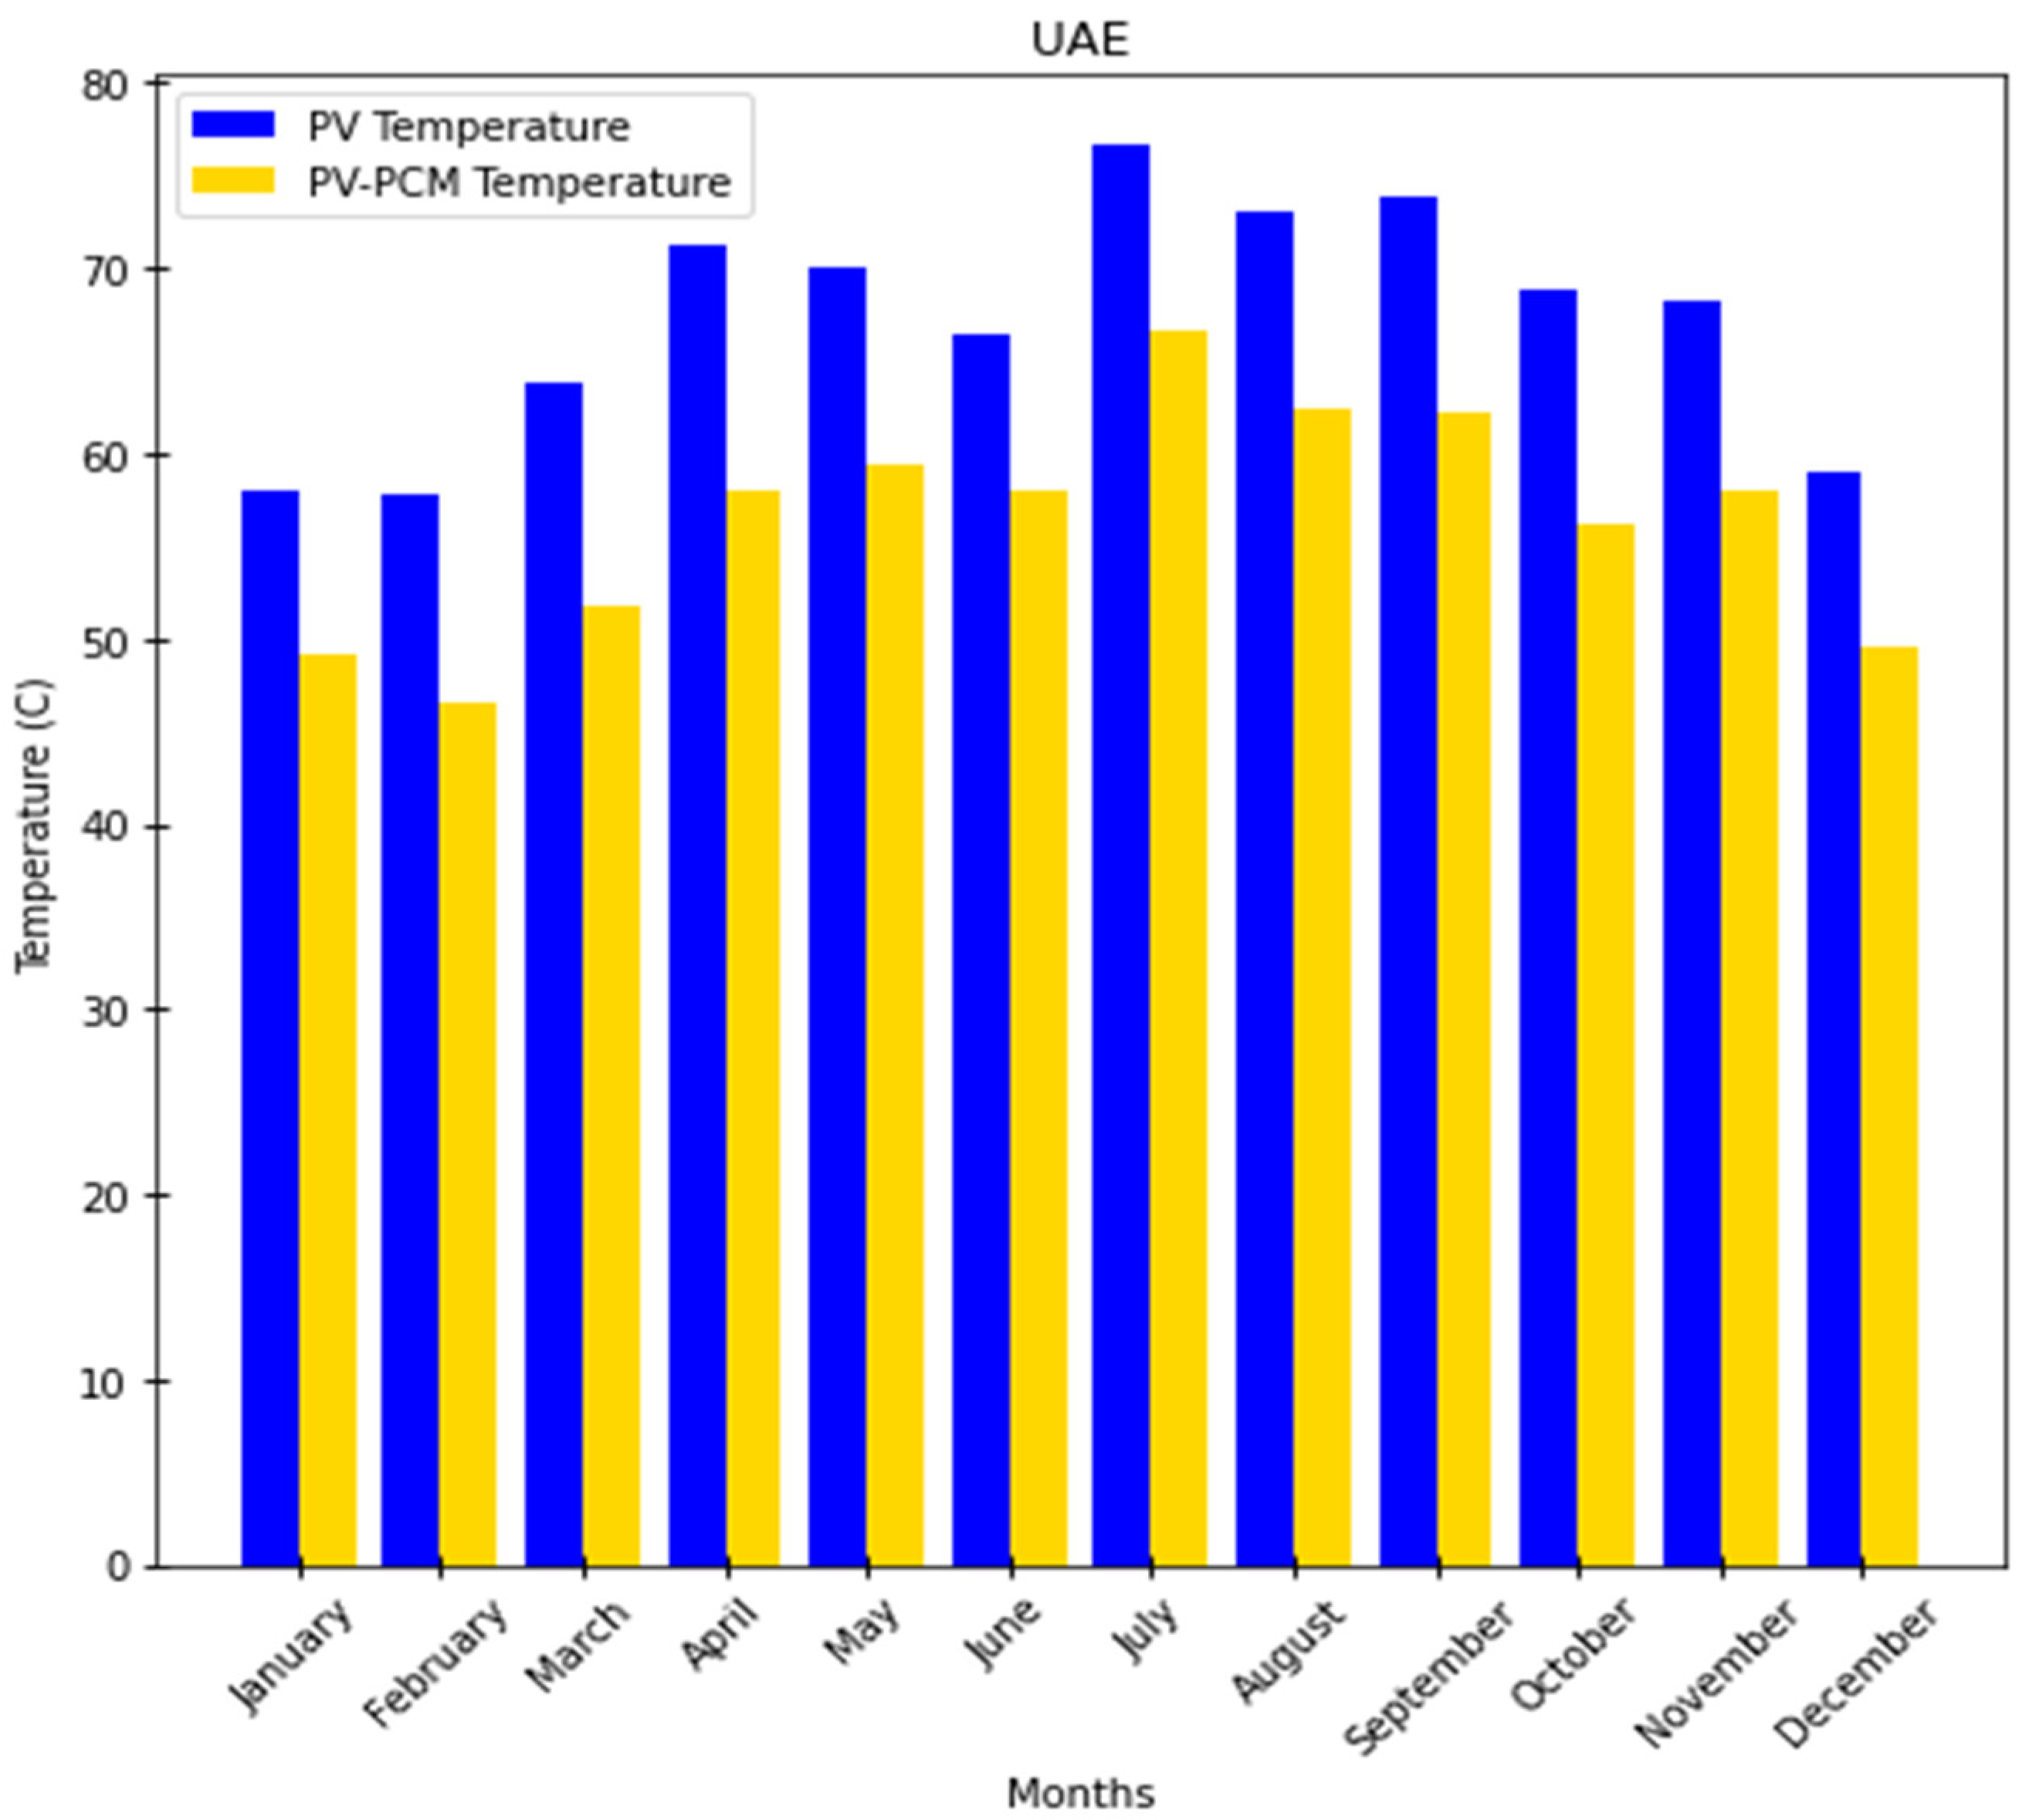
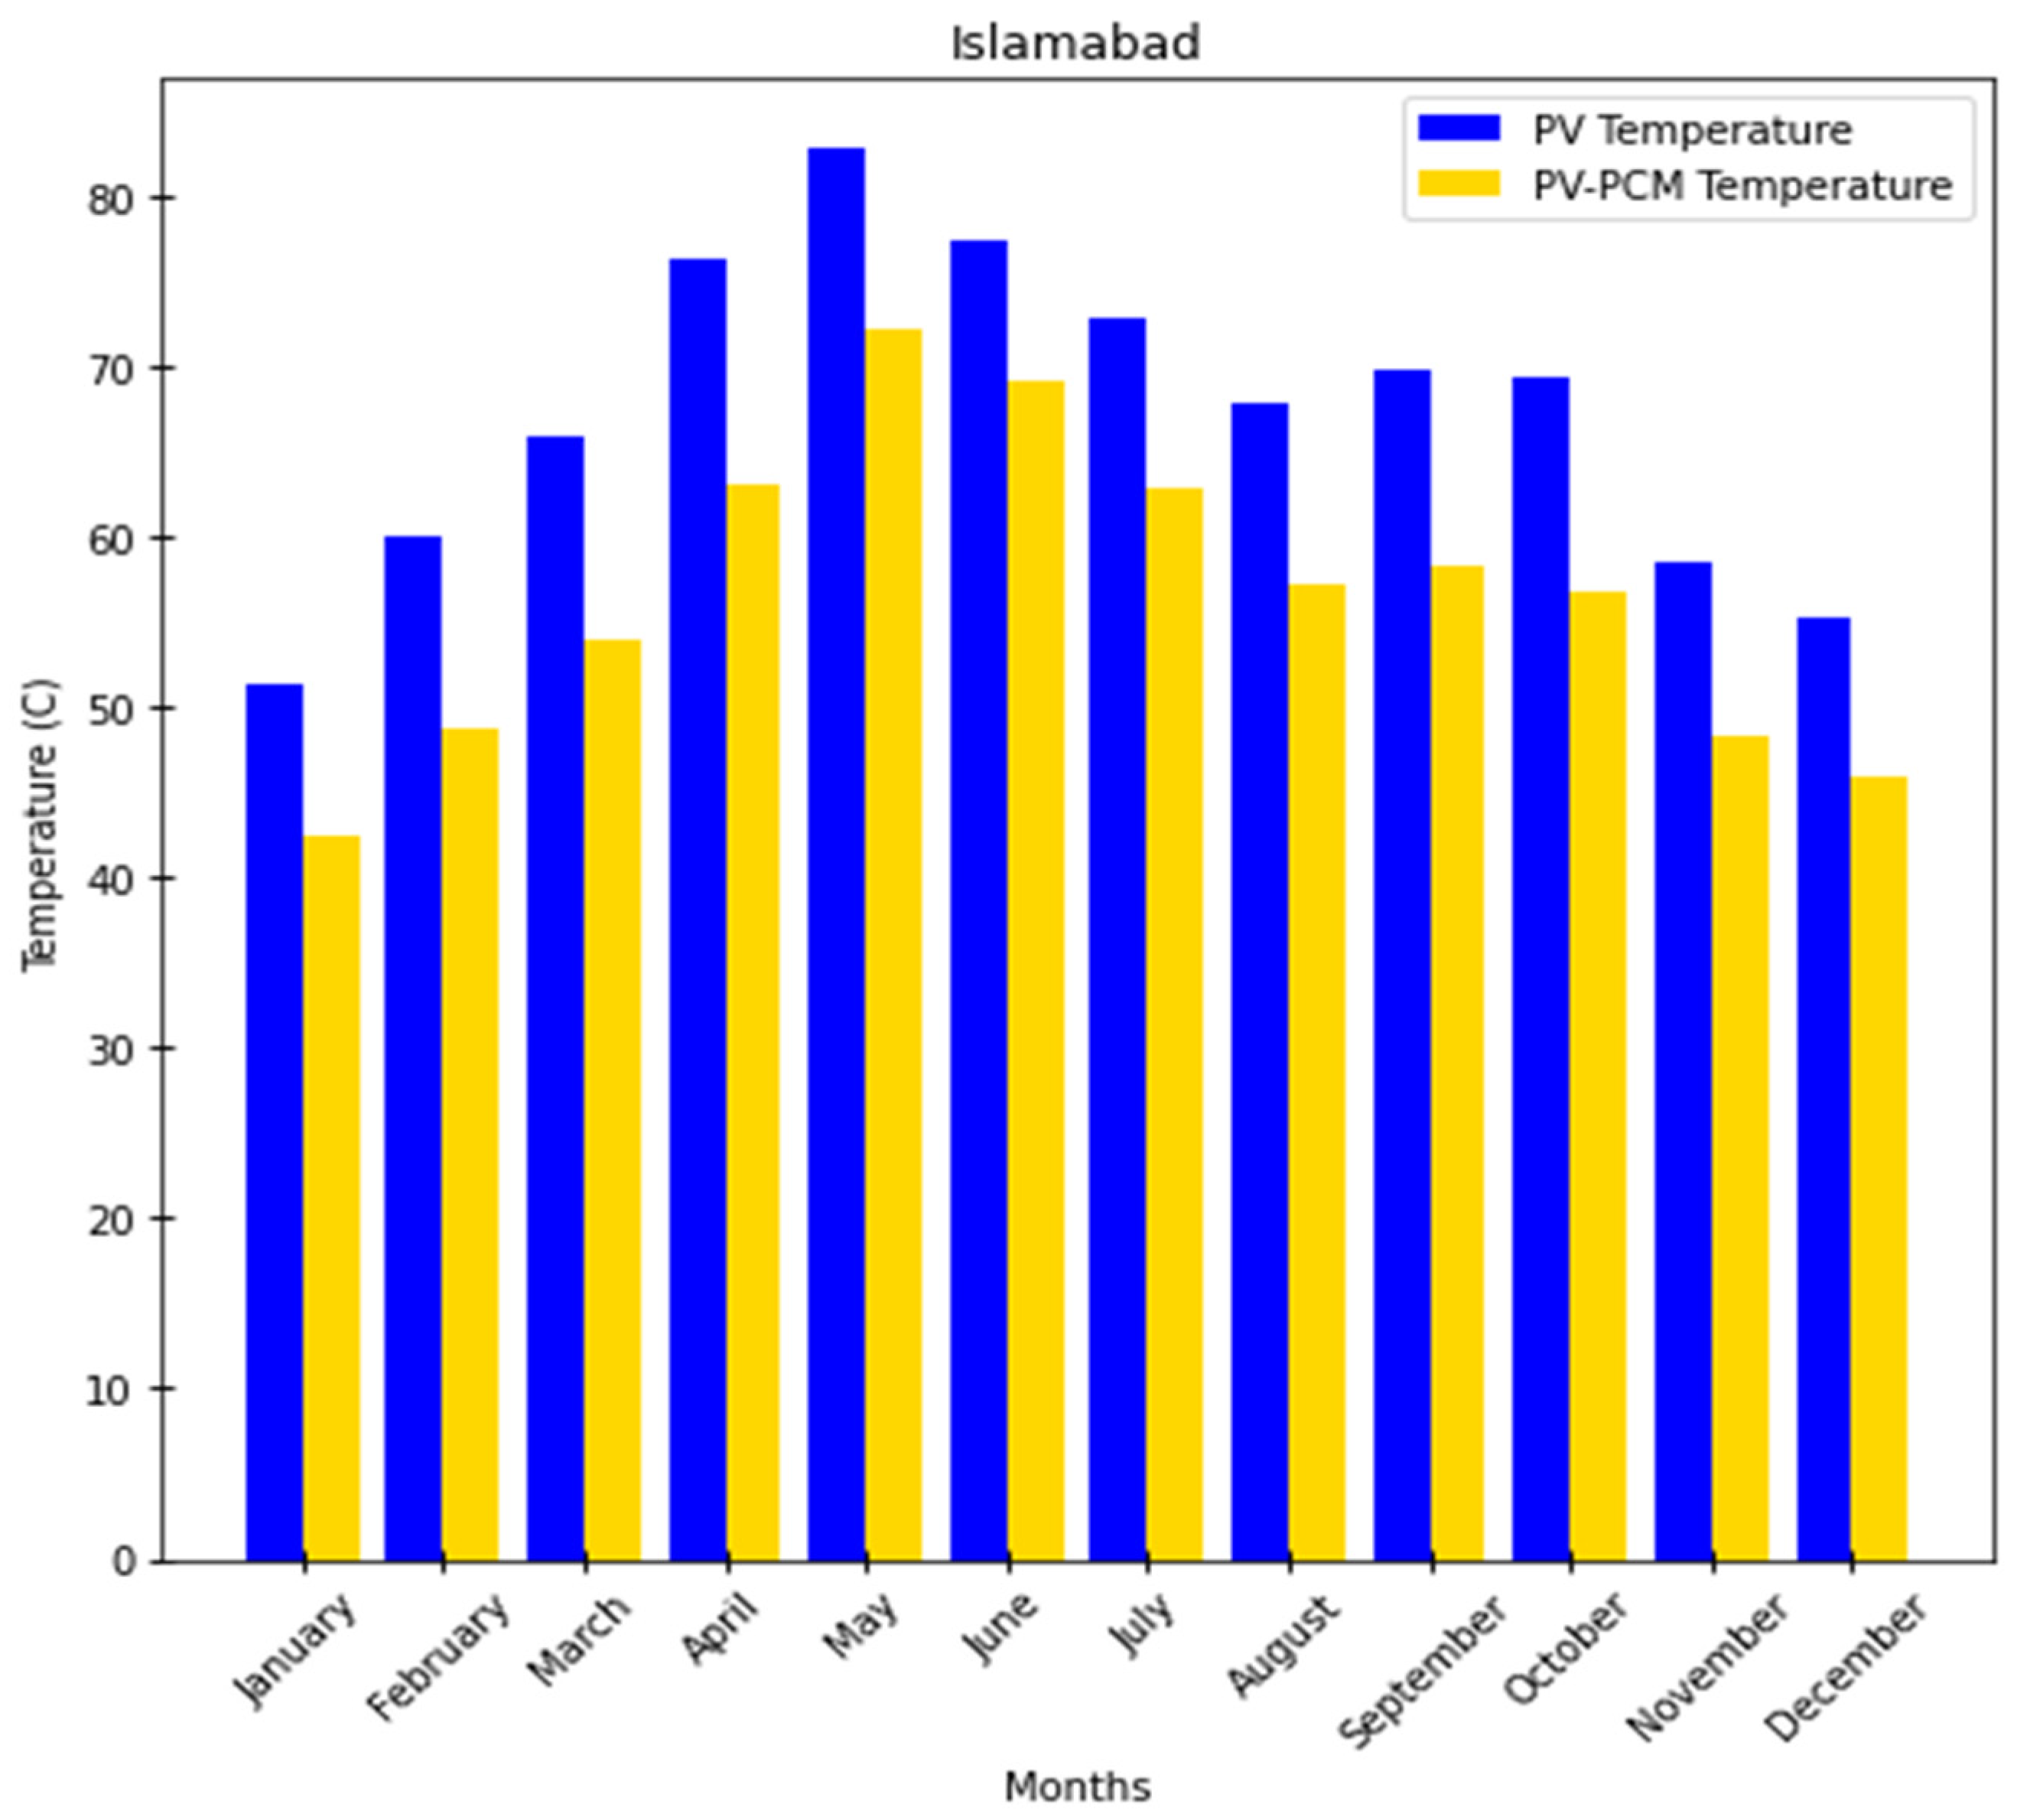
7.5.1. PV Temperature and PV-PCM Temperature
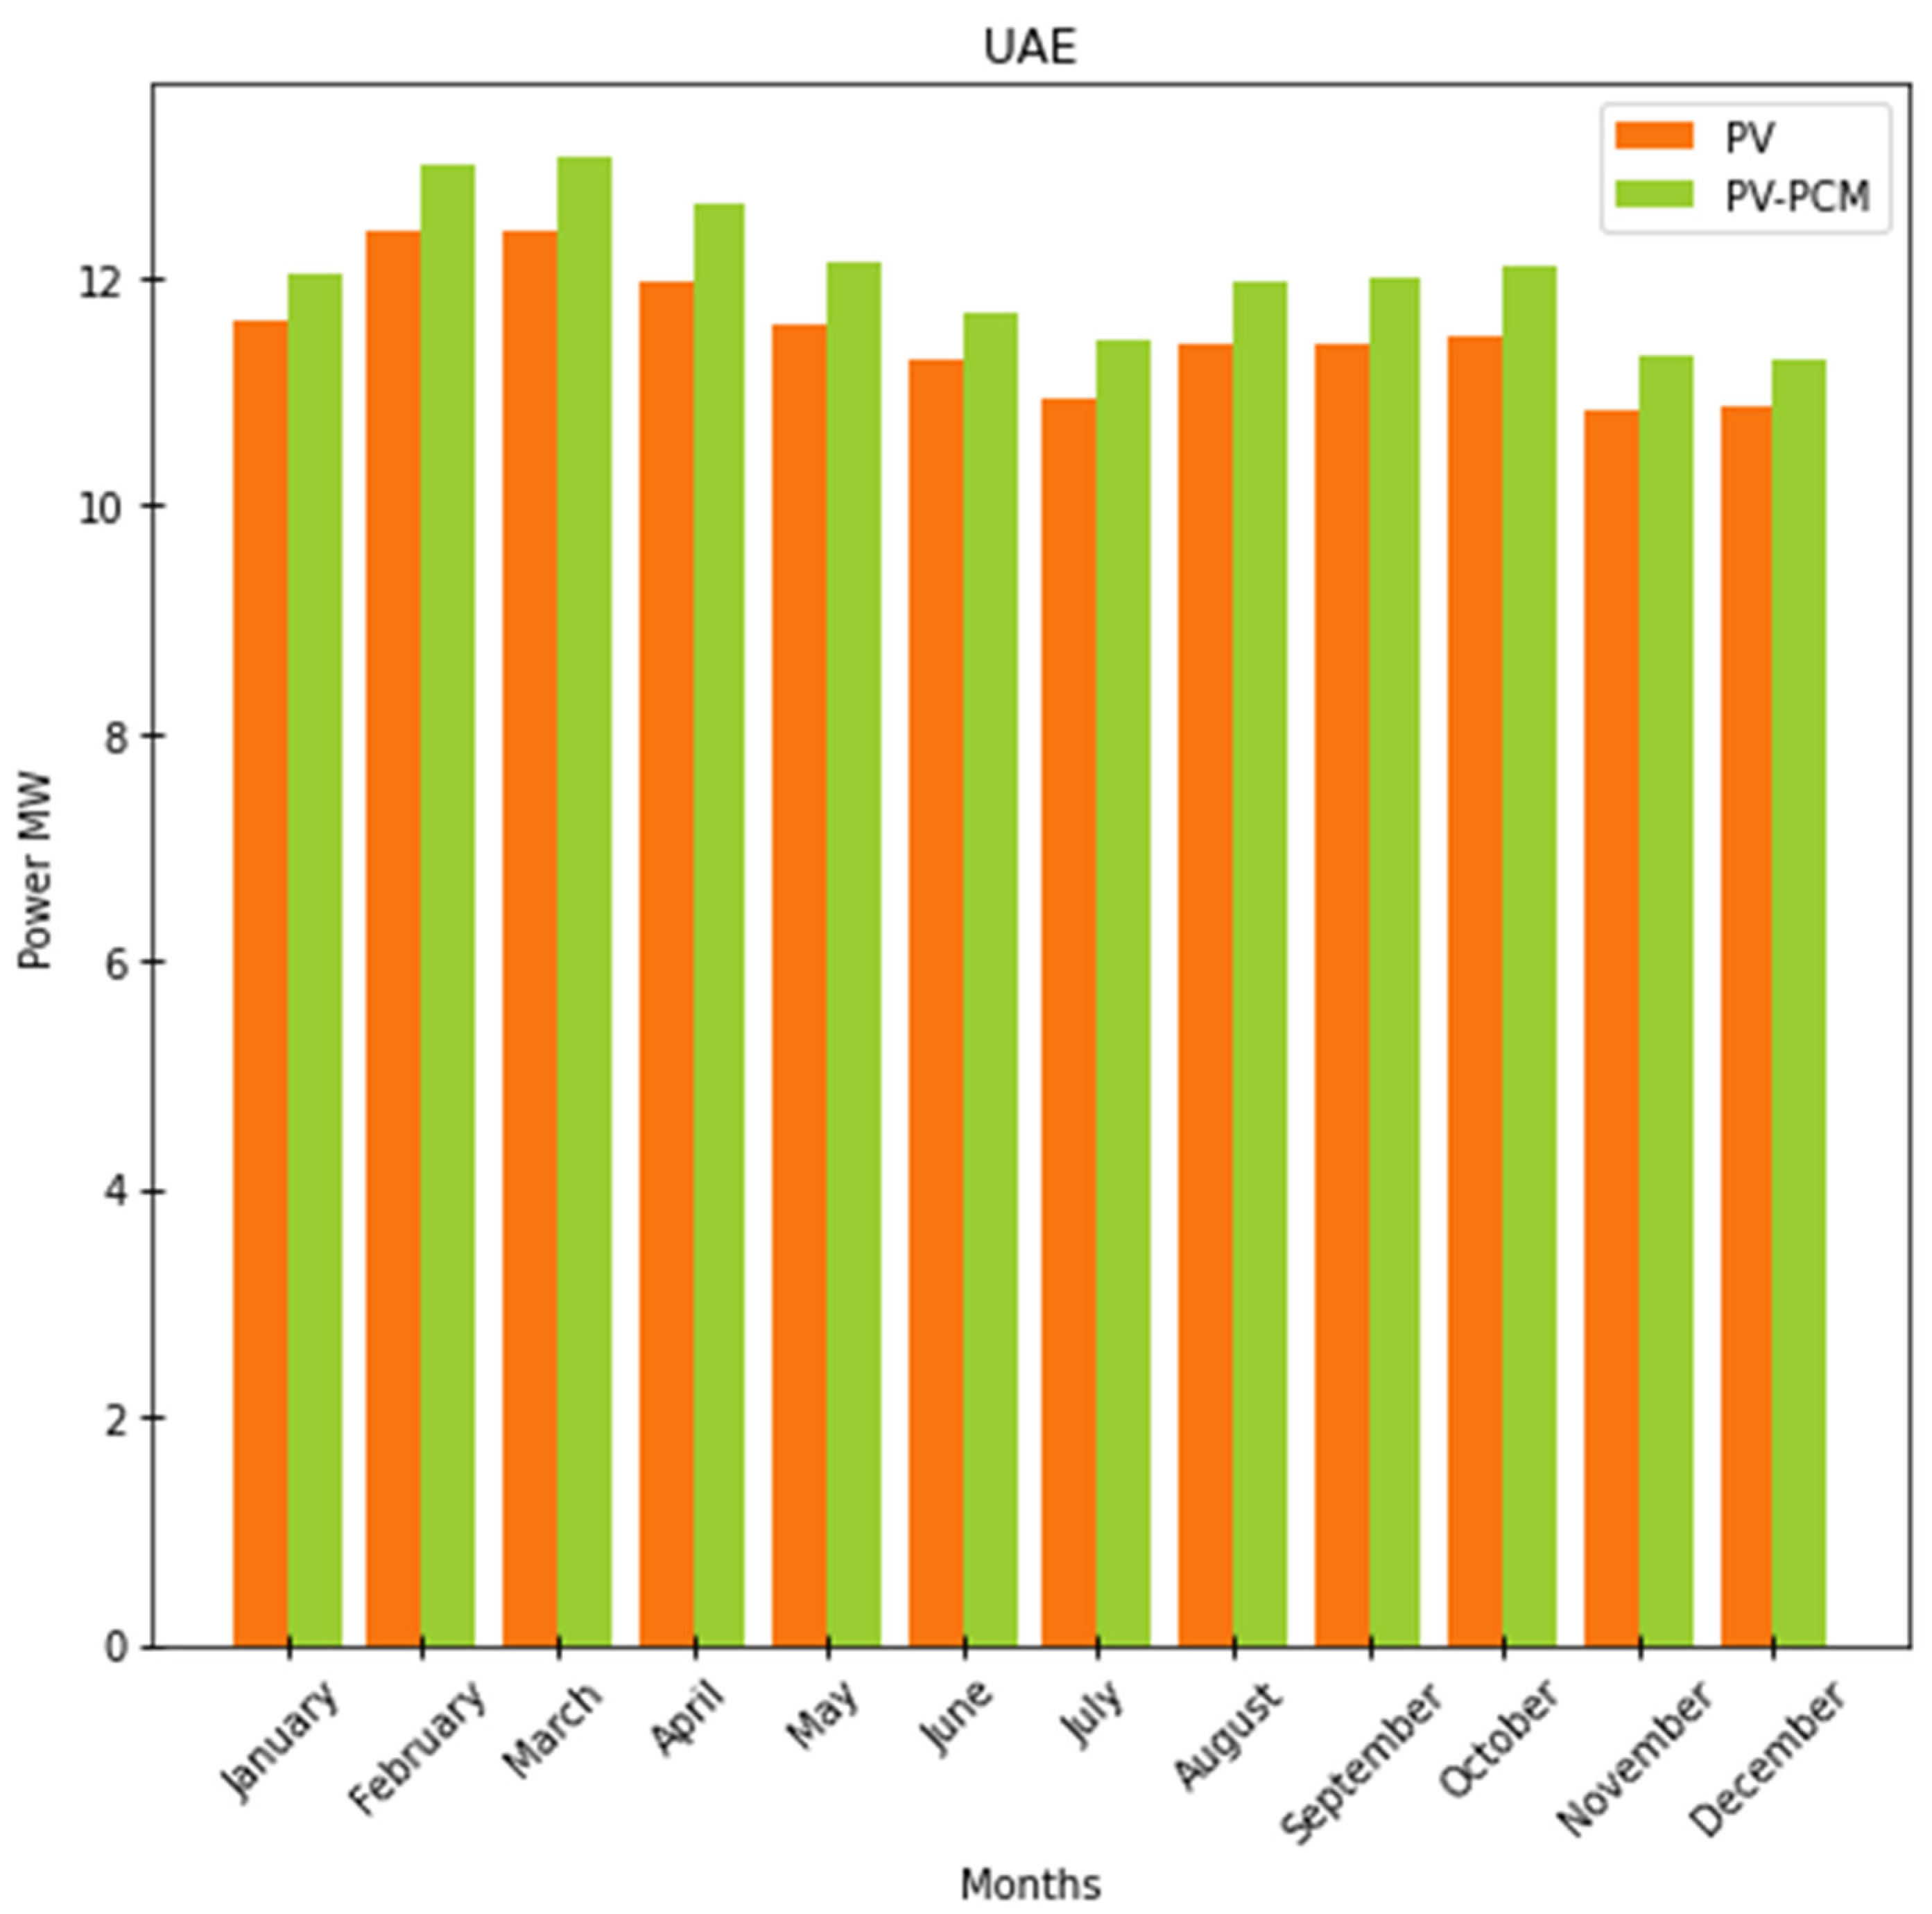
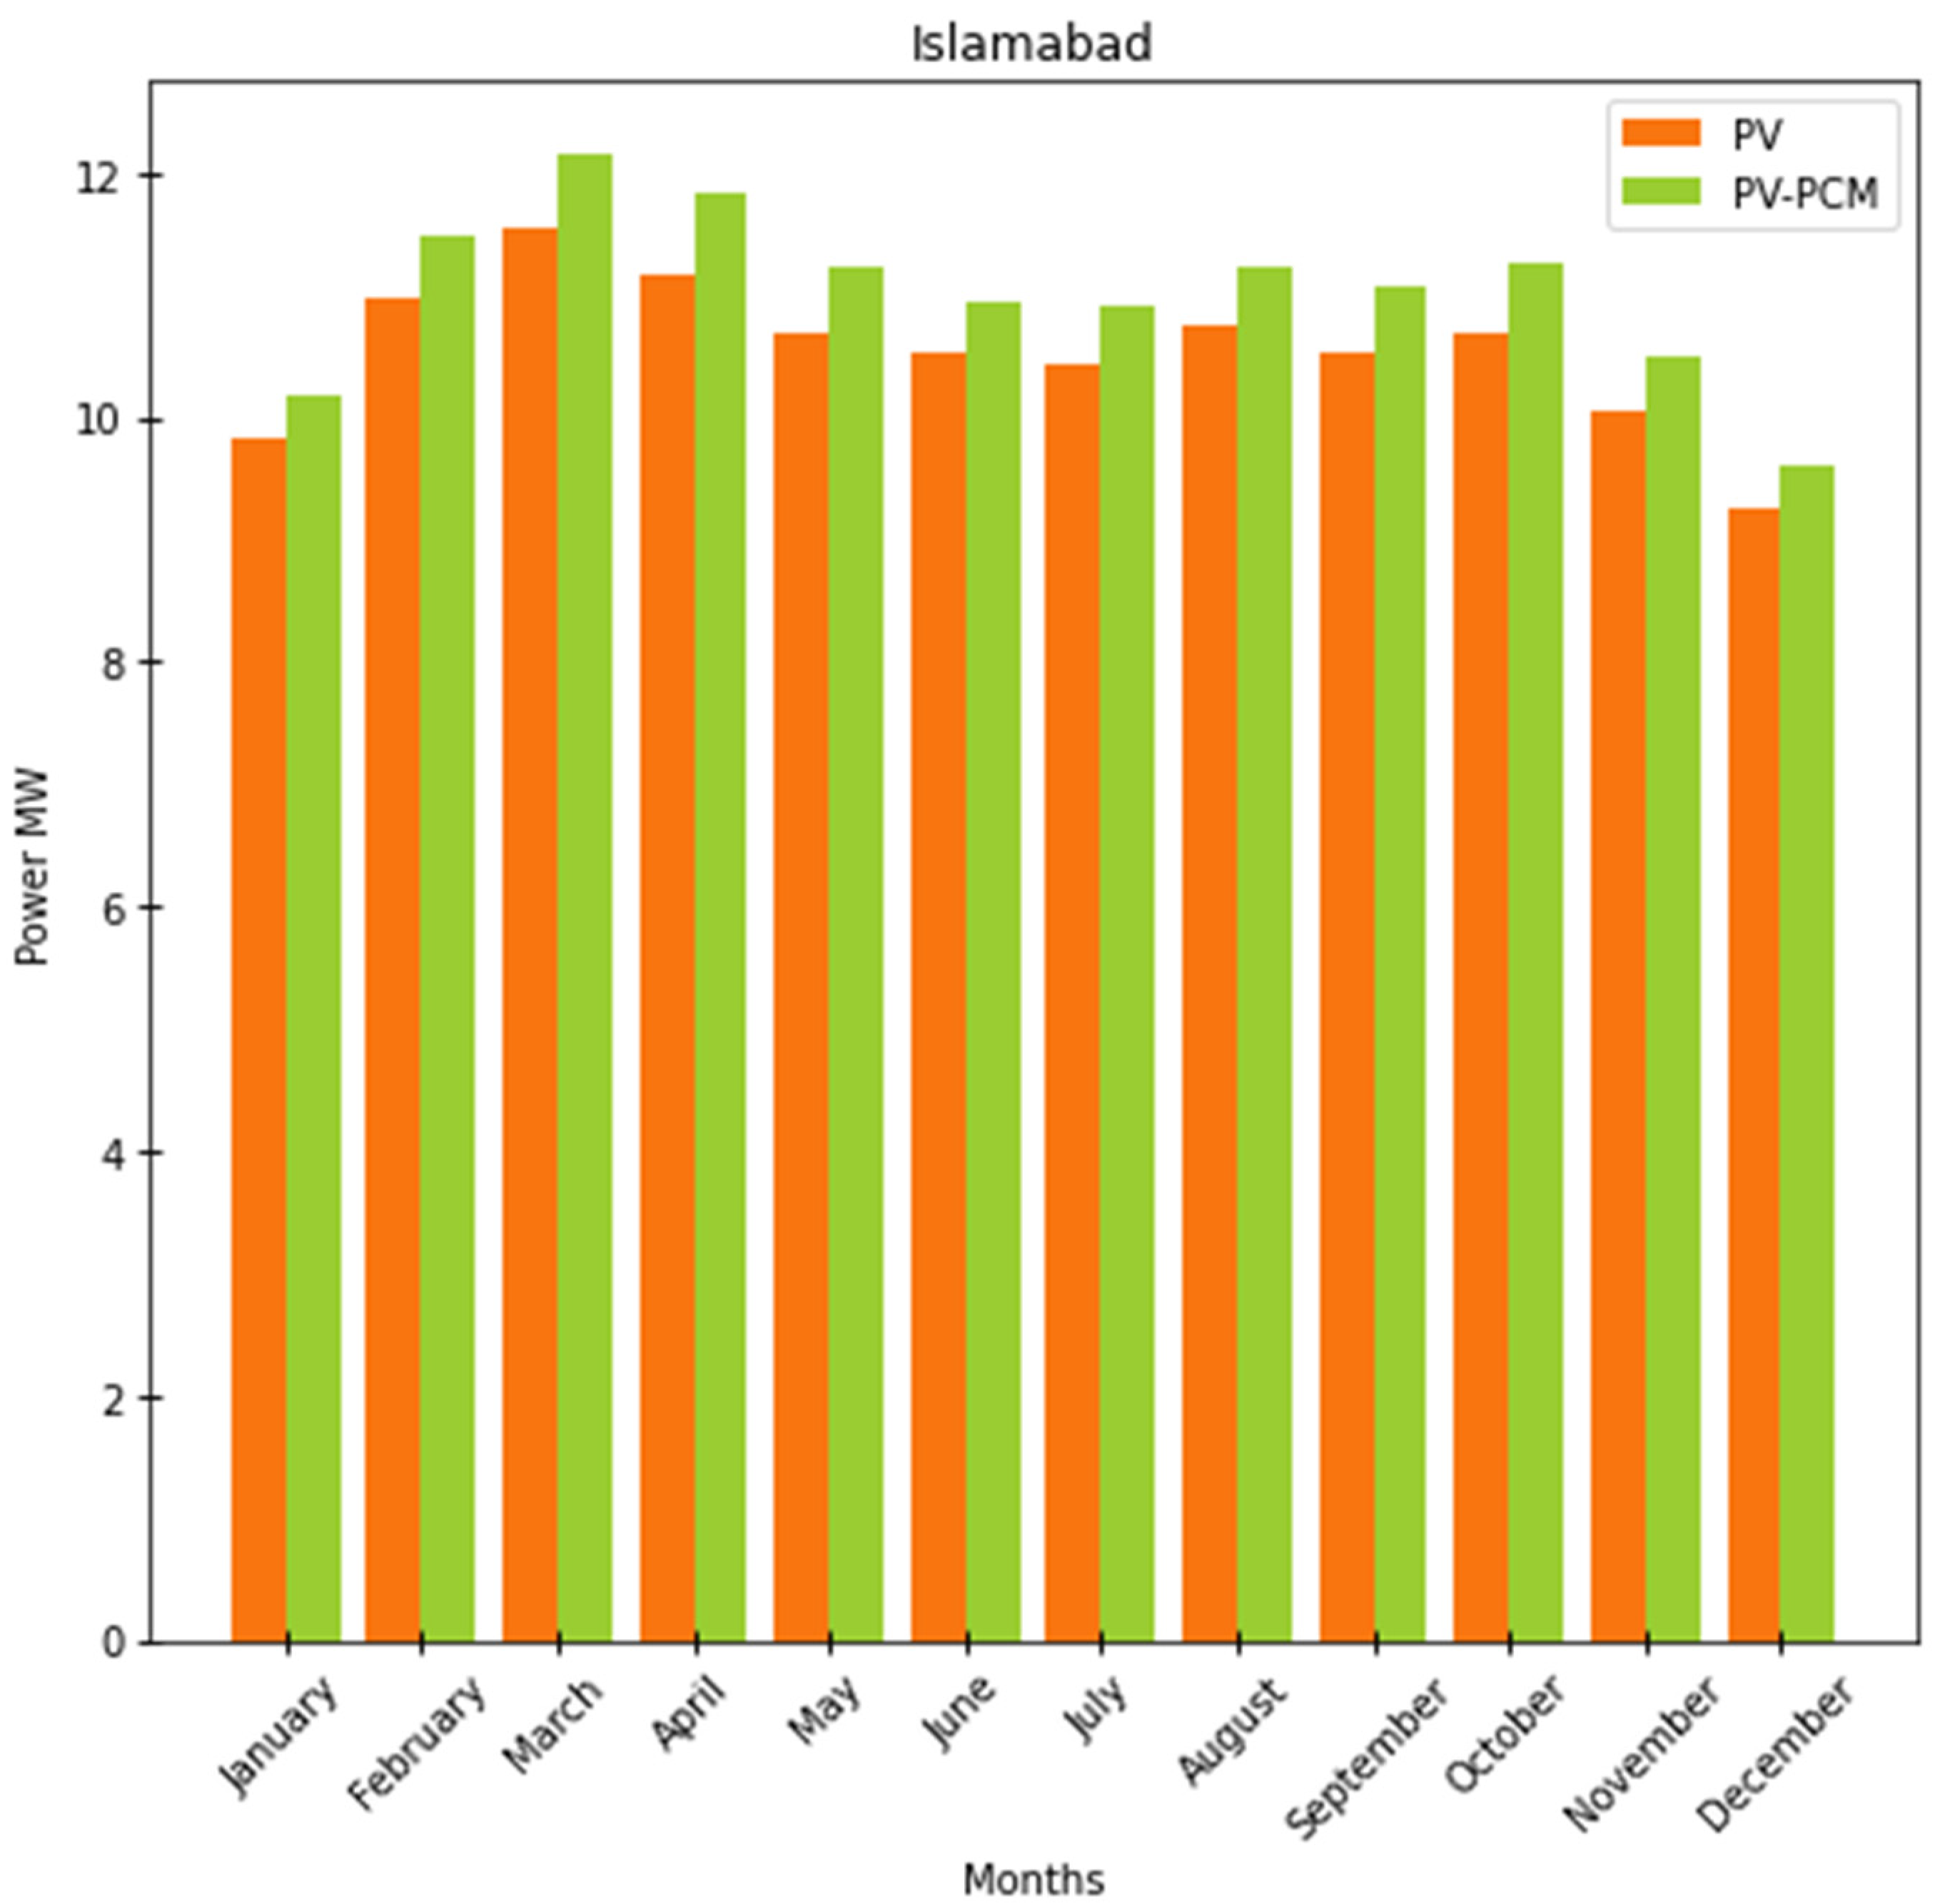
7.5.2. Power Profile of PV and PV-PCM for UAE and Islamabad
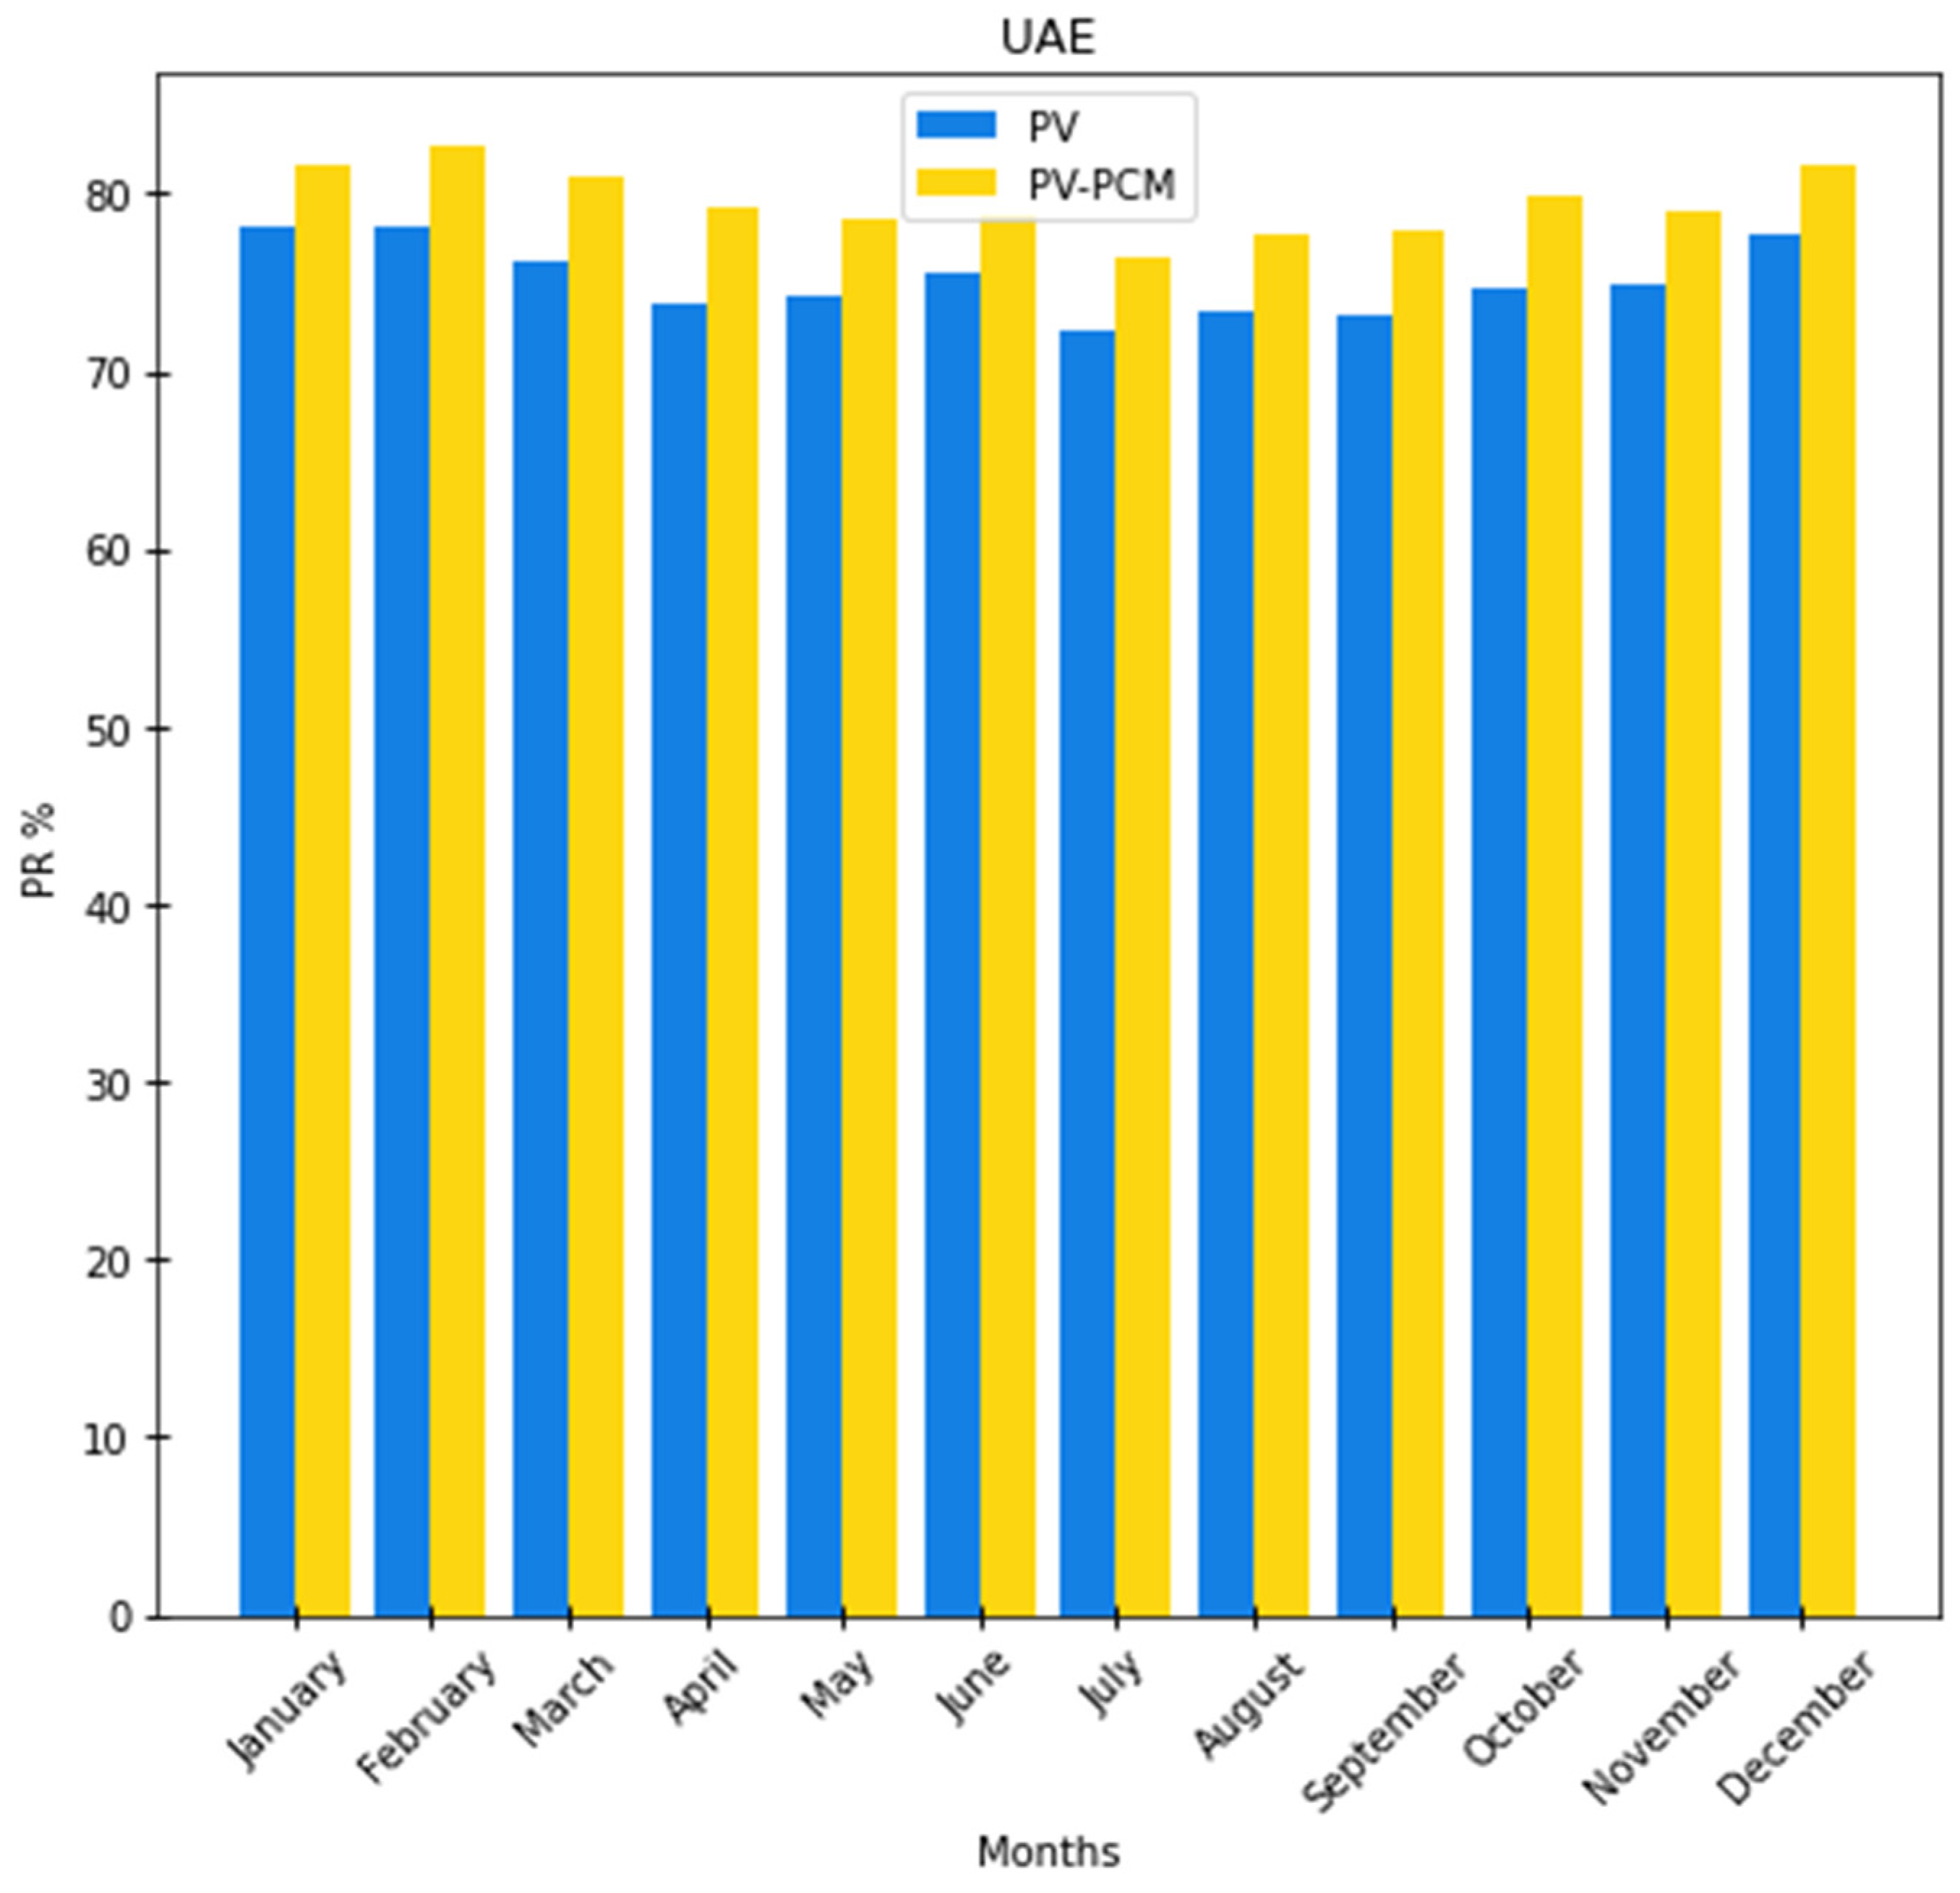
7.5.3. Performance Ratio Metric for UAE and Islamabad
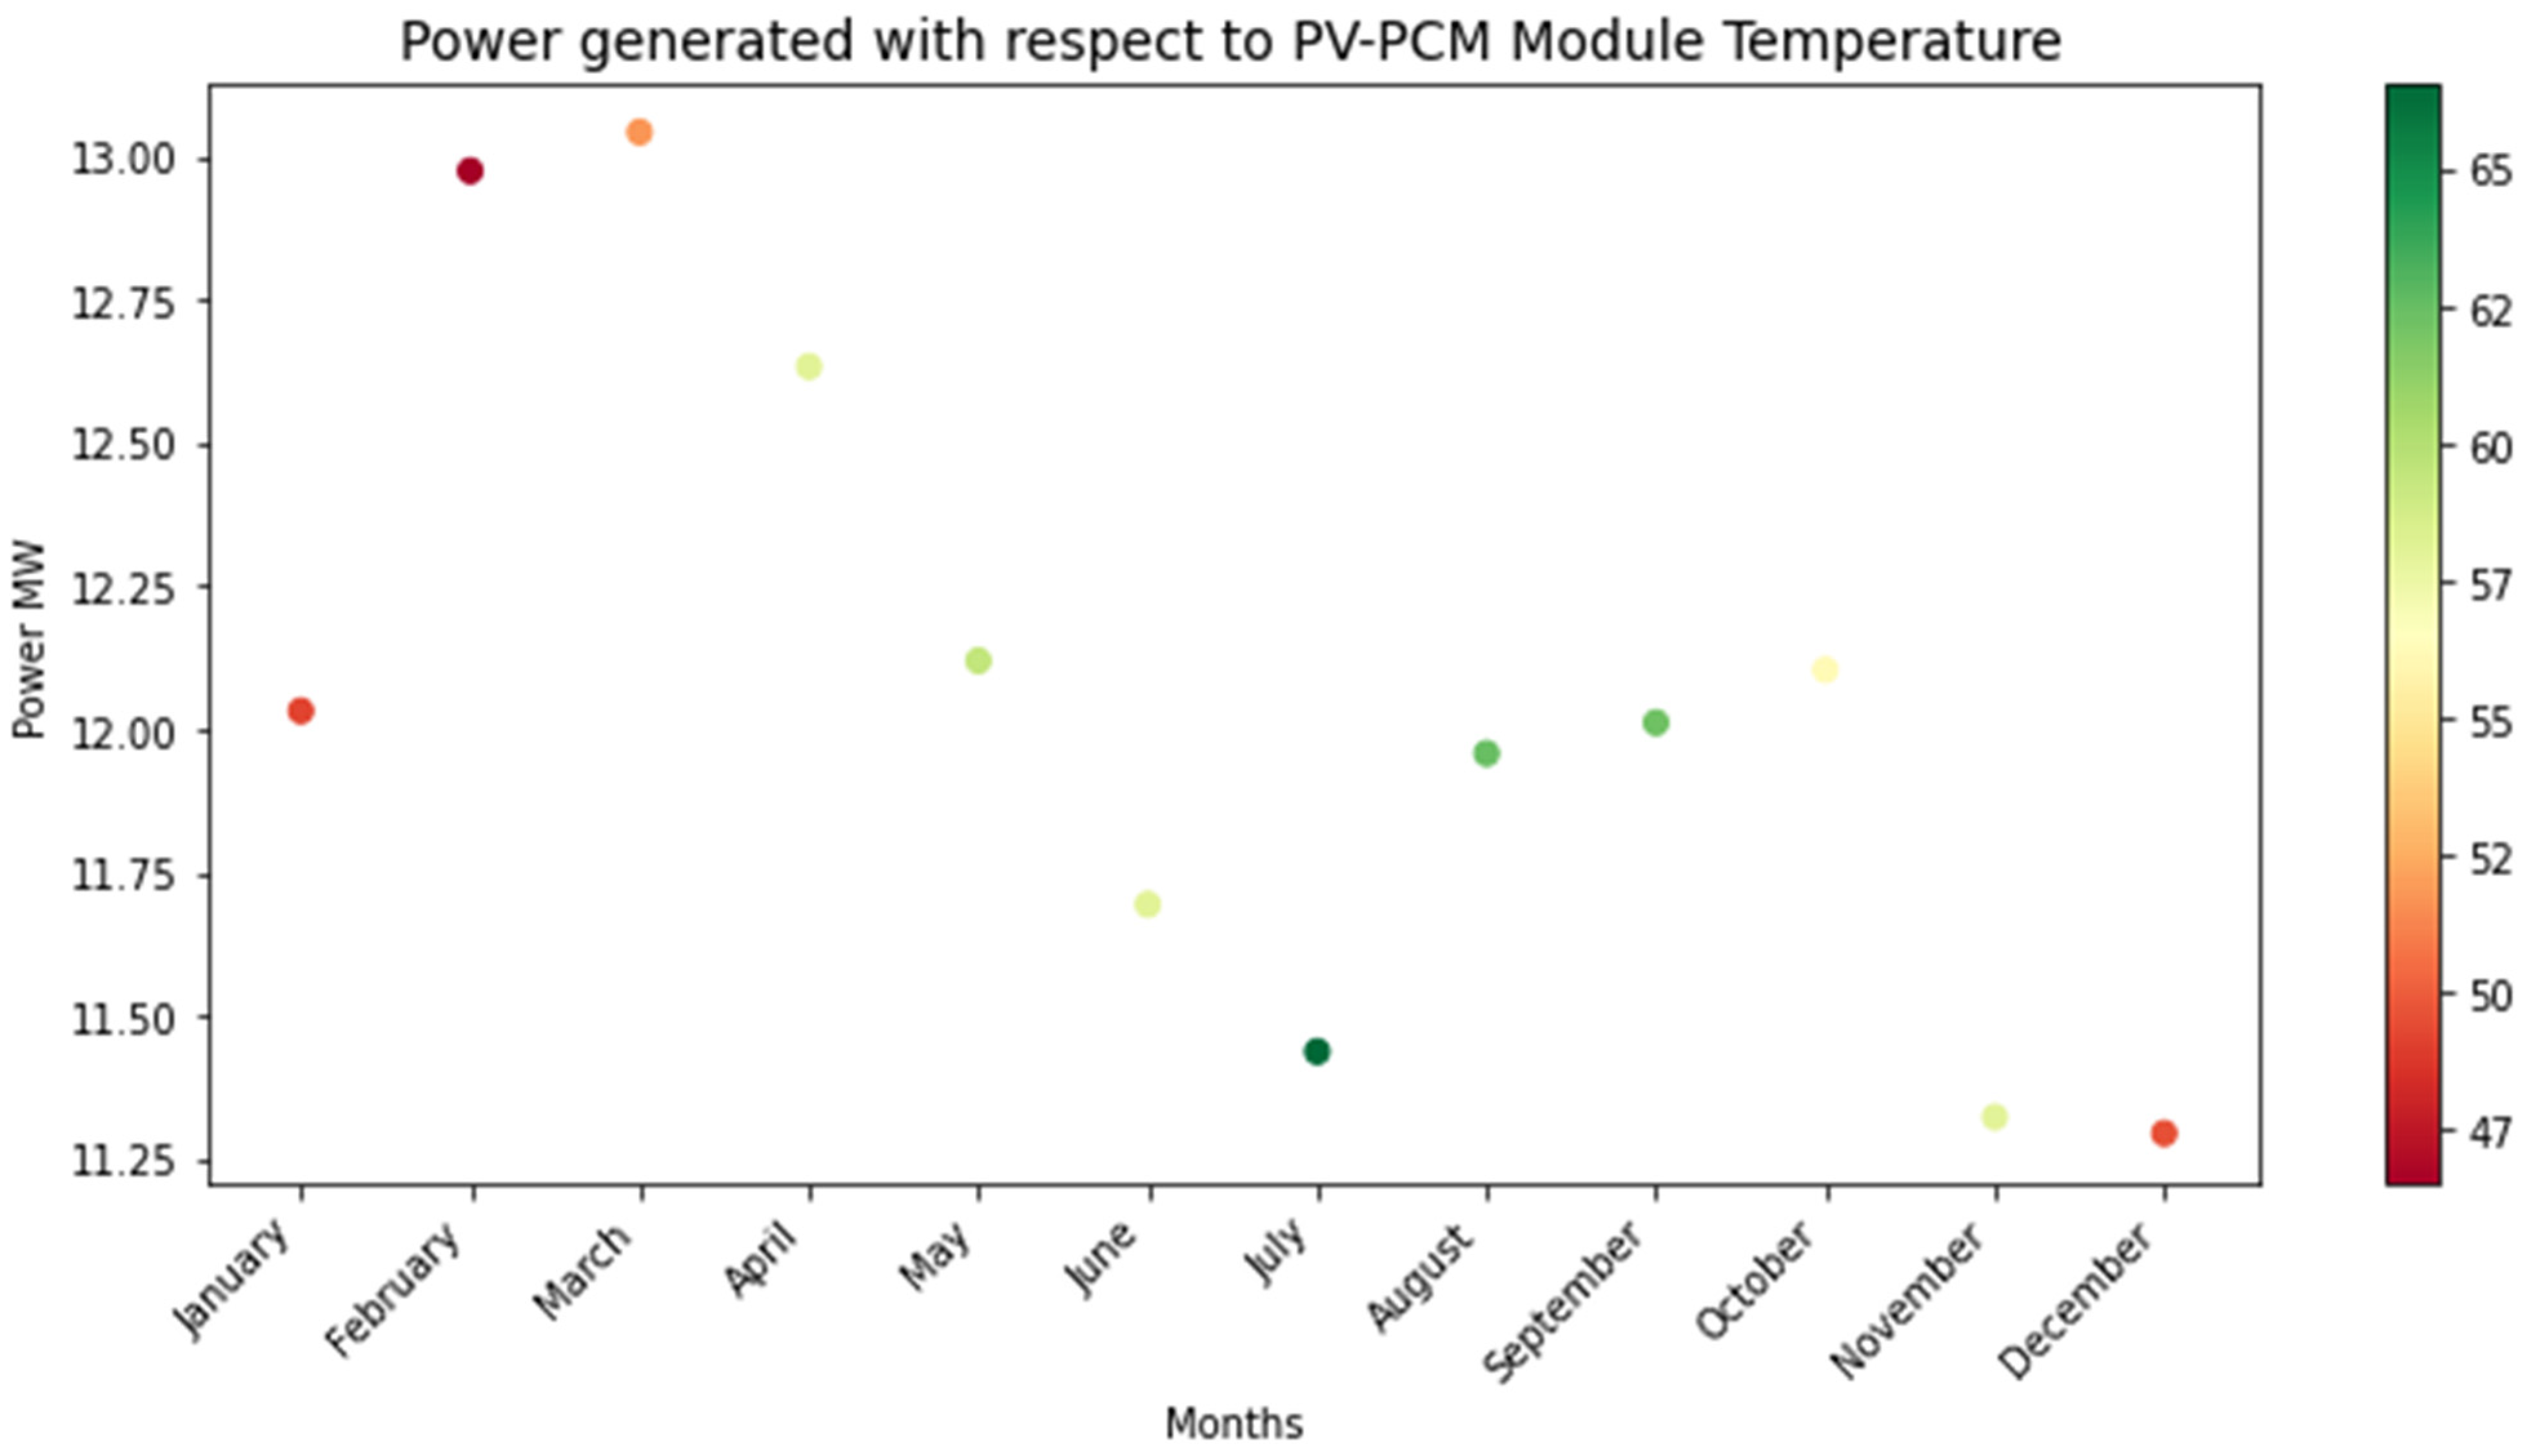
7.5.4. Power Generation Correlation Concerning PV-PCM Temperature
8. Conclusions and Future Prospects
- PCM can store a high amount of thermal energy within a small quantity, which makes PCM unique as a sensible heat storage material. In such a way, paraffin wax and Rubitherm commercial PCM’s are widely used and have achieved higher TPV reduction. However, PCM also lacks several issues that question the performance of the PCM integration.
- PCM is a low thermal conducting material that creates a thermal conduction barrier during charging and discharging mode. Several researchers claim that an increase in the thickness of PCM also creates the conduction barrier. Further, thermal conductivity enhancers are used to increase the KPCM. In such a way, interfin plays a major role in PV module cooling techniques than nano compounds and metal-based enhancers. Secondly, non-metal-based thermal enhancers have gained higher attention in the cooling process, especially EG. The main benefit of EG as a thermal enhancer will not increase the weight of the system and is free from corrosion.
- A further increase in the thickness of PCM failed to discharge the entire stored thermal energy in the nighttime that causes to fail the consecutive charging process. To minimize this loss, thermal collectors or heat pipes are attached inside the PCM to remove the thermal energy from the PCM by flowing working fluid inside the tube. Notably, heat from the PCM is utilized for thermal comforts such as heating and ventilation processes. Secondly, the thermal collector minimizes the usage of PCM and conduction barriers.
- From this study, it is clear that before experimenting with PCM, numerical or theoretical work has to be carried out to optimize the Tmelt of PCM and appropriate thickness. Inappropriate PCM Tmelt postpones or prepones the cooling process that makes PCM ineffective. If the selected PCM Tmelt is less than the optimal range, the cooling process will start in the early daytime and end before the peak daytime. If the selected PCM Tmelt is higher than the optimal range, PCM will initiate the cooling process in late peak daytime. In such a case, PCM turns ineffective and creates a negative effect on increasing the thermal resistance and TPV. These two surveys will reduce the negative impact of the PCM integration. EG is recommended as a thermal enhancer rather than interfin because EG will not increase the system’s total weight such as a conventional thermal enhancer. Moreover, eutectic PCM played a minor role in the PV module cooling technique because it is not readily available PCM. However, organic eutectic material is thermally stable for more than 2000 thermal cycles. Further, it is recommended to use the effectiveness of eutectic material to cool the PV module and minimize PCM’s cost.
- Case study: NREL resource data associated with experimental values were implemented upon two geographical locations—UAE and Islamabad. Theoretical power output was compared between PV and PV-PCM temperature. Results indicate that throughout the year the PV-PCM outperforms PV module temperature; more specifically, February, March, and April showed an increased electrical output power by 4.42%, 4.78%, and 5.39%, respectively Similarly, Islamabad location during March, April, and September saw a rise in performance by 4.82%, 5.50%, and 4.82%, respectively.
- Analyzing resource data before any geographical location would help determine a suitable PCM. Having higher insolation, low average temperature, windy conditions, and a module with a good thermal coefficient would ensure higher yield and reduced loss. Economically, this reduces the payback period and cuts the project cost by enabling a reduced AC/DC ratio(sizing).
Author Contributions
Funding
Institutional Review Board Statement
Informed Consent Statement
Data Availability Statement
Conflicts of Interest
Nomenclature
| Q | Total amount of heat energy stored in the PCM |
| Ti | Initial or starting temperature |
| Tm | Melting temperature |
| m | Mass of PCM |
| Cp,s | Solid specific heat capacity |
| L | Latent heat of fusion |
| Cp,l | Liquid specific heat capacity |
| Te | Ending temperature |
| TPV | PV module temperature |
| Ta | Ambient temperature |
| EPOA | Irradiance plane of array |
| U0 | Constant heat transfer co-efficient |
| U1 | Convective heat transfer co-efficient |
| WS | Wind speed |
| POA | Plane of array irradiation W/mm |
| TPV | PV module temperature |
| TSTC | Standard test temperature |
| β | Temperature co-efficient (0.0036 per ℃ for STC) |
| Pdc | Capacity |
Appendix A
| Type of PCM | Tmelt (°C) | Latent Heat of Fusion (J/g) | Location | Temperature Drop (℃) | Ambient Temperature (℃) | Solar Irradiance (W/m2) | Reference |
|---|---|---|---|---|---|---|---|
| RT25 [167] | 26.6 | 232 | Indoor | - | 20 | 1000 | [86] |
| Paraffin wax [168] | 32 | 251 | Indoor | - | 20 | 1000 | [86] |
| Aluminum [169] | - | - | Indoor | - | 20 | 1000 | [86] |
| GR 40 [167] | 43 | 82 | Belfast, UK | - | 23 | 750 | [124] |
| Paraffin wax [170] | 57 | 255 | Rajasthan, India | 16 | - | 1900 | [98] |
| RT42 [167] | 38–43 | 165 | Venice | 42 | - | 900 | [103] |
| RT55 [167] | 51–57 | 170 | Abhudabi | 10 | - | 820 | [103] |
| Paraffin wax | 42–44 | 130 | Indoor | 8 | 23 | 1000 | [82] |
| RT22 [167] | 20–23 | 200 | Indoor | - | 23 | 1000 | [82] |
| Ceresin [171] | 61–78 | 160 | Indoor | - | 23 | 1000 | [82] |
| OM 37 [172] | 37 | 211 | Lyon, France | - | 23 | 875 | [104] |
| RT 35 [167] | 29–36 | 160 | Malaysia | 10 | - | 1000 | [77] |
| Paraffin wax | 59 | 137.67 | Indoor | 2.5 | - | 1000 | [79] |
| RT42 [167] | 38–43 | 165 | Indoor | 2.2 | 35 | 1000 | [73] |
| RT 27 [167] | 184 | Greece | 21 | 32 | 1020 | [74] | |
| Fatty acid ester (coconut oil) [173] | 24 | - | Seosan, South Korea | 2 | 4 | 660 | [71] |
| Petroleum jelly (Vaseline) [72] | 44 | Seosan, Soth Korea | 5 | 4 | 660 | [71] | |
| S21 [174] | 22 | 170 | Australia | - | 22 | 560 | [102] |
| Paraffin wax | 50 | Malaysia | - | - | - | [105] | |
| RT 35 [167] | 29–36 | 160 | Malaysia | 10 | 35 | 1000 | [78,175] |
| Paraffin wax | 42–72 | 200–220 | Iran | 19 | 30 | 1050 | [107] |
| RT 35 [167] | 34–36 | 240 | Central Europe | 11 | - | 550 | [120] |
| RT 10HC [167] | 9–10 | 200 | Central Europe | 8 | - | 100 | [120] |
| RT 18HC [167] | 17–19 | 260 | Central Europe | 12 | - | 550 | [120] |
| RT 25HC [167] | 22–26 | 230 | Central Europe | 11 | - | 500 | [120] |
| Petroleum jelly [72] | 44 | Indonesia | 6 | 26 | 1120 | [72] | |
| RT25HC | 22–26 | 230 | Indoor | - | 20 | 1000 | [88] |
| pure PCM (white petroleum jelly) | 36–60 | Lebanon | 6.5 | 32 | 800 | [99] | |
| Pure PCM 70% + copper 20% + graphite 10% | 36–80 | Lebanon | 6.3 | 32 | 800 | [99] | |
| RT25HC | 22–26 | 230 | Indoor | - | 20 | 750 | [97] |
| RT42 [167] | 38–43 | 165 | UAE | 20 | 30 | 960 | [56,106] |
| RT 27 [167] | 184 | Utrecht | 12 | 12.2 | - | [176] | |
| Crude palm oil and coconut oil [177] | Indonesia | 37 | 30 | - | [80] | ||
| RT 27 [167] | 184 | Greece | 5.5 | 19 | - | [147] | |
| RT 20 [167] | 15–26 | 132.1 | Greece | 14 | 19 | - | [147] |
| SP25A8 | 22–32 | 141.5 | Greece | 5 | 19 | - | [147] |
| RT44 | 41–44 | 250 | Pakistan | 28.7 | 43 | - | [83] |
| RT44 | 41–44 | 250 | Pakistan | 35 | 40 | - | [57,178] |
| RT35 | 35 | 160 | - | - | - | - | [149] |
| RT55 | 51–57 | 170 | Egypt | 10.6 | 39 | 1100 | [150] |
| RT28 | 28 | 245 | Slovenia | 34 | 19 | 560 | [151,179] |
| Paraffin wax | 46–48 | 200–220 | Iran | 16 | 31 | 1000 | [154] |
| PCM | 45 | - | China | - | 20 | 540 | [155] |
| RT | 38–43 | 165 | Croatia | - | 31 | 905 | [156] |
| Pork fat | 36–45 | 170 | Croatia | - | 31 | 905 | [156] |
| Paraffin wax | 40 | 198 | Malaysia | - | 35 | - | [180] |
| RT27 | 28 | 179 | UK | 10 | 24 | 926 | [157,181] |
| Paraffin wax [182] | 25 | 184 | South Korea | 4 | 26 | 240 | [158] |
| RT35HC | 34–36 | 240 | Egypt | 34 | - | 820 | [159,183] |
| Paraffin wax | 49 | 196 | Malaysia | 31 | 35 | 700 | [163] |
| Lauric acid | 44–46 | 228.90 | Malaysia | 8 | 36.5 | 999 | [184] |
| Paraffin wax [154] | 46–48 | 200–220 | Iran | 14 | 30 | 850 | [185] |
| Paraffin wax | 27.67 | 204.5 | China | 5 | 28 | 901 | [186] |
| Paraffin wax | 26–28 | Italy | - | - | - | [187] | |
| Octadecane [188] | 28 | 244 | Saudi arabia | 30 | - | - | [189] |
| Paraffin wax [190] | 56 | 226 | - | - | 39 | 610 | [191] |
| RT44HC | 44 | 220 | Qatar | 14.5 | 40 | 900 | [192] |
| RT50 | 50 | 130 | Qatar | 14 | 40 | [192] | |
| RT54HC | 54 | 170 | Qatar | 20 | 40 | 900 | [192] |
| Eutectic (capric: palmitic acid) | 22.4 | 195 | Ireland | 10 | - | - | [193] |
| Poly ethylene glycol 1000 | 38–40 | 159 | Iran | 15 | - | - | [194] |
| Na2HPO4.12H2O | 40 | 280 | Spain | 6 | - | - | [195] |
| Na2SO4.10H2O | 32 | 251 | Spain | 9 | - | - | [195] |
| Eutectic (capric-palmitic acid) | 22.5 [196] | 173 [196] | Ireland | 7 | 24 | 950 | [197] |
| Calcium chloride hexahydrate | 29.8 [198] | 191 [198] | Ireland | 10 | 24 | 950 | [197] |
Appendix B

References
- Jin, X.; Chen, Y.; Wang, L.; Han, H.; Chen, P. Failure prediction, monitoring and diagnosis methods for slewing bearings of large-scale wind turbine: A review. Measurement 2021, 172, 108855. [Google Scholar] [CrossRef]
- Xiao, G.; Chen, B.; Li, S.; Zhuo, X. Fatigue life analysis of aero-engine blades for abrasive belt grinding considering residual stress. Eng. Fail. Anal. 2022, 131, 105846. [Google Scholar] [CrossRef]
- Zhong, C.; Li, H.; Zhou, Y.; Lv, Y.; Chen, J.; Li, Y. Virtual synchronous generator of PV generation without energy storage for frequency support in autonomous microgrid. Int. J. Electr. Power Energy Syst. 2022, 134, 107343. [Google Scholar] [CrossRef]
- Enshasy, H.; Abu Al-Haija, Q.; Al-Muhaisen, S.; Al-Nashri, M.; Al-Amri, H. A Schematic Design of HHO Cell As Green Energy Storage. Tien Tzu Hsueh Pao/Acta Electron. Sin. 2019, 3, 9–15. [Google Scholar] [CrossRef]
- Cazzaniga, R.; Rosa-Clot, M. The booming of floating PV. Sol. Energy 2020, 219, 3–10. [Google Scholar] [CrossRef]
- Dabaieh, M.; Johansson, E. Building Performance and Post Occupancy Evaluation for an off-grid low carbon and solar PV plus-energy powered building. A Case West. Desert Egypt. J. Build. Eng. 2018, 18, 418–428. [Google Scholar]
- Dini, H.S.; Putra, R.P. Automation and Mobile Phone Based-Monitoring Of Hydroponic Farming Style Using Solar Energy. Acta Electron. Malays. (AEM) 2021, 5, 5. [Google Scholar]
- Velmurugan, K.; Karthikeyan, V.; Korukonda, T.B.; Poongavanam, P.; Nadarajan, S.; Kumarasamy, S.; Wongwuttanasatian, T.; Sandeep, D. Experimental studies on photovoltaic module temperature reduction using eutectic cold phase change material. Sol. Energy 2020, 209, 302–315. [Google Scholar] [CrossRef]
- Zhang, X.; Tang, Y.; Zhang, F.; Lee, C.-S. A Novel Aluminum–Graphite Dual-Ion Battery. Adv. Energy Mater. 2016, 6, 1502588. [Google Scholar] [CrossRef] [Green Version]
- Wang, M.; Jiang, C.; Zhang, S.; Song, X.; Tang, Y.; Cheng, H.-M. Reversible calcium alloying enables a practical room-temperature rechargeable calcium-ion battery with a high discharge voltage. Nat. Chem. 2018, 10, 667–672. [Google Scholar] [CrossRef]
- Mu, S.; Liu, Q.; Kidkhunthod, P.; Zhou, X.; Wang, W.; Tang, Y. Molecular grafting towards high-fraction active nanodots implanted in N-doped carbon for sodium dual-ion batteries. Natl. Sci. Rev. 2020, 8, nwaa178. [Google Scholar] [CrossRef]
- Cai, T.; Dong, M.; Liu, H.; Nojavan, S. Integration of hydrogen storage system and wind generation in power systems under demand response program: A novel p-robust stochastic programming. Int. J. Hydrogen Energy 2022, 47, 443–458. [Google Scholar] [CrossRef]
- Li, X.; Gui, D.; Zhao, Z.; Li, X.; Wu, X.; Hua, Y.; Guo, P.; Zhong, H. Operation Optimization of Electrical-Heating Integrated Energy System Based on concentrating solar power plant hybridized with combined heat and power plant. J. Clean. Prod. 2020, 289, 125712. [Google Scholar] [CrossRef]
- Wang, F.; Liu, X.-K.; Gao, F. Chapter 1—Fundamentals of Solar Cells and Light-Emitting Diodes. In Advanced Nanomaterials for Solar Cells and Light Emitting Diodes; Gao, F., Ed.; Elsevier: Amsterdam, The Netherlands, 2019; pp. 1–35. [Google Scholar]
- Du, X.; Tian, W.; Pan, J.; Hui, B.; Sun, J.; Zhang, K.; Xia, Y. Piezo-phototronic effect promoted carrier separation in coaxial p-n junctions for self-powered photodetector. Nano Energy 2022, 92, 106694. [Google Scholar] [CrossRef]
- Velmurugan, K.; Karthikeyan, V.; Korukonda, T.B.; Madhan, K.; Emsaeng, K.; Sukchai, S.; Sirisamphanwong, C.; Wongwuttanasatian, T.; Elavarasan, R.M.; Alhelou, H.H.; et al. Experimental Studies on PV Module Cooling with Radiation Source PCM Matrix. IEEE Access 2020, 8, 145936–145949. [Google Scholar] [CrossRef]
- Chandel, S.S.; Agarwal, T. Review of cooling techniques using phase change materials for enhancing efficiency of photovoltaic power systems. Renew. Sustain. Energy Rev. 2017, 73, 1342–1351. [Google Scholar] [CrossRef]
- Sharma, V.; Chandel, S.S. Performance analysis of a 190 kWp grid interactive solar photovoltaic power plant in India. Energy 2013, 55, 476–485. [Google Scholar] [CrossRef]
- Ayompe, L.M.; Duffy, A.; McCormack, S.J.; Conlon, M. Measured performance of a 1.72 kW rooftop grid connected photovoltaic system in Ireland. Energy Convers. Manag. 2011, 52, 816–825. [Google Scholar] [CrossRef] [Green Version]
- Shiva Kumar, B.; Sudhakar, K. Performance evaluation of 10 MW grid connected solar photovoltaic power plant in India. Energy Rep. 2015, 1, 184–192. [Google Scholar] [CrossRef] [Green Version]
- Shravanth Vasisht, M.; Srinivasan, J.; Ramasesha, S.K. Performance of solar photovoltaic installations: Effect of seasonal variations. Sol. Energy 2016, 131, 39–46. [Google Scholar] [CrossRef] [Green Version]
- Zhang, Y.; Shi, X.; Zhang, H.; Cao, Y.; Terzija, V. Review on deep learning applications in frequency analysis and control of modern power system. Int. J. Electr. Power Energy Syst. 2022, 136, 107744. [Google Scholar] [CrossRef]
- Alami, A.H. Effects of evaporative cooling on efficiency of photovoltaic modules. Energy Convers. Manag. 2014, 77, 668–679. [Google Scholar] [CrossRef]
- Fan, S.; Wang, Y.; Cao, S.; Sun, T.; Liu, P. A novel method for analyzing the effect of dust accumulation on energy efficiency loss in photovoltaic (PV) system. Energy 2021, 234, 121112. [Google Scholar] [CrossRef]
- Verma, A.; Singhal, S. Solar PV Performance Parameter and Recommendation for Optimization of Performance in Large Scale Grid Connected Solar PV Plant—Case Study. J. Energy Power Sources 2015, 2, 40–53. [Google Scholar]
- Abdolzadeh, M.; Ameri, M. Improving the effectiveness of a photovoltaic water pumping system by spraying water over the front of photovoltaic cells. Renew. Energy 2009, 34, 91–96. [Google Scholar] [CrossRef]
- Moharram, K.A.; Abd-Elhady, M.S.; Kandil, H.A.; El-Sherif, H. Enhancing the performance of photovoltaic panels by water cooling. Ain Shams Eng. J. 2013, 4, 869–877. [Google Scholar] [CrossRef] [Green Version]
- Wu, S.; Xiong, C. Passive cooling technology for photovoltaic panels for domestic houses. Int. J. Low-Carbon Technol. 2014, 9, 118–126. [Google Scholar] [CrossRef] [Green Version]
- Phayom, W. Improvement of Photovoltaic Module for Increasing Energy Conversion Efficiency. Appl. Mech. Mater. 2014, 448–453, 1428–1432. [Google Scholar] [CrossRef]
- Krauter, S. Increased electrical yield via water flow over the front of photovoltaic panels. Sol. Energy Mater. Sol. Cells 2004, 82, 131–137. [Google Scholar] [CrossRef]
- Mehrotra, S.; Rawat, P.; Debbarma, M.; Sudhakar, K. Performance of a solar panel with water immersion cooling technique. Int. J. Sci. Environ. Technol. 2014, 3, 1035–1042. [Google Scholar]
- Tina, G.M.; Rosa-Clot, M.; Rosa-Clot, P.; Scandura, P.F. Optical and thermal behavior of submerged photovoltaic solar panel: SP2. Energy 2012, 39, 17–26. [Google Scholar] [CrossRef]
- Wang, Y.; Fang, Z.; Zhu, L.; Huang, Q.; Zhang, Y.; Zhang, Z. The performance of silicon solar cells operated in liquids. Appl. Energy 2009, 86, 1037–1042. [Google Scholar] [CrossRef]
- Akbarzadeh, A.; Wadowski, T. Heat pipe-based cooling systems for photovoltaic cells under concentrated solar radiation. Appl. Therm. Eng. 1996, 16, 81–87. [Google Scholar] [CrossRef]
- Chandrasekar, M.; Suresh, S.; Senthilkumar, T.; Ganesh Karthikeyan, M. Passive cooling of standalone flat PV module with cotton wick structures. Energy Convers. Manag. 2013, 71, 43–50. [Google Scholar] [CrossRef]
- Tonui, J.K.; Tripanagnostopoulos, Y. Improved PV/T solar collectors with heat extraction by forced or natural air circulation. Renew. Energy 2007, 32, 623–637. [Google Scholar] [CrossRef]
- Yun, G.Y.; McEvoy, M.; Steemers, K. Design and overall energy performance of a ventilated photovoltaic façade. Sol. Energy 2007, 81, 383–394. [Google Scholar] [CrossRef]
- Mezoued, M.A.; Kaabi, A. Effect of Using Packing Material on the Performances of the Double Pass Photovoltaic-Thermal (PVT) Air Heater. Int. J. Therm. Environ. Eng. 2013, 5, 61–70. [Google Scholar]
- Kumar, R.; Rosen, M.A. Performance evaluation of a double pass PV/T solar air heater with and without fins. Appl. Therm. Eng. 2011, 31, 1402–1410. [Google Scholar] [CrossRef]
- Murugesan, S.; Nirmala, A.; Sakthivadivel, J.; Mukhilan, R.; Tennyson, S. Physicochemical and biological parameters of water at industrial sites of metropolitan city of Chennai, Tamil Nadu, India. Water Conserv. Manag. 2020, 4, 90–98. [Google Scholar]
- Solanki, S.C.; Dubey, S.; Tiwari, A. Indoor simulation and testing of photovoltaic thermal (PV/T) air collectors. Appl. Energy 2009, 86, 2421–2428. [Google Scholar] [CrossRef]
- Hernandez-Perez, J.G.; Carrillo, J.G.; Bassam, A.; Flota-Banuelos, M.; Patino-Lopez, L.D. Thermal performance of a discontinuous finned heatsink profile for PV passive cooling. Appl. Therm. Eng. 2020, 184, 116238. [Google Scholar] [CrossRef]
- Babu, C.; Ponnambalam, P. The theoretical performance evaluation of hybrid PV-TEG system. Energy Convers. Manag. 2018, 173, 450–460. [Google Scholar] [CrossRef]
- Kumar, N.M.; Subramaniam, U.; Mathew, M.; Ajitha, A.; Almakhles, D.J. Exergy analysis of thin-film solar PV module in ground-mount, floating and submerged installation methods. Case Stud. Therm. Eng. 2020, 21, 100686. [Google Scholar] [CrossRef]
- Savvakis, N.; Tsoutsos, T. Theoretical design and experimental evaluation of a PV+PCM system in the mediterranean climate. Energy 2021, 220, 119690. [Google Scholar] [CrossRef]
- Abdulmunem, A.R.; Mohd Samin, P.; Abdul Rahman, H.; Hussien, H.A.; Izmi Mazali, I.; Ghazali, H. Numerical and experimental analysis of the tilt angle’s effects on the characteristics of the melting process of PCM-based as PV cell’s backside heat sink. Renew. Energy 2021, 173, 520–530. [Google Scholar] [CrossRef]
- Senthil Kumar, K.; Ashwin Kumar, H.; Gowtham, P.; Hari Selva Kumar, S.; Hari Sudhan, R. Experimental analysis and increasing the energy efficiency of PV cell with nano-PCM (calcium carbonate, silicon carbide, copper). Mater. Today Proc. 2021, 37, 1221–1225. [Google Scholar] [CrossRef]
- Nomura, T.; Okinaka, N.; Akiyama, T. Technology of Latent Heat Storage for High Temperature Application: A Review. ISIJ Int. 2010, 50, 1229–1239. [Google Scholar] [CrossRef] [Green Version]
- Karthikeyan, V.; Sirisamphanwong, C.; Sukchai, S.; Sahoo, S.K.; Wongwuttanasatian, T. Reducing PV module temperature with radiation based PV module incorporating composite phase change material. J. Energy Storage 2020, 29, 101346. [Google Scholar] [CrossRef]
- Elavarasan, R.M.; Velmurugan, K.; Subramaniam, U.; Kumar, A.R.; Almakhles, D. Experimental Investigations Conducted for the Characteristic Study of OM29 Phase Change Material and Its Incorporation in Photovoltaic Panel. Energies 2020, 13, 897. [Google Scholar] [CrossRef] [Green Version]
- Prasannaa, P.; Ramkumar, R.; Sunilkumar, K.; Rajasekar, R. Experimental study on a binary mixture ratio of fatty acid-based PCM integrated to PV panel for thermal regulation on a hot and cold month. Int. J. Sustain. Energy 2021, 40, 218–234. [Google Scholar] [CrossRef]
- Savvakis, N.; Dialyna, E.; Tsoutsos, T. Investigation of the operational performance and efficiency of an alternative PV+PCM concept. Solar Energy 2020, 211, 1283–1300. [Google Scholar] [CrossRef]
- He, Y.; Zhang, Y.; Xiao, L.; Wang, J. Effect of SA-LA Composite PCM Volume on PV/PCM Thermal Control Properties. IOP Conf. Ser. Earth Environ. Sci. 2021, 701, 012020. [Google Scholar] [CrossRef]
- Velmurugan, K.; Kumarasamy, S.; Wongwuttanasatian, T.; Seithtanabutara, V. Review of PCM types and suggestions for an applicable cascaded PCM for passive PV module cooling under tropical climate conditions. J. Clean. Prod. 2021, 293, 126065. [Google Scholar] [CrossRef]
- Divyateja, B.; Unnikrishnan, K.; Rohinikumar, B. Modelling and Numerical simulation of Nano-enhanced PV-PCM System for Heat Transfer Augmentation from the Panel. J. Phys. Conf. Ser. 2021, 2054, 012051. [Google Scholar] [CrossRef]
- Hasan, A.; Sarwar, J.; Alnoman, H.; Abdelbaqi, S. Yearly energy performance of a photovoltaic-phase change material (PV-PCM) system in hot climate. Sol. Energy 2017, 146, 417–429. [Google Scholar] [CrossRef]
- Waqas, A.; Ji, J. Thermal management of conventional PV panel using PCM with movable shutters—A numerical study. Sol. Energy 2017, 158, 797–807. [Google Scholar] [CrossRef]
- Senthil, R.; Madurai Elavarasan, R.; Pugazhendhi, R.; Premkumar, M.; Vengadesan, E.; Navakrishnan, S.; Islam, M.R.; Natarajan, S.K. A holistic review on the integration of heat pipes in solar thermal and photovoltaic systems. Sol. Energy 2021, 227, 577–605. [Google Scholar] [CrossRef]
- Anand, A.; Shukla, A.; Panchal, H.; Sharma, A. Thermal regulation of photovoltaic system for enhanced power production: A review. J. Energy Storage 2021, 35, 102236. [Google Scholar] [CrossRef]
- Reji Kumar, R.; Samykano, M.; Pandey, A.K.; Kadirgama, K.; Tyagi, V.V. Phase change materials and nano-enhanced phase change materials for thermal energy storage in photovoltaic thermal systems: A futuristic approach and its technical challenges. Renew. Sustain. Energy Rev. 2020, 133, 110341. [Google Scholar] [CrossRef]
- Browne, M.C.; Norton, B.; McCormack, S.J. Phase change materials for photovoltaic thermal management. Renew. Sustain. Energy Rev. 2015, 47, 762–782. [Google Scholar] [CrossRef]
- Kandeal, A.W.; Thakur, A.K.; Elkadeem, M.R.; Elmorshedy, M.F.; Ullah, Z.; Sathyamurthy, R.; Sharshir, S.W. Photovoltaics performance improvement using different cooling methodologies: A state-of-art review. J. Clean. Prod. 2020, 273, 122772. [Google Scholar] [CrossRef]
- Chehreh, S.S. Solar photovoltaic cells performance improvement by cooling technology: An overall review. Int. J. Hydrogen Energy 2021, 46, 10939–10972. [Google Scholar]
- Maleki, A.; Haghighi, A.; El Haj Assad, M.; Mahariq, I.; Alhuyi Nazari, M. A review on the approaches employed for cooling PV cells. Sol. Energy 2020, 209, 170–185. [Google Scholar] [CrossRef]
- Mahian, O.; Ghafarian, S.; Sarrafha, H.; Kasaeian, A.; Yousefi, H.; Yan, W.-M. Phase change materials in solar photovoltaics applied in buildings: An overview. Sol. Energy 2021, 224, 569–592. [Google Scholar] [CrossRef]
- Potuganti, P.; Ponnapalli, C.S. Efficiency improvement of solar PV panels using active cooling. In Proceedings of the 2012 11th International Conference on Environment and Electrical Engineering, Venice, Italy, 18–25 May 2012. [Google Scholar]
- Li, H.; Sun, Y. Performance optimization and benefit analyses of a photovoltaic loop heat pipe/solar assisted heat pump water heating system. Renew. Energy 2019, 134, 1240–1247. [Google Scholar] [CrossRef]
- Karthikeyan, V.; Sirisamphanwong, C.; Sukchai, S. Investigation on Thermal Absorptivity of PCM Matrix Material for Photovoltaic Module Temperature Reduction. In Key Engineering Materials; Trans Tech Publications Ltd.: Bäch, Switzerland, 2018; Volume 777, pp. 97–101. [Google Scholar]
- Babu, K.M.K.; Pant, R.S. A review of Lighter-than-Air systems for exploring the atmosphere of Venus. Prog. Aerosp. Sci. 2020, 112, 100587. [Google Scholar] [CrossRef]
- Häusler, T.; Rogaß, H. Photovoltaic Module with Latent Heat-Storage-Collector; Office for Official Publications of the European Communities: Luxembourg, 1998. [Google Scholar]
- Lim, J.-H.; Lee, Y.-S.; Seong, Y.-B. Diurnal Thermal Behavior of Photovoltaic Panel with Phase Change Materials under Different Weather Conditions. Energies 2017, 10, 1983. [Google Scholar] [CrossRef] [Green Version]
- Indartono, Y.S.; Suwono, A.; Pratama, F.Y. Improving photovoltaics performance by using yellow petroleum jelly as phase change material. Int. J. Low-Carbon Technol. 2016, 11, 333–337. [Google Scholar] [CrossRef] [Green Version]
- Sharma, S.; Sellami, N.; Tahir, A.; Reddy, K.S.; Mallick, T.K. Enhancing the performance of BICPV systems using phase change materials. In AIP Conference Proceedings; AIP Publishing LLC: Melville, NY, USA, 2015; Volume 1679, p. 110003. [Google Scholar]
- Tsoutsos, N.S.A.T. Phase Change Materials in Photovoltaics:The Assessment of System Performance in the Present Mediterranean Climate Conditions. In Power Systems; Trivent Publishing: Budapest, Hungary, 2016. [Google Scholar]
- Rajvikram, M.; Sivasankar, G. Experimental study conducted for the identification of best heat absorption and dissipation methodology in solar photovoltaic panel. Sol. Energy 2019, 193, 283–292. [Google Scholar] [CrossRef]
- Rajvikram, M.; Leoponraj, S.; Ramkumar, S.; Akshaya, H.; Dheeraj, A. Experimental investigation on the abasement of operating temperature in solar photovoltaic panel using PCM and aluminium. Sol. Energy 2019, 188, 327–338. [Google Scholar]
- Mahamudul, H.; Rahman, M.M.; Metselaar, H.S.C.; Mekhilef, S.; Shezan, S.A.; Sohel, R.; Abu Karim, S.B.; Badiuzaman, W.N.I. Temperature Regulation of Photovoltaic Module Using Phase Change Material: A Numerical Analysis and Experimental Investigation. Int. J. Photoenergy 2016, 2016, 8. [Google Scholar] [CrossRef]
- Mahamudul, H.; Silakhori, M.; Metselaar, I.H.; Ahmad, S.; Mekhilef, S. Development of a temperature regulated photovoltaic module using phase change material for Malaysian weather condition. Optoelectron. Adv. Mater.-Rapid Commun. 2014, 8, 1243–1245. [Google Scholar]
- Thongtha, A.; Chan, H.Y.; Luangjok, P. Influence of Phase Change Material Application on Photovoltaic Panel Performance. In Key Engineering Materials; Trans Tech Publications Ltd.: Bäch, Switzerland, 2017; Volume 730, pp. 563–568. [Google Scholar]
- Indartono, Y.S.; Prakoso, S.D.; Suwono, A.; Zaini, I.N.; Fernaldi, B. Simulation and Experimental Study on Effect of Phase Change Material Thickness to Reduce Temperature of Photovoltaic Panel. IOP Conf. Ser. Mater. Sci. Eng. 2015, 88, 012049. [Google Scholar] [CrossRef]
- Eqwan, M.R.; Aiman, Z.R. Experimental Investigation of the Effect of Solar Photovoltaic Back Plate Cooling Using Passive Heatsink and Candle Wax as Phase Change Material. Int. J. Sci. Res. Sci. Eng. Technol. 2017, 3, 410–417. [Google Scholar]
- Klugmann-Radziemska, E.; Wcisło-Kucharek, P. Photovoltaic module temperature stabilization with the use of phase change materials. Sol. Energy 2017, 150, 538–545. [Google Scholar] [CrossRef]
- Waqas, A.; Jie, J. Effectiveness of Phase Change Material for Cooling of Photovoltaic Panel for Hot Climate. J. Sol. Energy Eng. 2018, 140, 041006. [Google Scholar] [CrossRef]
- Hendricks, J.H.C.; van Sark, W.G.J.H.M. Annual performance enhancement of building integrated photovoltaic modules by applying phase change materials. Prog. Photovolt. Res. Appl. 2013, 21, 620–630. [Google Scholar] [CrossRef] [Green Version]
- Khanna, S.; Reddy, K.S.; Mallick, T.K. Optimization of solar photovoltaic system integrated with phase change material. Sol. Energy 2018, 163, 591–599. [Google Scholar] [CrossRef]
- Huang, M.J.; Eames, P.C.; Norton, B. Thermal regulation of building-integrated photovoltaics using phase change materials. Int. J. Heat Mass Transf. 2004, 47, 2715–2733. [Google Scholar] [CrossRef]
- Biwole, P.H.; Eclache, P.; Kuznik, F. Phase-change materials to improve solar panel’s performance. Energy Build. 2013, 62, 59–67. [Google Scholar] [CrossRef] [Green Version]
- Khanna, S.; Reddy, K.S.; Mallick, T.K. Performance analysis of tilted photovoltaic system integrated with phase change material under varying operating conditions. Energy 2017, 133, 887–899. [Google Scholar] [CrossRef]
- Ahmad, A.; Navarro, H.; Ghosh, S.; Ding, Y.; Roy, J.N. Evaluation of New PCM/PV Configurations for Electrical Energy Efficiency Improvement through Thermal Management of PV Systems. Energies 2021, 14, 4130. [Google Scholar] [CrossRef]
- Gan, G.; Xiang, Y. Experimental investigation of a photovoltaic thermal collector with energy storage for power generation, building heating and natural ventilation. Renew. Energy 2020, 150, 12–22. [Google Scholar] [CrossRef]
- Darkwa, J.; Calautit, J.; Du, D.; Kokogianakis, G. A numerical and experimental analysis of an integrated TEG-PCM power enhancement system for photovoltaic cells. Appl. Energy 2019, 248, 688–701. [Google Scholar] [CrossRef]
- Liu, X.; Zhou, Y.; Li, C.-Q.; Lin, Y.; Yang, W.; Zhang, G. Optimization of a New Phase Change Material Integrated Photovoltaic/Thermal Panel with The Active Cooling Technique Using Taguchi Method. Energies 2019, 12, 1022. [Google Scholar] [CrossRef] [Green Version]
- Al Siyabi, I.; Khanna, S.; Mallick, T.; Sundaram, S. Multiple Phase Change Material (PCM) Configuration for PCM-Based Heat Sinks—An Experimental Study. Energies 2018, 11, 1629. [Google Scholar] [CrossRef] [Green Version]
- Nehari, T.; Benlakam, M.; Nehari, D. Effect of the Fins Length for the Passive Cooling of the Photovoltaic Panels. Period. Polytech. Mech. Eng. 2016, 60, 89–95. [Google Scholar] [CrossRef] [Green Version]
- Nehari, T.; Benlekkam, M.; Nehari, D.; Youcefi, A. The Effect of Inclination on the Passive cooling of the solar PV panel by using Phase change Material. Int. J. Renew. Energy Res. 2016, 6, 132–139. [Google Scholar]
- Biwole, P.; Eclache, P.; Kuznik, F. Improving the performance of solar panels by the use of phase-change materials. In Proceedings of the World Renewable Energy Congress-Sweden, Linköping, Sweden, 8–13 May 2011; pp. 2953–2960. [Google Scholar]
- Khanna, S.; Reddy, K.S.; Mallick, T.K. Optimization of finned solar photovoltaic phase change material (finned pv pcm) system. Int. J. Therm. Sci. 2018, 130, 313–322. [Google Scholar] [CrossRef]
- Maiti, S.; Banerjee, S.; Vyas, K.; Patel, P.; Ghosh, P.K. Self regulation of photovoltaic module temperature in V-trough using a metal–wax composite phase change matrix. Sol. Energy 2011, 85, 1805–1816. [Google Scholar] [CrossRef]
- Hachem, F.; Abdulhay, B.; Ramadan, M.; El Hage, H.; El Rab, M.G.; Khaled, M. Improving the performance of photovoltaic cells using pure and combined phase change materials—Experiments and transient energy balance. Renew. Energy 2017, 107, 567–575. [Google Scholar] [CrossRef]
- August, A.; Reiter, A.; Kneer, A.; Selzer, M.; Nestler, B. Effective Thermal Conductivity of Composite Materials Based on Open Cell Foams. Heat Mass Transf. Res. J. 2018, 2, 33–45. [Google Scholar]
- Abdulmunem, A.R. assive cooling by utilizing the combined PCM/aluminum foam matrix to improve solar panels performance: Indoor investigation. Iraqi J. Mech. Mater. Eng. 2017, 17, 712–723. [Google Scholar]
- Fiorentini, M.; Cooper, P.; Ma, Z. Development and optimization of an innovative HVAC system with integrated PVT and PCM thermal storage for a net-zero energy retrofitted house. Energy Build. 2015, 94, 21–32. [Google Scholar] [CrossRef] [Green Version]
- Elarga, H.; Goia, F.; Zarrella, A.; Dal Monte, A.; Benini, E. Thermal and electrical performance of an integrated PV-PCM system in double skin façades: A numerical study. Sol. Energy 2016, 136, 112–124. [Google Scholar] [CrossRef]
- Gaur, A.; Ménézo, C.; Giroux-Julien, S. Numerical studies on thermal and electrical performance of a fully wetted absorber PVT collector with PCM as a storage medium. Renew. Energy 2017, 109, 168–187. [Google Scholar] [CrossRef]
- Al-Waeli, A.H.; Chaichan, M.T.; Sopian, K.; Kazem, H.A. Energy Storage: CFD Modeling of Thermal Energy Storage for a Phase Change Materials (PCM) added to a PV/T using nanofluid as a coolant. J. Sci. Eng. Res. 2017, 4, 193–202. [Google Scholar]
- Hasan, A.; Alnoman, H.; Shah, A. Energy Efficiency Enhancement of Photovoltaics by Phase Change Materials through Thermal Energy Recovery. Energies 2016, 9, 782. [Google Scholar] [CrossRef]
- Sardarabadi, M.; Passandideh-Fard, M.; Maghrebi, M.-J.; Ghazikhani, M. Experimental study of using both ZnO/ water nanofluid and phase change material (PCM) in photovoltaic thermal systems. Sol. Energy Mater. Sol. Cells 2017, 161, 62–69. [Google Scholar] [CrossRef]
- Carmona, M.; Palacio Bastos, A.; García, J.D. Experimental evaluation of a hybrid photovoltaic and thermal solar energy collector with integrated phase change material (PVT-PCM) in comparison with a traditional photovoltaic (PV) module. Renew. Energy 2021, 172, 680–696. [Google Scholar] [CrossRef]
- Fu, Z.; Liang, X.; Li, Y.; Li, L.; Zhu, Q. Performance improvement of a PVT system using a multilayer structural heat exchanger with PCMs. Renew. Energy 2021, 169, 308–317. [Google Scholar] [CrossRef]
- Naghdbishi, A.; Yazdi, M.E.; Akbari, G. Experimental investigation of the effect of multi-wall carbon nanotube—Water/glycol based nanofluids on a PVT system integrated with PCM-covered collector. Appl. Therm. Eng. 2020, 178, 115556. [Google Scholar] [CrossRef]
- Fu, Z.; Li, Y.; Liang, X.; Lou, S.; Qiu, Z.; Cheng, Z.; Zhu, Q. Experimental investigation on the enhanced performance of a solar PVT system using micro-encapsulated PCMs. Energy 2021, 228, 120509. [Google Scholar] [CrossRef]
- Ahmadi, R.; Monadinia, F.; Maleki, M. Passive/active photovoltaic-thermal (PVT) system implementing infiltrated phase change material (PCM) in PS-CNT foam. Sol. Energy Mater. Sol. Cells 2021, 222, 110942. [Google Scholar] [CrossRef]
- Kazemian, A.; Taheri, A.; Sardarabadi, A.; Ma, T.; Passandideh-Fard, M.; Peng, J. Energy, exergy and environmental analysis of glazed and unglazed PVT system integrated with phase change material: An experimental approach. Sol. Energy 2020, 201, 178–189. [Google Scholar] [CrossRef]
- Nižetić, S.; Jurčević, M.; Čoko, D.; Arıcı, M.; Hoang, A.T. Implementation of phase change materials for thermal regulation of photovoltaic thermal systems: Comprehensive analysis of design approaches. Energy 2021, 228, 120546. [Google Scholar] [CrossRef]
- Hassan, A.; Wahab, A.; Qasim, M.A.; Janjua, M.M.; Ali, M.A.; Ali, H.M.; Jadoon, T.R.; Ali, E.; Raza, A.; Javaid, N. Thermal management and uniform temperature regulation of photovoltaic modules using hybrid phase change materials-nanofluids system. Renew. Energy 2020, 145, 282–293. [Google Scholar] [CrossRef]
- Çiftçi, E.; Khanlari, A.; Sözen, A.; Aytaç, İ.; Tuncer, A.D. Energy and exergy analysis of a photovoltaic thermal (PVT) system used in solar dryer: A numerical and experimental investigation. Renew. Energy 2021, 180, 410–423. [Google Scholar] [CrossRef]
- Yang, X.; Zhou, J.; Yuan, Y. Energy Performance of an Encapsulated Phase Change Material PV/T System. Energies 2019, 12, 3929. [Google Scholar] [CrossRef] [Green Version]
- Arıcı, M.; Bilgin, F.; Nižetić, S.; Papadopoulos, A.M. Phase change material based cooling of photovoltaic panel: A simplified numerical model for the optimization of the phase change material layer and general economic evaluation. J. Clean. Prod. 2018, 189, 738–745. [Google Scholar] [CrossRef]
- Yuan, W.; Ji, J.; Modjinou, M.; Zhou, F.; Li, Z.; Song, Z.; Huang, S.; Zhao, X. Numerical simulation and experimental validation of the solar photovoltaic/thermal system with phase change material. Appl. Energy 2018, 232, 715–727. [Google Scholar] [CrossRef]
- Machniewicz, A.; Knera, D.; Heim, D. Effect of Transition Temperature on Efficiency of PV/PCM Panels. Energy Procedia 2015, 78, 1684–1689. [Google Scholar] [CrossRef] [Green Version]
- Ali, H.M. Recent advancements in PV cooling and efficiency enhancement integrating phase change materials based systems—A comprehensive review. Sol. Energy 2020, 197, 163–198. [Google Scholar] [CrossRef]
- Rathore, P.K.S.; Shukla, S.K. Enhanced thermophysical properties of organic PCM through shape stabilization for thermal energy storage in buildings: A state of the art review. Energy Build. 2021, 236, 110799. [Google Scholar] [CrossRef]
- Khan, Z.; Khan, Z.; Ghafoor, A. A review of performance enhancement of PCM based latent heat storage system within the context of materials, thermal stability and compatibility. Energy Convers. Manag. 2016, 115, 132–158. [Google Scholar] [CrossRef]
- Huang, M.J.; Eames, P.C.; Norton, B. Phase change materials for limiting temperature rise in building integrated photovoltaics. Sol. Energy 2006, 80, 1121–1130. [Google Scholar] [CrossRef]
- Ma, T.; Li, Z.; Zhao, J. Photovoltaic panel integrated with phase change materials (PV-PCM): Technology overview and materials selection. Renew. Sustain. Energy Rev. 2019, 116, 109406. [Google Scholar] [CrossRef]
- Murali, G.; Sravya, G.S.N.; Jaya, J.; Naga Vamsi, V. A review on hybrid thermal management of battery packs and it’s cooling performance by enhanced PCM. Renew. Sustain. Energy Rev. 2021, 150, 111513. [Google Scholar] [CrossRef]
- Wu, S.; Yan, T.; Kuai, Z.; Pan, W. Thermal conductivity enhancement on phase change materials for thermal energy storage: A review. Energy Storage Mater. 2020, 25, 251–295. [Google Scholar] [CrossRef]
- Li, X.; Cui, W.; Simon, T.; Ma, T.; Cui, T.; Wang, Q. Pore-scale analysis on selection of composite phase change materials for photovoltaic thermal management. Appl. Energy 2021, 302, 117558. [Google Scholar] [CrossRef]
- Li, C.; Li, Q.; Ding, Y. Carbonate salt based composite phase change materials for medium and high temperature thermal energy storage: From component to device level performance through modelling. Renew. Energy 2019, 140, 140–151. [Google Scholar] [CrossRef]
- Abdulmunem, A.R.; Samin, P.M.; Rahman, H.A.; Hussien, H.A.; Ghazali, H. A novel thermal regulation method for photovoltaic panels using porous metals filled with phase change material and nanoparticle additives. J. Energy Storage 2021, 39, 102621. [Google Scholar] [CrossRef]
- Mills, A.; Farid, M.; Selman, J.R.; Al-Hallaj, S. Thermal conductivity enhancement of phase change materials using a graphite matrix. Appl. Therm. Eng. 2006, 26, 1652–1661. [Google Scholar] [CrossRef]
- Huang, Y.; She, X.; Li, C.; Li, Y.; Ding, Y. Evaluation of thermal performance in cold storage applications using EG-water based nano-composite PCMs. Energy Procedia 2019, 158, 4840–4845. [Google Scholar] [CrossRef]
- Waqas, A.; Ji, J.; Xu, L.; Ali, M.; Alvi, J. Thermal and electrical management of photovoltaic panels using phase change materials—A review. Renew. Sustain. Energy Rev. 2018, 92, 254–271. [Google Scholar] [CrossRef]
- Sarı, A.; Sarı, H.; Önal, A. Thermal properties and thermal reliability of eutectic mixtures of some fatty acids as latent heat storage materials. Energy Convers. Manag. 2004, 45, 365–376. [Google Scholar] [CrossRef]
- Sharma, A.; Shukla, A. Thermal Cycle Test of Binary Mixtures of Some Fatty Acids as Phase Change Materials For Building Applications. Energy Build. 2015, 99, 196–203. [Google Scholar] [CrossRef]
- Shukla, A.; Buddhi, D.; Sawhney, R.L. Thermal cycling test of few selected inorganic and organic phase change materials. Renew. Energy 2008, 33, 2606–2614. [Google Scholar] [CrossRef]
- Anand, A.; Shukla, A.; Kumar, A.; Buddhi, D.; Sharma, A. Cycle test stability and corrosion evaluation of phase change materials used in thermal energy storage systems. J. Energy Storage 2021, 39, 102664. [Google Scholar] [CrossRef]
- Mohseni, E.; Tang, W.; Khayat, K.H.; Cui, H. Thermal performance and corrosion resistance of structural-functional concrete made with inorganic PCM. Constr. Build. Mater. 2020, 249, 118768. [Google Scholar] [CrossRef]
- Calabrese, L.; Brancato, V.; Palomba, V.; Proverbio, E. An experimental study on the corrosion sensitivity of metal alloys for usage in PCM thermal energy storages. Renew. Energy 2019, 138, 1018–1027. [Google Scholar] [CrossRef]
- Moreno, P.; Miró, L.; Solé, A.; Barreneche, C.; Solé, C.; Martorell, I.; Cabeza, L.F. Corrosion of metal and metal alloy containers in contact with phase change materials (PCM) for potential heating and cooling applications. Appl. Energy 2014, 125, 238–245. [Google Scholar] [CrossRef]
- Ferrer, G.; Solé, A.; Barreneche, C.; Martorell, I.; Cabeza, L.F. Corrosion of metal containers for use in PCM energy storage. Renew. Energy 2015, 76, 465–469. [Google Scholar] [CrossRef] [Green Version]
- Socaciu, L. Thermal energy storage: An overview. Appl. Math. Mech. 2012, 55, 785–793. [Google Scholar]
- Dincer, I.; Rosen, M.A. Thermal Energy Storage (TES) Methods. In Thermal Energy Storage: Systems and Applications, 2nd ed.; Wiley: Hoboken, NJ, USA, 2010; pp. 83–190. [Google Scholar]
- Hassan, A.; McCormack, S.J.; Huang, M.J.; Norton, B. Energy and Cost Saving of a Photovoltaic-Phase Change Materials (PV-PCM) System through Temperature Regulation and Performance Enhancement of Photovoltaics. Energies 2014, 7, 1318–1331. [Google Scholar] [CrossRef] [Green Version]
- Smith, C.J.; Forster, P.M.; Crook, R. Global analysis of photovoltaic energy output enhanced by phase change material cooling. Appl. Energy 2014, 126, 21–28. [Google Scholar] [CrossRef]
- Sun, X.; Lin, Y.; Zhu, Z.; Li, J. Optimized design of a distributed photovoltaic system in a building with phase change materials. Appl. Energy 2022, 306, 118010. [Google Scholar] [CrossRef]
- Kladisios, P.; Steggou-Sagia, A. Using phase change materials in photovoltaic systems for thermal regulation and electrical efficiency improvement: A review and outlook. J. Therm. Eng. 2016, 2, 897–906. [Google Scholar]
- Yang, X.; Sun, L.; Yuan, Y.; Zhao, X.; Cao, X. Experimental investigation on performance comparison of PV/T-PCM system and PV/T system. Renew. Energy 2018, 119, 152–159. [Google Scholar] [CrossRef]
- Elarga, H.; Dal Monte, A.; Andersen, R.K.; Benini, E. PV-PCM integration in glazed building. Co-simulation and genetic optimization study. Build. Environ. 2017, 126, 161–175. [Google Scholar] [CrossRef] [Green Version]
- Nada, S.A.; El-Nagar, D.H.; Hussein, H.M.S. Improving the thermal regulation and efficiency enhancement of PCM-Integrated PV modules using nano particles. Energy Convers. Manag. 2018, 166, 735–743. [Google Scholar] [CrossRef]
- Stropnik, R.; Stritih, U. Increasing the efficiency of PV panel with the use of PCM. Renew. Energy 2016, 97, 671–679. [Google Scholar] [CrossRef]
- Nada, S.A.; El-Nagar, D.H. Possibility of using PCMs in temperature control and performance enhancements of free stand and building integrated PV modules. Renew. Energy 2018, 127, 630–641. [Google Scholar] [CrossRef]
- Modjinou, M.; Ji, J.; Yuan, W.; Zhou, F.; Holliday, S.; Waqas, A.; Zhao, X. Performance comparison of encapsulated PCM PV/T, microchannel heat pipe PV/T and conventional PV/T systems. Energy 2019, 166, 1249–1266. [Google Scholar] [CrossRef]
- Hosseinzadeh, M.; Sardarabadi, M.; Passandideh-Fard, M. Energy and exergy analysis of nanofluid based photovoltaic thermal system integrated with phase change material. Energy 2018, 147, 636–647. [Google Scholar] [CrossRef]
- Zhou, Y.; Liu, X.; Zhang, G. Performance of buildings integrated with a photovoltaic–thermal collector and phase change materials. Procedia Eng. 2017, 205, 1337–1343. [Google Scholar] [CrossRef]
- Nižetić, S.; Arıcı, M.; Bilgin, F.; Grubišić-Čabo, F. Investigation of pork fat as potential novel phase change material for passive cooling applications in photovoltaics. J. Clean. Prod. 2018, 170, 1006–1016. [Google Scholar] [CrossRef]
- Lu, W.; Wu, Y.; Eames, P. Design and development of a Building Façade Integrated Asymmetric Compound Parabolic Photovoltaic concentrator (BFI-ACP-PV). Appl. Energy 2018, 220, 325–336. [Google Scholar] [CrossRef]
- Park, J.; Kim, T.; Leigh, S.-B. Application of a phase-change material to improve the electrical performance of vertical-building-added photovoltaics considering the annual weather conditions. Sol. Energy 2014, 105, 561–574. [Google Scholar] [CrossRef]
- Abdelrahman, H.E.; Wahba, M.H.; Refaey, H.A.; Moawad, M.; Berbish, N.S. Performance enhancement of photovoltaic cells by changing configuration and using PCM (RT35HC) with nanoparticles Al2O3. Sol. Energy 2019, 177, 665–671. [Google Scholar] [CrossRef]
- Thaib, R.; Rizal, S.; Mahlia, T.M.I.; Pambudi, N.A. Experimental analysis of using beeswax as phase change materials for limiting temperature rise in building integrated photovoltaics. Case Stud. Therm. Eng. 2018, 12, 223–227. [Google Scholar] [CrossRef]
- Cui, T.; Xuan, Y.; Li, Q. Design of a novel concentrating photovoltaic–thermoelectric system incorporated with phase change materials. Energy Convers. Manag. 2016, 112, 49–60. [Google Scholar] [CrossRef]
- Atkin, P.; Farid, M.M. Improving the efficiency of photovoltaic cells using PCM infused graphite and aluminium fins. Sol. Energy 2015, 114, 217–228. [Google Scholar] [CrossRef]
- Al-Waeli, A.H.A.; Sopian, K.; Chaichan, M.T.; Kazem, H.A.; Ibrahim, A.; Mat, S.; Ruslan, M.H. Evaluation of the nanofluid and nano-PCM based photovoltaic thermal (PVT) system: An experimental study. Energy Convers. Manag. 2017, 151, 693–708. [Google Scholar] [CrossRef]
- Preet, S.; Bhushan, B.; Mahajan, T. Experimental investigation of water based photovoltaic/thermal (PV/T) system with and without phase change material (PCM). Sol. Energy 2017, 155, 1104–1120. [Google Scholar] [CrossRef]
- Xu, D. Research on Supply Chain Management Strategy Of Longtang Electric Engineering Co. Ltd. Acta Electron. Malays. 2019, 3, 10–13. [Google Scholar] [CrossRef]
- Zhang, W.; Zhang, Z. Deck Electrical System Support Technology of Port Tanker. J. Coast. Res. 2020, 103, 392–396. [Google Scholar] [CrossRef]
- Material, P.C. Rubitherm Data Sheet; Rubitherm Technologies GmbH: Berlin, Germany, 2000. [Google Scholar]
- Hale, D.V.; Hoover, M.J.; Oneill, M.J. Phase Change Materials Handbook; NASA Contractor Report; 1971; p. 65. Available online: https://ntrs.nasa.gov/citations/19720012306 (accessed on 15 July 2020).
- Warren, M.; Roshsenow, J.P.H.; Cho, Y.I. Handbook of Heat Transfer, 3rd ed.; McGraw-Hill: New York, NY, USA, 1988. [Google Scholar]
- Sharma, S.D.; Buddhi, D.; Sawhney, R.L. Accelerated thermal cycle test of latent heat-storage materials. Sol. Energy 1999, 66, 483–490. [Google Scholar] [CrossRef]
- Lotos Group, S.A. Ceresin paraffin wax, Poland. Available online: https://www.lotos.pl/en/ (accessed on 15 July 2020).
- Simone Raoux, M.W. Phase Change Materials. In Science and Applications; Springer Science: New York, NY, USA, 2009. [Google Scholar]
- Chang, S.J.; Kang, Y.; Wi, S.; Jeong, S.-G.; Kim, S. Hygrothermal performance improvement of the Korean wood frame walls using macro-packed phase change materials (MPPCM). Appl. Therm. Eng. 2017, 114, 457–465. [Google Scholar] [CrossRef]
- PlusICE PCM Hydrated Salt; Phase Change Material Products Limited: Yaxley, UK; Available online: https://www.pcmproducts.net/Phase-Change-Material-Solutions.htm (accessed on 15 July 2020).
- Ma, T.; Zhao, J.; Li, Z. Mathematical modelling and sensitivity analysis of solar photovoltaic panel integrated with phase change material. Appl. Energy 2018, 228, 1147–1158. [Google Scholar] [CrossRef]
- Tan, L.; Date, A.; Fernandes, G.; Singh, B.; Ganguly, S. Efficiency Gains of Photovoltaic System Using Latent Heat Thermal Energy Storage. Energy Procedia 2017, 110, 83–88. [Google Scholar] [CrossRef]
- Wheelan, D. The Use of Phase Change Materials in Building Temeprature Regulation Applied Post-Construction. Post-Graduation Thesis, Trinity College, Dublin University, Dublin, Ireland, 2011. [Google Scholar]
- Nouira, M.; Sammouda, H. Numerical study of an inclined photovoltaic system coupled with phase change material under various operating conditions. Appl. Therm. Eng. 2018, 141, 958–975. [Google Scholar] [CrossRef]
- Japs, E.; Sonnenrein, G.; Krauter, S.; Vrabec, J. Experimental study of phase change materials for photovoltaic modules: Energy performance and economic yield for the EPEX spot market. Sol. Energy 2016, 140, 51–59. [Google Scholar] [CrossRef]
- Al-Waeli, A.H.A.; Chaichan, M.T.; Sopian, K.; Kazem, H.A.; Mahood, H.B.; Khadom, A.A. Modeling and experimental validation of a PVT system using nanofluid coolant and nano-PCM. Sol. Energy 2019, 177, 178–191. [Google Scholar] [CrossRef]
- Lu, W.; Liu, Z.; Flor, J.-F.; Wu, Y.; Yang, M. Investigation on designed fins-enhanced phase change materials system for thermal management of a novel building integrated concentrating PV. Appl. Energy 2018, 225, 696–709. [Google Scholar] [CrossRef]
- Baetens, R.; Jelle, B.P.; Gustavsen, A. Phase change materials for building applications: A state-of-the-art review. Energy Build. 2010, 42, 1361–1368. [Google Scholar] [CrossRef] [Green Version]
- Ma, T.; Zhao, J.; Han, J. A Parametric Study about the Potential to Integrate Phase Change Material into Photovoltaic Panel. Energy Procedia 2017, 142, 648–654. [Google Scholar] [CrossRef]
- Hossain, M.S.; Pandey, A.K.; Selvaraj, J.; Rahim, N.A.; Islam, M.M.; Tyagi, V.V. Two side serpentine flow based photovoltaic-thermal-phase change materials (PVT-PCM) system: Energy, exergy and economic analysis. Renew. Energy 2018, 136, 1320–1336. [Google Scholar] [CrossRef]
- Kazemian, A.; Hosseinzadeh, M.; Sardarabadi, M.; Passandideh-Fard, M. Experimental study of using both ethylene glycol and phase change material as coolant in photovoltaic thermal systems (PVT) from energy, exergy and entropy generation viewpoints. Energy 2018, 162, 210–223. [Google Scholar] [CrossRef]
- Luo, Z.; Huang, Z.; Xie, N.; Gao, X.; Xu, T.; Fang, Y.; Zhang, Z. Numerical and experimental study on temperature control of solar panels with form-stable paraffin/expanded graphite composite PCM. Energy Convers. Manag. 2017, 149, 416–423. [Google Scholar] [CrossRef]
- Ciulla, G.; Brano, V.L.; Cellura, M.; Franzitta, V.; Milone, D. A Finite Difference Model of a PV-PCM System. Energy Procedia 2012, 30, 198–206. [Google Scholar] [CrossRef] [Green Version]
- Malik, M.; Dincer, I.; Rosen, M.A. Review on use of phase change materials in battery thermal management for electric and hybrid electric vehicles. Int. J. Energy Res. 2016, 40, 1011–1031. [Google Scholar] [CrossRef]
- Lari, M.O.; Sahin, A.Z. Effect of retrofitting a silver/water nanofluid-based photovoltaic/thermal (PV/T) system with a PCM-thermal battery for residential applications. Renew. Energy 2018, 122, 98–107. [Google Scholar] [CrossRef]
- Haji-Sheikh, A.; Eftekhar, J.; Lou, D. Some thermophysical properties of paraffin wax as a thermal storage medium. In Proceedings of the 3rd Joint Thermophysics, Fluids, Plasma and Heat Transfer Conference, St. Louis, MO, USA, 7 June–11 June 1982; American Institute of Aeronautics and Astronautics: Reston, VA, USA, 1982. [Google Scholar]
- Mazraeh, A.E.; Babayan, M.; Yari, M.; Sefidan, A.M.; Saha, S.C. Theoretical study on the performance of a solar still system integrated with PCM-PV module for sustainable water and power generation. Desalination 2018, 443, 184–197. [Google Scholar] [CrossRef]
- Klemm, T.; Hassabou, A.; Abdallah, A.; Andersen, O. Thermal energy storage with phase change materials to increase the efficiency of solar photovoltaic modules. Energy Procedia 2017, 135, 193–202. [Google Scholar] [CrossRef]
- Browne, M.C.; Lawlor, K.; Kelly, A.; Norton, B.; Cormack, S.J.M. Indoor Characterisation of a Photovoltaic/ Thermal Phase Change Material System. Energy Procedia 2015, 70, 163–171. [Google Scholar] [CrossRef] [Green Version]
- Mousavi Baygi, S.R.; Sadrameli, S.M. Thermal management of photovoltaic solar cells using polyethylene glycol 1000 (PEG1000) as a phase change material. Therm. Sci. Eng. Prog. 2018, 5, 405–411. [Google Scholar] [CrossRef]
- Royo, P.; Ferreira, V.J.; López-Sabirón, A.M.; Ferreira, G. Hybrid diagnosis to characterise the energy and environmental enhancement of photovoltaic modules using smart materials. Energy 2016, 101, 174–189. [Google Scholar] [CrossRef]
- Sarı, A.; Karaipekli, A. Preparation and thermal properties of capric acid/palmitic acid eutectic mixture as a phase change energy storage material. Mater. Lett. 2008, 62, 903–906. [Google Scholar] [CrossRef]
- Hasan, A.; McCormack, S.J.; Huang, M.J.; Sarwar, J.; Norton, B. Increased photovoltaic performance through temperature regulation by phase change materials: Materials comparison in different climates. Sol. Energy 2015, 115, 264–276. [Google Scholar] [CrossRef]
- Tyagi, V.V.; Buddhi, D. Thermal cycle testing of calcium chloride hexahydrate as a possible PCM for latent heat storage. Sol. Energy Mater. Sol. Cells 2008, 92, 891–899. [Google Scholar] [CrossRef]


| Author | Year | Findings |
|---|---|---|
| Elavarasan et al. [50] | 2020 | OM29 organic PCM poured directly under the PV module without using any intermediate layer. A maximum 1.2 °C PV module temperature reduction is noticed. |
| Velmurugan et al. [49] | 2020 | Developed composite PCM integrated behind the PV module without using a physical contact to avoid the potential induced degradation (PID) loss. Different thickness of the PCM matrix is analyzed and validated experimentally. An increase in thickness of PCM enhanced the cooling but linearity was achieved at 2.5 cm thickness. |
| Poongavanam et al. [51] | 2020 | A novel eutectic PCM is developed for Chidambaram climatic conditions. Operational variation of PCM is analyzed for summer and winter. During high melting temperature of PCM enables higher cooling than a low melting temperature of PCM. |
| Velmurugan et al. [16] | 2020 | A novel cylindrical tube-based PCM matrix is developed for the hot climatic condition of Thailand. Developed cylindrical tube PCM container placed behind the PV module without physical contact to avoid the mechanical stress and PID loss. Cylindrical tube PCM container consumes less amount of PCM as compared to other techniques. |
| Savvakis et al. [52] | 2020 | RT27 and RT31 commercial PCM is examined for Chaina, Crete location. It is noted that RT31 reduced 7.5 °C which is 1.1 °C higher than RT27. |
| Velmurugan et al. [8] | 2021 | Eutectic cold PCM is developed for PV module cooling. A 3 cm and 5 cm thickness of cold PCM is examined resulting higher cooling effect achieved for 5 cm thickness. |
| He et al. [53] | 2021 | Stearic acid and Lauric acid are mixed to prepare the eutectic combination to cool the PV module. Developed eutectic PCM reduced the PV module temperature maximum of 20 °C. |
| Velmurugan et al. [54] | 2021 | Cascaded PCM structure is developed for tropical and subtropical climatic conditions. The PCM selection algorithm is developed based on the existing experimental results. India and France require to be cooled only in summer and Thailand require cascaded structure for both summer and winter. |
| Divyateja et al. [55] | 2021 | Simulation is conducted with RT25HC commercial PCM to cool the PV module, in addition, CuO is composited to enhance the thermal property of the PCM. Nano-enhanced PCM reduced maximum of 2.02 °C. |
| Author | Thermal Collector | Heat Transfer Fluid | Methodology |
|---|---|---|---|
| Carmona et al. [108] |  | Water |
|
| Fu et al. [109] |  | Water |
|
| Naghdbishi et al. [110] |  | Deionized water, glycol/water, water/MWCNT, EG/MWCNT |
|
| Fu et al. [111] |  | MPCM slurry, water |
|
| Ahmadi et al. [112] |  | Water |
|
| Kazemian et al. [113] |  | EG/water |
|
| Basalike et al. [114] |  | Water and Al2O3 |
|
| Hasan et al. [115] | 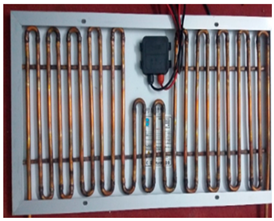 | Graphene nano fluid |
|
| Ciftci et al. [116] |  | Air |
|
| Yang et al. [117] |  | Water |
|
| Month | Ankara (PCM Tmelt/Thickness) | Mersin (PCM Tmelt/Thickness) |
|---|---|---|
| January | 4 °C/50 mm | 17 °C/31 mm |
| February | 15 °C/32 mm | 27 °C/38 mm |
| March | 3 °C/48 mm | 20 °C/34 mm |
| April | 12 °C/28 mm | 25 °C/35 mm |
| May | 22 °C/33 mm | 22 °C/31 mm |
| June | 26 °C/50 mm | 28 °C/26 mm |
| July | 35 °C/47 mm | 35 °C/39 mm |
| August | 25 °C/38 mm | 35 °C/34 mm |
| September | 22 °C/34 mm | 30 °C/45 mm |
| October | 14 °C/38 mm | 29 °C/47 mm |
| November | 10 °C/42 mm | 23 °C/43 mm |
| December | 5 °C/37 mm | 13 °C/31 mm |
| Author | PCM Name | Material Cost | Findings |
|---|---|---|---|
| Hasan et al. [56] | RT42 | PCM = USD 1/kg, payback period = 10 years. |
|
| Smith et al. [145] | - | PCM = 4.93 EUR/kg, Aluminum = 1.6 EUR/kg, PV/PCM = 244.31 EUR/m2 |
|
| Sun et al. [146] | Paraffin wax | PCM = 37 (RMB)/kg |
|
| Arici et al. [118] | - | PCM = 100 EUR/m2, Aluminum = 32 EUR/m2, |
|
| Zhao et al. | Paraffin wax | PCM = 30 RMB/kg |
|
| Reference | System | PCM Name | Location | Study Type | Solar Irradiation | Experiment Type/Period | Study Environment | Highlights | TPV without PCM (°C) | TPV with PCM (°C) |
|---|---|---|---|---|---|---|---|---|---|---|
| [124] | PV-cPCM | GR40 | Belfast, UK | Simulation and Experiment | 750 | The developed system is performed in indoor climatic simulation and validated with experimental results under the constant irradiance of 750 W/m2 and 23 °C of Tamb. | A 6 mm thickness of two interfin is projected inside the PCM container. | NA | 38 | |
| Indoor | A 0.5 mm thickness of a total 32 interfin is projected inside the PCM container. | NA | 29 | |||||||
| A Strip aluminum matrix is installed behind the PV module without PCM. | NA | 55 | ||||||||
| [73] | PV-PCM | RT42 | Indoor | Experiment | 1000 | Indoor | Concentrated PV cells have experimented with under 28–35 °C of Tamb and 1000 W/m2 constant irradiance using a solar simulator. | PCM is filled in a 13 mm thickness of Perspex box type container and integrated on the PV module back surface. | 60.9 | 58.7 |
| [84] | PV-PCM | RT27 | Utrecht | Simulation | - | 365 days | The developed numerical model is performed to find the annual performance of different thicknesses of PCM integration. | During the peak daytime, 2–3 h PCM utilized its latent heat of fusion effectively and lowers the TPV. An increase in thickness of PCM has shown the variation in enhancing the electrical efficiency and reduction in TPV. | 55 | 27 |
| [94] | PV-cPCM | RT25, Paraffin wax 32 | Indoor | Simulation | 750 | Indoor | Different length of interfin is examined to optimize the fin length without restricting the PCM mushy state convection. | An increase in length of interfin enhanced the heat transfer better than a 40 mm fin length as it connects the front and bottom layer of the PCM that restricts mass convection in PCM. | NA | 55 |
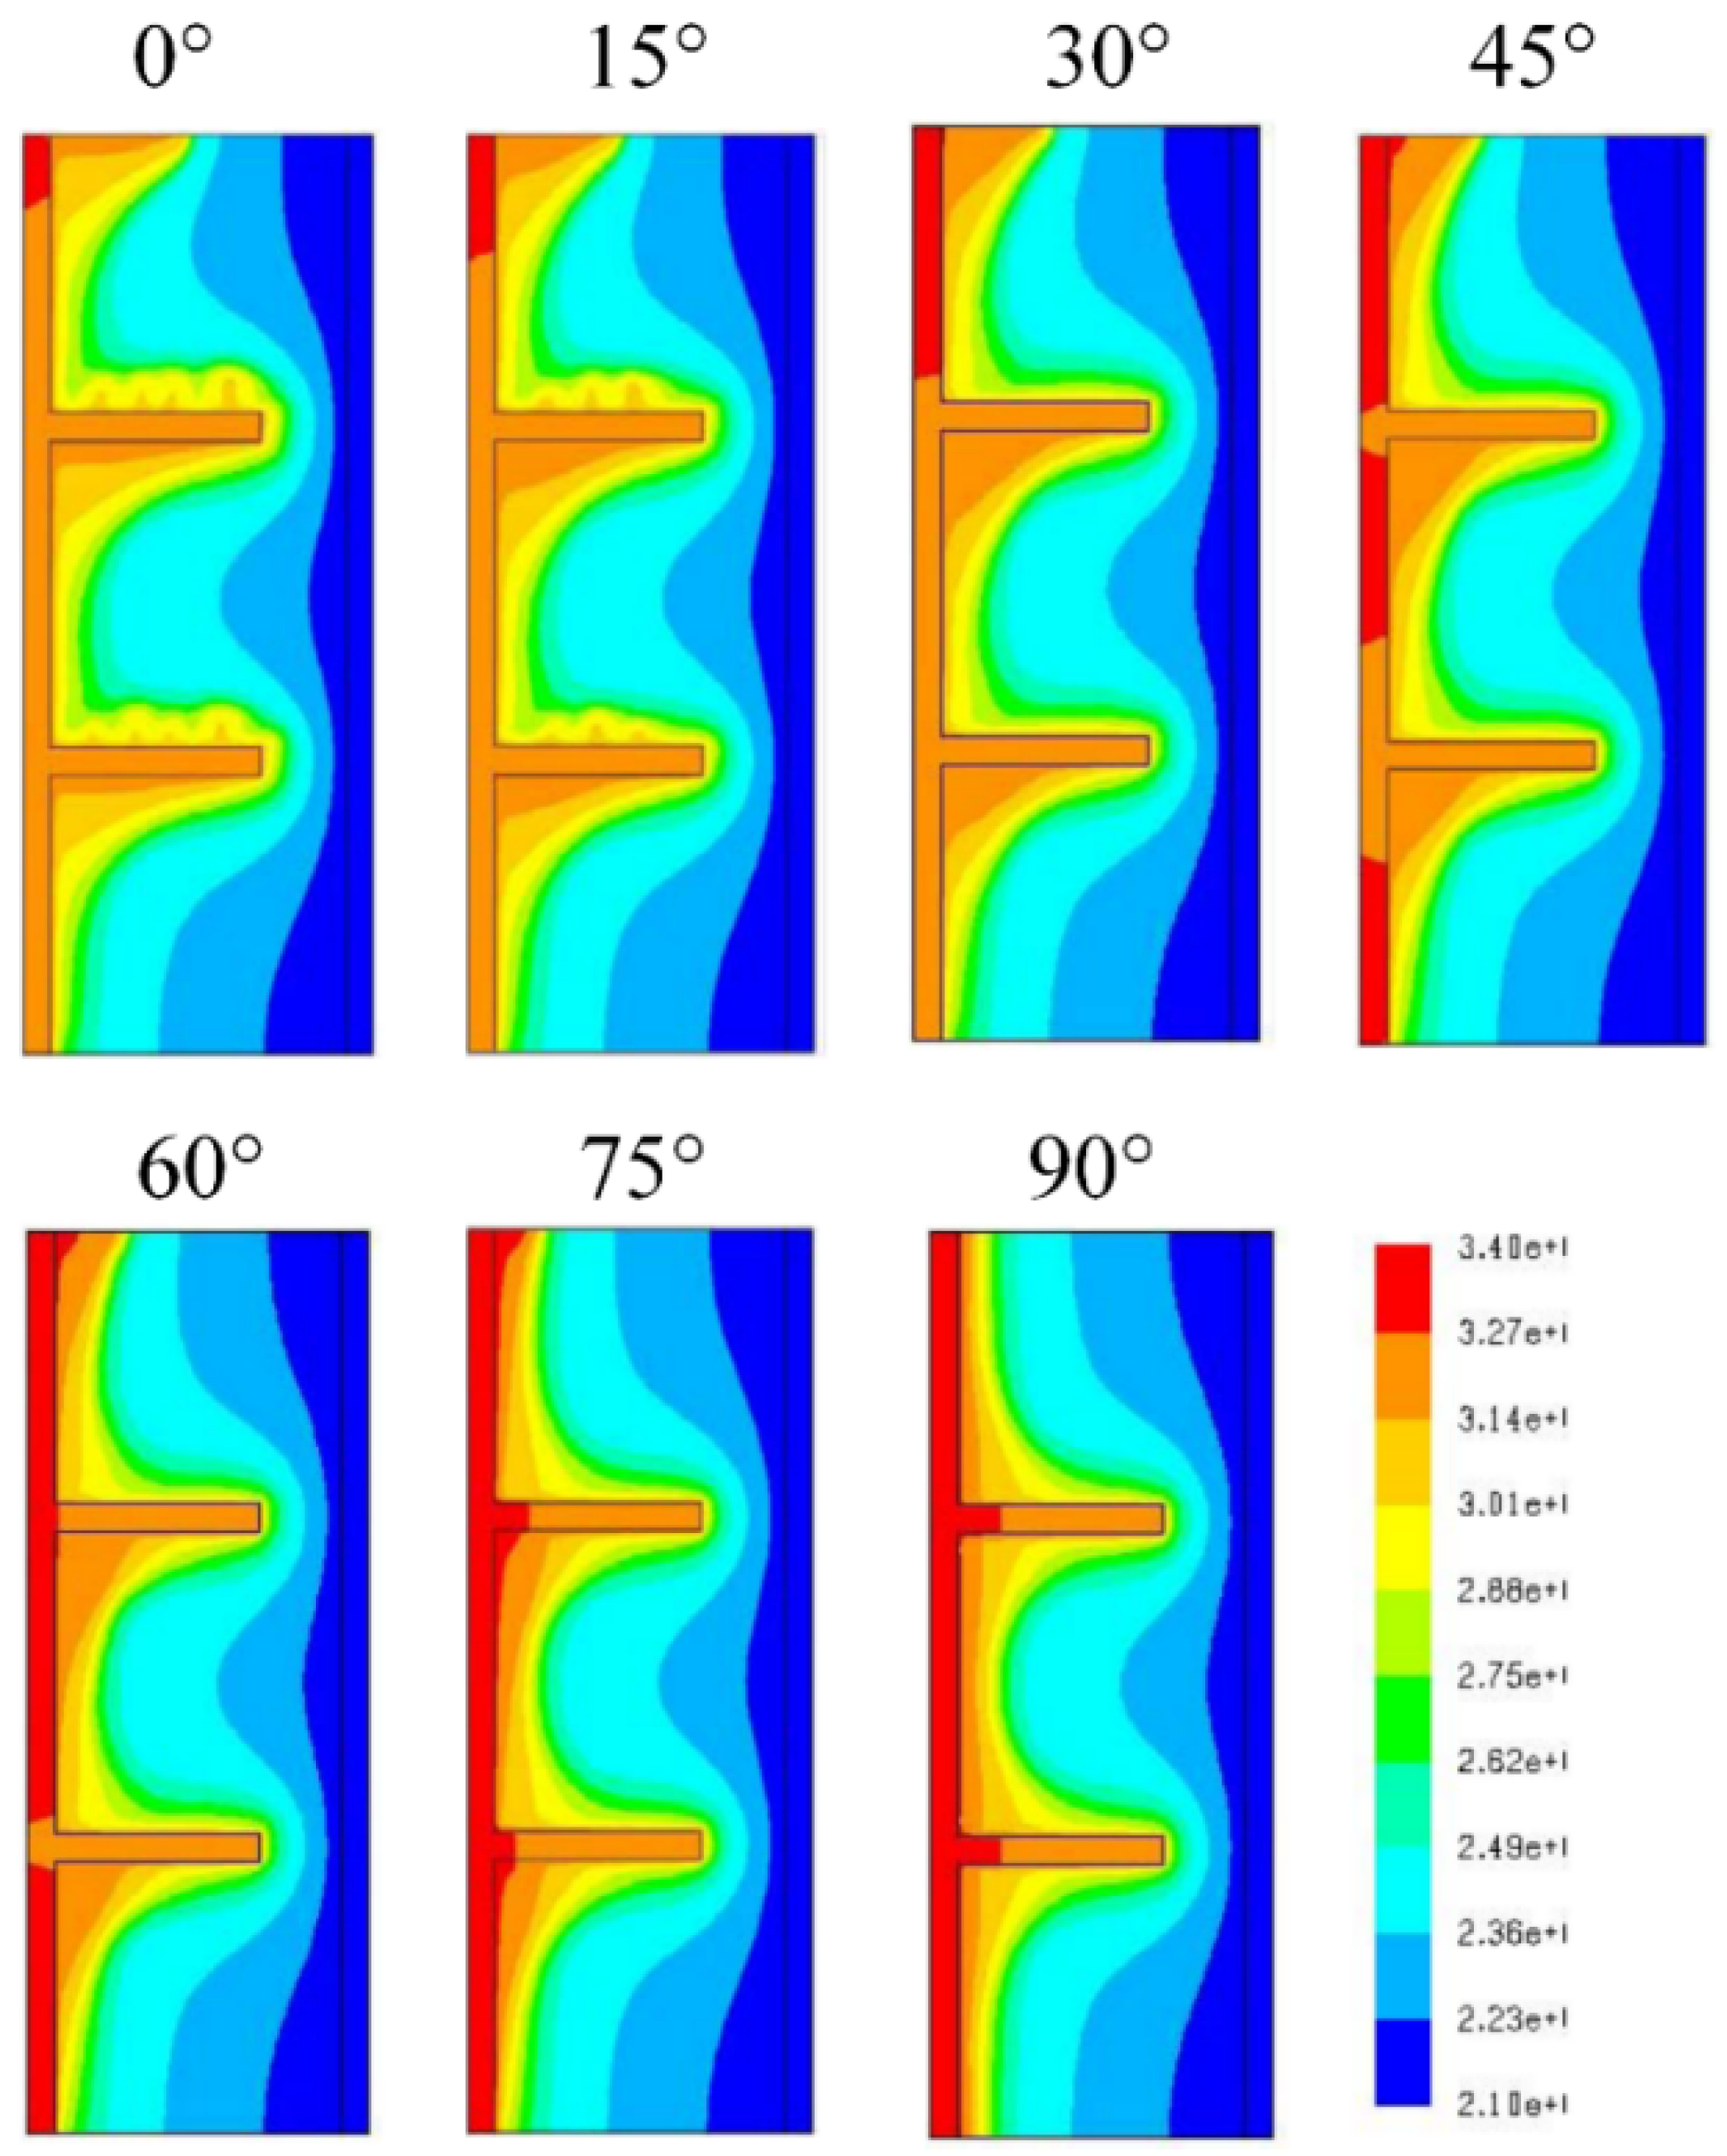
| [95] | PV-cPCM | RT25, Paraffin wax 32 | Indoor | Simulation | 750 | Indoor | The different inclinations of the fin intruded PCM container is performed to analyze the effectiveness of the conduction and convection relationship. | A PCM container at lower than 45° inclination encourages convection mode inside the PCM, following 45° to 90° inclination pure conduction dominates. | NA | 45 |
| [96] | PV-PCM | RT25 | Indoor | Simulation | 1000 | Indoor | Different heights of the PCM containers are developed and performed under constant irradiance of 1000 W/m2 to find the effectiveness of heat transfer. | An increase in height of the PCM container reduced the TPV for a longer time compared to the shorter height. An increase in PCM height directly enhances the heat storage capacity of the PCM. | ~87 | 40 |
| [87] | PV-cPCM | RT25 | Indoor | Simulation | 1000 | Indoor | PCM container with and without interfin is exposed to the constant irradiance of 1000 W/m2. | PCM containers without interfin struggle to extract the thermal energy from PV modules compared to PCM with interfin. | ~35 | ~30 |
| [98] | PV-cPCM | Paraffin wax | Rajasthan, India | Simulation and Experiment | 1900 | Less than a month | Metal scraps are reinforced with paraffin wax to enhance the thermal conductivity of the PCM. | V-through concentration increased the TPV abruptly compared to conventional PV module, however, prepared composite PCM reduced the TPV effectively compared to PV without PCM. | 90 | 78 |
| [77] | PV-PCM | RT35 | Malaysia | Simulation and Experiment | 1000 | Less than a month | A 2 cm thickness of liquid PCM is directly filled on the Tedlar surface and fiber optic glass is used to cover the back surface of the PCM like sealant material. | PCM receives thermal energy directly from the Tedlar surface without any intermediate layer that helps to reduce the thermal resistance resulting electrical output of the PV module being greatly enhanced. | 70 | 35 |
| [79] | PV-cPCM | Paraffin wax 59 | Indoor | Experiment | 1000 | Indoor | PCM with interfin is exposed to the constant irradiance of 500 W/m2, 600 W/m2, 800 W/m2, and 1000 W/m2. | Higher TPV reduction achieved for 1000 W/m2 and 800 W/m2 than 500 W/m2 and 600 W/m2. Low irradiance requires a low melting temperature of PCM. | 72.1 | 69.6 |
| [85] | PV-PCM | RT25HC | Indoor | Simulation | 1000 | Indoor | Different thickness of PCM is examined to find the optimum level under varying environmental conditions such as different wind speed, wind azimuth. | A 3 cm thickness of PCM maintained the TPV at 33 °C and the same with 1cm thickness PCM was maintained at 45 °C. An increase in thickness of PCM enables higher TPV reduction. | NA | 33 |
| [74] | PV-PCM | RT27 | Greece | Experiment | 1020 | Summer | The developed experiment was performed in outdoor climatic conditions using RT27 at the Technical University of Crete, Chania, Greece climatic condition. | Three equal dimensions of PCM containers are integrated on the PV module to minimize the mechanical stress on the PV module surface. | 60.1 | 40.4 |
| [71] | PV-cPCM | Coconut oil and Vaseline | South Korea | Simulation and Experiment | 660 | Summer, Winter | Coconut oil and Vaseline are used as PCM under summer, intermediate and cloudy conditions. | Both PCM are packed in honeycomb and macro type nylon containers, resulting in honeycomb-structured PCM enhanced higher heat from PV module than nylon due to the thermal conductivity of the PCM container. | 34 | 32 |
| [81] | PV-PCM | Candle wax | Malysia | Experiment | 1605 | Less than a month | Heat sink and PCM as coolant material integrated with the PV module and performed at TNB Research in Kajang, Selangor, Malaysia. | The heat sink degrades the output power and efficiency as it failed to extract the heat from the PV module compared to candle wax as PCM. | 45.1 | 43.1 |
| [78] | PV-PCM | RT35 | Malaysia | Experiment | 1000 | Less than a month | A 2 cm thickness of RT35 is examined under the typical climatic condition of Malaysia. | The developed system reduced the TPV maximum of 10 °C and this reduction sustains for 6 h. | 52 | 42 |
| [72] | PV-PCM | Petroleum Jelly | Indonesia | Experiment | 1120 | Less than a month | 1 kg of PCM is filled in a rectangular tube and is integrated into the PV module to study the performance under Indonesian climatic conditions. | Rectangular tube PCM container greatly enhanced the TPV reduction as PCM container wall acts as a thermal distribution fin. | 60 | 54.3 |
| [88] | PV-PCM | RT25HC | Indoor | Simulation | 1000 | Indoor | A 2cm thickness of PCM container is performed under different inclinations. | It was found that 15° to 90° inclination extracts higher thermal energy than 0° inclination. | 43.4 | 34.5 |
| [80] | PV-PCM | Crude oil and Palm oil | Indonesia | Simulation | - | Less than a month | Coconut oil and palm oil-based different thickness of PCM is performed as a coolant device. | The highest PCM thickness of 9 cm yields higher TPV reduction but linearity in TPV is stopped at 8 cm thickness of PCM. | ~75 | ~60 |
| [147] | PV-PCM | RT27, RT20, SP25A8 | Greece | Simulation | - | January-August | Finite difference method simulation is performed and compared with existing simulation tools to find the accuracy of the simulation. | A 5 cm thickness of RT 25 enhanced higher TPV reduction annually. | ~65 | ~38 |
| [83] | PV-PCM | RT44 | Pakistan | Simulation and Experiment | - | June | Different Tmelt and thickness of PCMs are performed under hot climatic conditions of Pakistan to establish the proposed method for large-scale integration. | Linearity in TPV reduction is achieved at 2.5 cm thickness of RT44 throughout the year. | 86.5 | 57.8 |
| [103] | PVT-PCM | RT42, RT55 | Venice, Abhu Dabi | Simulation | 900, 820 | Summer and winter | A numerical simulation is performed for the Double skin façade of PV and PCM under the Venice, Helsinki, and Abhu Dhabi climatic condition. | A double façade allows the air to flow over the PV module and behind the PCM container that helps to enhance the heat transfer from the PV module to PCM. | 74 | 45 |
| [104] | PVT-PCM | OM37 | France | Simulation | 875 | Summer and winter | The numerical model is performed for wetted water channel-based PCM containers to cool the PV module under France climatic conditions. | PCM associated fully wetted absorber channel with constant water flow helps to maintain the TPV constant during peak daytime as a fully wetted absorber channel without PCM. | 69.17 | 53.86 |
| [102] | PVT-PCM | S21 | Australia | Experiment | 560 | June and August | A building management system is equipped to monitor the thermal and electrical load of the proposed model at the University of Wollongong Innovation Campus. | PCM is encapsulated by HDPE and applied for the dual purpose to reduce the TPV as well as heating, ventilation, and air-conditioning purpose. | - | ~29 |
| [105] | PVT-PCM | Paraffin wax 50 | Malaysia | Simulation and Experiment | - | Indoor | Different thermal collector tubes and flow rates are performed using CFD simulation using different solar irradiance. | Thermal conductivity enhanced PCM and nano fluid-based thermal collector favors to reduce the PCM temperature as well as TPV in higher order. | 65 | 50 |
| [107] | PVT/PVT-PCM | Paraffin wax 42–72 | Iran | Experiment | 1050 | August and September | Conventional PV and PVT, and a novel PVT-PCM (nanofluid) systems have been experimented under Iranian climatic condition | PVT-PCM enhanced the electrical efficiency higher than conventional PV modules also nano fluid-based PVT without PCM enhanced the electrical efficiency. | ~62 | ~45 |
| [82] | PVT-PCM | Paraffin wax 42-44, RT42, Ceresin | Indoor | Experiment | 1000 | Less than a month | Different thickness of PCM and flow rate of water is examined under indoor condition. | Increase in thickness of PCM and mass flow rate of water enhanced the better performance than PV without cooling. | ~73 | ~64 |
| [106] | PV-cPCM/PVT-PCM | RT42 | UAE | Experiment | 960 | Less than a month | Different types of PCM-based PV module cooling are performed under UAE climatic conditions. | Water assisted system maintained the PCM temperature in lower order as compared to interfin PCM. | 53 | 44 |
| [120] | PV-cPCM | RT35, RT10HC, RT18HC, RT25HC | Central Europe | Simulation | 550, 100, 550, 500 | November and June | Different Tmelt of PCM with honeycomb thermal enhancer is performed for real-time outdoor conditions. | During winter RT10HC performs well and for summer RT25HC reduced the TPV better than other PCMs. | ~39 | 35 |
| [99] | PV-cPCM | White petroleum Jelly | Lebanon | Experiment | 800 | Less than a month | Pure PCM, graphite, and copper powder-based thermal conductivity enhanced PCM performed in indoor conditions. | Pure and cPCM enhanced the electrical efficiency by 3% and 5.8% as compared to PV without PCM. | 63.3 | 56.8 |
| [101] | PV-cPCM | Paraffin wax 42 | Indoor | Experiment | 800 | Indoor | The indoor experiment is carried out for pure PCM and aluminum foam impregnated PCM. | Aluminum foam impregnated PCM shows a wide variation in TPV reduction compared to pure PCM, an increase in thermal conductivity of the PCM helps to extract the higher thermal energy from the PV module. | 61.39 | 39.58 |
| [148] | PVT-PCM | PCM 28-34 | Indoor | Experiment | 800 | Indoor | Copper absorber plate associated with heat pipe is structure is performed using with and without PCM. The experiment is conducted in controlled indoor climatic conditions. | PCM integrated thermal collector reduced the TPV linearly compared to PVT without PCM for a maximum of an entire period of experimentation (550 min). | 66.6 | 56.7 |
| [57] | PV-PCM | RT44 | Pakistan | Simulation | - | 365 days | Movable PCM containers are placed behind the PV module to increase the PCM discharge rate during the off-daytime hours. | Movable PCM container enhanced the electrical efficiency by 9% at the peak daytime hours. | 63.30 | 42.10 |
| [149] | PVT-PCM | RT35 | - | Simulation | - | Summer, winter, and mid season | Numerical simulation is developed for double-skin façade of PV-PCM to find the operational variation throughout the year, different climatic conditions (summer, winter, and mid-season). | The developed double-skin façade model enhanced the electrical efficiency and waste heat from the PV module is extracted and utilized for room heating and ventilation purpose. | NA | NA |
| [150] | PV-cPCM | RT55 | Egypt | Experiment | 1100 | August, September, October | Pure PCM and Al2O3 nanoparticles mixed composite PCM is performed under Egypt climatic condition | Nanoparticles enhanced PCM reduced the TPV effectively in the whole period of experimentation compared to pure PCM. | 75 | 49.3 |
| [151] | PV-PCM | RT28 | Slovenia | Simulation and Experiment | 560 | 365 days | A 3.5 cm thickness of PCM is directly filled on the PV module back surface and transparent acrylic glass is used to cover the back side of the PCM to prevent liquid PCM leakage. | During winter PV power enhancement is not high as compared to the summer season for Ljubljana climatic conditions however the experimental results are in a good match with simulation. | 65.30 | 43.14 |
| [152] | PV-cPCM | RT55 | Egypt | Experiment | 1100 | Less than a month | Pure and composite PCM is performed for Egypt’s climatic conditions. | Al2O3 nanoparticles combined with PCM enhanced the electrical efficiency by 7.1% as compared to pure PCM. | 75 | 59 |
| [153] | PVT-PCM | PCM 15 | China | Simulation and Experiment | 1000 | January and April | Encapsulated and regular PCMs are integrated behind the thermal collector to analyze the system performance under Hefei, China’s climatic condition. | Encapsulated PCM failed to reduce higher TPV as compared to regular PCM with thermal collectors because encapsulated PCM attained poor physical contact with thermal collectors. | ~75 | ~60 |
| [154] | PV-PVT PVT-PCM | Paraffin wax 46–48 | Iran | Experiment | 1000 | August and September | Nano fluid-assisted thermal collector with and without PCM is developed and examined under Iran climatic conditions. | ZnO/water nano fluid assisted PV module with and without PCM enhanced the overall efficiency of 40% and 53% as compared to conventional PV module, respectively. | 56.62 | 47.22 |
| [155] | BIPVT-PCM | PCM-45 | China | Simulation | 540 | Summer and winter | The PCM-assisted heat pipe is developed and performed for both summer and winter of Changsha location. | An increase in the mass flow rate of water enhanced the TPV reduction and electrical efficiency. | 70 | 25.2 |
| [156] | PV-PCM | RT38–43 | Croatia | Simulation | 905 | January, March, and June | RT42 and pork fat as PCM with the thickness of 23 mm is performed for Croatia climatic conditions. | For January and March, both PCM reduced similar TPV, however for June RT42 PCM enhanced the heat transfer better than pork as PCM. | - | 62.93 |
| [157] | CPV-PCM | RT27 | UK | Experiment | 926 | Indoor | A 2.0 Concentrated photovoltaic system is integrated with RT27 to study the effectiveness of cooling under UK climatic conditions. | A 4.2 cm thickness of PCM enhanced the electrical efficiency maximum of 5%. | 40.2 | 32.5 |
| [158] | PV-PCM | Paraffin wax 25 | South Korea | Simulation and Experiment | 240 | May and June | A 3 cm and 5 cm thickness of PCM is integrated with a rooftop PV module to study the heat transfer capability in South Korea’s climatic conditions. | Developed PV-PCM enhanced the output power by 3%. | 65 | 40 |
| [159] | PV-PCM | RT35 | Egypt | Experiment | 820 | Indoor | A 2 cm thickness of PCM with Al2O3 and cylindrical tube interfin based system performed under Egypt climatic conditions. | Al2O3 and Cylindrical fin enhanced the TPV reduction of 46.3% and 52.3%, respectively. | 74.5 | 34.5 |
| [160] | BIPV-PCM | Paraffin wax, Beewax | Indonesia | Experiment | 1042 | July | Beeswax and paraffin wax is examined under Indonesian climatic condition using the experimental configuration of [86]. | Beewax reduced higher TPV than paraffin wax with the help of its low Tmelt; however, both PCM reduced the TPV effectively compared to PV without PCM. | 54 | 33 |
| [161] | PV-TEG/PV-PCM-TE | Paraffin wax 47, NaOH-KOH | China | Simulation | 900 | Less than a month | A concentrated PV module with TEG is performed to cool the PV module using with and without PCM. | TEG without PCM under 500 times concentration reduced the TPV lower than with PCM as TE alone failed to extract thermal energy from the PV module. | 85 | 62 |
| [162] | PV-cPCM | Paraffin wax 40 | Indoor | Simulation | 920 | A 3 cm thickness of PCM is composited with graphite porous matrix and heat sink. | PCM with graphite porous matrix enhanced less electrical conversion than PCM with heatsink. | 80 | 75 | |
| Indoor | PCM with graphite porous matrix and heatsink enhanced the PV module efficiency maximum of 12.97%. | 80 | 69 | |||||||
| [163] | PVT-PCM | Paraffin wax 49 | Malaysia | Experiment | 700 | April, July, October, and November | Nano compound mixed PCM incorporated with the PV module, and nano fluid SiC-water flows inside the PCM to enhance the heat transfer. | Heat removal from the PV module is effective when the working fluid flows inside the PCM and in this proposed system also electrical efficiency is greatly enhanced. | 68.3 | 39.52 |
| [157] | PV-PCM | RT27 | UK | Experiment | 926 | Indoor | A 21 Wp triple-junction solar cell is examined under low concentration. | PCM, TEG, and heatsink are integrated like a sandwich layer to control the excess rise in TPV. Favorably electrical efficiency is enhanced maximum of 0.56%. | 65 | 51 |
| [164] | PVT-PCM | Paraffin wax 30 | India | Experiment | 1200 | - | Thermal collector with and without PCM is performed under Punjab climatic conditions. | An increase in the flow rate of water enhanced the electrical efficiency greatly compared to the thermal collector without PCM, however, thermal efficiency is high for the only thermal collector because PCM assisted thermal collector allows the thermal energy to store in PCM reduces the water temperature. | 80 | 55 |
| Month | Plane of Array (W/m2) | PV (℃) | PV-PCM (℃) | Power (PV) MW | Power (PV-PCM) MW | Power % | PR (PV) % | PR (PV-PCM) % |
|---|---|---|---|---|---|---|---|---|
| January | 991.21 | 58.06 | 49.21 | 11.61 | 12.03 | 3.49 | 78.10 | 81.59 |
| February | 1057.67 | 57.84 | 46.51 | 12.40 | 12.98 | 4.42 | 78.17 | 82.59 |
| March | 1085.47 | 63.77 | 51.77 | 12.42 | 13.04 | 4.78 | 76.28 | 81.06 |
| April | 1078.37 | 71.25 | 58.05 | 11.95 | 12.63 | 5.39 | 73.89 | 79.29 |
| May | 1040.36 | 70.03 | 59.43 | 11.59 | 12.12 | 4.36 | 74.28 | 78.64 |
| June | 998.19 | 66.39 | 58.06 | 11.30 | 11.69 | 3.40 | 75.44 | 78.85 |
| July | 1011.51 | 76.59 | 66.59 | 10.95 | 11.44 | 4.23 | 72.19 | 76.42 |
| August | 1039.53 | 73.09 | 62.49 | 11.43 | 11.96 | 4.41 | 73.30 | 77.72 |
| September | 1043.12 | 73.84 | 62.24 | 11.43 | 12.01 | 4.82 | 73.06 | 77.89 |
| October | 1025.47 | 68.82 | 56.22 | 11.49 | 12.10 | 5.11 | 74.67 | 79.78 |
| November | 966.13 | 68.19 | 57.97 | 10.85 | 11.32 | 4.17 | 74.87 | 79.04 |
| December | 931.74 | 58.97 | 49.57 | 10.87 | 11.29 | 3.71 | 77.81 | 81.52 |
| Month | Plane of Array (W/m2) | PV (℃) | PV-PCM (℃) | Power (PV) MW | Power (PV-PCM) MW | Power % | PR (PV) % | PR (PV-PCM) % |
|---|---|---|---|---|---|---|---|---|
| January | 817.07 | 51.32 | 42.47 | 9.84 | 10.18 | 3.40 | 80.25 | 83.65 |
| February | 944.73 | 60.02 | 48.69 | 10.98 | 11.49 | 4.46 | 77.48 | 81.93 |
| March | 1019.26 | 65.99 | 53.99 | 11.55 | 12.14 | 4.82 | 75.57 | 80.39 |
| April | 1030.25 | 76.33 | 63.13 | 11.17 | 11.82 | 5.51 | 72.27 | 77.78 |
| May | 1015.96 | 82.77 | 72.17 | 10.70 | 11.22 | 4.60 | 70.21 | 74.81 |
| June | 976.91 | 77.43 | 69.1 | 10.54 | 10.93 | 3.56 | 71.92 | 75.48 |
| July | 949.22 | 72.85 | 62.85 | 10.45 | 10.90 | 4.17 | 73.38 | 77.55 |
| August | 954.65 | 67.84 | 57.24 | 10.74 | 11.22 | 4.32 | 74.98 | 79.30 |
| September | 945.56 | 69.83 | 58.23 | 10.54 | 11.07 | 4.74 | 74.34 | 79.09 |
| October | 957.3 | 69.37 | 56.77 | 10.70 | 11.27 | 5.12 | 74.49 | 79.61 |
| November | 860.64 | 58.52 | 48.3 | 10.06 | 10.48 | 4.02 | 77.95 | 81.97 |
| December | 780.44 | 55.37 | 45.97 | 9.24 | 9.59 | 3.66 | 78.96 | 82.62 |
| Location | Maximum Plane of Array (W/m2) | Average TPV (℃) | Average PR (%) | Average Power (MW) | |||
|---|---|---|---|---|---|---|---|
| PV | PV-PCM | PV | PV-PCM | PV | PV-PCM | ||
| Islamabad | 1030.25 | 67.30 | 56.57 | 75.15 | 79.51 | 10.54 | 11.02 |
| UAE | 1085.47 | 67.23 | 56.50 | 75.17 | 79.53 | 11.52 | 12.05 |
Publisher’s Note: MDPI stays neutral with regard to jurisdictional claims in published maps and institutional affiliations. |
© 2022 by the authors. Licensee MDPI, Basel, Switzerland. This article is an open access article distributed under the terms and conditions of the Creative Commons Attribution (CC BY) license (https://creativecommons.org/licenses/by/4.0/).
Share and Cite
Velmurugan, K.; Elavarasan, R.M.; De, P.V.; Karthikeyan, V.; Korukonda, T.B.; Dhanraj, J.A.; Emsaeng, K.; Chowdhury, M.S.; Techato, K.; El Khier, B.S.A.; et al. A Review of Heat Batteries Based PV Module Cooling—Case Studies on Performance Enhancement of Large-Scale Solar PV System. Sustainability 2022, 14, 1963. https://doi.org/10.3390/su14041963
Velmurugan K, Elavarasan RM, De PV, Karthikeyan V, Korukonda TB, Dhanraj JA, Emsaeng K, Chowdhury MS, Techato K, El Khier BSA, et al. A Review of Heat Batteries Based PV Module Cooling—Case Studies on Performance Enhancement of Large-Scale Solar PV System. Sustainability. 2022; 14(4):1963. https://doi.org/10.3390/su14041963
Chicago/Turabian StyleVelmurugan, Karthikeyan, Rajvikram Madurai Elavarasan, Pham Van De, Vaithinathan Karthikeyan, Tulja Bhavani Korukonda, Joshuva Arockia Dhanraj, Kanchanok Emsaeng, Md. Shahariar Chowdhury, Kuaanan Techato, Bothaina Samih Abou El Khier, and et al. 2022. "A Review of Heat Batteries Based PV Module Cooling—Case Studies on Performance Enhancement of Large-Scale Solar PV System" Sustainability 14, no. 4: 1963. https://doi.org/10.3390/su14041963