Abstract
China has a considerable impact on climate change, as it is the world’s largest developing country. Its carbon emissions are also a global concern. This research employed a multi-region input–output model to estimate the local emission effect and the regional spillover effect caused by the demand for intermediate and final products, to analyze the interregional flow of carbon emissions, and to identify the main industries causing domestic carbon emissions in China from 2007 to 2012. A structural path analysis model was used to evaluate the contribution of different factors and demand types to changes in carbon emissions. The following findings were obtained in this study: (1) The regional spillover effect of carbon emissions driven by domestic demand is characterized by inland provinces’ demand leading to emissions in coastal provinces. (2) Electricity, nonmetallic minerals, and metals are the key industries for carbon emissions. (3) The results of the SDA indicate that the scale effect is the main driving force for the growth in carbon emissions caused by domestic demand in China. Fixed capital formation is the most critical demand factor influencing carbon emissions. This study provides new insights into the characteristics of regional emission transfer in China. The conclusion of this paper is helpful to China in achieving carbon peak and carbon neutrality.
1. Introduction
After China’s reform and opening-up, especially its accession to the WTO, its economy has achieved rapid development. China became the world’s second largest economy in 2010 when its nominal GDP surpassed that of Japan [1]. However, the rapid development of China’s economy has been accompanied by increasing environmental problems, including significant amounts of carbon emissions. The Chinese government has taken a series of policies and actions aimed at reducing carbon emissions in order to deal with global climate change. The study focuses on the effect of regional differences on carbon emissions in China. Additionally, the Chinese government has adopted a new development strategy that combines the domestic cycle as its main component with the domestic and international double cycles that mutually reinforce each other because of economic development and changes in the international environment. It is therefore essential to understand the impact of domestic demand on carbon emissions in order to ensure sustainable development of the environment.
We focus on China because of the following reasons. First, the largest emitter of carbon dioxide is China, the world’s most populous country. It is therefore important to focus on China’s low-carbon development to reduce global carbon emissions. Second, the development of the Chinese economy is uneven across the country. Hence, there is the issue of regional carbon emissions transfers. By analyzing the interregional carbon emission transfer problem, China can achieve carbon neutrality and peak carbon emissions as soon as possible. Third, China is the world’s largest developing nation. Its success in reducing carbon emissions is highly relevant to other developing countries, thereby contributing to the promotion of global carbon peak and carbon neutrality.
Thus, a multi-regional input–output (MRIO) model is utilized in this study to estimate regional carbon emissions and transfers. In particular, we analyze the local emission effect and interregional spillover effect of carbon emissions due to domestic demand in each province of China. We also discuss the flow of interregional emissions and the characteristics of interregional emission transfer under different trade patterns during 2007–2012. Finally, we employ the MRIO–structural decomposition analysis (SDA) model to evaluate the contribution of different factors and types of domestic demand to the change in carbon emissions from multiple perspectives.
This study contributes to the existing literature in the following three aspects. First, as opposed to previous studies that examined China’s carbon emissions from the perspective of external demand, such as international trade, this study explores the impact of domestic demand for intermediate and final products on emissions from the perspective of domestic demand. This research can effectively complement the existing research on China’s economic development strategy and its sustainability. Second, the MRIO model is used in the study to quantify emissions caused by the demand for intermediate and final products in each region of China because of local and regional spillover effects. Moreover, the flow of carbon emissions between regions is analyzed, the major carbon emitters are identified, and the MRIO–SDA model is utilized in this study to assess the contribution of different factors and demand types to carbon emissions. The results can provide empirical evidence for low-carbon development at provincial and industry levels in China. Third, in contrast with the existing literature on the demand of coastal provinces leading to carbon emissions in central and western provinces, this study finds that the interregional shift of carbon emissions due to domestic demand is to some extent characterized by a shift from inland provinces to coastal provinces, thereby helping to clarify the responsibility of different economic activities for interregional carbon emissions.
The remainder of this paper is presented as follows. In the second section, we review the literature on carbon emissions, carbon transfer, and related methods. The third section discusses the models and data. The fourth section includes the results. The fifth section presents discussion. The sixth section contains conclusions and policy implications.
2. Literature Review
The study primarily relates to three strands of literature. First, this study is relevant to the literature on carbon transfer. In general, this literature falls into two categories. Some scholars focus on the issue of state-to-state transfers of carbon emissions [2,3,4,5,6,7,8,9]. Their studies found that developing countries are usually net exporters of embodied emissions [7,10], whereas developed nations are net importers of embodied carbon emissions [6,11,12]. Others began to analyze the characteristics of transfer within a country by treating its economy as a heterogeneous multiregional one [1,13,14,15,16,17]. In particular, our study is relevant to the study by Zhou et al. (2018), which utilized MRIO and MRIO–SDA models to analyze transfer in China’s regions and industries and identify the determinants of regional embodied emissions. It was found that carbon emissions are primarily transferred from developed to slightly developed regions [18]. Our study differs from that by Zhou et al. (2018) in the following three aspects. First, our study focused on the provincial level, whereas Zhou et al. (2018) combined Chinese provinces into eight major regions, thereby masking the characteristics of carbon emission transfer in some provinces. Second, we distinguished different trade modes in the analysis of carbon emission transfer. This approach allowed us to explore the impact of various trade modes on carbon transfer for the formulation of carbon reduction policies. Third, we used the MRIO–SDA model to assess the contribution of five factors and five types of domestic demand to emission changes. We determined the drivers of emissions in key industries based on this assessment. Compared with Zhou’s discussion of the influence of three factors on carbon emissions, our study certainly contributes to the advancement of research in this field.
Second, the analysis of carbon emissions in trade based on input–output models is vital in the environmental field [14,19,20]. The input–output analysis may be divided into two categories: embodied emissions in bilateral trade (EEBT) and the MRIO model. The single-region input–output (SRIO) model serves as the basis for the EEBT method [21,22,23,24]. The SRIO model is based on the single-region input–output table, whereas the MRIO model is based on the multi-region input–output table. The SRIO model assumes that each region has the same technology level, i.e., the “homogeneous technology assumption”, while the MRIO model allows each region to use different production technology. Thus, homogeneous technology assumption exists, resulting in some bias in the estimation results. The MRIO model captures the feedback effects of interregional commodity flows more precisely than the EEBT approach does by assuming technological heterogeneity, thereby increasing the accuracy of the measurement results [14,17,25]. This study employed the MRIO model to determine the interregional embodied emissions and their transfer characteristics, thereby enriching the results of using the MRIO model to quantify embodied emissions.
Third, this study is related to the literature that explores the factors influencing embodied emissions in trade. The investigation of the factors influencing the implicit emissions in trade has two main approaches: index decomposition analysis (IDA) and the SDA method [26]. The IDA method only requires sectoral data; thus, its application is flexible. Numerous studies have examined the impact of carbon emissions at various levels using the IDA method [27,28,29,30]. The SDA method is also widely used [31,32,33,34]. For example, Yan et al. (2018) applied this method to analyze emission intensity in China from 2002 to 2012 [33]. The SDA method makes use of an input–output model in contrast with the IDA method and is capable of capturing both production-side effects as well as consumption-side effects accurately [35]. In contrast with previous literature, this study employs the SDA method to examine the impact of five factors and five types of domestic demand that influence carbon emissions in China from multiple perspectives. On the basis of these results, we analyzed the factors that affect emissions in various key industries, thereby enriching the results of using this method to analyze the drivers of emissions.
3. Theoretical Models and Data
3.1. MRIO Model
The structure of the MRIO table is shown in Table 1. This table includes m regions, each with n sectors. The carbon emissions generated by each sector in each region can be determined by combining the data from the carbon emission environmental account.

Table 1.
Description of the structure of the MRIO table.
In Table 1, intermediate demand Z is a matrix of mn × mn dimensions; the matrix Zss on the diagonal indicates that a product or service in the region is used as an intermediate product by a sector in the region, and the matrix Z sr (s ≠ r) on the nondiagonal indicates that a product in region s is used as an intermediate product by region r. The final demand Y is a matrix of mn × m dimensions, with the submatrix in denoting the final demand of region s for sector i in region r. EXs and Xs are both matrices of n × 1 dimensions, denoting export and total output in region s, respectively. IM_Zs’, IM_Ys’, VAs’, and Xs’ are all matrices of 1 × n dimensions that denote imported intermediate goods, imported final goods, value added, and total inputs, respectively, for region s. Equation (1) is derived from the column-wise equilibrium relationship of the MRIO model, and Equation (2) is obtained from the collation of Equation (1).
where X represents the total output, I represents the unit matrix, Y denotes final demand, EX denotes export, and A denotes the direct consumption coefficient matrix, which reflects trade activity in intermediate goods between regions. is the full consumption coefficient matrix. Based on the basic equilibrium equation, this study can estimate emissions from economic activities in conjunction with the environmental accounts of carbon emissions.
where E denotes the emissions from economic activity, and denotes the diagonal matrix of carbon emission intensity.
In this study, we evaluated the emissions and interregional transfer emissions resulting from the demand for intermediate and final products in each region of China to identify the characteristics of carbon transfer among regions. The carbon emissions are attributed to the local and other regions s by taking the example of a region r.
Item (1) in Equation (4) represents the emissions generated when the products produced in region r meet the demand for final products in this region. Item (2) represents the emissions generated when the products produced in region s meet the demand for final products in region r. Item (3) represents the emissions generated when the products produced in region r meet the demand for intermediate products in this region. Item (4) represents the emissions generated when the products produced in region s meet the demand for intermediate products in region r. On this basis, we can find that the sum of (1) and (2) represents the carbon emissions resulting from meeting the demand for final products in region r in this region and other regions, and the sum of (3) and (4) represents the carbon emissions resulting from meeting the demand for intermediate products in region r in this region and other regions. The sum of (1) and (3) represents the carbon emissions in the region resulting from the final demand in region r, referred to as the local emission effect, whereas the sum of (2) and (4) represents the carbon emissions in other regions resulting from the final demand in region r, referred to as the regional spillover effect.
Final demand Y can be decomposed into the product structure effect δ, the regional structure effect η, and the scale effect ρ. Thus, the following is obtained based on Equation (3):
where denotes the carbon emissions due to final demand. δ denotes the product structure of each sector based on final demand. η denotes the final demand structure in each region, and ρ denotes the sum of all final demands.
Let the carbon emissions in the comparison period be and the carbon emissions in the base period be . Then, the change in emission in this period is . The symbol “△” indicates the amount of change.
According to Equation (5), we decomposed the change in to obtain :
The impact of five types of factors on carbon emissions can be identified from Equation (6). For the non-uniqueness of the SDA form, this study adopts the “average of the two polar decompositions” [36]. Thus, the following can be obtained:
The final demand in China’s MRIO table contains five items—namely, rural residential consumption, urban residential consumption, government consumption, fixed capital formation, and inventory change, i.e., . The following is obtained by substituting them into Equation (3) and performing the SDA decomposition:
3.2. Data
This study used two types of data for its analysis. The first type of data consisted of interprovincial input–output tables for China obtained from the Regional Sustainable Development Simulation Laboratory, Institute of Geographical Sciences and Resources, and Chinese Academy of Sciences for 2007, 2010, and 2012. A total of 30 sectors were found in 2007 and 2010, and 42 sectors were found in 2012. Thus, we consolidated them into 17 sectors. Tibet was added to Xinjiang in 2012, which was unified with the input–output tables in 2007 and 2010. The 2007 and 2012 China provincial interregional input–output tables contain five types of final demand—namely, rural consumption, urban consumption, government consumption, fixed capital formation, and inventory changes. In comparison, the 2010 China provincial interregional input–output table contains only two types of final demand—namely, final consumption expenditure and gross capital formation. Consequently, the impact of different types of final demand on emissions only for the years 2007 and 2012 was analyzed in this study. The second category of data was the Carbon Emission Environmental Account data. These data were derived from the Environmental Account of the 2016 version of the WIOD database, which provides a sectoral carbon emission level for China from 2000 to 2016.
4. Results
In conjunction with rapid economic growth, greenhouse gas emissions have increased substantially. Based on the MRIO model, this study calculates and analyzes the local and interregional spillover effects of emissions caused by domestic demand in various provinces, discusses the flow direction of interregional emissions, and evaluates the contribution of multiple factors and demand types to emissions changes by using the MRIO–SDA model. This approach is critical for the coordination of the economic development and environmental sustainability of different regions of China.
4.1. Local Emission Effects and Inter-Regional Spillover Effects of Carbon Emission
China has a vast territory and abundant natural resources. Different regions have varying levels of economic development and resource endowment. China’s marketization has led to trade growth among various regions. This scenario deepens economic and commercial ties, resulting in a transfer of emissions among different regions. In general, the transfer of emissions between different regions presumably represents a transfer from the “developed regions” to the “developing regions”. The reason is that developed provinces focus on industries with low pollution and high added value, whereas slightly developed provinces and cities focus on industries with high pollution and low added value. Table 2 displays the local emission effects and regional spillover effects of domestic demand-induced emissions from 2007 to 2012. In this period, the total carbon emissions increased steadily, rising from 5219.75 Mt in 2007 to 7682.14 Mt in 2012, an increase of 47.17%, of which 57.2% came from the local region effect. The regional spillover effect also exhibited an upward trend. However, its increase was smaller than the increase in the local region effect. During the period, the financial crisis in 2008 did not weaken domestic production activities, thereby reducing carbon emissions due to domestic demand. This observation is reflected in the fact that China’s GDP has maintained an upward trend, rising from RMB 27.01 trillion in 2007 to RMB 53.86 trillion in 2012, an increase of 99.41%. This study concludes from the comparison of the local emission effect and regional spillover effect that the emissions resulting from domestic demand are dominated by local emission effects—namely, emissions in the area are determined primarily by local production to satisfy local demand. At the provincial level, coastal provinces, such as Jiangsu, Zhejiang, Shandong, and Guangdong, are among the top provinces in terms of the local emission effect and regional spillover effect.
Table 2.
Local emission effects and regional spillover effects of emissions caused by domestic demand in China from 2007 to 2012.
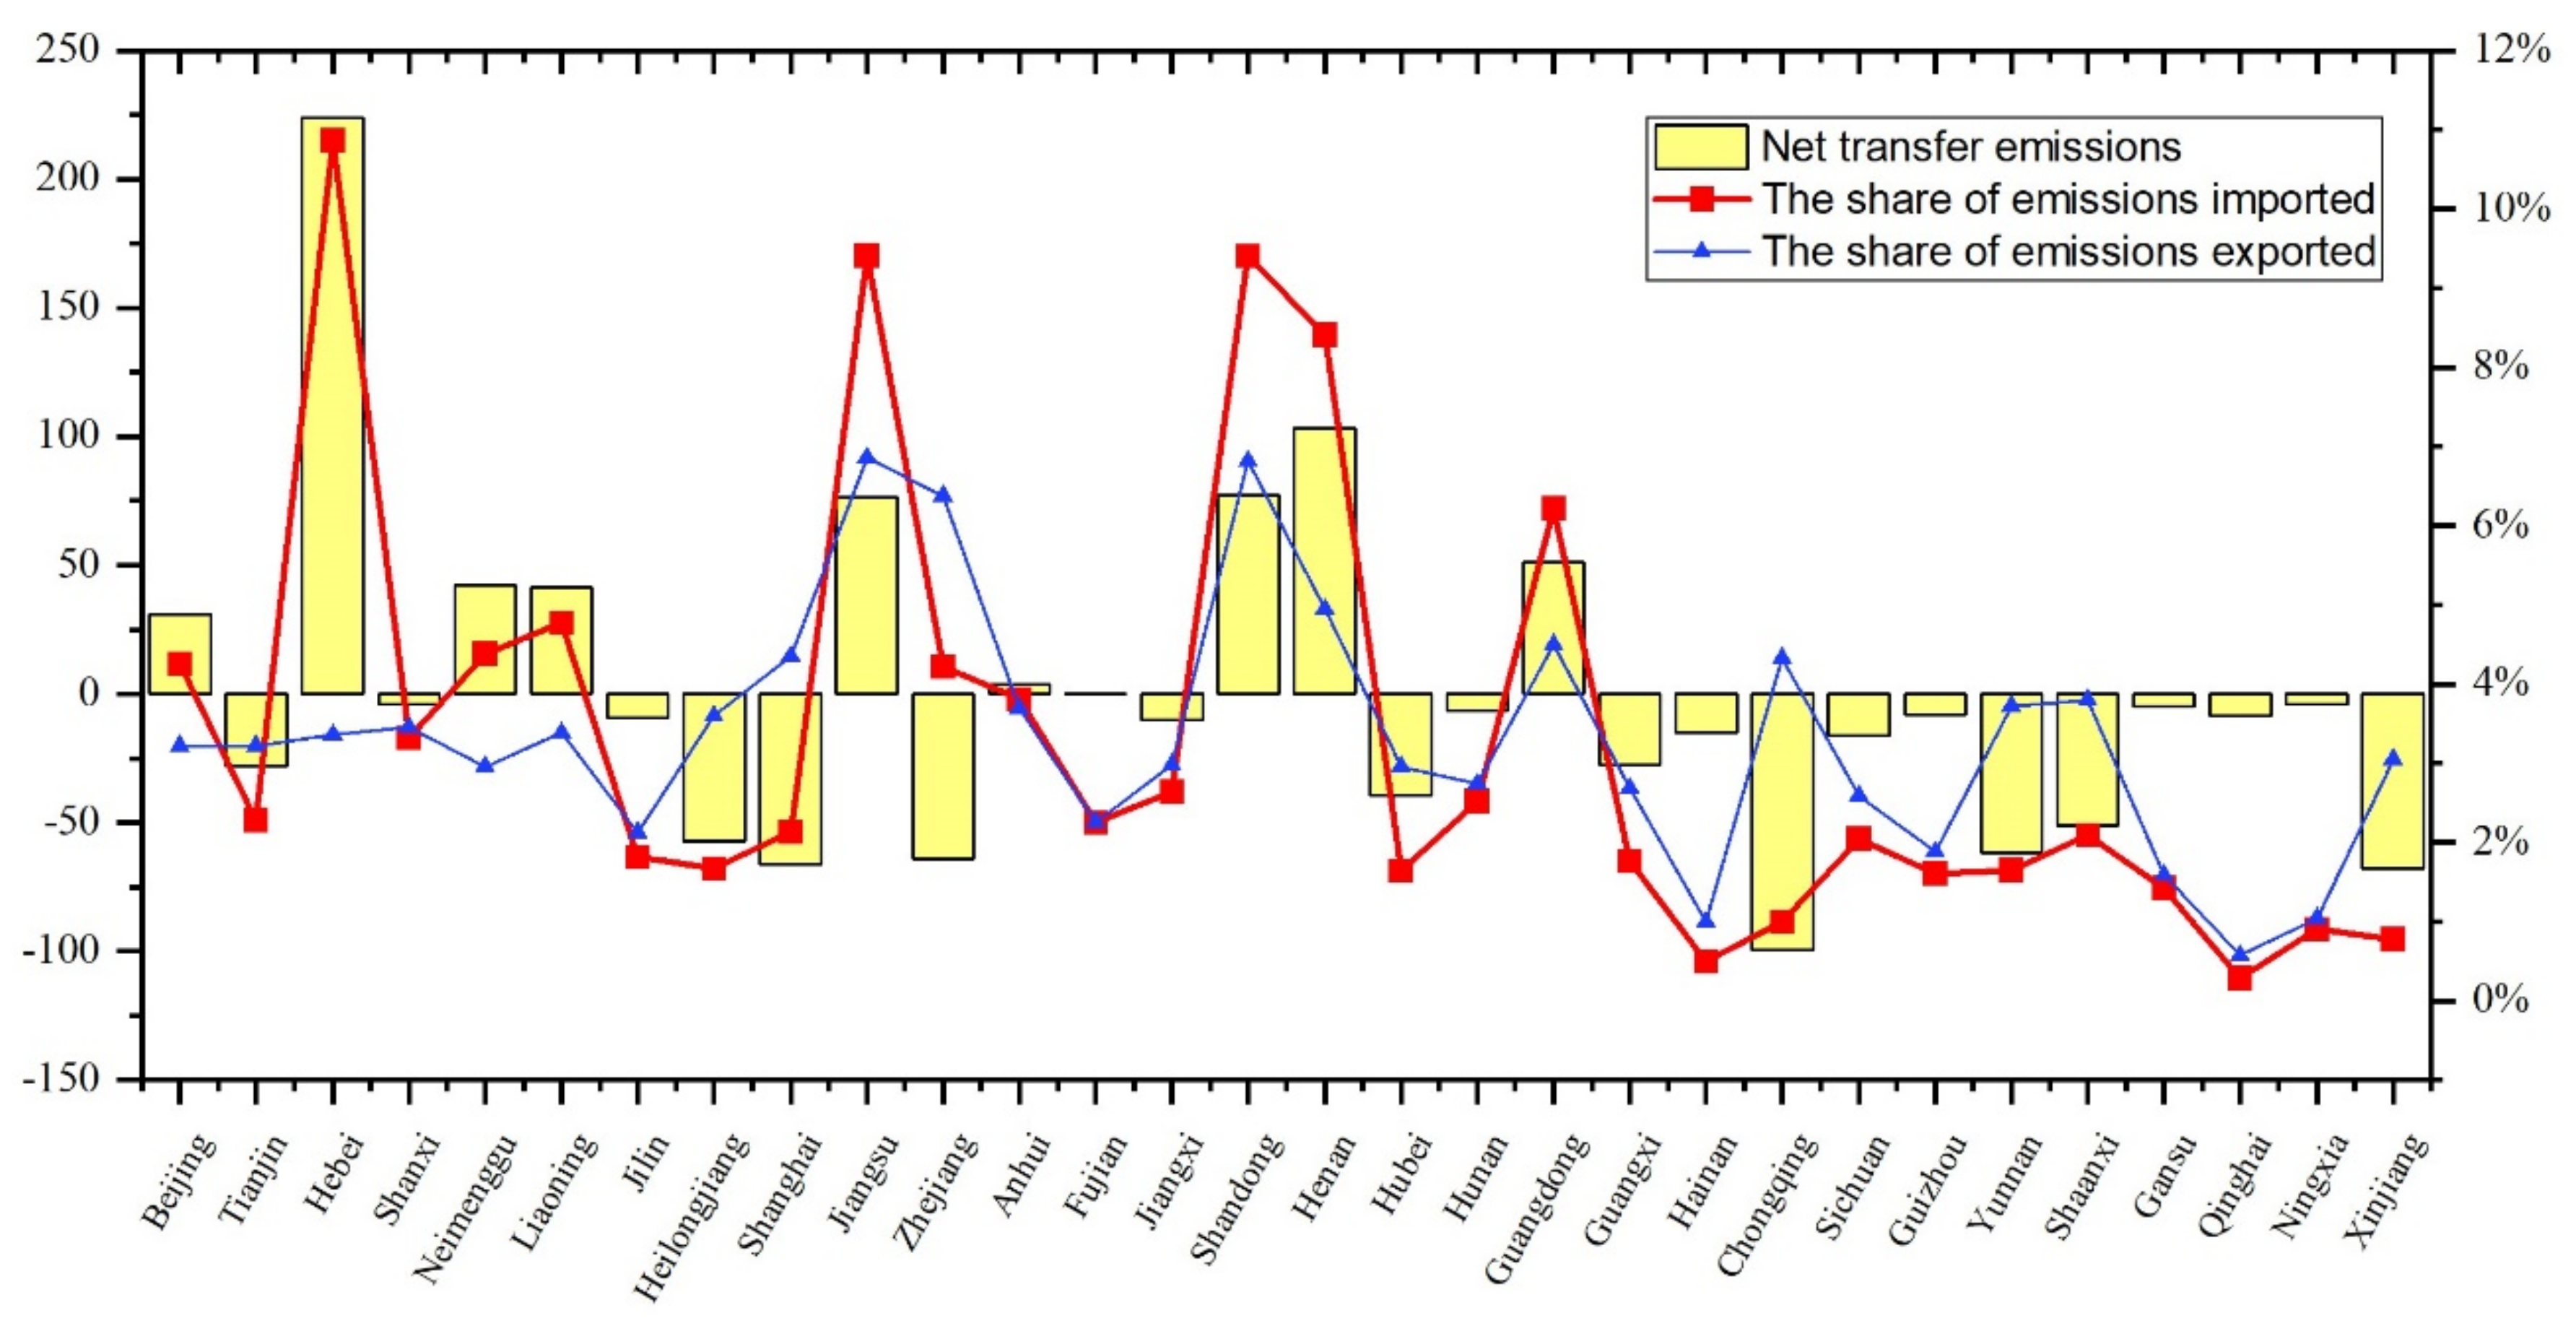
On the basis of the above analysis, we can intuitively display the flow characteristics of regional carbon emissions caused by domestic demand in the following sections. Figure 1 illustrates the flow of the regional spillover effect of carbon emissions in China in 2012. As shown in Figure 1, a relatively scattered distribution of carbon emissions is found across the various provinces in China. Along with coastal provinces, inland provinces, such as Henan, Shanxi, Yunnan, and Chongqing, transfer carbon emissions to other provinces through the domestic value chain, indicating that no unilateral large-scale transfer of carbon emissions exists from eastern coastal provinces to inland provinces. This finding differs from the findings of the existing literature on regional transfer emissions of air pollutants resulting from external demand. According to Wang et al. (2017), the regional transfer emissions of air pollutants caused by external demand are characterized by emissions shifted from eastern coastal provinces to inland provinces [37]. This observation indicates that the characteristics of transfer emissions for carbon emissions are distinct from those of air pollution because of regional differences despite the synergistic management of air pollution and carbon emissions. This study also shows that the regional spillover effect of carbon emissions is dispersed across provinces and that inland provinces may transfer carbon emissions to coastal provinces. This finding differs from the previous literature, which found that coastal demand drives emissions in central and western provinces [18,38]. In Figure 1, the position and relative relationship of carbon emissions of provinces cannot be directly compared. In light of Figure 1, we created Figure 2, which intuitively shows that the top five provinces in terms of proportion of regional transfer out are Jiangsu, Shandong, Zhejiang, Guangdong, and Henan, accounting for 6.86%, 6.82%, 6.37%, 4.5%, and 4.94%. The top five provinces in terms of proportion of regional transfer in are Hebei, Jiangsu, Shandong, Henan, and Guangdong with 10.87%, 9.41%, 9.4%, 8.41%, and 6.21%. The difference in the share of carbon emissions transferred out among China’s provinces is lower than that in the share of emissions transferred in. This scenario results in a high probability that the provinces with a high share of emissions transferred in would also have a high net transferred in. As expected, the top five provinces for regional net transferred-in emissions are consistent with those for the proportional regional transferred-in emissions. In particular, these provinces are Hebei, Henan, Shandong, Jiangsu, and Guangdong, with 223.89, 103.35, 77.03, 76.3, and 51.08 Mt, respectively. On the contrary, Chongqing, Xinjiang, Shanghai, Zhejiang, and Yunnan have the highest emissions resulting from the net transfer of emissions. Therefore, we can conclude that the transfer of emissions caused by domestic demand is quite different from that of pollution caused by external demand. Despite the relatively high amounts of regional transfer emissions and transfer emissions in coastal provinces, the demand for inland provinces leads to emissions in eastern coastal provinces.
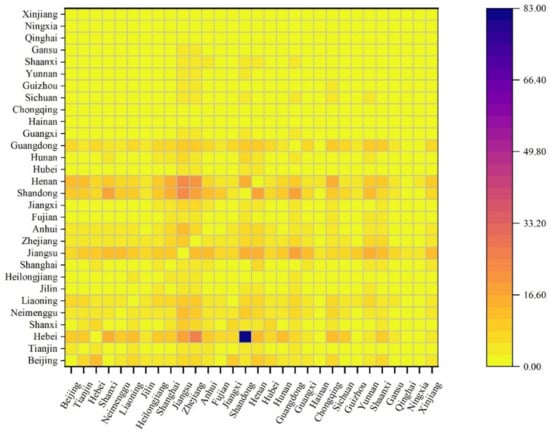
Figure 1.
Transfer of emissions by the province in China, 2012.

Figure 2.
Share of transferred carbon emissions and net transferred emissions by the province in China, 2012. Note: The net transferred-in emissions are the difference between transferred-in and transferred-out emissions of each province, corresponding to the primary axis in million tons (Mt). The share of transferred-out and transferred-in emissions indicate the share of transferred-out/transferred-in emissions of each province in the total transferred-out/transferred-in emissions of the country, respectively, corresponding to the secondary axis in percentage (%).
4.2. Analysis of Carbon Emissions at the Industry Level
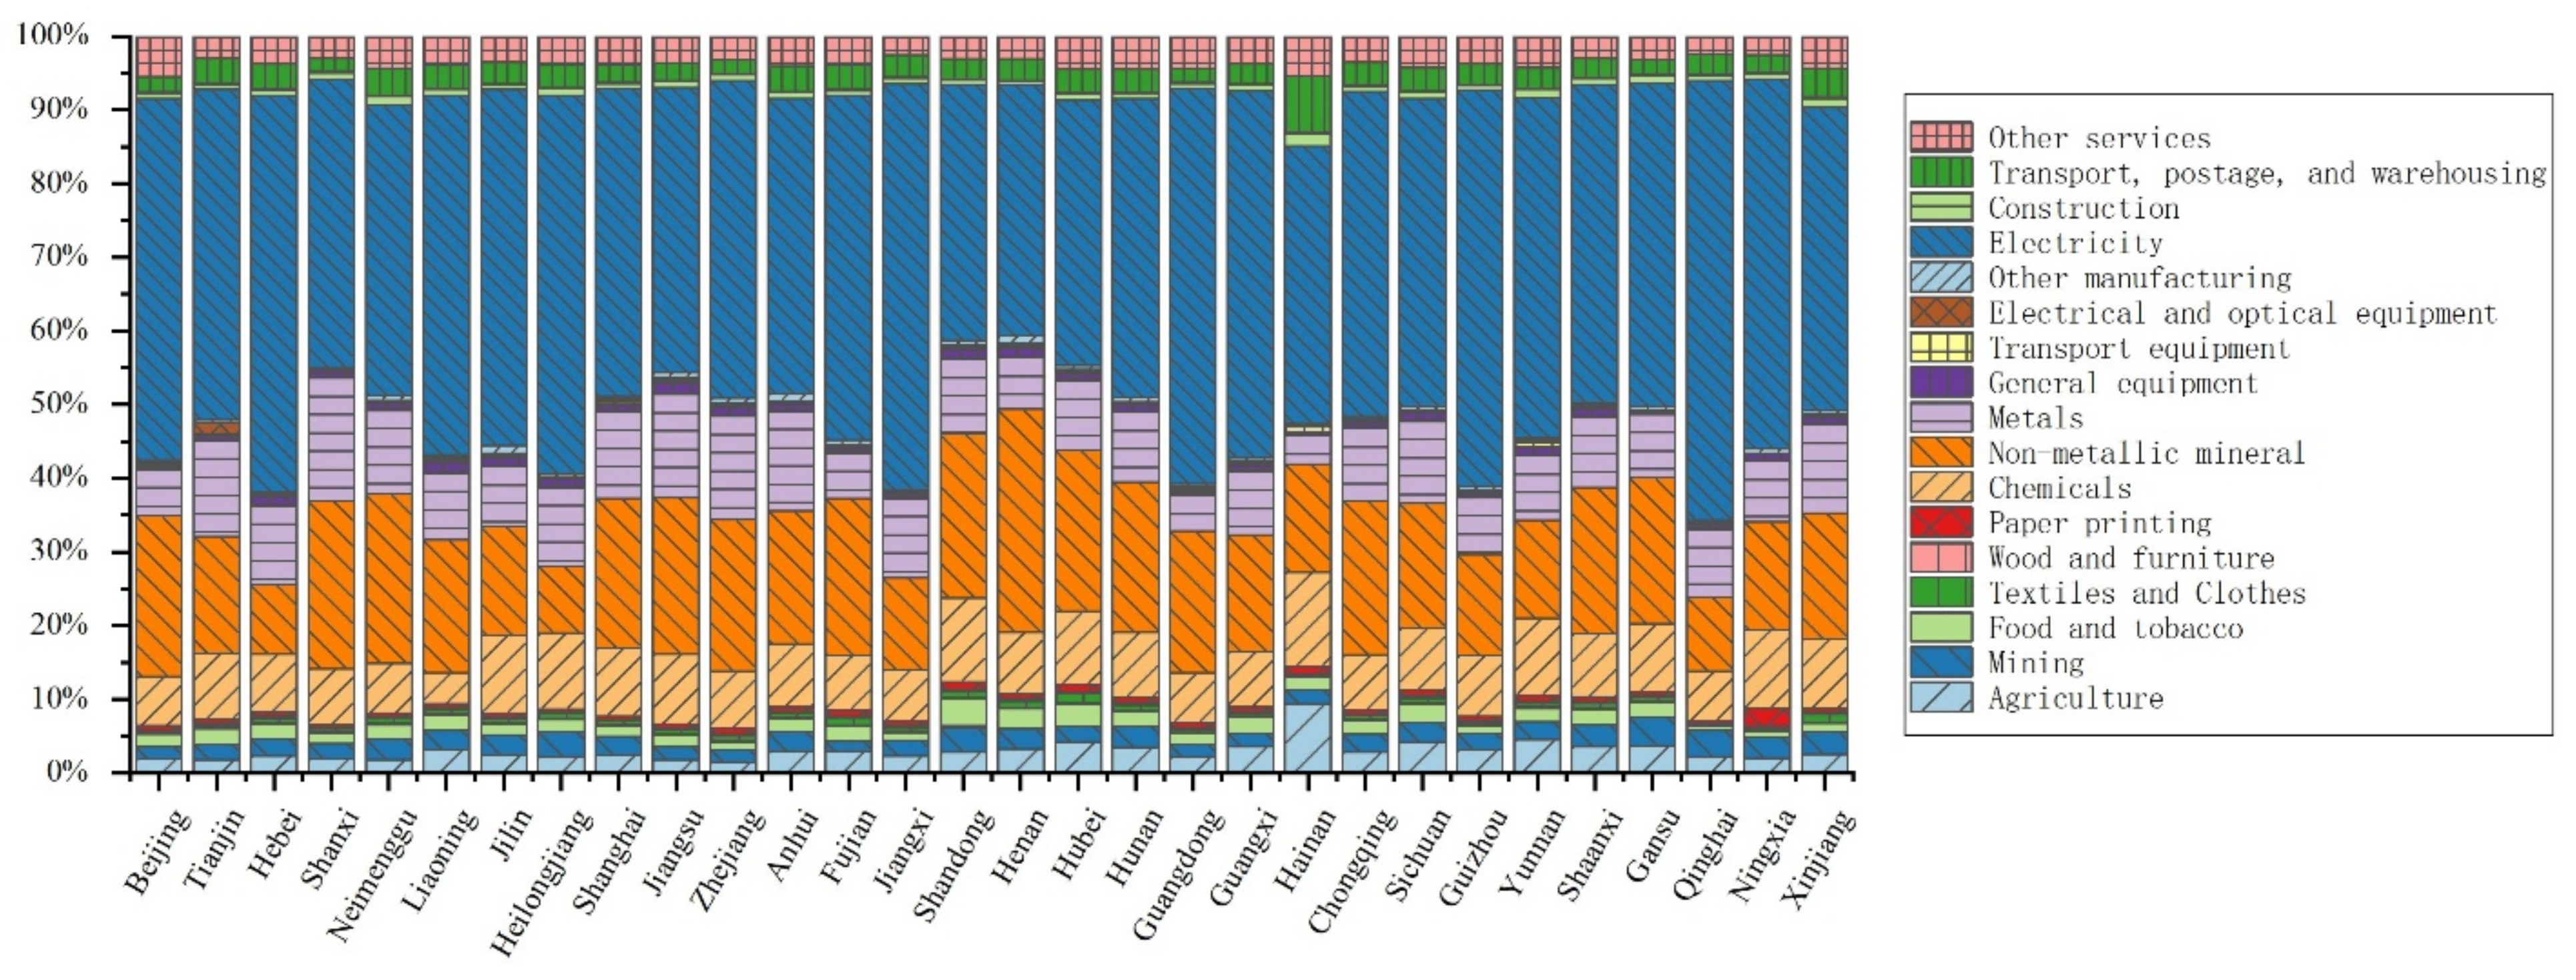
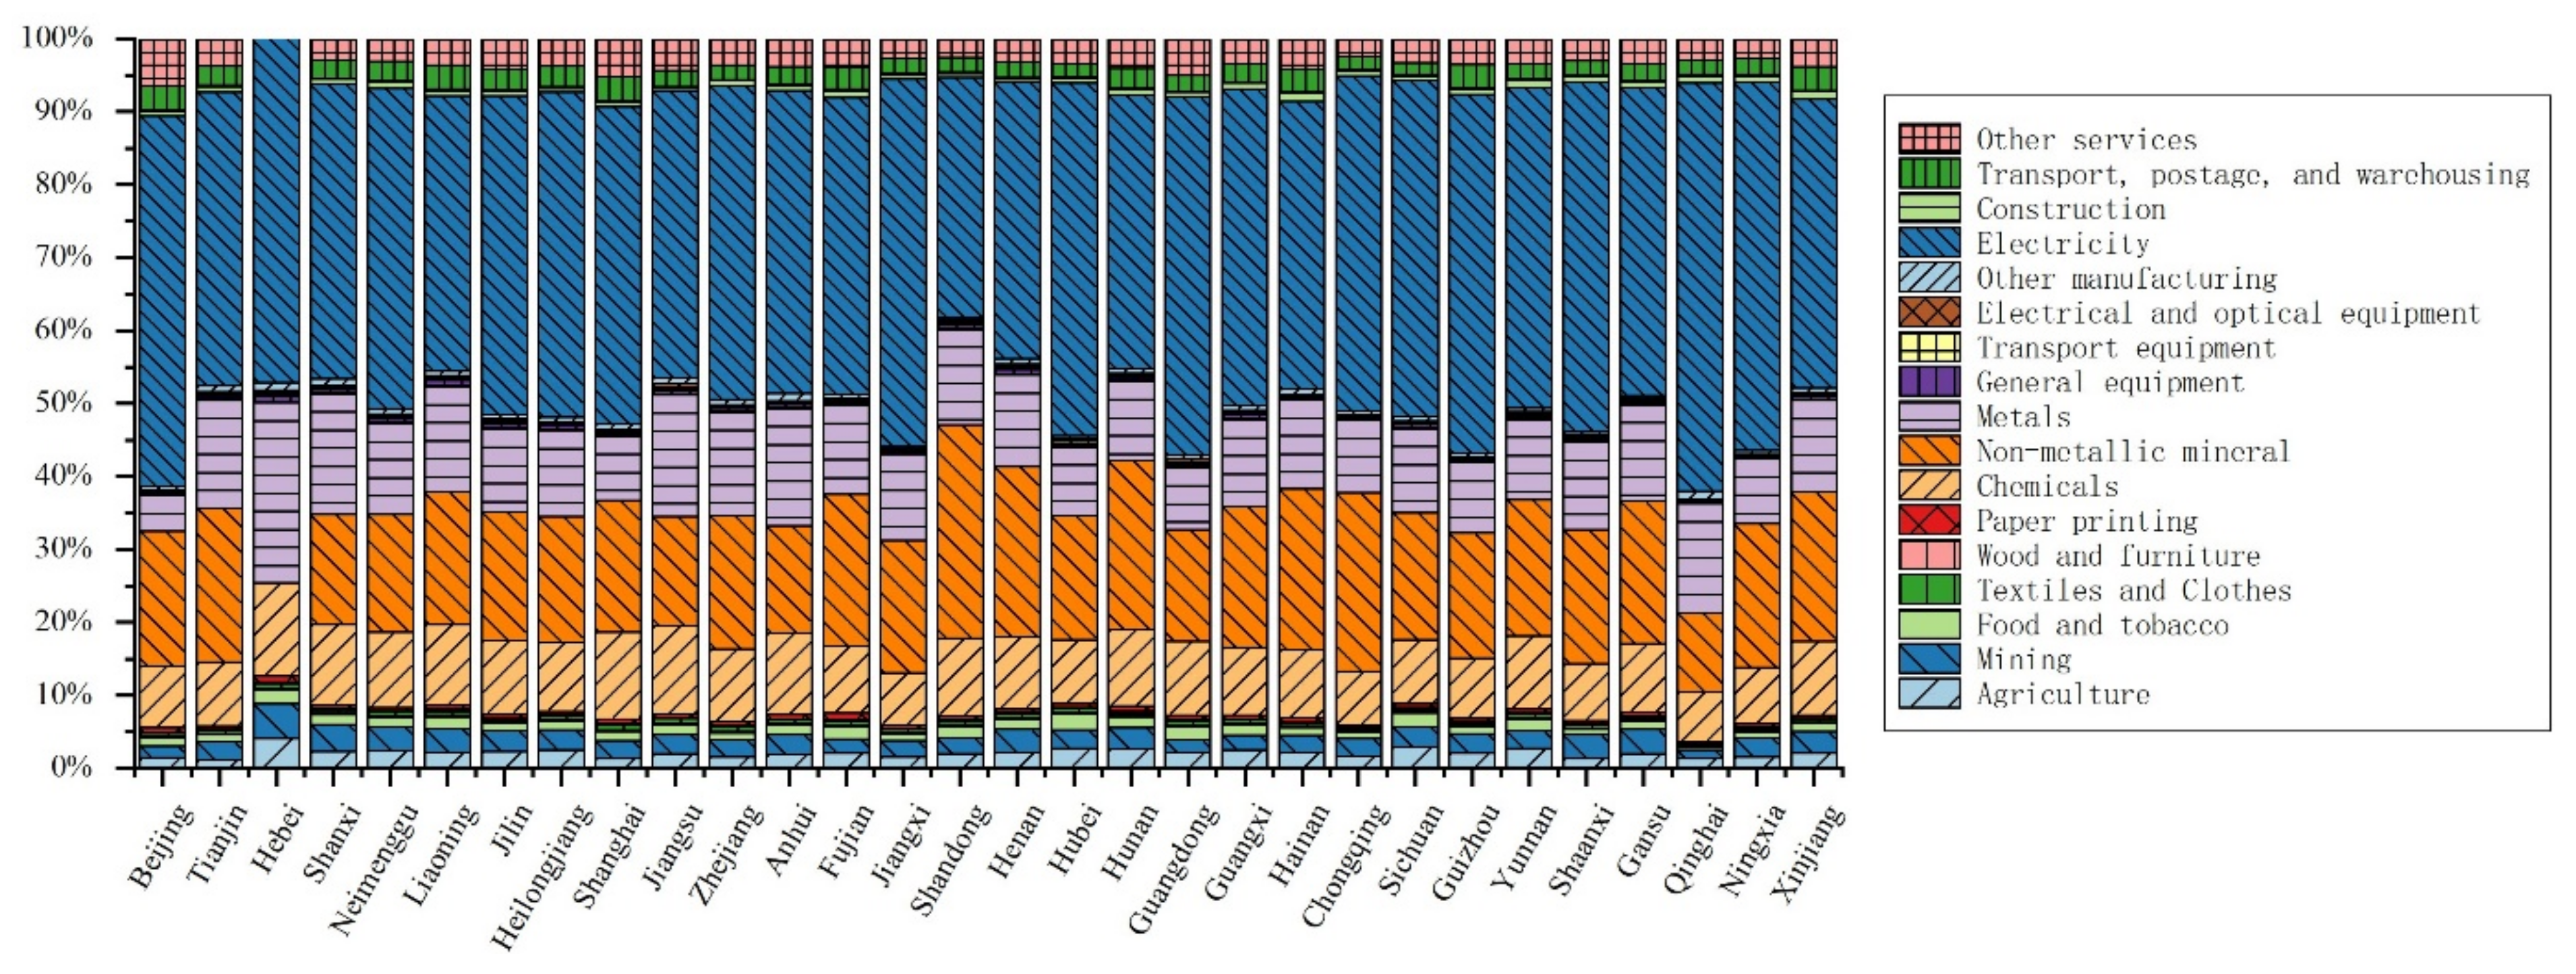
China’s provinces develop advantageous industries based on their natural resources and other factors. They also develop their economies according to their industrial structure, technology level, and other characteristics. In the following section, we analyze the percentage of emissions caused by domestic demand in each province of China in 2007 and 2012. The results are shown in Figure 3 and Figure 4. In general, electricity, non-metallic minerals, and metals are the industries with the highest emissions caused by domestic demand in each province of China, with a share of 56.34–82.01%. Accordingly, the centralized heating in the northern winter and the energy consumption of industrial production have a considerable impact on emissions [39]. The share of emissions caused by domestic demand in the above industries remained stable during the study period, with a slight decrease in some provinces, such as Fujian, Zhejiang, Shanxi, Inner Mongolia, and Liaoning. This observation indicates that these provinces might have had industrial transformation during the study period, and the high-speed development of some industries diluted the share of carbon emissions in electricity, non-metallic minerals, and metals. For example, the share of emissions emitted by Shanxi’s chemicals and mining industry has increased from 7.57% and 2.15% in 2007 to 11.03% and 3.74% in 2012. In addition, China’s carbon emissions differ considerably by industry. In particular, traditional energy industries, such as the mining industry, do not account for a high share of emissions at approximately 3%. Carbon emissions from general equipment, textiles and clothes, electrical and optical equipment, and other manufacturing industries are nearly negligible.
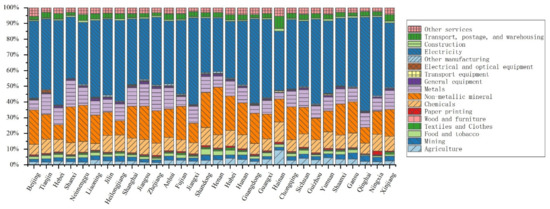
Figure 3.
Share of carbon emissions by sector in Chinese provinces due to domestic demand, 2007.
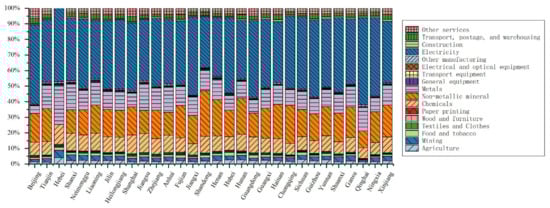
Figure 4.
Share of carbon emissions by sector in Chinese provinces due to domestic demand, 2012.
4.3. Analysis of Carbon Emissions to Distinguish between Intermediate and Final Products
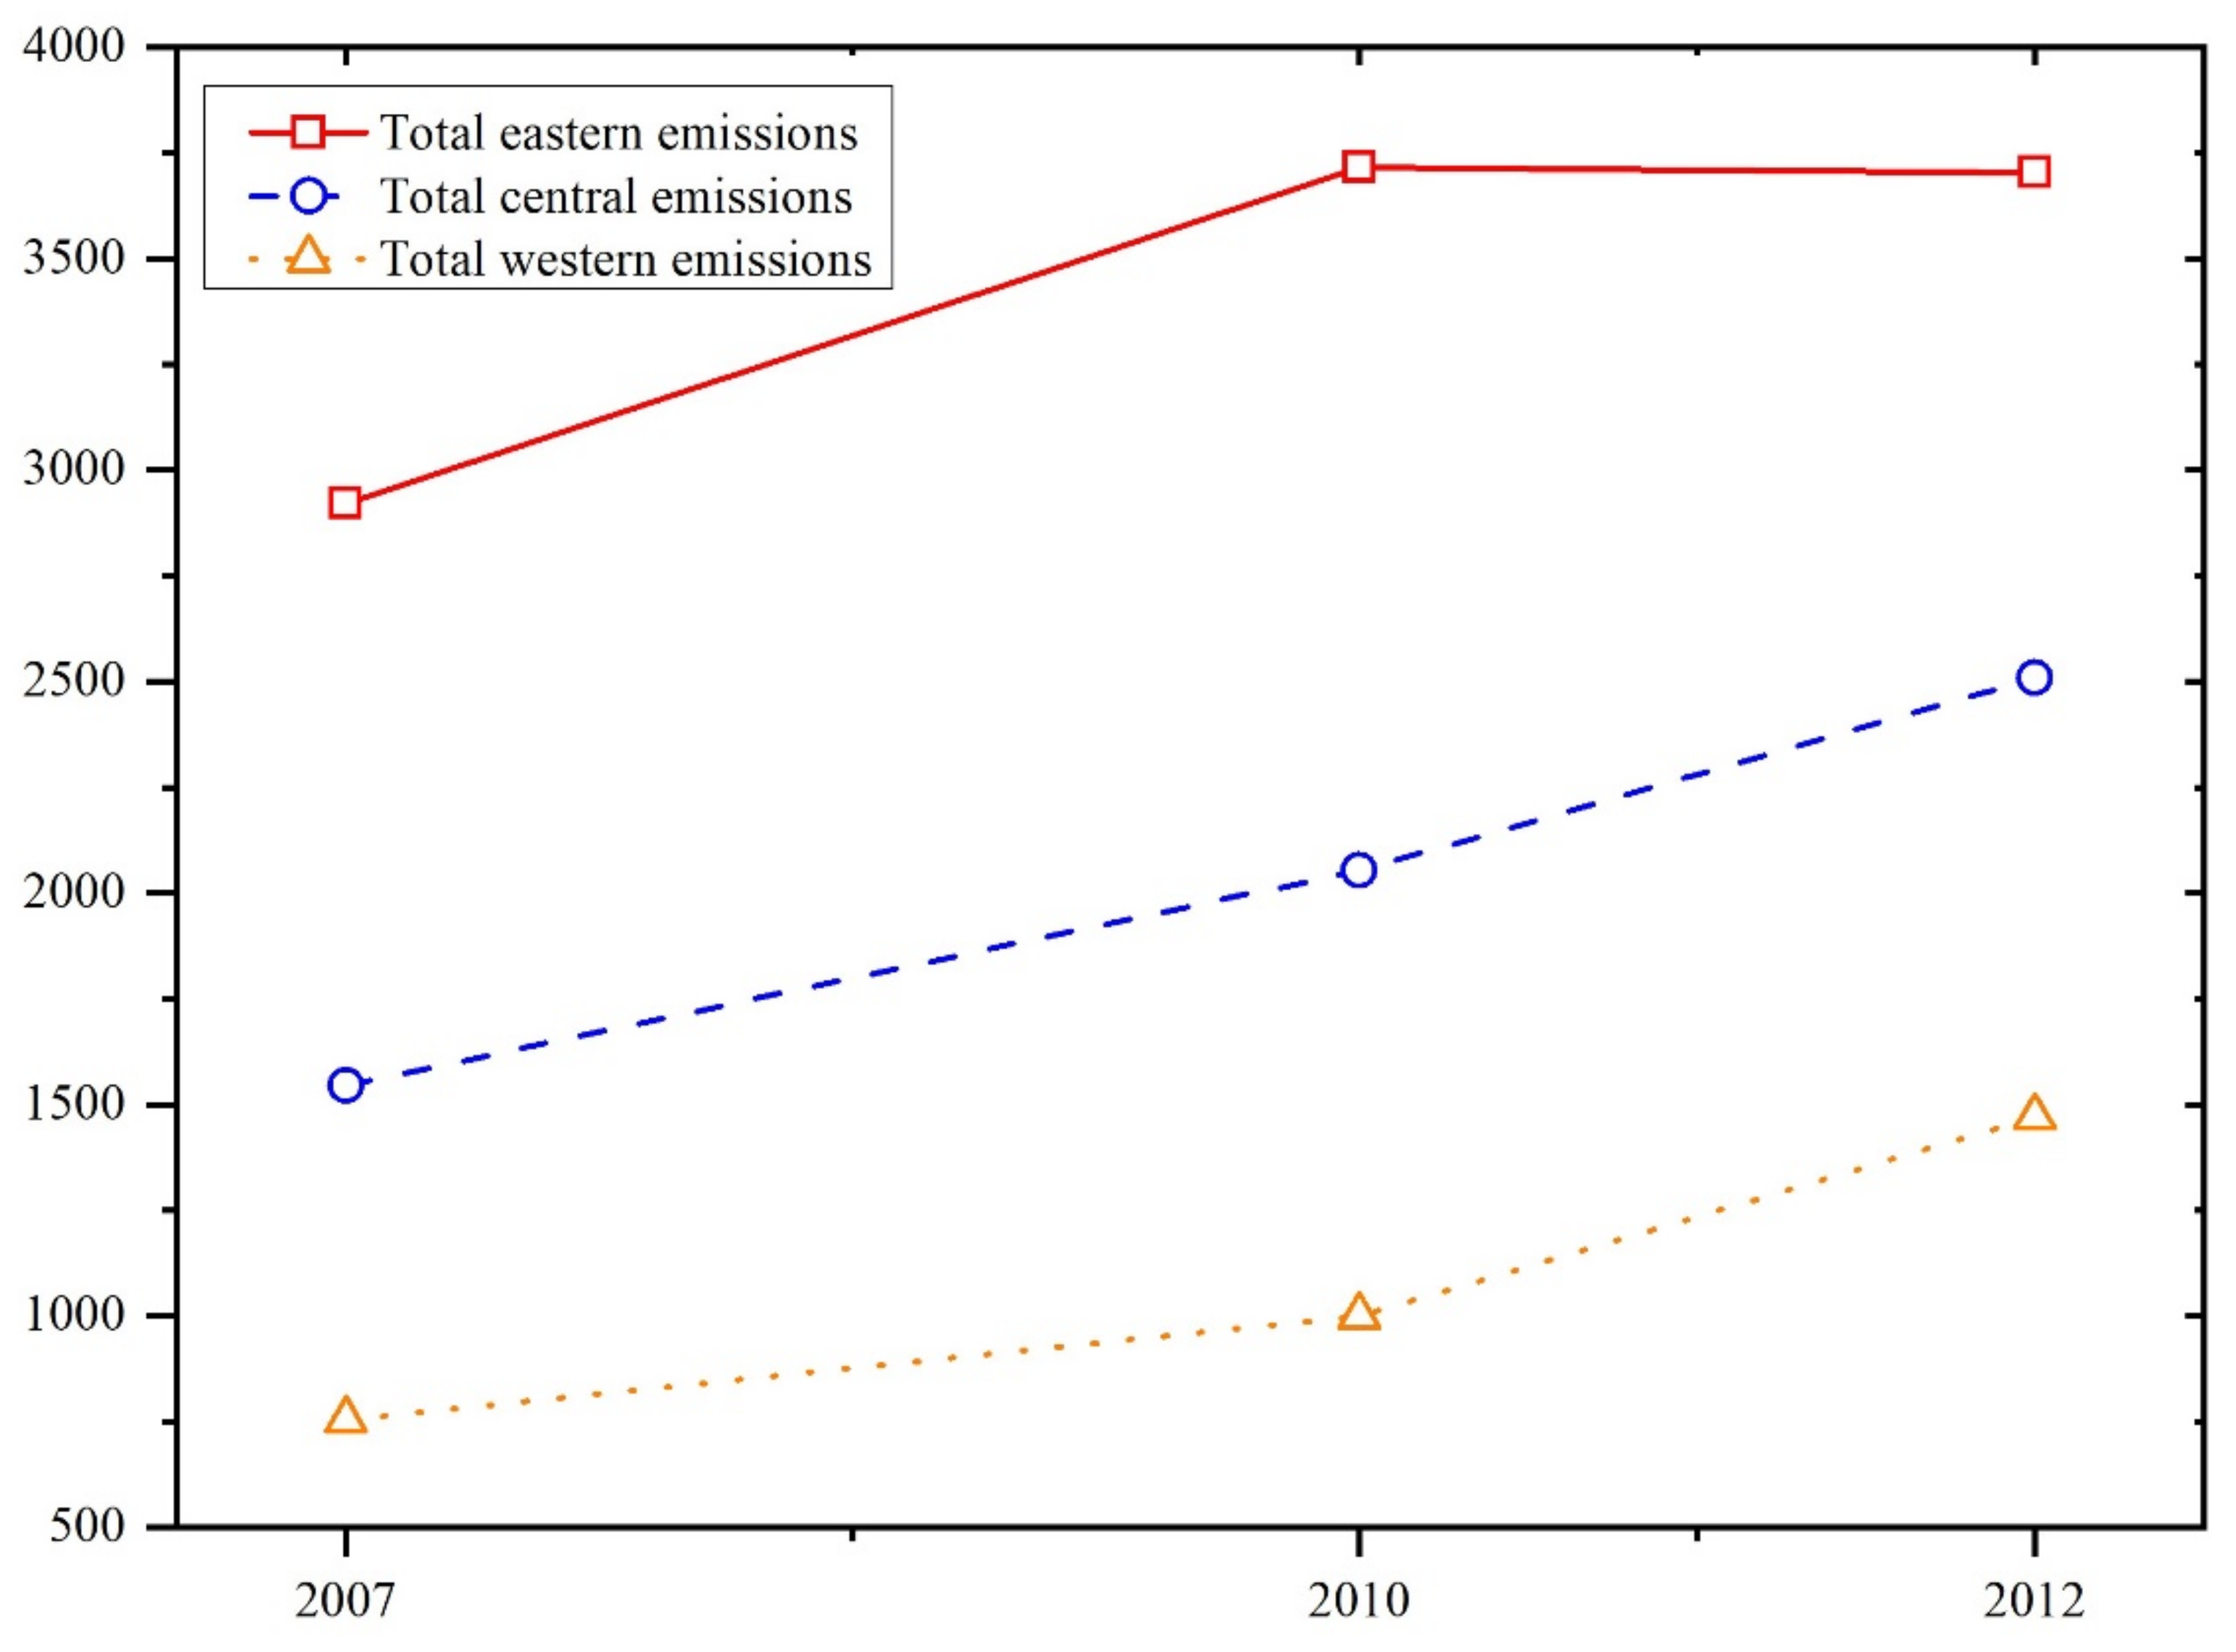
China’s economy has been developing rapidly since reform and opening-up. As the leader of reform and opening-up, the eastern region has made considerable progress in promoting China’s economic growth and internationalization. The eastern region cannot be separated from the support of the central and western regions, which provide a continuous supply of labor and raw materials for the development of the eastern region, thereby generating enormous environmental costs in the process [38]. The criteria for dividing the eastern, central, and western regions were derived from the “Seventh Five-Year Plan”, which was adopted by the Fourth Session of the Sixth National People’s Congress in 1986. The eastern region comprises 11 provinces, including Beijing, Tianjin, Hebei, Liaoning, Shanghai, Jiangsu, Zhejiang, Fujian, Shandong, Guangdong, and Hainan. The central region has 10 provinces, including Shanxi, Inner Mongolia, Jilin, Heilongjiang, Anhui, Jiangxi, Henan, Hubei, Hunan, and Guangxi. The western region comprises 10 provinces, including Sichuan, Guizhou, Yunnan, Tibet, Shaanxi, Gansu, Qinghai, Ningxia, Chongqing, and Xinjiang. The eastern region is dominated by capital-intensive and technology-intensive industries, whereas the central and western regions are dominated by labor-intensive and resource-intensive industries. In 2012, the GDP of eastern region, central region and western region accounted for 55.49%, 28.92%, and 15.59% respectively. As shown in Figure 5, the emissions of the eastern region increased and then decreased slightly, whereas the carbon emissions of the central and western regions considerably increased. However, the sum of emissions from the central and western regions in 2012 was equal to that of the eastern region. Despite the good performance of the central and western regions in recent years, they still have a considerable gap with the eastern regions. Such a situation arises because high carbon emissions, such as electricity, nonmetallic minerals, and metals, are required to pay a considerable amount in terms of environmental costs while yielding relatively small revenues. Regional inequality has further increased [40].
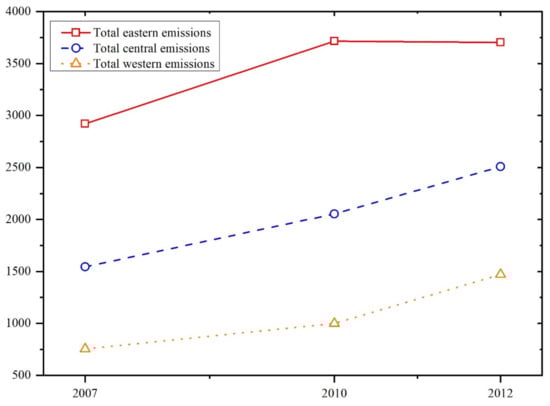
Figure 5.
Total emissions caused by domestic demand in eastern, central, and western regions; 2007, 2010, and 2012.
We also examined the characteristics of carbon transfer under different trade patterns. Table 3 shows that the emissions from the eastern, central, and western regions due to the demand for intermediate goods and final goods are described as the local emission effect and the regional spillover effect, respectively. In general, China’s domestic demand-induced emissions show a stepped pattern in the eastern, central, and western regions. In 2007, for example, the demand for final products (intermediate products) in the eastern region led to emissions of 1848.65 (518.31) Mt in the region; the demand for final products (intermediate products) in the eastern region led to carbon emissions of 92.76 (326.71) Mt and 35.08 (100.12) Mt in the central and western regions, respectively. Thus, the emissions generated by domestic demand primarily originate within the local area. The emissions of the eastern region are primarily from the production of final products, whereas those of the central and western regions are primarily from the production of intermediate products. The economic and trade relations between the central and eastern regions are close because of geographical distance and other factors. Moreover, many intermediate products and final products are purchased from the central region. Thus, the central region produces more emissions than the western region. In the central region, which is also dominated by the production of final products, the demand for final products (intermediate products) leads to carbon emissions of 932.72 (142.29) Mt. The production of intermediate products (final products) in the central region generates 116.76 (277.23) Mt and 24.68 (50.58) Mt of emissions in the eastern and western regions, respectively. From the perspective of regional emission transfers caused by the demand for final products, the emissions in the eastern region caused by the central region demand are higher than those in the central region caused by the eastern region demand. The western region has the lowest carbon dioxide emissions of 410.31 (43.72) Mt because of the demand for final products (intermediate products). In the central and eastern regions, the emissions, 53.83 (144.4) Mt and 27.01 (74.6) Mt, respectively, are due to the demand for western final products (intermediate products). Thus, the western region purchases various intermediate and final products from the eastern region, which results in considerable transfer emissions to the eastern region. Compared with the demand for intermediate products, the demand for final products in the eastern region caused considerable carbon emissions. This scenario showed that the emissions caused by the use of intermediate products in the eastern region decreased. The eastern region leads to increased carbon transfer emissions in the western and central regions under different patterns of trade. Moreover, the western and central regions increase not only the local emissions but also the regional spillover emissions. We find from the above analysis that the regional spillover effect is pronounced in the western and central regions. Exploring the characteristics of emissions under different trade patterns has practical importance in customizing carbon emission reduction policies for different regions.
Table 3.
Local emission effects and regional spillover effects of emissions in eastern, central, and western China, 2007, 2010, and 2012.
4.4. Structural Decomposition Analysis
4.4.1. Analysis of the Drivers of Emissions
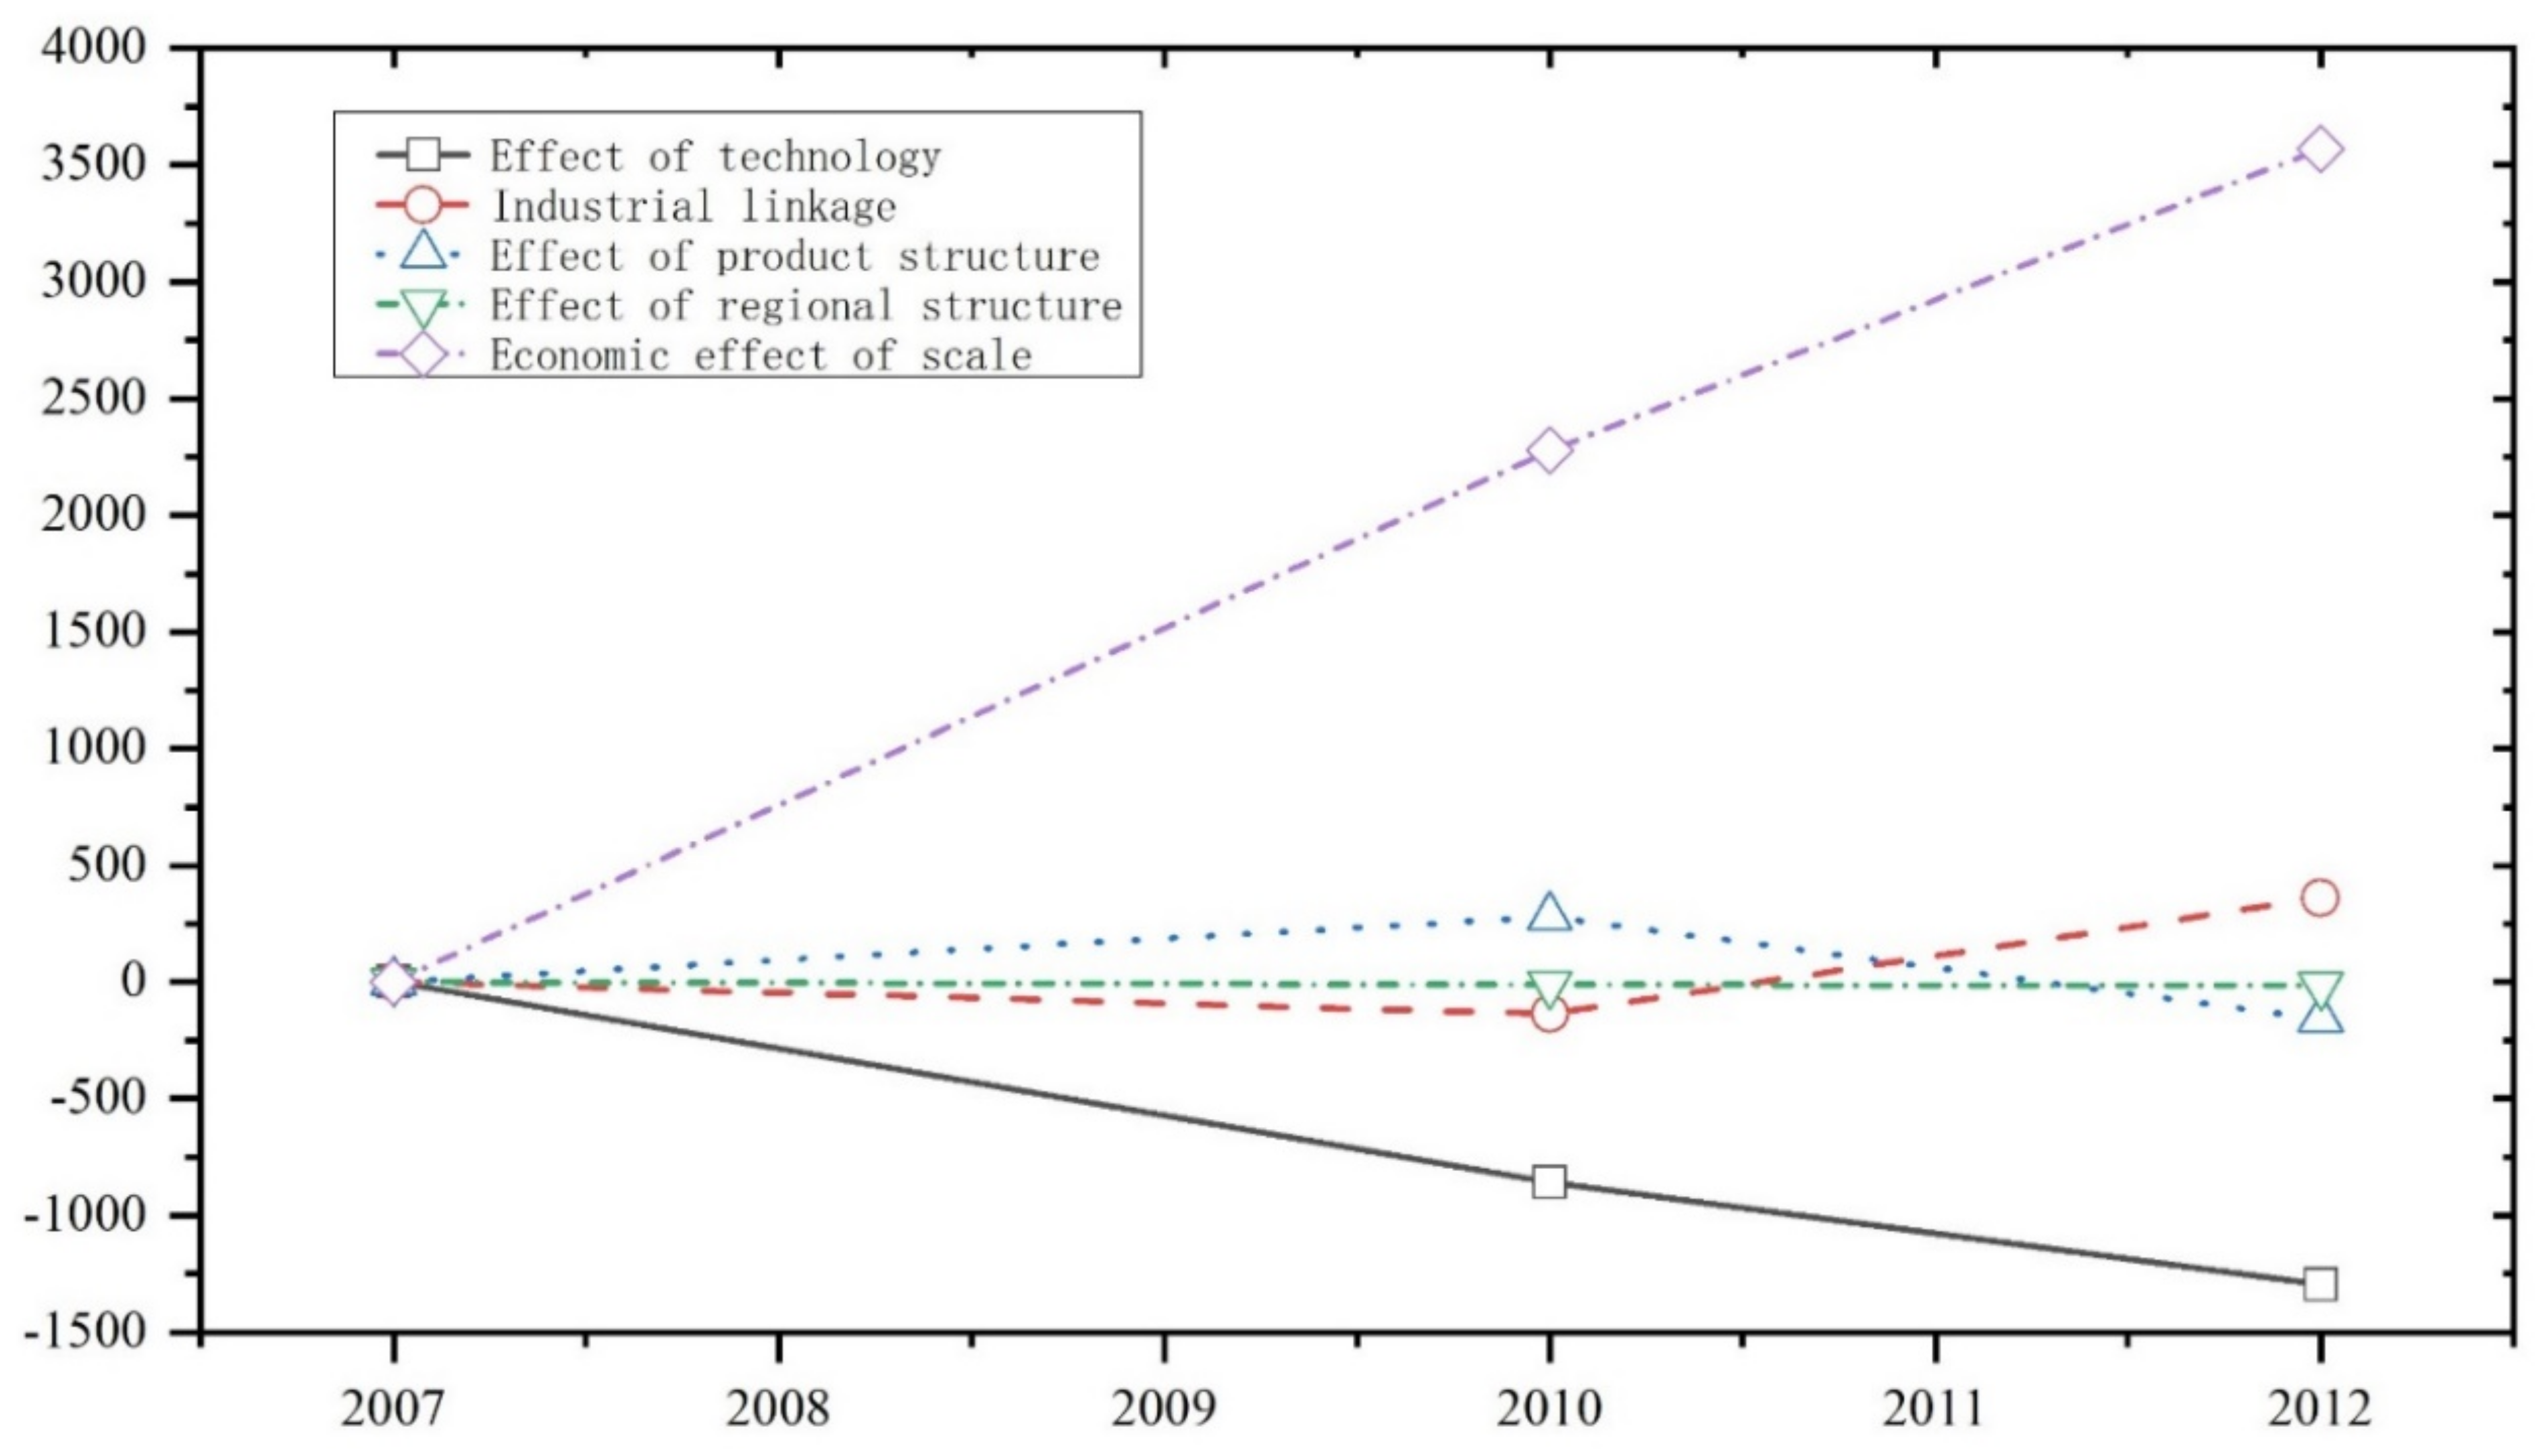
As a result of the SDA method (Equation (7)), Figure 6 illustrates the contributions of five different influencing factors to the change in emissions in a dynamic context. During the study period, China’s domestic demand-induced carbon emissions have considerably increased from 5219.75 Mt in 2007 to 7682.14 Mt in 2012, an increase of 47.17%. Based on the results of SDA, the scale effect is the most crucial factor driving emissions. Between 2007 and 2012, carbon emissions grew by 145.01% because of the scale effect. The main factor inhibiting the increase in domestic demand-induced carbon emissions is the technology effect, which is the decreasing intensity of carbon emissions [41]. Compared with the net increase in emissions, the decrease in carbon intensity leads to a 52.58% decrease in carbon emissions but does not offset the increase in emissions due to the scale effect (the difference is 2276 Mt). Industry linkage is the second leading contributor to the increase in domestic demand-induced emissions in China. It increases emissions by 14.7%, probably because of the increase in the percentage of highly polluting and high-emission intermediate inputs. Other than the factors listed above, the regional structure effect and product structure effect are two factors that do not considerably contribute to emissions. Following the global financial crisis in 2008, China adopted economic stimulus policies to increase domestic demand, such as the 4 trillion RMB stimulus program. Consequently, China’s domestic demand-driven carbon emissions were not affected by the global financial crisis during the study period.
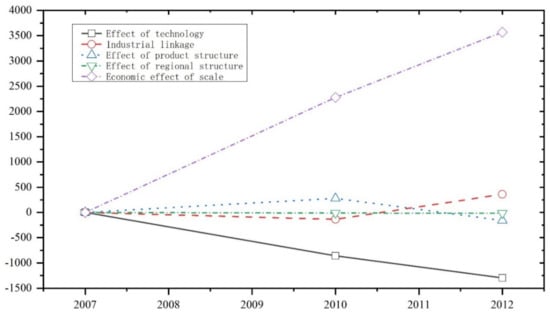
Figure 6.
Analysis of trends in the influencing factors for emissions in China from 2007 to 2012.
4.4.2. Impact of Final Demand Types on Changes in Emissions
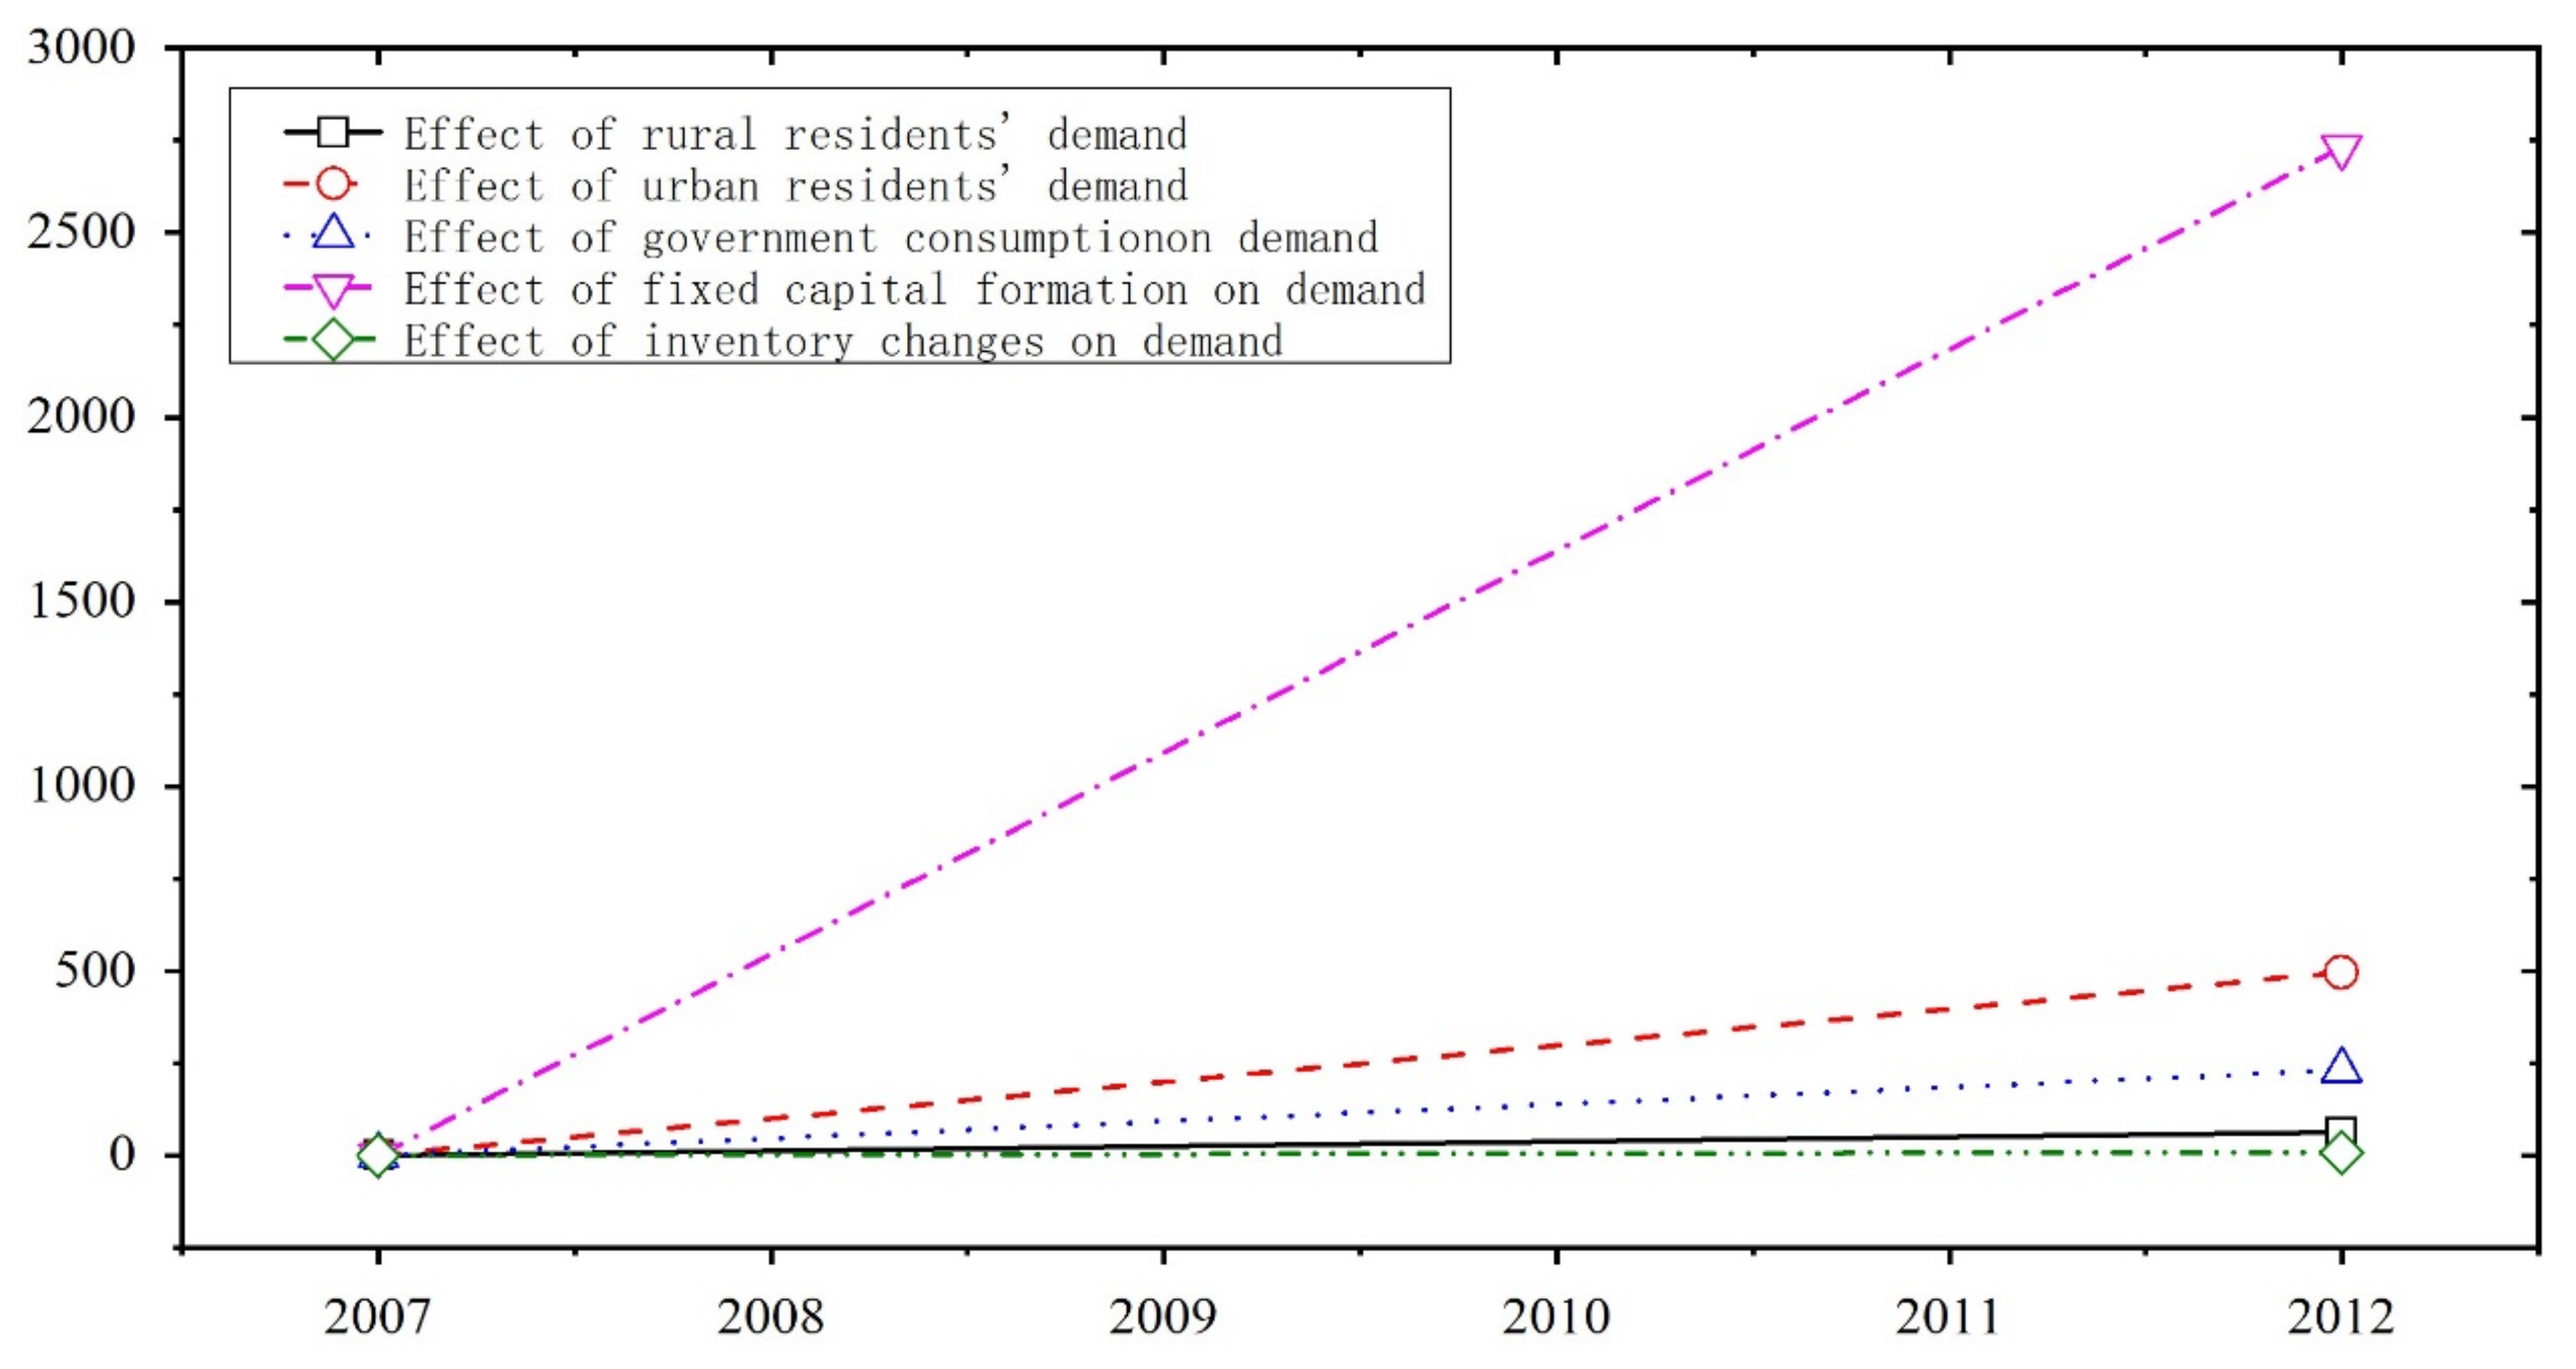
We also discuss the impact of demand types on emissions, such as fixed capital formation, government consumption, rural residential consumption, urban residential consumption, and inventory changes. Figure 7 shows the five types of demand that contributed to the increase in emissions in China by 3527.32 Mt during 2007–2012. Fixed capital formation, urban residents’ consumption, and government consumption are the top one, two, and three demand factors leading to increased emissions, respectively. The demand effect of fixed capital formation is the largest source of emissions in China. It led to an increase of 2731.05 Mt from 2007 to 2012, accounting for 77.43% of the net increase in emissions. The fixed capital of China increased from USD $1805.94 billion in 2007 to USD $5935.76 billion in 2012, an increase of 228,68%, which contributed to the expansion of the economy of China. The demand effect of urban residents’ consumption is the second-largest source of emissions, leading to an increase of 496.19 Mt from 2007 to 2012. However, this increase is much lower than the increase in emissions resulting from the fixed capital formation. In particular, the increase in the former is only 18.17% of the latter. Accordingly, the increase in emissions is primarily the result of the expansion of production rather than residential consumption. The increase in emissions caused by the demand of urban residents is approximately 7.99 times larger than the increase in emissions caused by the demand of rural residents. Thus, the disparity in energy consumption between rural and urban residents in China increased. The government consumption demand also caused a considerable increase in China’s emissions. The increase in carbon emissions caused by it is 230.47 Mt, accounting for 6.53% of the net growth emissions. This finding is consistent with the expectation that China’s government investment is the main way to drive economic growth, given that a “4 trillion RMB stimulus program” and other government investment actions were present during the study period. Furthermore, the impact of inventory change demand on the change of emissions is negligible, both in absolute and relative terms. It contributed only 7.54 Mt of net emissions and accounted for only 0.21% of the net growth in China.
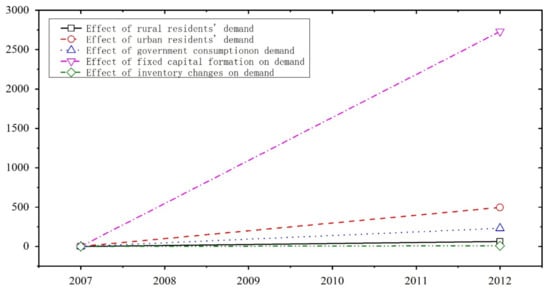
Figure 7.
Impact of five types of final demand on emissions, 2007–2012.
4.4.3. Identifying the Factors That Influence Emissions at the Industry Level
We investigated the industry level further to discover deep reasons for China’s increased carbon emissions. Table 4 presents the changes in emissions of three industries from 2007 to 2012. The vast majority of emissions in China due to domestic demand (2007–2010, 94.39%; 2010–2012, 92.24%) were caused by the secondary industry. This observation means that compared with primary industry (2007–2010, 0.95%; 2010–2012, 1.15%) and tertiary industry (2007–2010, 4.66%; 2010–2012, 6.11%), the rapid expansion of the secondary industry is the main contributor to the increase in emissions. From 2007 to 2010, the proportion of electricity, metals, and non-metallic minerals in the total emissions from the secondary industry was 40.38 %, 19.03%, and 17.08%, respectively. In 2010–2012, the subsectors driving the increase in emissions in the secondary industry, particularly electricity, metals, and non-metallic minerals, did not change. They accounted for 50.58%, 19.69%, and 15.41% of the increase in emissions from the secondary industry. Thus, we can conclude that in different development periods, the main industries of domestic demand-driven increase in emissions have not changed. However, the proportion of carbon emissions from electricity has increased. This scenario is in line with the energy structure and industrial structure in the process of economic development.
Table 4.
Structural decomposition of industry-level changes in emissions, 2007–2012.
Based on the identification of the key sectors associated with China’s domestic demand-induced carbon emission increases during different periods, this study conducts an SDA analysis on the key sectors, as shown in Table 5. As opposed to the analysis of aggregate SDA emissions, the technology effect, i.e., the decrease in carbon intensity, is not the most relevant factor impeding the increase in emissions. The continued expansion of the economy is the most relevant factor responsible for the growth in carbon emissions. This factor can completely offset the dampening effect caused by other factors. From 2007 to 2010, industrial linkage and technological effect were the main factors reducing carbon emissions for the electricity industry, reducing carbon emissions by 329.86 and 282.05 Mt, respectively. The increase in emissions driven by the scale effect is 1.62 times the increase suppressed by technological effect and industrial linkage. Additionally, the change in the product structure results in a large increase in emissions. Accordingly, the increase in emissions from the electricity sector is primarily due to the expansion of scale and the change in the product structure. The expansion of scale and changes in structure are the primary causes of increased emissions in the metals industry, similar to the scenario in the electricity industry. As for the non-metallic minerals industry, the technology effect prevented the increase in emissions caused by the scale effect. However, the structure of intermediate products contributed to the increase in emissions, i.e., the expansion of the industry’s scale was accompanied by “high emissions” for the intermediate input products. The major sectors of carbon emissions remained the same between 2010 and 2012. However, the factors inhibiting the increase in emissions in each sector changed, and the increase in emissions tended to slow down. The main factors inhibiting the increase in emissions in the electricity industry have changed from technological effects and industrial linkage to the restructure of products, and the carbon emissions caused by industrial linkage increased sharply in this period. This finding indicates that intermediate inputs tend to be “high emission”. The main factor inhibiting the increase in emissions in the metal industry has shifted from industry linkage to technological effect. In contrast to previous industries, the reduction in emissions from industry linkages in the non-metallic mineral industry can be explained by the cleanliness of the intermediate products used in the industry. Given the continued economic growth, technological advances and improvements in the structure of intermediate inputs are expected to lead to “low-emission” development in key industries. The major factors influencing emission reduction in key sectors in each period must be identified for precise emission reduction.
Table 5.
SDA results for carbon emissions in key sectors in China, 2007–2012.
5. Discussion
Global warming not only destroys the environment but also threatens the survival and development of humans. Scholars have been paying attention to the issue. This study is particularly relevant to the study by Zhou et al. (2018), which used MRIO and MRIO–SDA models to analyze carbon transfers in China’s major regions and key industries and identify the factors that determine regional embodied carbon emissions in China [18]. There are three aspects of our findings that differ from those of Zhou et al. (2018). First, we find that the regional spillover effect of carbon emissions from domestic demand is characterized by the demand of the inland provinces leading to emissions in the coastal provinces, while Zhou et al. (2018) show that carbon emissions are generally transferred from the developed regions to the less developed. Second, this study distinguishes different trade patterns in the analysis of carbon emission transfer. We find that the regional spillover effect is primarily caused by the demand for intermediate products. This effect is more prominent in the central and western regions than in the eastern regions. Third, our study shows that fixed capital formation is the most important demand factor driving increases in carbon emissions, whereas Zhou et al. (2018) did not discuss the impact of demand type on the change in carbon emissions.
Furthermore, we have different findings about the transfer of carbon emissions and the influencing factors compared with existing literature. Meng et al. (2013) examined the relationship between China’s interregional spillover of CO2 emissions and domestic supply chains using the interregional input–output tables in 2002 and 2007 [1]. The results indicate that the emissions of CO2 from a region are influenced by its production technology and energy efficiency, as well as the degree to which it participates in domestic and global supply chains. In this study, we investigated the impact of production technology, industrial linkage, product structure, regional structure, and scale effect on carbon emissions. Furthermore, different from this study, Meng et al. (2013) and Zhou et al. (2018) divided China into eight regions, which would cover up the characteristics of carbon emission transfer in some provinces [1,18]. Wang and Hu (2020) used the MRIO model to estimate bilateral carbon transfers between 30 Chinese provinces and the improved LMDI method to decompose the changes in net carbon transfers within the provinces. They examined the factors affecting interprovincial carbon transfers from three perspectives [17]. According to their findings, total carbon emissions in 30 provinces of China increased between 2007 and 2012, which is in agreement with the results of this study. The LMDI decomposition showed that the scale effect and the structural effect had a positive impact on net carbon transfer from 2007 to 2012, whereas the technological effect had a restricting effect. In our research, we found that the scale effect was the primary driver of the increase in emissions that resulted from domestic demand in China and that fixed capital formation was the most significant demand driver.
6. Conclusions and Policy Recommendations
In this study, we used the MRIO model to evaluate the local emission effect and regional spillover of carbon emissions generated by the demand for intermediate and final products in China, the transfer flow of regional emissions, and the characteristics of emissions at the industry level. We also used the SDA method to examine the impact of different factors and types of final demand on the change in emissions between 2007 and 2012 as part of this research. Our findings are as follows: (1) China’s total emissions increased steadily between 2007 and 2012 because of domestic demand, and the carbon emissions of provinces mainly came from the local emission effect. The regional spillover effect of carbon emissions resulting from domestic demand is relatively dispersed as opposed to the findings of previous studies, and the demand of inland provinces tends to lead to emissions from coastal provinces. Thus, the carbon emissions within a region are determined primarily by local production to meet local demand. Additionally, the responsibility for emissions caused by different economic activities must be considered when accounting for emissions in different regions. (2) Electricity, metals, and non-metallic minerals, accounting for as much as 58.07–62.4% of emissions, are the key industries for emissions in terms of the characteristics of industries with emissions caused by domestic demand. (3) The regional spillover effect is primarily caused by the demand for intermediate products. This effect is more obvious in the central and western regions than in the eastern regions. (4) The results of SDA show that the scale effect is the primary driver of the growth of emissions caused by domestic demand in China. By contrast, the technology effect is the main factor inhibiting the growth of emissions. Fixed capital formation is the most important demand factor responsible for the increase in emissions. The majority of the increase in emissions resulting from domestic demand came from the secondary industry (94.39% in 2007–2010 and 92.24% in 2010–2012), among which electricity, metals, and non-metallic minerals were the key industries that increased emissions.
The policy implications of our findings are relevant. China is the world’s largest developing country. Its success at reducing carbon emissions motivates other developing nations to reduce carbon emissions, thus contributing to the world’s early attainment of carbon peak and carbon neutrality [42,43]. The issue of reducing emissions in China is complex because of the heterogeneity of the nation’s regions. Given that China is a vast and diverse country with considerable variations in geography, technological levels, and demographic structure, this study addresses the issue of reducing emissions based on this heterogeneity. On the basis of the findings of this study, we propose the following policy recommendations.
First, regional cooperation must be strengthened, and collaborative governance mechanisms must be improved. In this study, we show that the regional transfer of emissions is a trend where the demand from inland provinces results in emissions from coastal provinces. However, the previous study found that the demand from coastal provinces increases carbon emissions from central and western provinces, probably because of the time of the study or its perspective. In general, these findings indicate that China is a heterogeneous nation and that a transfer of emissions occurs between regions. As required by the existing policy, the carbon intensity of the developed eastern coastal provinces was reduced by 19% in 2015 relative to the 2010 emission levels, whereas the carbon intensity of the slightly developed western provinces was reduced by 10% [44]. When policymakers cannot reasonably guide industrial shifts, problems emerge with the decrease in local carbon emissions and increase in national carbon emissions. This scenario is known as carbon leakage. Thus, policymakers should encourage cooperation between regions and create a synergistic governance mechanism to reduce emissions, allowing the realization of carbon peak and carbon neutrality as early as possible.
Second, the key sectors of carbon emissions are targeted for reductions in carbon emissions, thereby increasing the efficiency of low-carbon emission reductions. According to the present study, electricity, metals, and non-metallic minerals have the greatest impact on carbon emissions within each province. Furthermore, the aforementioned industries account for the majority of the increase in emissions. On the one hand, taking measures, such as clean energy utilization and low-carbon technology innovation, within these industries could promote the cleanliness of the economic system and improve the efficiency of emission reduction. On the other hand, these industries serve as the foundation for economic development by providing energy and raw materials for the development of other sectors. Given the relationship between carbon emissions among various industries, clarifying the responsibilities of each industry and adjusting the industrial structure according to the responsibility for emissions reflect the fairness of emission reduction initiatives. Furthermore, the use of renewable energy and environmentally friendly materials is an important way of reducing the pressure around emission reduction in highly polluting industries and achieving a low-carbon development from a sustainability perspective [45].
Third, improving production technology is an effective measure to attain low-carbon sustainable development. We determine that improvements in production technology are primarily responsible for curbing the growth of emissions as a result of MRIO–SDA. The decrease in emission intensity during the study period resulted in 52.58% of the net carbon emission decrease. Therefore, the carbon intensity of production must be reduced by stimulating innovation and improving production technologies to reduce carbon emissions at their source [46]. Policymakers will be able to establish special funds to support the research of new technologies, such as energy conservation, emission reduction, and clean production. The support system will be continuously improved to create a favorable market environment for low-carbon technology innovation. As subjects of market economy activities, enterprises are essential sources of carbon emissions and important subjects of technological innovation. Policies, such as taxation and subsidies, can be used as incentives for enterprise innovation, continuous update of green production techniques, and achievement of high enterprise green production efficiency.
This study has some limitations. First, the subject of this study is the world’s largest developing country, and the differences between various regions of China are quite pronounced. Thus, the conclusions of this study are mainly applicable to developing countries, and some of the conclusions relating to regional transfer emissions are specific to China. Second, we determined that the transfer emissions in China tend to shift from inland to coastal provinces, probably because of the period or perspective chosen for this study. Our conclusions may differ if we examine other periods or reevaluate the characteristics of China’s regional transfer emissions from the standpoint of external demand. Therefore, we will consider conducting other regional studies to formulate appropriate policy recommendations for policymakers in the future.
Author Contributions
Conceptualization, H.C. and H.Z.; methodology, H.C.; software, H.C.; formal analysis, H.C.; supervision, H.Z.; writing—original draft preparation, H.C.; writing—review and editing, H.C., L.H. and H.Z. All authors have read and agreed to the published version of the manuscript.
Funding
This research received no external funding.
Institutional Review Board Statement
Not applicable.
Informed Consent Statement
Not applicable.
Data Availability Statement
Data available on request, due to restrictions (e.g., privacy or ethical).
Conflicts of Interest
The authors declare no conflict of interest.
References
- Meng, B.; Xue, J.; Feng, K.; Guan, D.; Fu, X. China’s inter-regional spillover of carbon emissions and domestic supply chains. Energy Policy 2013, 61, 1305–1321. [Google Scholar] [CrossRef] [Green Version]
- Shui, B.; Harriss, R.C. The role of CO2 embodiment in US–China trade. Energy Policy 2006, 34, 4063–4068. [Google Scholar] [CrossRef]
- Lin, B.; Sun, C. Evaluating carbon dioxide emissions in international trade of China. Energy Policy 2010, 38, 613–621. [Google Scholar] [CrossRef]
- Liu, X.; Ishikawa, M.; Wang, C.; Dong, Y.; Liu, W. Analyses of CO2 emissions embodied in Japan–China trade. Energy Policy 2010, 38, 1510–1518. [Google Scholar] [CrossRef] [Green Version]
- Li, Y.; Hewitt, C. The effect of trade between China and the UK on national and global carbon dioxide emissions. Energy Policy 2008, 36, 1907–1914. [Google Scholar] [CrossRef]
- Weber, C.L.; Matthews, H.S. Embodied Environmental Emissions in U.S. International Trade, 1997−2004. Environ. Sci. Technol. 2007, 41, 4875–4881. [Google Scholar] [CrossRef] [Green Version]
- Guan, D.; Reiner, D.M. Emissions affected by trade among developing countries. Nature 2009, 462, 159. [Google Scholar] [CrossRef] [Green Version]
- Peters, G.P.; Hertwich, E. CO2 Embodied in International Trade with Implications for Global Climate Policy. Environ. Sci. Technol. 2008, 42, 1401–1407. [Google Scholar] [CrossRef] [Green Version]
- Steen-Olsen, K.; Weinzettel, J.; Cranston, G.; Ercin, A.E.; Hertwich, E.G. Carbon, Land, and Water Footprint Accounts for the European Union: Consumption, Production, and Displacements through International Trade. Environ. Sci. Technol. 2012, 46, 10883–10891. [Google Scholar] [CrossRef]
- Meng, J.; Liu, J.; Xu, Y.; Guan, D.; Liu, Z.; Huang, Y.; Tao, S. Globalization and pollution: Tele-connecting local primary PM 2.5 emissions to global consumption. Proc. R. Soc. A Math. Phys. Eng. Sci. 2016, 472, 20160380. [Google Scholar] [CrossRef] [Green Version]
- Wyckoff, A.W.; Roop, J.M. The embodiment of carbon in imports of manufactured products: Implications for international agreements on greenhouse gas emissions. Energy Policy 1994, 22, 187–194. [Google Scholar] [CrossRef]
- Koesler, S.; Swales, K.; Turner, K. International spillover and rebound effects from increased energy efficiency in Germany. Energy Econ. 2016, 54, 444–452. [Google Scholar] [CrossRef] [Green Version]
- Feng, K.; Davis, S.; Sun, L.; Li, X.; Guan, D.; Liu, W.; Liu, Z.; Hubacek, K. Outsourcing CO2 within China. Proc. Natl. Acad. Sci. USA 2013, 110, 11654–11659. [Google Scholar] [CrossRef] [PubMed] [Green Version]
- Su, B.; Ang, B. Input–output analysis of CO2 emissions embodied in trade: A multi-region model for China. Appl. Energy 2014, 114, 377–384. [Google Scholar] [CrossRef]
- Mi, Z.; Zhang, Y.; Guan, D.; Shan, Y.; Liu, Z.; Cong, R.-G.; Yuan, X.-C.; Wei, Y.-M. Consumption-based emission accounting for Chinese cities. Appl. Energy 2016, 184, 1073–1081. [Google Scholar] [CrossRef] [Green Version]
- Zhang, X.; Zhao, T.; Wang, J.; Wei, Y. The embodied CO2 transfer across sectors of cities in Jing-Jin-Ji region: Combining multi-regional input–output analysis with complex network analysis. Environ. Sci. Pollut. Res. 2021, 28, 44249–44263. [Google Scholar] [CrossRef]
- Wang, W.; Hu, Y. The measurement and influencing factors of carbon transfers embodied in inter-provincial trade in China. J. Clean. Prod. 2020, 270, 122460. [Google Scholar] [CrossRef]
- Zhou, D.; Zhou, X.; Xu, Q.; Wu, F.; Wang, Q.; Zha, D. Regional embodied carbon emissions and their transfer characteristics in China. Struct. Chang. Econ. Dyn. 2018, 46, 180–193. [Google Scholar] [CrossRef]
- Wiedmann, T.; Lenzen, M.; Turner, K.; Barrett, J. Examining the global environmental impact of regional consumption activities Part 2: Review of input–output models for the assessment of environmental impacts embodied in trade. Ecol. Econ. 2007, 61, 15–26. [Google Scholar] [CrossRef]
- Wiedmann, T. A review of recent multi-region input–output models used for consumption-based emission and resource accounting. Ecol. Econ. 2009, 69, 211–222. [Google Scholar] [CrossRef]
- Pan, J.; Phillips, J.D.; Chen, Y. China’s balance of emissions embodied in trade: Approaches to measurement and allocating international responsibility. Oxf. Rev. Econ. Policy 2008, 24, 354–376. [Google Scholar] [CrossRef] [Green Version]
- Weber, C.L.; Peters, G.; Guan, D.; Hubacek, K. The contribution of Chinese exports to climate change. Energy Policy 2008, 36, 3572–3577. [Google Scholar] [CrossRef] [Green Version]
- Guan, D.; Hubacek, K.; Weber, C.L.; Peters, G.P.; Reiner, D.M. The drivers of Chinese CO2 emissions from 1980 to 2030. Glob. Environ. Chang. 2008, 18, 626–634. [Google Scholar] [CrossRef] [Green Version]
- Guan, D.; Peters, G.P.; Weber, C.L.; Hubacek, K. Journey to world top emitter: An analysis of the driving forces of China’s recent CO2emissions surge. Geophys. Res. Lett. 2009, 36. [Google Scholar] [CrossRef] [Green Version]
- Guo, J.; Zhang, Z.; Meng, L. China’s provincial CO2 emissions embodied in international and interprovincial trade. Energy Policy 2012, 42, 486–497. [Google Scholar] [CrossRef]
- Steenhof, P.A.; Weber, C.J. An assessment of factors impacting Canada’s electricity sector’s GHG emissions. Energy Policy 2011, 39, 4089–4096. [Google Scholar] [CrossRef]
- Wu, L.; Kaneko, S.; Matsuoka, S. Driving forces behind the stagnancy of China’s energy-related CO2 emissions from 1996 to 1999: The relative importance of structural change, intensity change and scale change. Energy Policy 2005, 33, 319–335. [Google Scholar] [CrossRef]
- Shao, C.; Guan, Y.; Wan, Z.; Guo, C.; Chu, C.; Ju, M. Performance and decomposition analyses of carbon emissions from industrial energy consumption in Tianjin, China. J. Clean. Prod. 2013, 64, 590–601. [Google Scholar] [CrossRef]
- Ang, B.W. Decomposition analysis for policymaking in energy: Which is the preferred method? Energy Policy 2004, 32, 1131–1139. [Google Scholar] [CrossRef]
- Fan, Y.; Liu, L.-C.; Wu, G.; Tsai, H.-T.; Wei, Y.-M. Changes in carbon intensity in China: Empirical findings from 1980–2003. Ecol. Econ. 2007, 62, 683–691. [Google Scholar] [CrossRef]
- Su, B.; Ang, B. Multiplicative decomposition of aggregate carbon intensity change using input–output analysis. Appl. Energy 2015, 154, 13–20. [Google Scholar] [CrossRef]
- Su, B.; Ang, B. Multiplicative structural decomposition analysis of aggregate embodied energy and emission intensities. Energy Econ. 2017, 65, 137–147. [Google Scholar] [CrossRef]
- Yan, J.; Su, B.; Liu, Y. Multiplicative structural decomposition and attribution analysis of carbon emission intensity in China, 2002–2012. J. Clean. Prod. 2018, 198, 195–207. [Google Scholar] [CrossRef]
- Su, B.; Ang, B.; Li, Y. Structural path and decomposition analysis of aggregate embodied energy and emission intensities. Energy Econ. 2019, 83, 345–360. [Google Scholar] [CrossRef]
- Tian, K.; Dietzenbacher, E.; Yan, B.; Duan, Y. Upgrading or downgrading: China’s regional carbon emission intensity evolution and its determinants. Energy Econ. 2020, 91, 104891. [Google Scholar] [CrossRef]
- Dietzenbacher, E.; Los, B. Structural Decomposition Techniques: Sense and Sensitivity. Econ. Syst. Res. 1998, 10, 307–324. [Google Scholar] [CrossRef]
- Wang, H.; Zhang, Y.; Zhao, H.; Lu, X.; Zhang, Y.; Zhu, W.; Nielsen, C.P.; Li, X.; Zhang, Q.; Bi, J.; et al. Trade-driven relocation of air pollution and health impacts in China. Nat. Commun. 2017, 8, 1–7. [Google Scholar] [CrossRef]
- Feng, K.; Siu, Y.L.; Guan, D.; Hubacek, K. Analyzing Drivers of Regional Carbon Dioxide Emissions for China. J. Ind. Ecol. 2012, 16, 600–611. [Google Scholar] [CrossRef]
- Fan, M.; He, G.; Zhou, M. The winter choke: Coal-Fired heating, air pollution, and mortality in China. J. Heal. Econ. 2020, 71, 102316. [Google Scholar] [CrossRef] [Green Version]
- Sun, L.; Wang, Q.; Zhou, P.; Cheng, F. Effects of carbon emission transfer on economic spillover and carbon emission reduction in China. J. Clean. Prod. 2016, 112, 1432–1442. [Google Scholar] [CrossRef]
- Gui, S.; Mu, H.; Li, N. Analysis of impact factors on China’s CO 2 emissions from the view of supply chain paths. Energy 2014, 74, 405–416. [Google Scholar] [CrossRef]
- Liu, H.; Fan, X. Value-Added-Based Accounting of CO2 Emissions: A Multi-Regional Input-Output Approach. Sustainability 2017, 9, 2220. [Google Scholar] [CrossRef] [Green Version]
- Moon, J.; Yun, E.; Lee, J. Identifying the Sustainable Industry by Input–Output Analysis Combined with CO2 Emissions: A Time Series Study from 2005 to 2015 in South Korea. Sustainability 2020, 12, 6043. [Google Scholar] [CrossRef]
- Jiang, Y.; Cai, W.; Wan, L.; Wang, C. An index decomposition analysis of China’s interregional embodied carbon flows. J. Clean. Prod. 2015, 88, 289–296. [Google Scholar] [CrossRef]
- Yang, L.; Lahr, M.L. The Drivers of China’s Regional Carbon Emission Change—A Structural Decomposition Analysis from 1997 to 2007. Sustainability 2019, 11, 3254. [Google Scholar] [CrossRef] [Green Version]
- Zang, Z.; Zhang, H.; Liu, H.; Wang, J.; Goetswang, K.F. Study on the Impact of the Export of China’s Final Use Products on Domestic SO2 Emissions. Sustainability 2019, 11, 5809. [Google Scholar] [CrossRef] [Green Version]

Publisher’s Note: MDPI stays neutral with regard to jurisdictional claims in published maps and institutional affiliations. |
© 2022 by the authors. Licensee MDPI, Basel, Switzerland. This article is an open access article distributed under the terms and conditions of the Creative Commons Attribution (CC BY) license (https://creativecommons.org/licenses/by/4.0/).