2. Literature Reviews
According to a survey about the impacts of the COVID-19 on Chinese consumer behaviors, this pandemic resulted in decreased industries’ capacity. In contrast, consumer spending increased; especially, the food and beverage industries experienced an increase of 40% after COVID-19 [
1,
8].
Remaining at home under the quarantine period also reduced physical activity, thus causes energy holding, while frequent consumption of snacks leads to excess calorie intake, and thus weight gain [
9]. According to pathological and psychological studies, fear, and anxious mood; stress; and saturnine, unbalanced emotional disturbances cause individuals not to make the right food choices and have an unbalanced diet during the COVID-19 pandemic. According to the China Consumer Survey of COVID-19, some purchase categories display changes: medical (health assistance) was at the top of the list with an increase of 38%; second was food with an increase of 36%; and then products such as rice, flour, grain, fresh foods, and convenience foods, among others. Besides, buying of dairy products, packaged drinks, wine, and such-like beverages increased by 13% [
10]. Considering that each country’s consumption pattern has its own characteristics, it is expected that there will be a difference in the types of foods that have increased or decreased in the pandemic period. Comprehensive studies have shown the changes within the countries at the same time based on food, for instance, while sales of staple foods such as soy-based products, chickpeas, rice, milk powder, canned meats, and water increased in Western countries, frozen foods and functional foods that are beneficial for the immune system increased in Japan [
11]. On the other hand, including in the United States, market clients generally give priority to raw elements such as meat, beans, and cereal compared with ready foods and snacks and alternative protein products [
12,
13]. In many freezer aisles, the vegetables are entirely gone, but the microwaveable dinners remain, even the pizzas [
12]. The Nielsen Company [
14] conducted a study that examined consumers’ purchasing behavior for sales of fast-moving consumer goods (FMCG) in the United Kingdom for four weeks until the week ending on 29 February to the week ending on 21 March 2020. In this process, the gradually increasing shopping rate every week reveals the effect of the stockpiling when looking at the fourth weekend, with a sales increase of 43%. Ambient grocery such as canned pasta and canned meat, which are suitable for storing at room temperature and can be consumed without processing, achieved the greatest increase of 104%, and frozen products that can be stored for a long time to last the lockdown period ranked second, with an increase of 84% [
15,
16,
17]. Many consumer groups during the pandemic in Europe turned to online shopping and went to fewer supermarkets to not risk their health; for instance, in Italy, France, and Ireland [
15]. On the other hand, according to the same source, German, Dutch, and Greek consumers continued to go to supermarkets as they did before. Arora et al. [
18] who examined the change in consumer behavior worldwide during the COVID-19 crisis, found that consumers spent more on online services and purchasing products during the pandemic. During the first lockdown, up to a 14% increase was observed in online shopping among U.K. [
15].
During the first week of quarantine in Turkey, consumers preferred staple foods such as pasta, flour, sugar and salt, and bread, as well as breakfast products as olives, cheese, milk, and water [
19,
20]. Yeast became one of Turkey’s most significant growth categories as people started making their bread at home [
21,
22]. More than half of people purchased kidney beans, soft soap, and cologne for the first time in the last year [
23].
3. Materials and Methods
An online survey was conducted in the spring of 2020, from 16 April 2020 to 4 May, during the pandemic peak days in Turkey, to understand consumers’ changing behavior about their food choices and preferences during the COVID-19 period. The survey was carried out among 900 individuals from 54 different cities in Turkey, with 58% of them being from Istanbul city. The questionnaire was administered online using Google Forms. Data gathered from the survey were analyzed first using descriptive statistics.
To test our hypotheses, the Wilcoxon–Mann–Whitney test was applied to compare food categories’ preferences during quarantine and other variables such as demographic variables, education level, body mass index (BMI), age, income, and so on. The Wilcoxon rank-sum test (or the Mann–Whitney U test) was applied to compare two independent data sets whose measurements are ordinal. The null hypothesis is that two sets of scores are samples from the same population; therefore, they do not differ systematically. The frequencies of categorical variables were tabulated, and they were analyzed using the chi-square tests for contingency tables. More specifically, this statistical analysis was used to determine whether there was any difference between the study groups in the proportions of the risk factor of interest [
24]. This analysis tests the following four null hypotheses:
H1 = During the quarantine period, consumption of food groups has not changed.
H2 = During the quarantine period, food purchasing criteria have not changed.
H3 = Food consumption preferences are the same before and during the quarantine period.
H4 = Frequency of eating during the day did not depend on emotions during the quarantine period.
Finally, for the modeling of consumer behavior during the quarantine period, we used ordered probit models. The ordered probit model is estimated using the maximum likelihood method. The model tests the null hypothesis H
1: β
k = 0 for every explanatory variable [
25]. The dependent variables were expressed as the frequency of consumption in the six alternatives food group during the quarantine period: snack, vegetable dishes, meat, dessert, bakery, and olive oil dishes categories.
The questions concerned demographic characteristics, food consumption and stocking habits, kitchen habits and preferences, shopping habits and preferences, storage, and disinfection preferences. They were surveyed both before and during the quarantine period to compare behavior and habit differences. BMI of the respondents was calculated using weight and height information given by them and was grouped into four categories: “underweight”, “normal weight”, “overweight”, and “obese” [
26]. BMI is an anthropometric index of weight and height defined as body weight in kilograms divided by height in meters squared [
27]. All statistical tests were performed with IBM SPSS Statistics 20.
4. Results and Discussion
A previous study showed a difference in consumers’ behavior according to sex and age [
28]. Because of the high risk of being infected regardless of their demographic characteristics and social position, irregular behaviors among people, a prevailing circumstance, can emerge from the spread of fear during situations as the COVID-19 pandemic [
14].
A total of 900 subjects participated in our surveys and completed a comprehensive questionnaire, but the survey yielded 893 usable responses. About the demographic status of interviewees, most of the survey participants were women (79%). This is in line with other findings demonstrating that females engage more in online surveys [
29].
Online surveys seem to be more attractive for younger respondents. People in the youngest age groups are more likely to respond to online interviews; on the contrary, elderly respondents were more likely to participate in in-person surveys [
30,
31]. In the current survey, 36% of the consumers were recruited were between 18 and 25 years old. In total, 58% of the people surveyed were from Istanbul, which is the biggest city in Turkey. Nearly 60% of the consumers were single, and 64% had a university degree. The monthly income question was almost equally distributed between the “1500–4999 TL” and “10K TL and above” interval by 29% (
Table 1).
As described above, this study was planned to reflect the change in household behavior towards food consumption during Turkey’s COVID-19 quarantine period. The survey questionnaire included the household size, the number of people in quarantine, and the number of kids. Besides, the definitions of risky categories for COVID-19, including people who have a chronic disease and people above 65, were registered. Thirty-two percent of consumers who participated in the current survey had four people at home, whereas the household size reduced during the quarantine. Further, 54% of households had no kid at home, and 25% had one kid at home.
According to the Ministry of Health of Turkey [
32] the risk group was determined as people with chronic diseases and those 65 years and older. The analysis of the findings shows that 84% of households do not include members who are 65 years and older. Further, 37% of households have people with chronic diseases.
In the last part concerning demographic variables, we asked for BMI indirectly. From consumers’ height and weight, we calculated their BMI and considered it as a variable in their consumption process. Between 25 and 29.9 was labeled as overweight, and above 30 was called obese in our study. As per their height and weight, 26% of consumers were overweight, while most interviewees (57%) were in a normal weight range.
Daily eating frequency and food variety are also essential criteria for food choice, especially under stress [
33,
34,
35]. Eating frequency answers were dominated by two times a day, with 52% during the quarantine period. Besides eating patterns, types of foods and cooking habits were also changed during the COVID-19 period. People tried different recipes during this period; 80% of our participants agreed to try different quarantine recipes.
Food choice in quarantine also changed. Respondents were asked to rank their food group preferences during the quarantine period by seven-scale Likert answer choices. The fruit and vegetable groups were in the first line, and frozen food was last.
During the purchasing process, price, shelf life, taste, nutritional value, and hygiene are essential criteria that play an essential role in food shopping [
36,
37]. In our study, the highest score was hygienic concerns, and the least concern was the price. This also correlated with the fact that the biggest fear during the COVID-19 pandemic was being contaminated through the environment, especially food and food packaging.
Hygiene was the biggest concern during purchasing and after purchasing when storing the foods in the kitchen. In our study, we asked people how they disinfect their food or food packaging after shopping with the following alternative answers: just water, water with detergent, disinfectant, leaving outside, water with vinegar, and finally “do not disinfect”. Bulk purchasing during quarantine makes disinfection concerns and storing problems as a critical issue to keep food products until the end of their shelf life. When we asked consumers whether they know how to store their food products, 96% of them declared that they were aware.
To understand how long they needed to store enough food to handle the pandemic, we asked about their stock duration before and during the quarantine period and summarized in
Table 2. There is a share of participants whose food storage increased from 70% to 89%. However, the most popular duration of stocking preference, namely 3–7 days, did not change during the quarantine. In the other choices, 1–3 days decreased from 29% to 13%, ten days stocking behavior increased from 15% to 22%, and finally 15 days of stocking increased from 9% to 20%.
One of the most significant changes in shopping behavior during the COVID-19 quarantine period related to the method that individuals selected for shopping. Preferences for online shopping increased by 42%. The frequency of an increase in online shopping from zero times in the week to once a week increased by 17%.
The WHO [
26,
38] recommends that, if possible, payments should be conducted through contactless technology. From this point, we asked consumers participated in the survey about the methods they use for payment. The results showed us that people listen to this advice. While 43% of the respondents chose contactless payments, 42% chose credit cards, and 15% chose cash as the least preferred method of payment. With or without cash, quarantine is an unexpected period for people and their budget [
39]. A total of 56% of consumers said that they exceeded their food expenditure budget during the COVID-19 quarantine period.
In quarantine, the subjects of how to buy, disinfect, or store, as well as what to eat, became popular among consumers. To understand the consumers’ preference of food groups, we asked them to rank six different food groups to compare before and during the quarantine and summarized the answers in
Table 3.
The most significant increase in food type was pastry products, with an increase of 11%, followed by snacks and vegetable dishes. When we compare foods with demographic variables for married couples in the cross tables, meat dishes were the most common ones before the quarantine. However, the most common ones became pastry products during the quarantine.
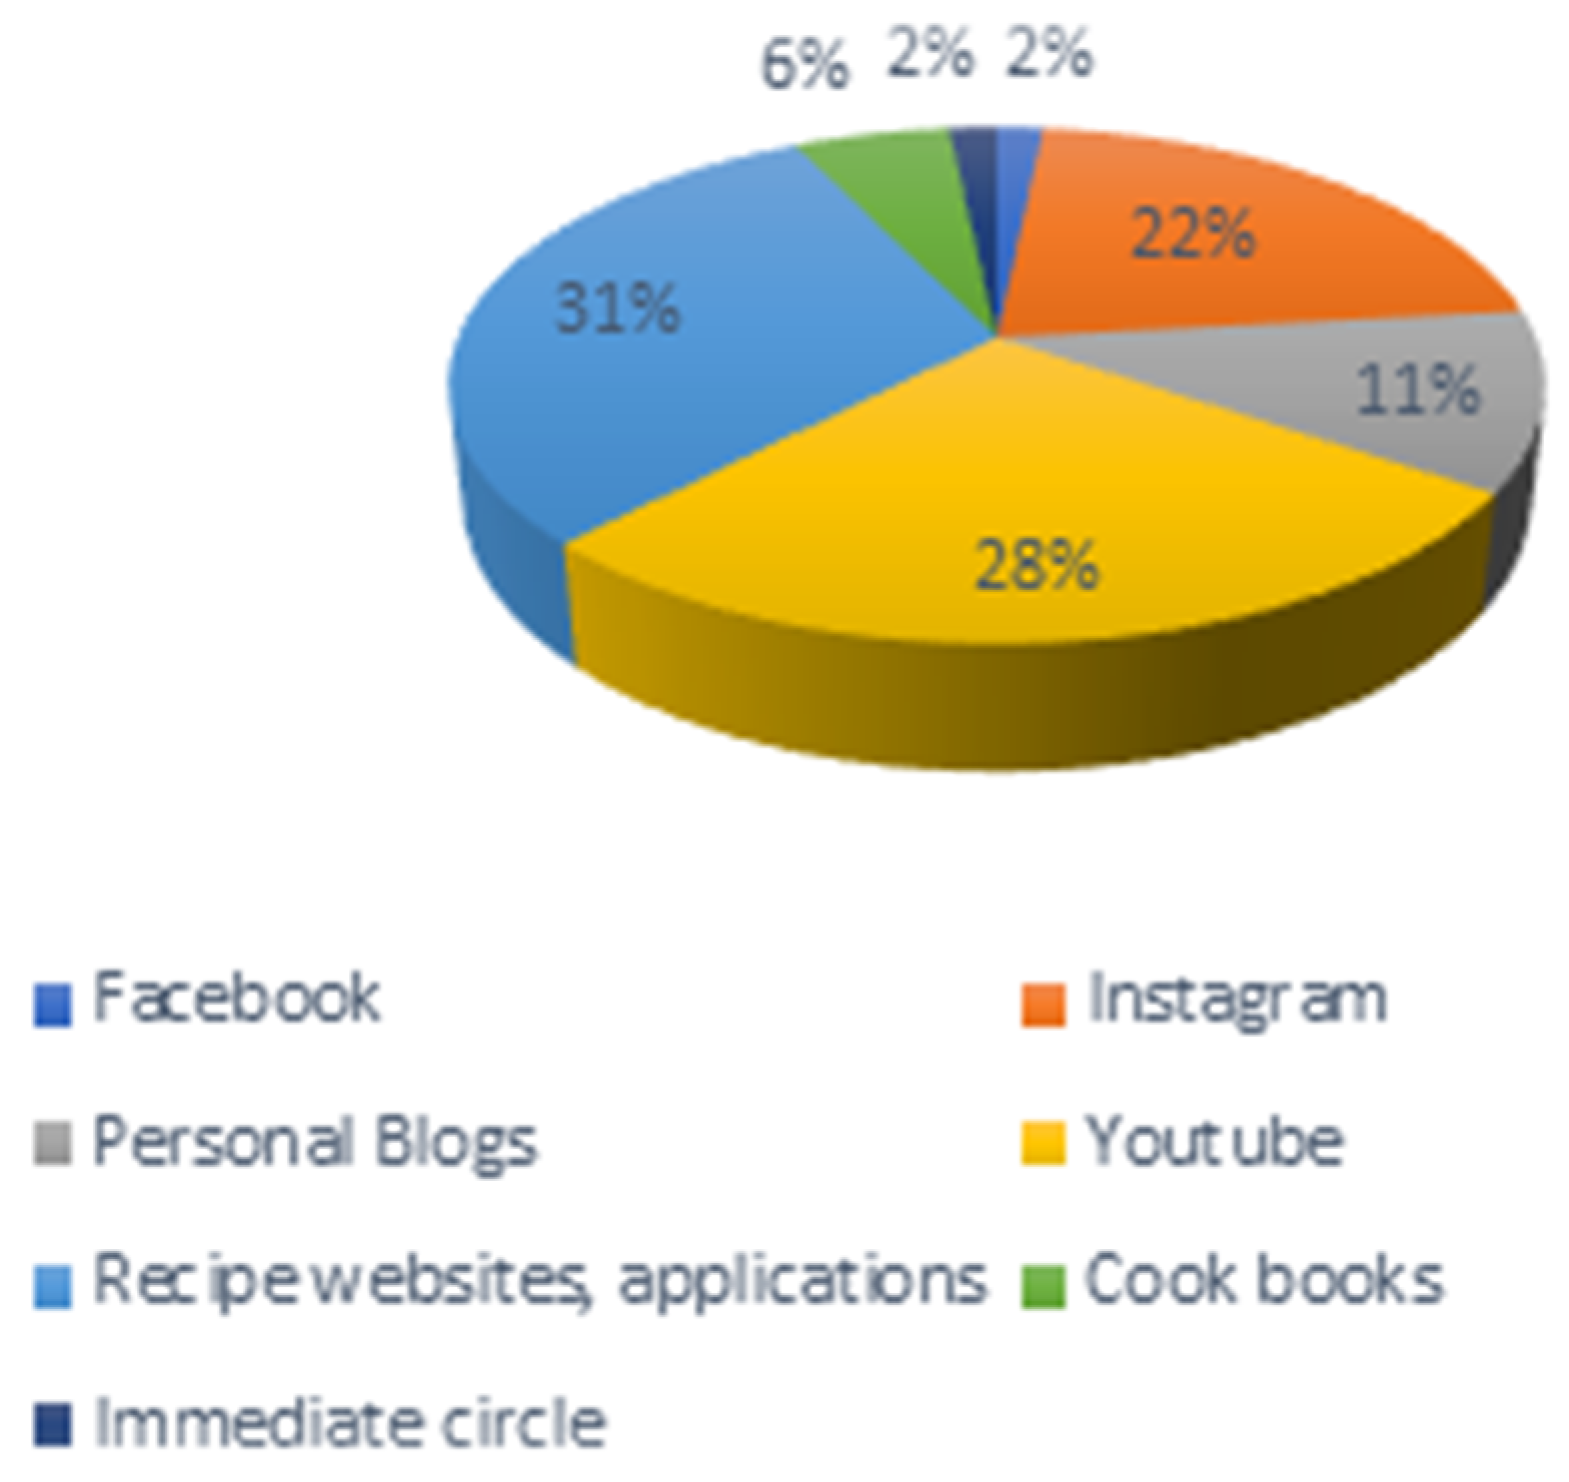
Consumers use different resources while cooking. When we asked respondents about how they find their recipes, the majority (31%) answered that they use recipe websites and smart phone applications which shown as
Figure 1.
After descriptive statistics, we conducted the Mann–Whitney U test to examine if there was any relationship between BMI and emotions during the quarantine period. For all three variables, our significance value (p) was less than 0.05. We rejected the null hypothesis: weight, height, and BMI significantly changed emotional status.
In the Mann–Whitney U test, we tested demographic variables with food groups. H2 was rejected. Age became statistically significant with other food groups such as dry food, meat dishes, and snacks. Marital status and household income became statistically significant with dry food and snacks. Gender became statistically significant with dry food and snacks.
For the second group, in the Mann Whitney U test, we tested demographic variables with food purchasing criteria. Age and marital status became statistically significant with the price. The level of education and household income became statistically significant with nutritional value information.
To understand differences between before quarantine and during the quarantine period, our third group hypothesis was investigated.
We used Wilcoxon signed ranks test for the preferences of snacks, vegetable dishes, pastry, and dessert groups, which were different before and during the quarantine, and during the quarantine, firstly bakery products and then snack groups were preferred.
Our fourth hypothesis aimed to test the differences existing between emotions during quarantine and the frequency of eating during the day. A chi-square test was conducted and showed that there is a significant difference between eating frequency and emotional status (p = 0.002). That is, when one was unhappy, they had a greater intent to eat more often.
Finally, we estimated the ordered probit model to understand consumer behavior changes for those six different food groups during the COVID-19 period. The logic behind specifying the ordered models by food groups represents the variables with interaction by quarantine period, a dummy.
4.1. Snack Group
As per
Table 4, For snack group, statistically significant variables were age, education, income, household size, number of people above 65, and quarantine. The Likert scale used ranged from 1 (most preferred) to 6 (least preferred) in food groups. Age (p = 0.022), education (
p = 0.002), income (
p = 0.007), and number of people which aged “65 years and older” in a household (
p = 0.015) had negative relationship with snacks consumption. The older the consumer, the more the snacks were preferred.
4.2. Vegetable Dishes
For vegetable dishes, only income and household size were statistically significant as per
Table 5; when income (
p = 0.03) increased, the consumption of vegetable dishes increased. The size of the household (
p = 0.003) had a negative relationship with vegetable dishes. We can link these two variables with a considerable increase in fruit and vegetable prices during the COVID-19 period. More people in the house leads to greater consumption of fruits and vegetables, but the price of the products and the logistic problems of fresh fruits and vegetables in the beginning of the pandemic did not allow them to consume enough.
4.3. Bakery Products
As per
Table 6, for bakery group females (
p = 0.001) consumed more bakery products during quarantine. As the weight (
p = 0.0107) of the consumer increased, they were more likely to consume bakery products; controversially, when the size of the household (
p = 0.00) increased, less bakery products were consumed.
4.4. Meat Dishes
For meat dishes as per
Table 7 none of our variables were statistically significant in the ordered probit model with
p < 0.05. However, when we change and tested with a 90% confidence interval, only income had a positive impact on the consumption of meat products.
4.5. Dishes with Olive Oil
As per
Table 8, age (
p = 0.009) has a positive correlation with consumption of dishes with olive oil (A.5). When consumers got older, they consumed more dishes with olive oil. On the other hand, as the number of people in the household increased (
p = 0.017), the consumption of dishes with olive oil decreased.
4.6. Dessert
Finally, the dessert consumption model explained in
Table 9, said that females
(p = 0.05) tended to consume more dessert; moreover, when people got older (
p = 0.0002), they tended to consume less dessert (A.6). Education (
p = 0.0263) and income (
p = 0.0029) also had a negative impact on dessert consumption. However, as the number of people in the household (
p = 0.005) increased, they were more likely to consume dessert in the quarantine period.
5. Conclusions
This study investigated the changes in food consumption preferences that occurred during the COVID-19 quarantine period in Turkey. The food consumption preferences were comparable between the pre-pandemic and during the pandemic period, considering demographic characteristics. As a stress factor, COVID-19 triggers the emotional status of consumers and then leads to changes in the frequencies of meals. Consumers with different BMI ranges showed different food preferences during the pandemic.
The data received during the COVID-19 period showed that consumers changed their preferences for food products, shopping, storing, disinfecting, and even cooking of food. This is consistent with previous findings showing that consumers changed their consumption frequency during the pandemic compared with before [
40,
41].
Online shopping, reduced interactions among people, credit cards or contactless payment instead of cash, distancing, and disinfection were the significant factors to avoid being infected by the virus during the quarantine period in Turkey. The findings indicate that a greater number of families followed doctors’ specific recommendations and consumed more fruits and vegetables during the quarantine to increase their immune function. However, human beings could not avoid sugar consumption owing to its endorphin effect, and they consumed more pastry products to improve their mood in the quarantine. There are additional findings from other surveys that observed an increased consumption of pastries during the lockdown [
42,
43]. However, they still did not forget their budget constraints, reflected in the rising share of discount markets in their supermarket product mix.
As a result, during the lockdown, consumers’ behaviors changed, trying to minimize the risk of being infected. Therefore, the supply-side, including supermarkets and other online delivery services, adapted its approach by creating new solutions to fit consumers’ new shopping demands. These responses included contactless delivery, new online platforms, and an extended service area.
Some brands have adapted their online platform in the quarantine period, which resulted in a significant rise in their traffic. These findings of food purchasing and consumption during the pandemic period align with the new regular life routine’s soft adoption in this unexpected period in terms of the food supply chain. Even in the peak days of the COVID-19 period, great food retailers stayed open and could provide enough food to consumers, which was the main factor to avoid a panic food demand of consumers in Turkey.


