Article

Spatial Coherency Model Considering Focal Mechanism Based on Simulated Ground Motions

1
School of Civil Engineering, Southwest Jiaotong University, Chengdu 610031, China
2
National Engineering Research Center of Geological Disaster Prevention Technology in Land Transportation, Chengdu 610031, China
3
China Nuclear Power Engineering Co., Ltd., Beijing 100840, China
*
Author to whom correspondence should be addressed.
Sustainability 2022, 14(4), 1989; https://doi.org/10.3390/su14041989
Submission received: 27 December 2021 / Revised: 25 January 2022 / Accepted: 27 January 2022 / Published: 10 February 2022

Abstract

:
The spatial coherencies of ground motions are the key to establishing multi-support excitation for large-dimension structures. Most of the existing models were established based on ground motions recorded at dense observation arrays which barely show any detailed information on the focal mechanism. However, in the near field, ground motions are dominated by the source, and so are the spatial coherencies of ground motions. In this paper, a deterministic physics-based method was used to simulate ground motions in the near field for various focal mechanism scenarios. The coherencies of the simulated ground motions were calculated. The Loh coherency model was used to fit the variation in the calculated coherencies for each scenario. The results show that the focal mechanism has a significant effect on the spatial coherencies of simulated ground motions. Finally, the probability density distributions of the parameters, a and b, of the Loh coherency model were obtained, and a coherency model was proposed, based on the Loh coherency model, in which the parameters are taken to be dependent on the focal mechanism.

1. Introduction

The ground motions measured at different locations within the dimensions of an engineered structure are typically different. This variation has an impact on large-dimension structures, which cannot be neglected, especially in the near field [1,2,3,4,5]. It is generally believed that the spatial variations in ground motions are produced by: (1) The wave-passage effect, which describes the time differences in the seismic waves arriving at different locations; (2) The incoherency effect, which represents the differences in the ways of superposing waves from an extended source, with a consideration of the scattering by irregularities and inhomogeneities along the path and at the site; and (3) The local site effect, which accounts for the changes in the amplitude and frequency contents of the bedrock motions caused by the local soil conditions [6,7]. The incoherency effect and the local site effect are as important as the wave-passage effect [8,9] and the coupling of the wave-passage effect and the incoherency effect has the greatest impact on the structure, by an analysis of the structural response after multi-support excitation [10].
Many seismograph arrays have been established to study the spatial variations in the ground motions among sites. Based on the seismograms collected, the similarities of ground motions at two sites can be investigated in the frequency domain using a coherency function. A consensus in the coherency is that the coherency of ground motions at two sites decreases with frequency and separation. To date, many coherency models have been established, either empirically or theoretically. For the empirical coherency models, seismograms of SMART-1 and LSST are commonly used. Harichandran and Vanmarcke developed a coherency model based on the records of SMART-1 using a random second-order theory [11,12]. Additional efforts have been made to take the focal mechanism and the attenuation of the wave propagation into account [13,14]. Some studies have explored the differences in the coherency characteristics between main shocks and aftershocks, in the near field and far field, respectively [15], as well as the different components of ground motions [16]. The coherencies of ground motions are often controlled by the crustal scattering nearest to the stations [17]. The coherency model at soft-soil sites is proved to decay faster than those at bedrock sites and general sites [18]. On the other hand, theoretical coherency models are derived from basic principles of the random process theory, together with a few assumptions regarding the propagation of seismic waves [6]. Major efforts have been put into the improvement of the model through the consideration of more items to account for the wave-passage effect, the incoherency effect and the local site effect [19,20,21,22,23,24,25,26]. Among the existing models, Abarahamson’s coherency model [15] and Loh’s coherency model [14] are the most widely used. However, coherency models established based on records of dense arrays may only reflect the geotechnical effects from the local area around the array. In addition, in the near field, ground motions are dominated by the source. Therefore, the focal mechanism becomes a predominant factor in the spatial coherency of ground motions. Usually, records of dense array do not come with detailed information on the causative fault. This makes it difficult to include a focal-mechanism-related item in the coherency model.
Ground motion simulation provides the opportunity to observe the spatial variations in the ground motions varying with the focal mechanism. A few studies have analyzed the coherencies of simulated ground motions, showing that the coherency characteristics of simulated ground motions are generally consistent with those based on the recorded seismograms [27]. Todorovska et al. indicate that the soil heterogeneity produces incoherent ground motions at the ground surface, while the non-linear decay of the shear modulus values seems to counteract the loss of coherency due to wave scattering [28]. Gatti et al. show that the coherency decreases with the decreasing stiffness of the soil and the rock layers near the ground surface, and with progressively deeper soil deposits [29]. The coherencies of the seismograms simulated based on the uniform single medium show that the seismic waves along different propagation paths are different, which proves that the fault strike is an important factor affecting the spatial coherency of ground-motion fields [30]. Two coherency models for bedrock sites were proposed for the strike-slip fault and the dip-slip fault, respectively [22,23]. So far, the influences of focal mechanism on the coherency models have still not been sufficiently investigated. In this article, a deterministic physics-based method was used to simulate ground motions in the near field for various focal mechanism scenarios. The coherencies of simulated ground motions were calculated, and a coherency model with focal-mechanism-dependent parameters was developed based on the Loh coherency model.

2. Deterministic Physics-Based Simulation of Ground Motions

We first simulated selected sites on the ground surface. The arrangements of the sites and the relative locations to the fault are shown in Figure 1. The deterministic physics-based method of Hartzell et al. [31,32] was used to simulate the ground motions for the earthquake scenarios. According to the method, the ground displacement at position x and time t for the target event is calculated by summing the theoretical Green’s functions for a given velocity model over the frequency band of interest:
U x , t = k = 1 L S k m t j = 1 M k S o k t i = 1 N k r 0 r i j α Δ σ i j Δ σ 0 R t g x , y , t t s i j t r i j
where indicates the convolution; g(x,y,ttsijtrij) is the ground displacement for the smallest subevent; tsij and trij are the travel-time delay of the phase of interest from the ith subevent to the receiver, and the rupture-time delay from the point of initiation on the target fault plane to the ith subevent, respectively; R t = t e λ t is the Brune [33,34] source-time function that is applied to the smallest subevent; Δ σ i j is the stress drop of the subevent on the target fault plane; Δ σ 0 is the stress drop of g; and r 0 / r i j represents the geometrical spreading, where r i j is the distance between the subevent on the target fault plane and the station at x; r 0 is the distance between the hypocenter at y of g and x; α is the power on the geometrical spreading; and the fault plane is divided into a fractal distribution of sources [35]. The non-overlapping subevent yields an ω 2 high-frequency spectral falloff [36]. Larger subevents are constructed by summing the required numbers of the smallest subevent and convolving with the Frankel [37] operator, which is the Fourier transform of S t in Equation (1). The summation in Equation (1) then proceeds in three stages: First, summing the N k of the smallest subevents to form each of the M k subevents of size k ; then, summing all the M k subevents of size k ; and finally, summing all the L size distributions.
We aimed to investigate the effects from the focal mechanism; thus, the fault length, L, width, W, and the focal depth, H, were assumed to be fixed. For a moment magnitude scenario of 6.5, the fault length, width, and the focal depth were assumed to be 15, 10, and 20 km, respectively. The entire fault plane was discretized into 13 and 9 subfaults along the strike and the dip, respectively, making the total number of subfaults 117. The star on the fault plane indicates the hypocenter. The fault was assumed to be bidirectionally ruptured, with the rupture velocity (VR) of 2.56 km/s. The 1D crust velocity structure model containing the alternating high- and -low-velocity-layer construction was adopted [38] and is shown in Figure 2. Q is frequency-dependent when implemented by the method of [39] (Qp = 300 f 0.5 and Qs = 150 f 0.5). The Green’s functions are based on the full wave theory frequency-wavenumber method for a layered half-space [40]. The nonlinear soil correction code, DESA2 [41,42], was used for the corrections for the near-surface soil effects based on a site classification of National Earthquake Hazards Reduction Program (NEHRP). The site conditions are assumed to be C in the NEHRP site classification. Three pairs of sites, a1–a2, b1–b2, and c1–c2, were selected on the ground surface with a separation of 400 m. a1 is the location of the epicenter. ζ denotes the distance between the epicenter and the site of the pair that is nearer to the epicenter. For a1–a2, b1–b2, and c1–c2, ζ was 0, 800, and 1600 m, respectively.
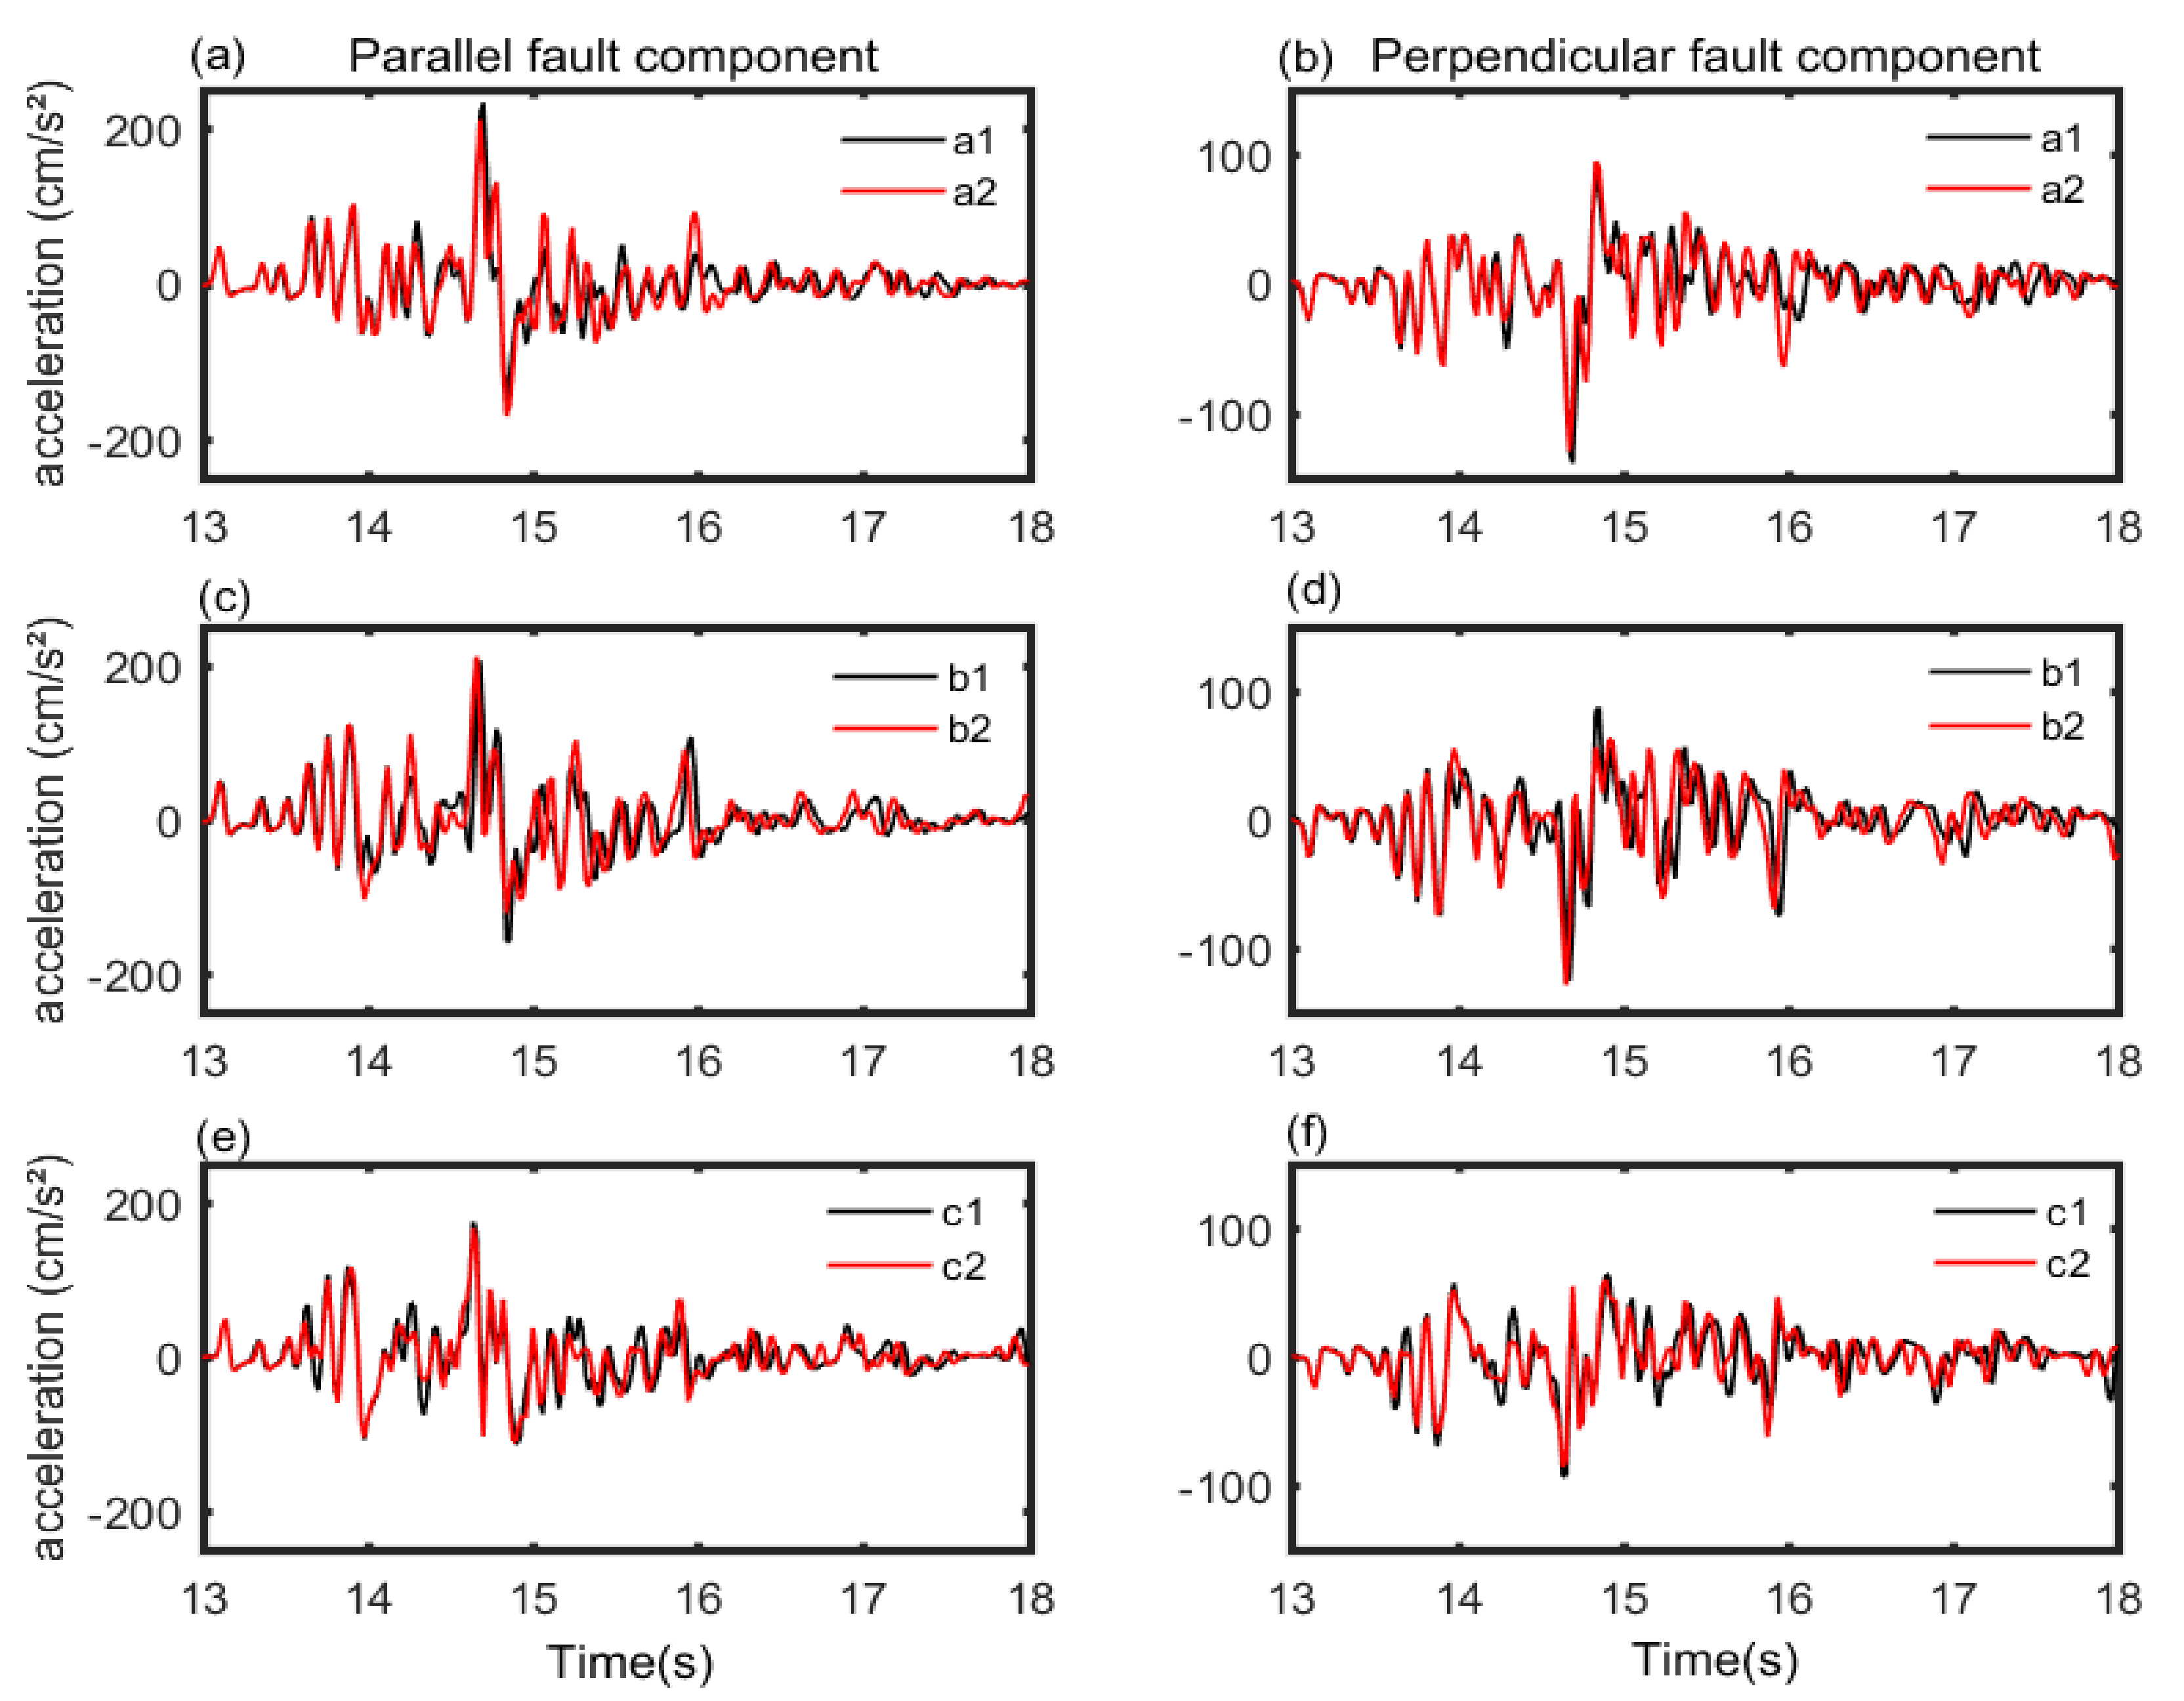
Using the deterministic physics-based method, the ground motions at six sites for different scenarios were calculated. The two horizontal components of the simulated ground motions were rotated in two directions: towards the parallel fault strike and towards the perpendicular fault strike. Figure 3 shows the parallel and perpendicular fault components of simulated ground motions at the six sites for a given strike, a dip, and a rake. For the accelerogram at each site pair, there are obvious differences in spite of the similarities. In the following section, different focal mechanisms are considered by changing the strike, dip, and rake.

3. Estimation of Coherency of Simulated Ground Motion

If the simulated ground motions are being treated as random time series, the complex-valued coherency spectrum can be defined by
γ i j f = S i j f ¯ S i i f ¯   S j j f ¯
where f denotes the frequency; S i i f ¯ denotes the smoothed auto-power spectral density of the acceleration time histories; and S i j f ¯ denotes the smoothed cross-power spectral density of the acceleration time histories, ai(t) and aj(t). Its bounded modulus, 0 < |γij(f)| < 1, often called a “lagged coherency”. In particular, γij(f) = 1 denotes the perfect linear dependence between the two acceleration time histories, whereas γij(f) = 0 denotes the complete lack of linear dependence. The γ of simulated ground motions at site pairs were calculated for each scenario.
Figure 4 shows the γ for two components of simulated ground motions of the different site pairs for the scenario: strike, 0°; dip, 30°; rake, 0°. An obvious decreasing of γ with frequency can be observed in Figure 4. A trough near 4 Hz can be observed in some of the panels, which is also observed in [43], when analyzing the γ for Event 14 recorded by LSST array. This trough may be dominated by scattered (incoherent) energy. The attenuation of γ shows the differences for different components at different site pairs. This is different to the results from other studies which assume that the loss of coherency for the two horizontal components is the same [16].
The Loh coherency model was then used to fit the γ of each pair of simulated ground motions in each scenario, which has the form of:
γ ω , d = exp [ a + b ω 2 d ]
where d denotes the separation between two sites, and ω denotes the circular frequency. In Equation (3), when the separation between two sites is fixed, the coherency at the starting frequency (0 Hz) is dominated by a, while the loss of coherency in high frequencies is dominated by b. An illustration of the calculated γ and the fitted function, using the Loh coherency model, is shown in Figure 5.

4. Effect of Focal Mechanism on Coherency of Simulated Ground Motions

It is of significance to investigate the effect of focal mechanism on spatial coherencies of simulated ground motions. In this section, thirteen strikes were considered, ranging from 0° to 360°, by an incensement of 30°. The dips were assumed to be 15°, 30°, 45°, 60°, and 75°, separately. The rakes were assumed to be 0° and 90° for typical strike-slip and dip-slip faults, respectively. A total of 130 focal mechanism scenarios were calculated. For each site pair of each scenario, the γ was fitted, and the parameters, a and b, were obtained.
We then selected some scenarios at the site pair, b1-b2, in order to exhibit the effect of focal mechanism, for which rakes of both 0° and 90° were selected. The four chosen strikes were 0°, 90°, 180°, and 270°, and the three chosen dips were 30°, 60°, and 75°, respectively. In each panel of Figure 6, the pink, orange, and blue lines represent the γ for the dips of 30°, 60°, and 75°, respectively. The different line styles denote the corresponding strikes. The different rows and columns represent different rakes and horizontal components of simulated ground motions, respectively.
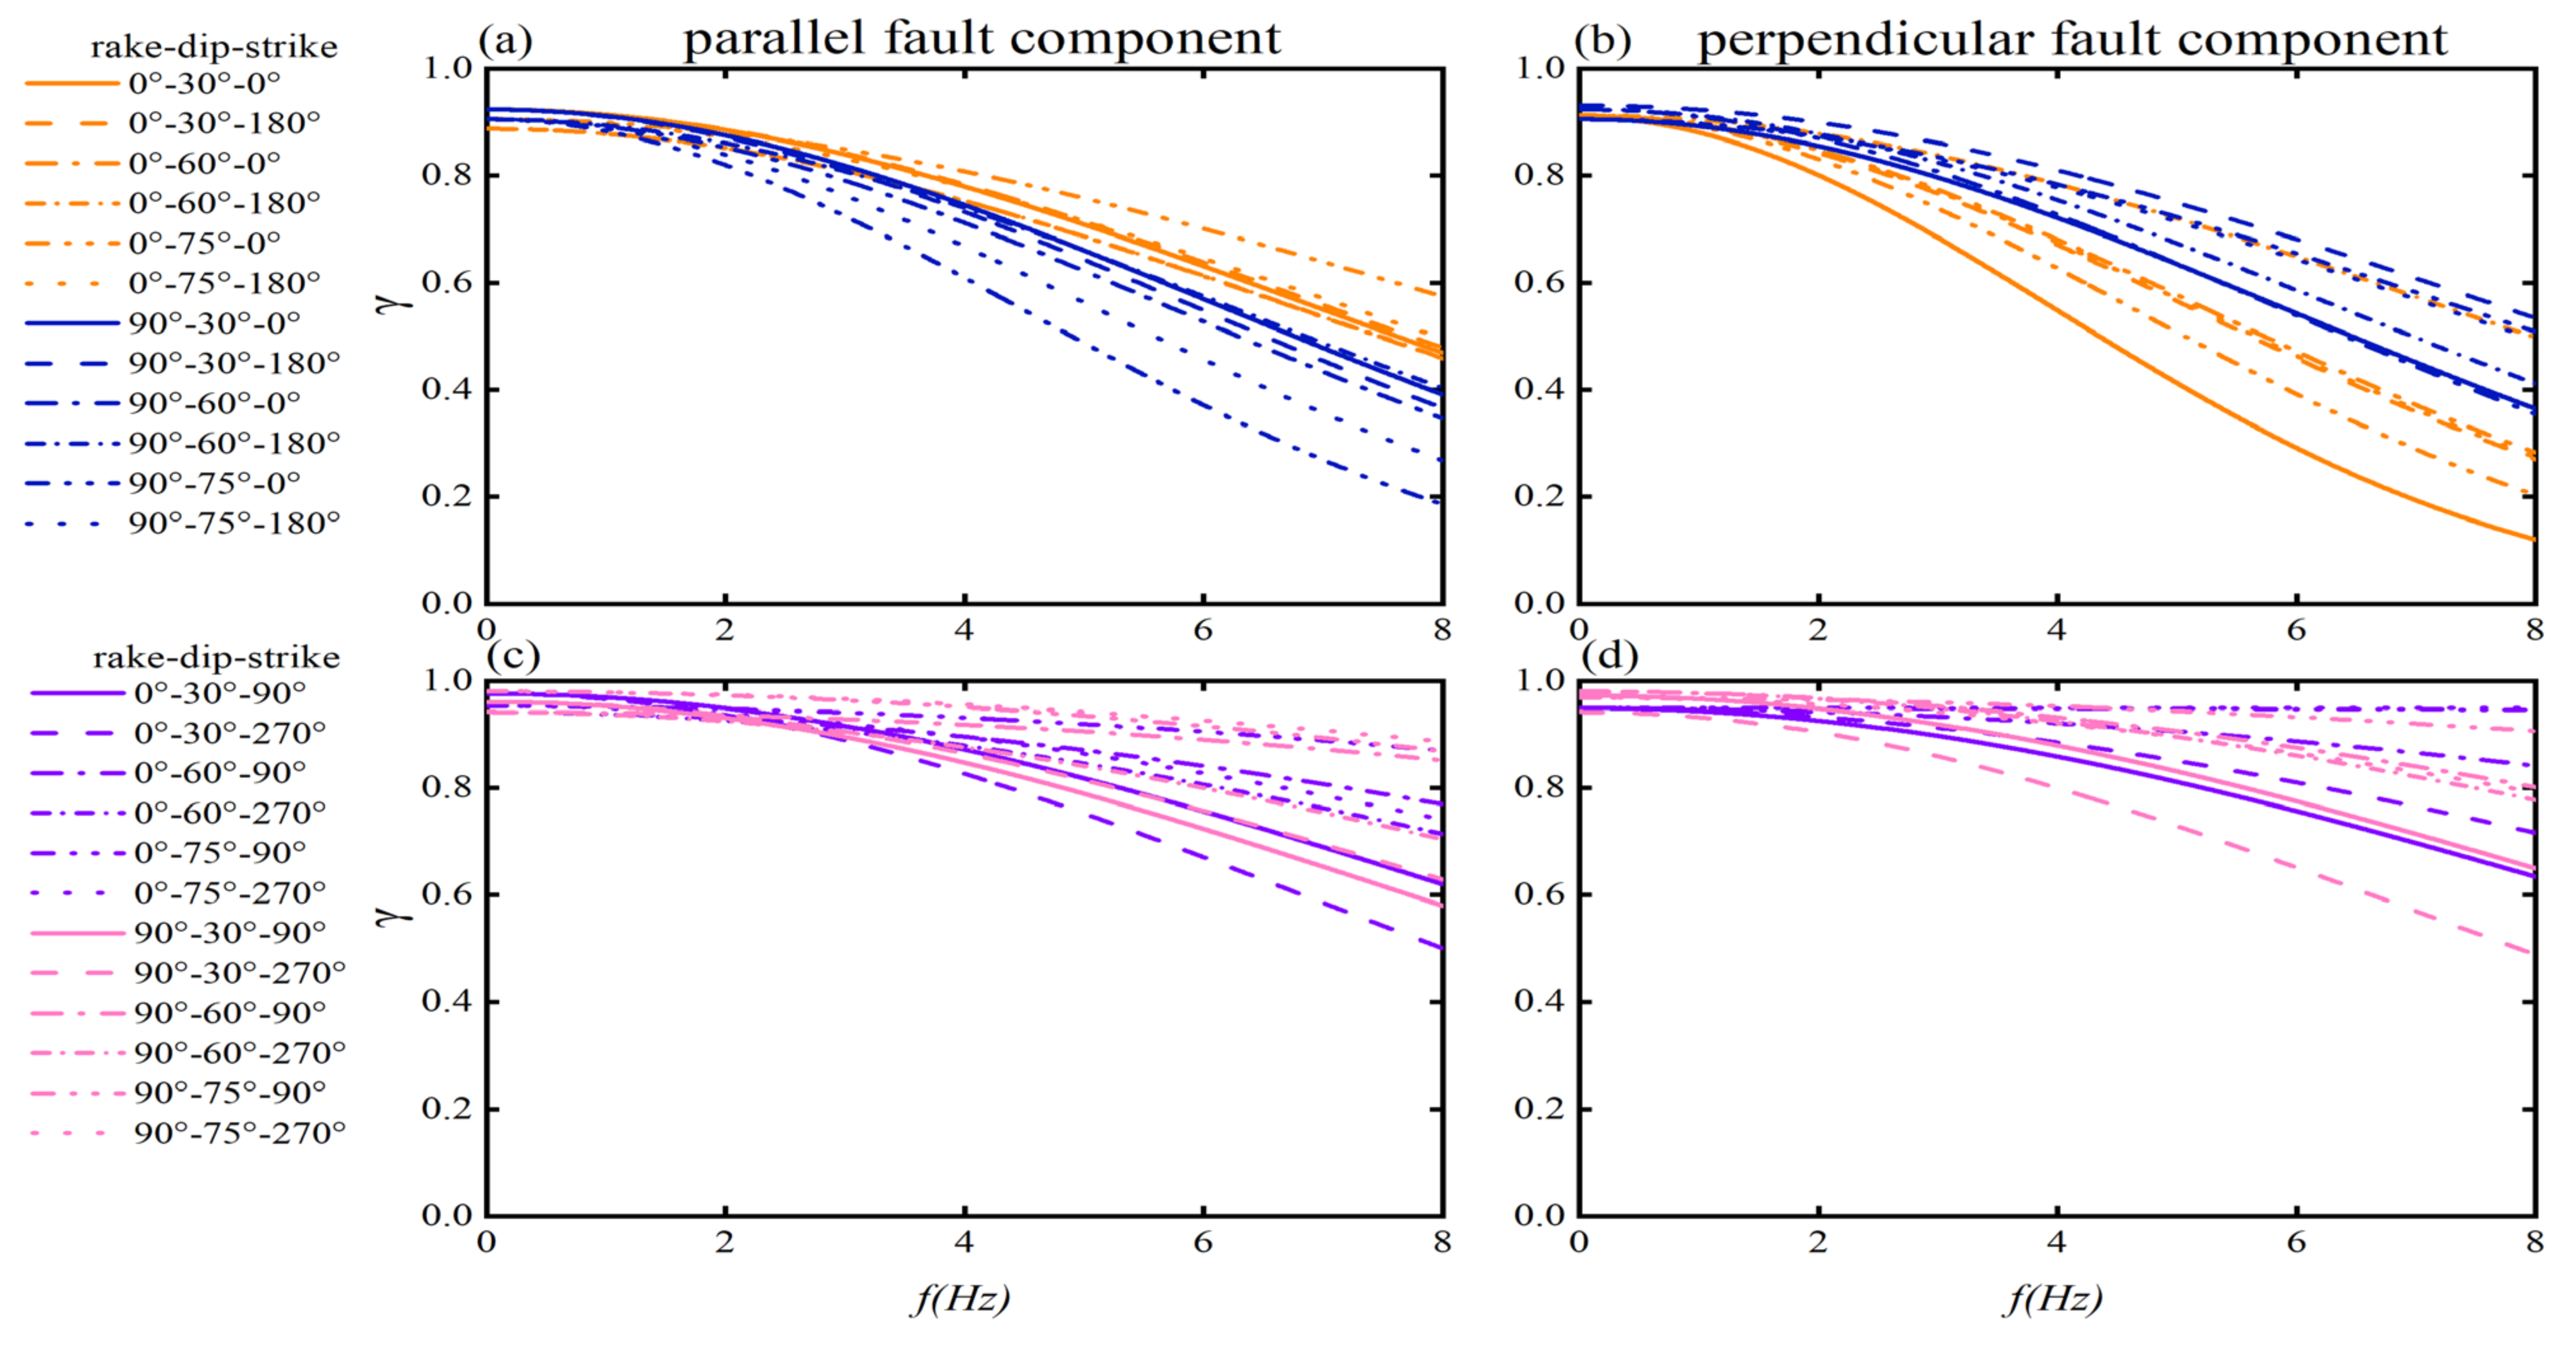
Generally, the γ attenuates with the frequency in Figure 6. However, the attenuation velocity of the γ varies significantly for various focal mechanism scenarios, even with the separation of 400 m. It is noteworthy that more incoherency is found at the parallel-to-fault site pair, but less incoherency is found at the perpendicular-to-fault site pair. This phenomenon is also observed in [30]. Moreover, for the perpendicular-to-fault site pair, the larger the dip, the less loss of γ.
We then reassembled these selected scenarios. In Figure 7, the orange and purple lines denote the γ given by scenarios with rakes of 0°, while the blue and pink lines denote the γ produced by faults with rakes of 90°. The various line styles represent the different dips and strikes. The first row, panels (a) and (b), denotes scenarios in which the fault strike is parallel to the site pair; the second row, panels (c) and (d), exhibits scenarios where the fault strike is perpendicular to the site pair. The different columns still represent different horizontal components of simulated ground motions. As is shown in Figure 7, it can clearly be observed that a higher γ in almost all frequencies could be found, at the perpendicular-to-fault site pair.
For frequencies below 2 Hz, there are no significant differences in the γ among four panels. However, variations in the γ become remarkable for frequencies higher than 2 Hz. One can easily find that, at the parallel-to-fault site pair, for the parallel fault component, the γ produced by the faults with rakes of 0° are higher than the γ produced by the faults with rakes of 90°, whereas the reverse is true for the perpendicular fault component. However, there is a slightly obvious phenomenon where, at the perpendicular-to-fault site pair, for the parallel fault component, the γ generated by the faults with rakes of 0° are lower than the γ generated by the faults with rakes of 90°, whereas the reverse is true for the perpendicular fault component.
According to the significant coherency variations for the selected scenarios, the effect of focal mechanism should not be neglected. Thus, in the next section, the parameter characteristics of the Loh coherency model based on all scenarios are discussed statistically, and then the focal-mechanism-dependent coherency model is proposed.

5. Focal Mechanism Dependent Coherency Model

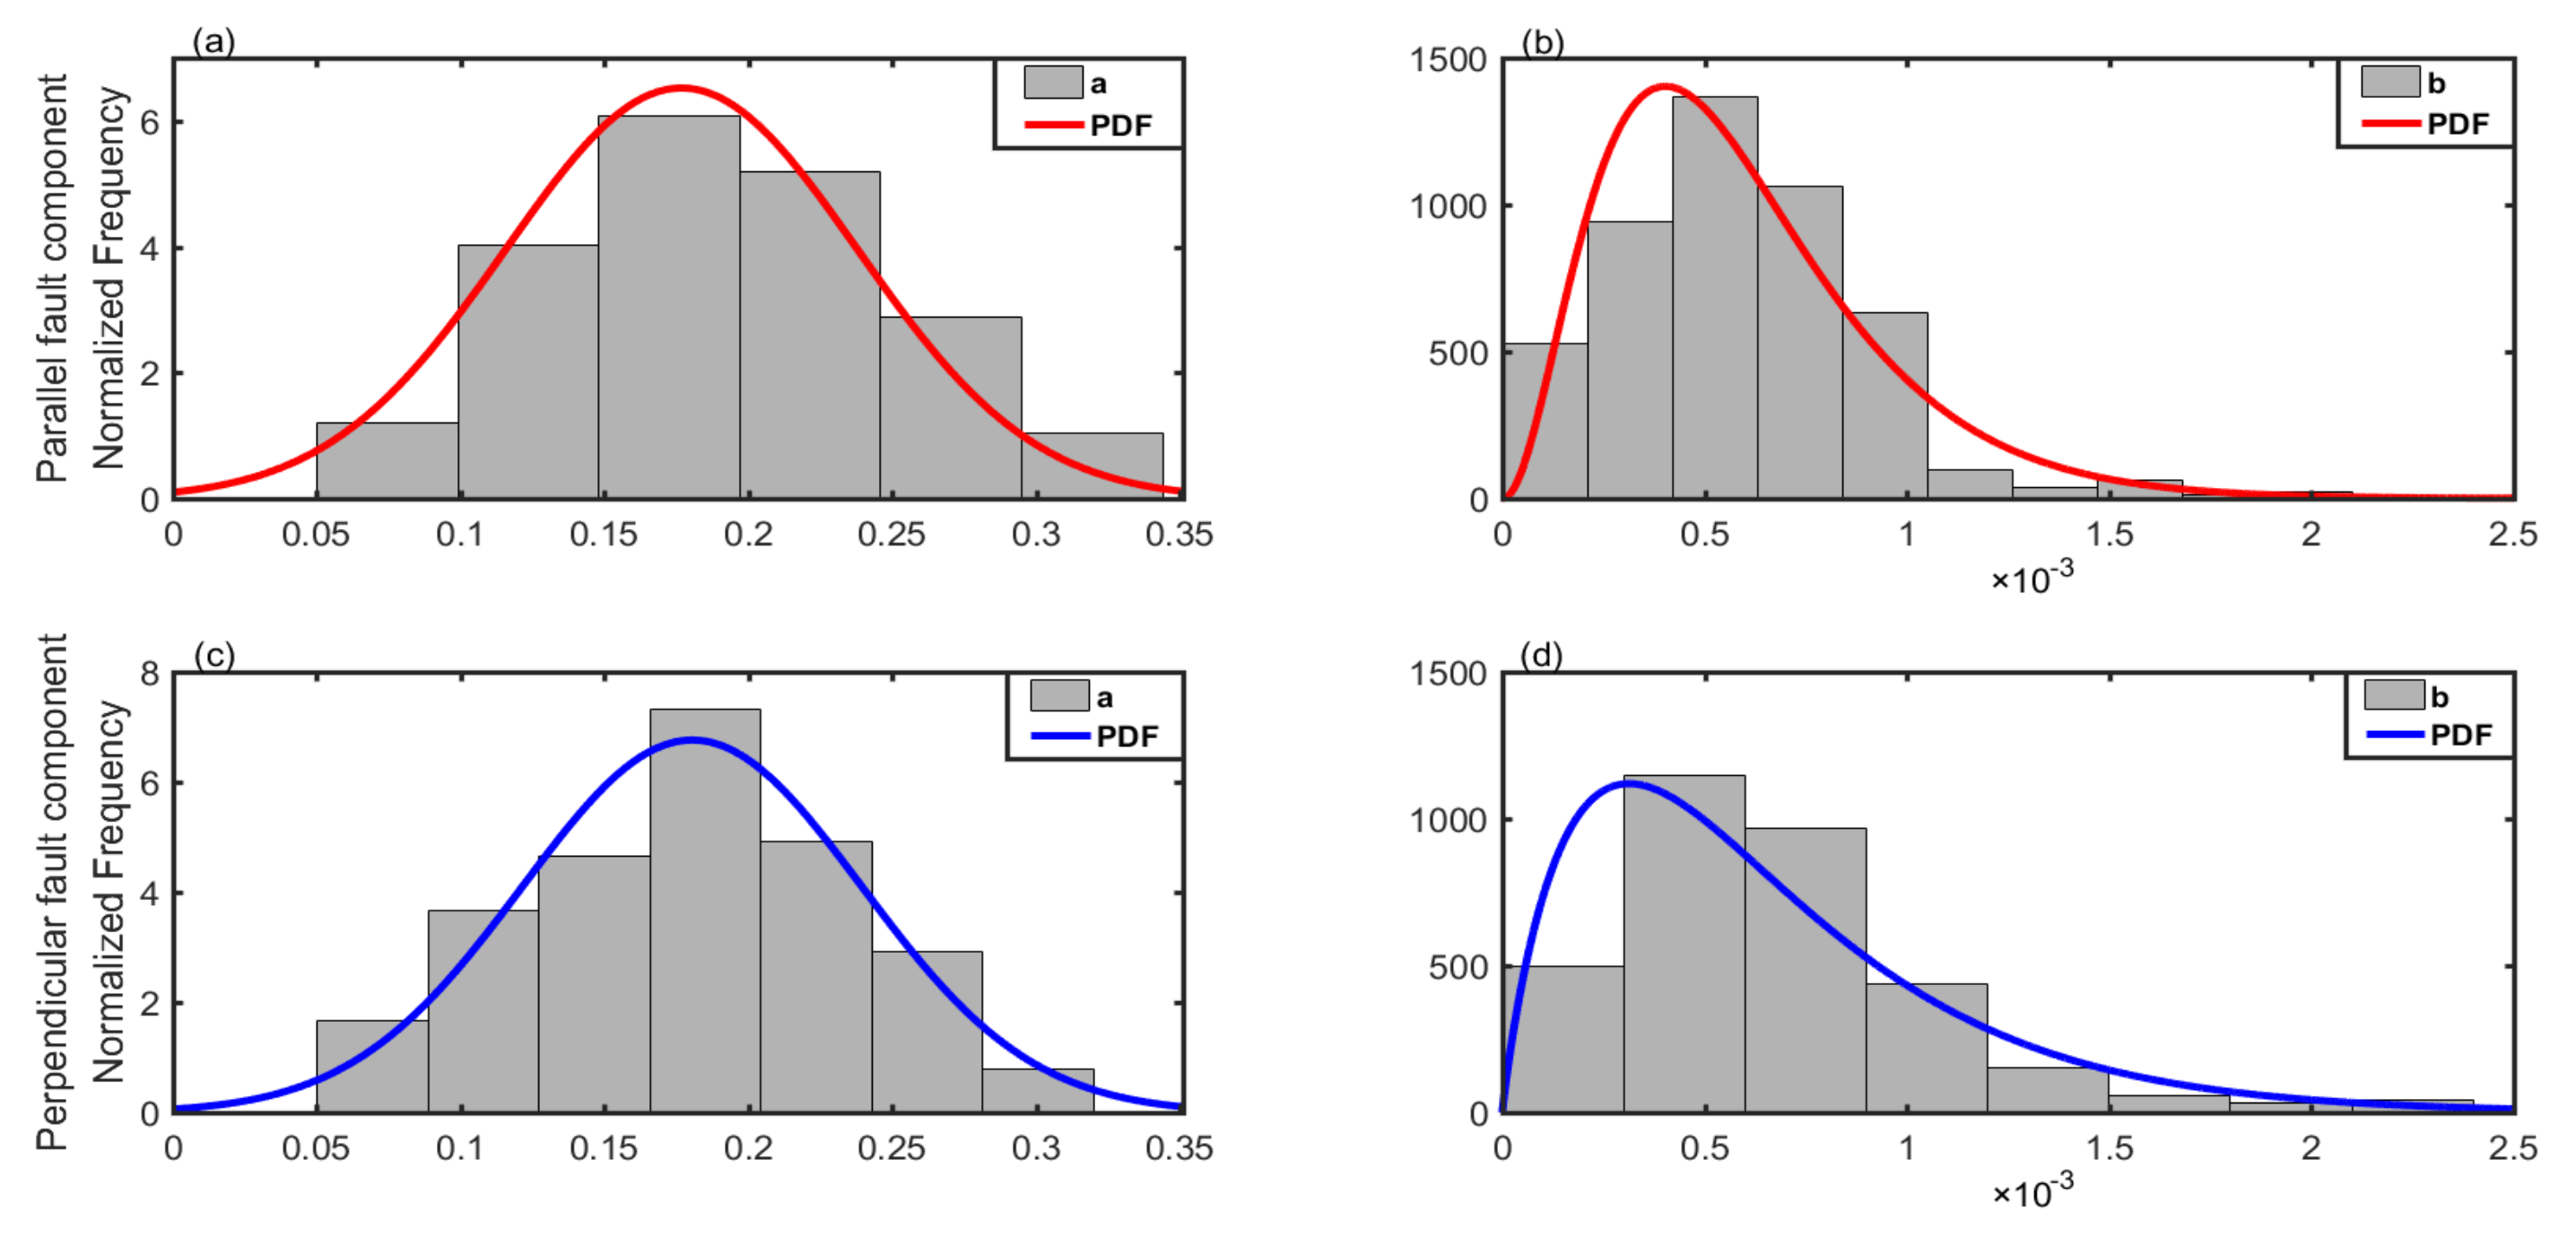
To analyze the parameter characteristics, the normalized frequency diagrams of a and b are obtained with the fitted probability density distributions, as is shown in Figure 8. A normal distribution is assigned to a, whereas b follows a beta distribution. The assigned probability distributions and distribution parameters are provided in Table 1. Based on the distribution parameters in Table 1, the parameters, a and b, for the Loh coherency model, could be generated for any unknown focal mechanism.
We then develop a coherency model based on the Loh model, by relating the model parameters to the focal mechanism. Examples of the variations in the parameters, a and b, versus the strike and the corresponding fitted curves are shown in Figure 9. In general, there are three peaks and two troughs in each curve, showing “W” shapes. One can easily see that the three peaks always occur at strikes of 0°, 180°, and 360°, corresponding to the relative position where the site pair is parallel to the fault strike; two troughs occur at strikes of 90° and 270°, where the site pair is perpendicular to the fault strike. This may be because the radiation from the source is symmetrical, and therefore the waveforms on the opposite azimuth (perpendicular to the fault plane) should be coherent, while the ones on the same side of the fault may differ significantly, depending on the source-receiver azimuth and the focal mechanism. According to the Loh model, the larger the a and b, the more loss of coherency. Therefore, for the same side of the fault, more loss of coherency will be found when the site pair is parallel to the fault strike than when it is perpendicular to the fault strike, which conforms to the phenomenon observed in Section 4 and [30].
A function with three peaks and two troughs is chosen to fit the variation of the parameters, a and b:
W a , b x = m × 1 + c × x q 180 2 × cos k 2 π x q t + n
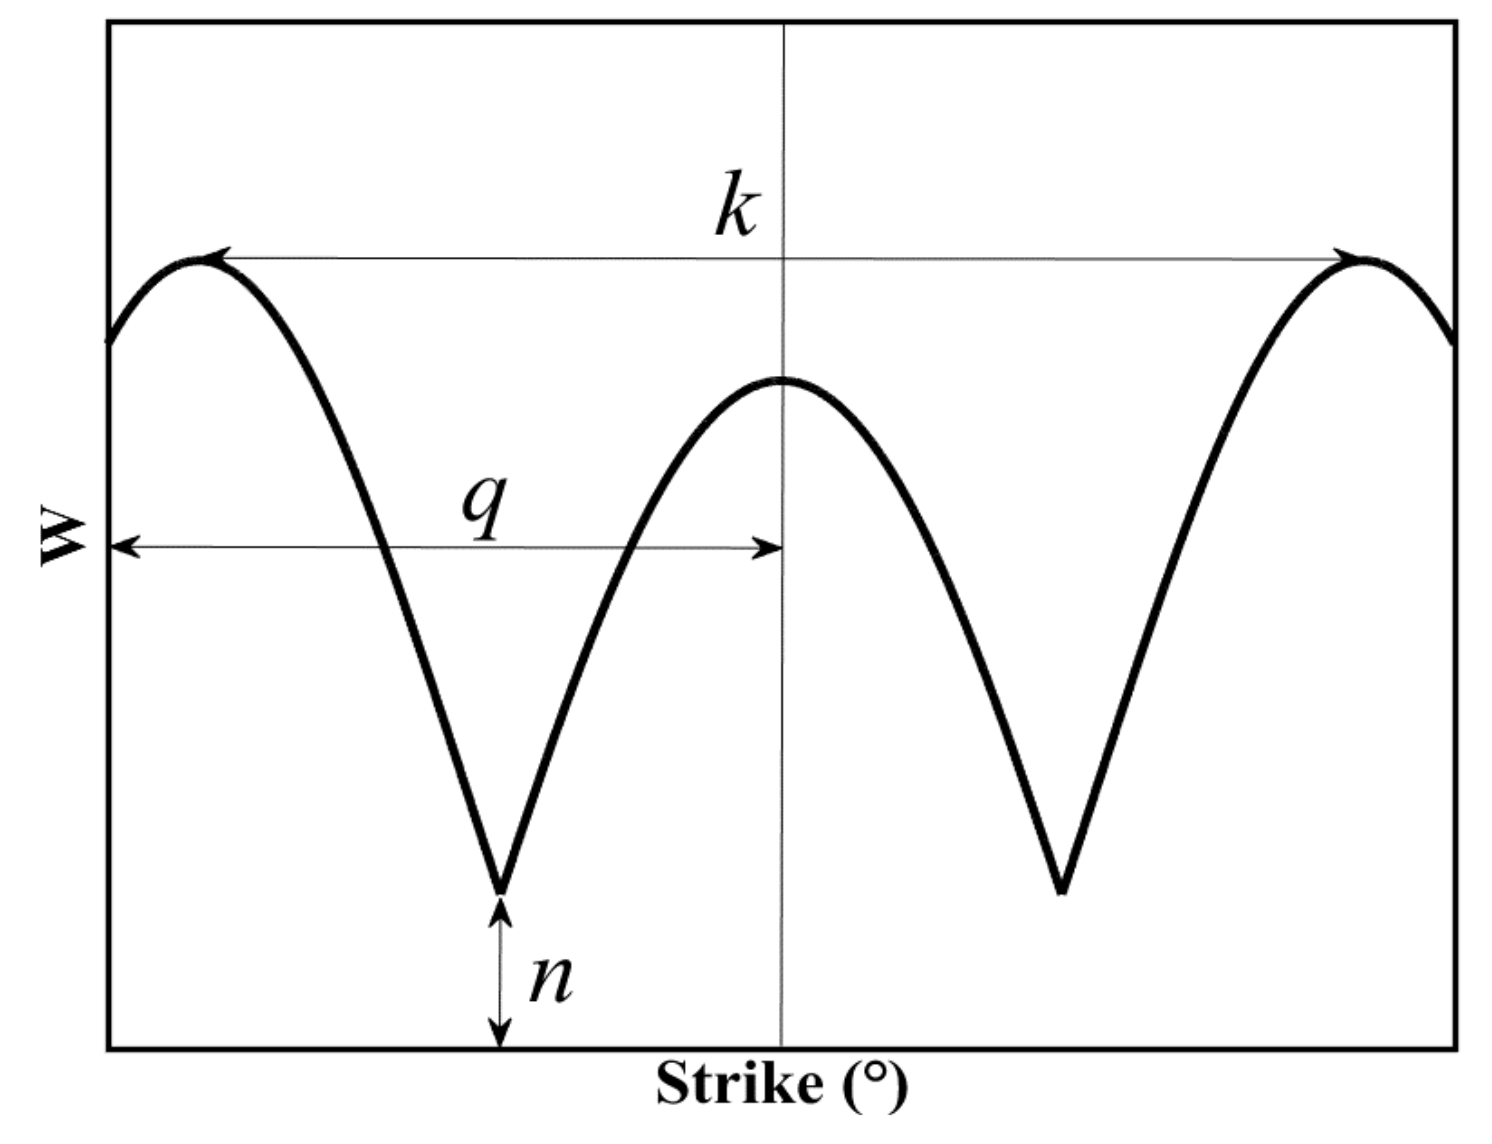
where x denotes the strike; q represents the position of the symmetry axis; k denotes the distance between the two peaks at both ends; t controls the sharpness of the two troughs; n represents the minimum value of the curve; m and c mutually control the ratio of the peaks at both ends to the peak at the symmetry axis, as is shown in Figure 10. When c is greater than 0, the peaks at both ends will be higher than the peak at the symmetry axis; when c is less than 0, the peaks at both ends will be lower than the peak at the symmetry axis. The parameters in Equation (4) can be obtained using the nonlinear least squares fitting.
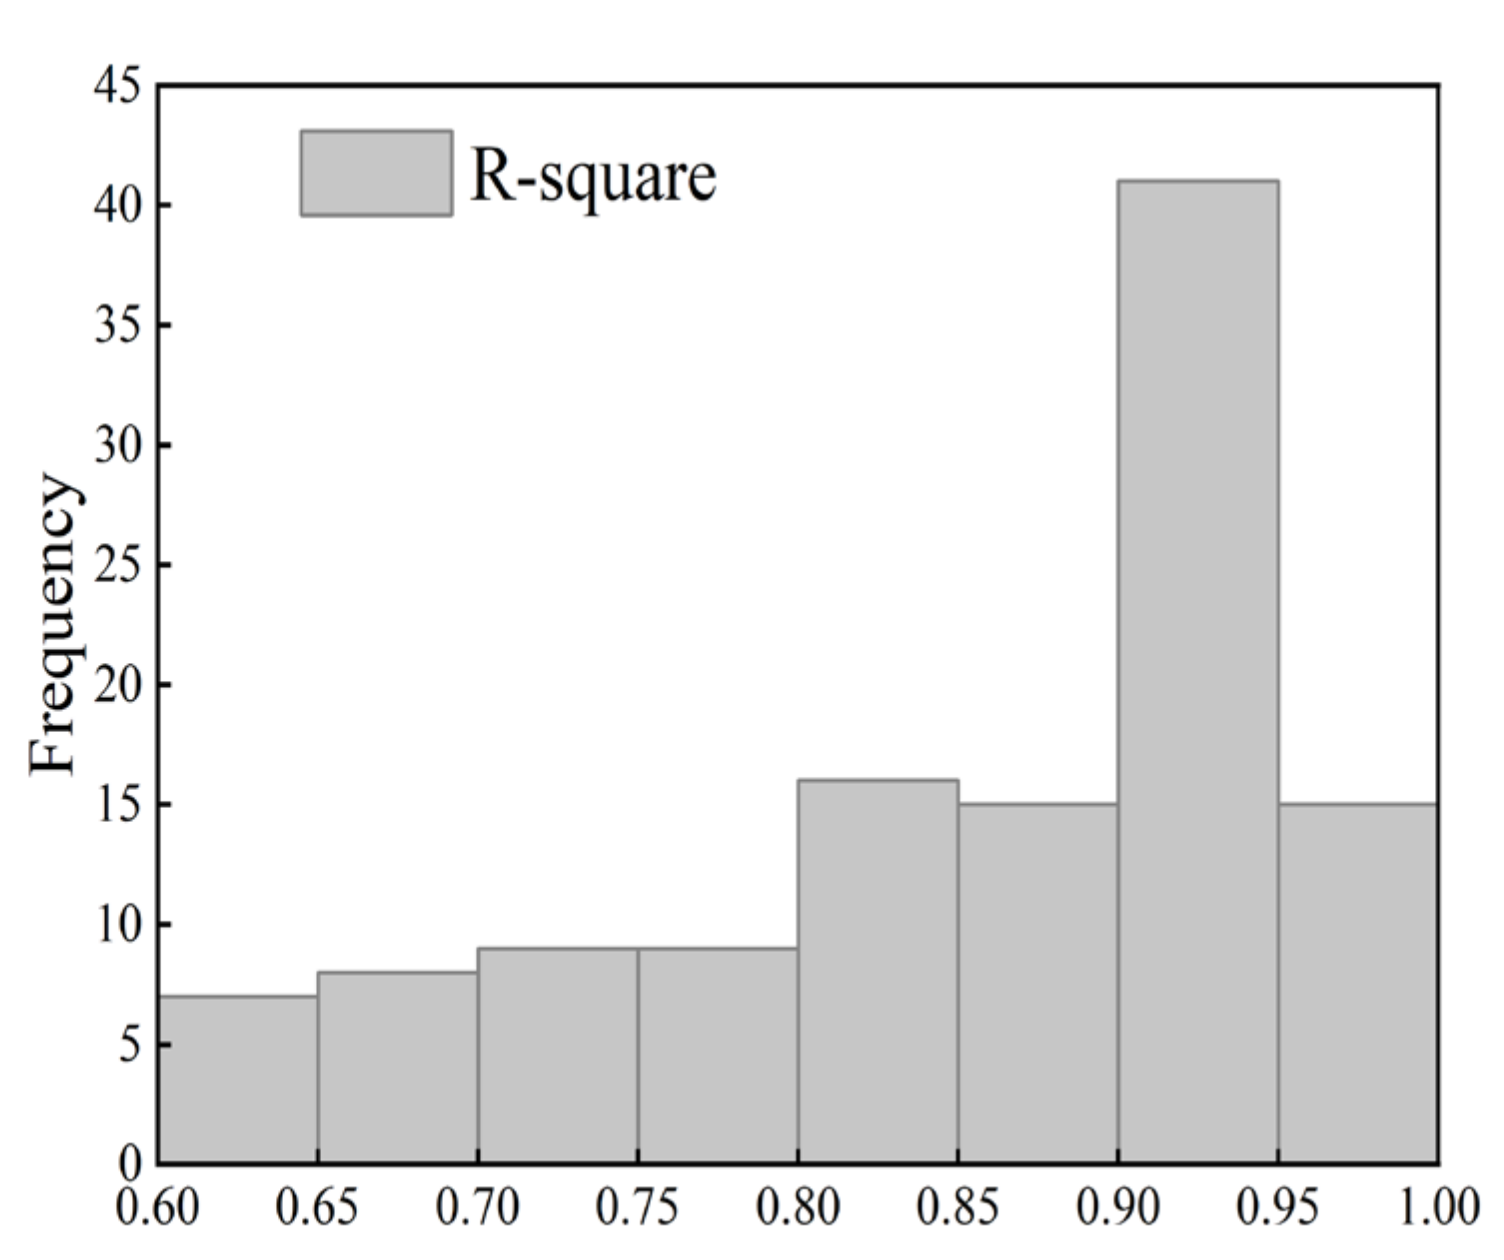
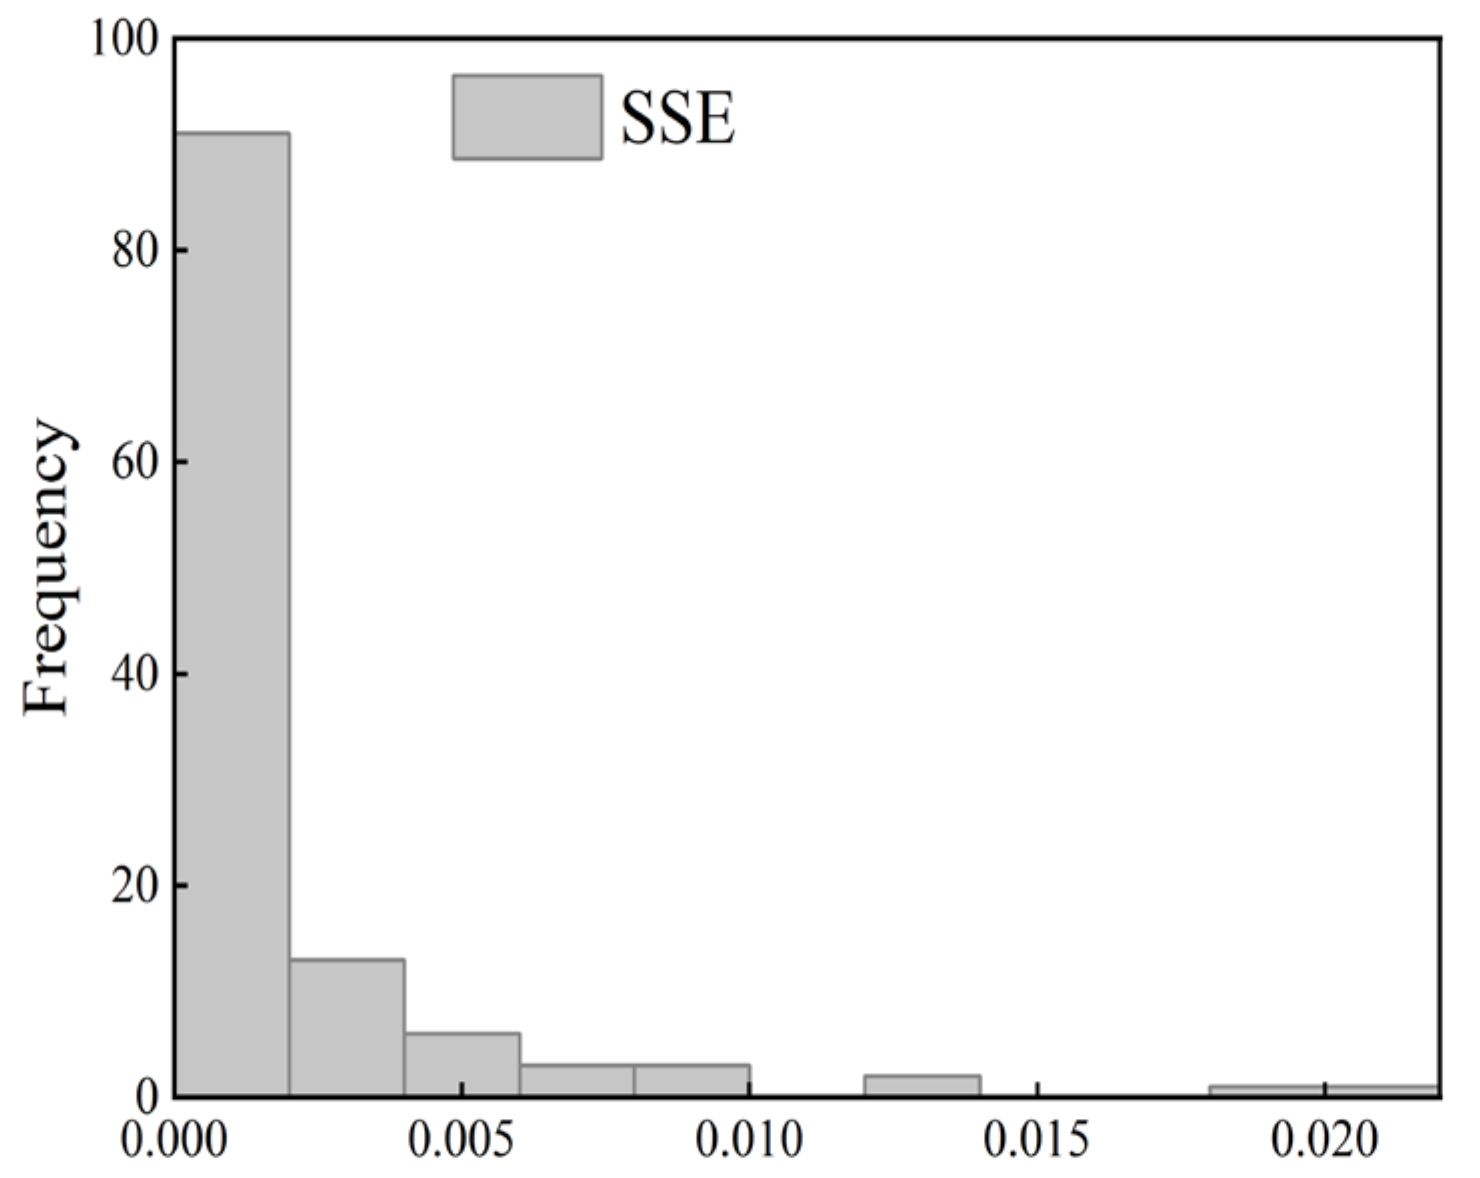
For a high goodness of fit, the R-square needs to be close to 1, while the SSE needs to be close to 0. The histograms of the R-square and the SSE for all scenarios are shown in Figure 11 and Figure 12. The values of the R-square are concentrated in the range of 0.9~0.95, and those of the SSE are intensively close to 0, indicating the reliability of the fitting using Equation (4).
We then related the strike-dependent m, c, q, k, n, and t in Equation (4) to the dip, φ, and the epicentral distance, ζ , of the site pair. Each parameter of m, c, q, k, n, and t was assumed to be linearly dependent on the φ and ζ :
P = λ1 ∗ φ + λ2 ∗ ζ + λ3
where P represents the parameters m, c, q, k, n, or t. Table 2 lists the λ1, λ2, λ3 for the m, c, q, k, n, and t for all the strikes, dips, and rakes. Using Table 2, the m, c, q, k, n, and t for a given dip, rake, and distance, ζ , can be computed. Afterwards, by using Equation (4), the parameters, a and b, in the Loh model, for a given strike can be obtained, and hence the γ for the site pair can be calculated.
The proposed coherency model is compared with some widely-used models (Harichandran and Vanmarcke, 1986; Hao, 1989; Loh, 1990; Chen, 2016; Ding, 2020 [44]), as is shown in Figure 13. Some models established based on simulated ground motions (Ding,2003; Ding,2004) are also shown in Figure 13. In each panel of Figure 13, the shaded area represents the γ generated by the proposed model for various focal mechanisms and site separations. As can be seen from Figure 13, for frequencies higher than approximately 2 Hz, simulation-based models provide a higher predicted γ than record-based models. For frequencies below 2 Hz, the same trend is also found, except for the Loh 1990 model, compared with simulation-based models. The γ calculated by the proposed model is centered by the prediction of the Ding 2020 model proposed based on records. For rakes of 0°, the curves predicted by the Ding 2004 model are approximately at the center of the shaded area. For rakes of 90°, however, the curves predicted by the Ding 2003 model lie at the upper boundary of the shaded area. The differences may come from the assumption of the Ding (2003, 2004) models that adopts a line source model and a uniform single medium, and ignores the subfault energy distributed along the dip, as well as the scattering effect of seismic waves. In addition, both of the Ding models were developed at bedrock sites, leading to a slower decay of the γ than those given by other models.

6. Conclusions and Discussion

To investigate the effect of the focal mechanism on the spatial coherencies of ground motions, a deterministic physics-based method was used to simulate ground motions in the near field for various focal mechanism scenarios. The coherencies of the simulated ground motions were calculated. The Loh coherency model was used to fit the variations in the calculated coherencies of each pair of simulated ground motions in each scenario, and the effect of focal mechanism on the spatial coherency was analyzed. Moreover, the probability density distributions of the parameters, a and b, of the Loh coherency model, were obtained. A coherency model was proposed, based on the Loh coherency model.
The main conclusions include:
(1)
The coherency of simulated ground motions shows a decreasing trend with the increasing distance and frequency, indicating the reliability of the deterministic physics-based simulations;
(2)
For the parallel-to-fault site pair, more loss of coherency will be found, which is also observed in [30]. In addition, for the parallel fault component, the coherency of the dip-slip fault decays faster than that of the strike-slip fault; however, for perpendicular fault components, the strike-slip fault provides lower coherency. For the perpendicular-to-fault site pair, the larger the dip, the less loss of coherency;
(3)
The statistical analysis of the parameters, a and b, in the Loh coherency model, shows that a normal distribution is assigned to a, whereas b follows the beta distribution. The distribution parameters could be utilized to generate a and b for any unknown focal mechanism;
(4)
A focal-mechanism-dependent coherency model was proposed, based on the Loh coherency model. In terms of the comparison of coherency models, simulation-based models generally provide higher predicted coherencies than record-based models, except for the Ding 2020 model.
In the deterministic simulations of ground motions in this paper, a set of simplifications with respect to the finite fault, the propagation of seismic waves, and the similar site conditions were adopted. The slip distribution on the fault plane was also assumed to be uniform. Certainly, the slip distribution on the fault plane is usually non-uniform because of the existence of the asperities. In the near field, where the ground motion is dominated by the source, the effect of the slip distribution on the fault plane is the predominant factor in the complexity of the spatial ground motion distribution. However, this complexity may make it difficult to exhibit the regularity of the coherency with the focal mechanism. In addition, the non-uniform slip distribution on the fault plane has strong randomness and is not easily characterized. Therefore, as the first trial, we excluded the possible distortion from the slip distribution to highlight the effect from focal mechanism. The coherency may be more complex once the non-uniform slip distribution is considered. Thus, the effects from slip distribution and propagation medium can be evaluated by further considering various parameters in the deterministic simulation of ground motion in the future. In summary, developing a coherency model using simulated ground motion allows for a better description of the effect of focal mechanism on spatial variations in the near field, as well as for specifications of the design of ground motions for regions or geologic settings where no array recordings are available.

Author Contributions

Conceptualization, K.W. and X.S. (Xiaodan Sun); methodology, K.W. and X.S. (Xiaodan Sun); software, K.W. and K.R.; validation, X.S. (Xiaodan Sun) and Y.L. (Yu Liu); formal analysis, K.W. and X.S. (Xiaodan Sun); investigation, K.W. and K.R.; resources, K.W., X.S. (Xiaodan Sun) and Y.L. (Yu Liu); writing—original draft preparation, K.W. and K.R.; writing—review and editing, X.S. (Xiaodan Sun) and Y.L. (Yu Liu); data curation, X.S. (Xiaoying Sun); visualization, Y.L. (Yanqing Luo) All authors have read and agreed to the published version of the manuscript.

Funding

This research was funded by the Joint Research Fund for Earthquake Science launched by the National Natural Science Foundation of China and China Earthquake Administration (U2039208), and the National Natural Science Foundation of China (51878578).

Informed Consent Statement

Not applicable.

Acknowledgments

The authors would like to thank all anonymous reviewers.

Conflicts of Interest

The authors declare no conflict of interest.

References

  1. Wang, J.; Wang, Q.X.; Jiang, J.R. Response of long-span arch bridge under spatially varying ground-motion. J. Vib. Eng. 1995, 2, 1004–4523. [Google Scholar]
  2. Yang, Q.S.; Liu, W.H.; Tian, Y.J. Response analysis of national stadium under spatially variable earthquake ground-motion. China Civ. Eng. J. 2008, 2, 35–41. [Google Scholar]
  3. Zhao, D.H.; Shen, P.J.; Liu, G.H. Dynamic elastic-plasticity analysis of long-span exhibition hall under multi-support seismic excitations. J. Harbin Inst. Technol. 2016, 48, 70–74. [Google Scholar]
  4. Wu, Z.J. Generation of Spatial Correlation Ground-Motion and the Study of Inconsistency Motivation about Underground Pipeline; Southwest Jiaotong University: Chengdu, China, 2012. [Google Scholar]
  5. Yuan, M.Z. Seismic Response of Underground Structure under Non-Uniform Seismic Excitation; Wuhan University of Technology: Wuhan, China, 2019. [Google Scholar]
  6. Kiureghian, A.D. A coherency model for spatially varying ground-motion. Earthq. Eng. Struct. Dyn. 1996, 25, 99–111. [Google Scholar] [CrossRef]
  7. Harichandran, R.S. Spatial Variation of Earthquake Ground Motion, What Is it, How Do We Model It, and What Are Its Engineering Implications? Department of Civil and Enviromental Engineering, Michigan State University: East Lansing, MI, USA, 1999. [Google Scholar]
  8. Soyluk, K.; Dumanoglu, A.A. Spatial variability effects of ground-motion on cable-stayed bridges. Soil Dyn. Earthq. Eng. 2004, 24, 241–250. [Google Scholar] [CrossRef]
  9. Soyluk, K. Comparison of random vibration methods for multi-support seismic excitation analysis of long-span bridges. Eng. Struct. 2004, 26, 1573–1583. [Google Scholar] [CrossRef]
  10. Wang, Y.L. Parameter Analysis of Seismic Spatial Correlation Effects on Single-Layer Reticulated Domes; Harbin Institute of Technology: Harbin, China, 2013. [Google Scholar]
  11. Harichandran, R.S.; Vanmarcke, E.H. Stochastic variation of earthquake ground-motion in space and time. J. Eng. Mech. 1986, 112, 154–174. [Google Scholar] [CrossRef]
  12. Harichandran, R.S. Local spatial variation of earthquake ground-motion. In Earthquake Engineering and Soil Dynamics II—Recent Advances in Ground-Motion Evaluation; American Society of Civil Engineers: New York, NY, USA, 1988; pp. 203–217. [Google Scholar]
  13. Loh, C.H.; Yeh, Y.T. Spatial variation and stochastic modelling of seismic differential ground movement. Earthq. Eng. Struct. Dyn. 1988, 16, 583–596. [Google Scholar] [CrossRef]
  14. Loh, C.H.; Lin, S.G. Directionality and simulation in spatial variation of seismic waves. Eng. Struct. 1990, 12, 134–143. [Google Scholar] [CrossRef]
  15. Abrahamson, N.A.; Schneider, J.F.; Stepp, J.C. Empirical spatial coherency functions for application to soil-structure interaction analyses. Earthq. Spectra 1991, 7, 1–27. [Google Scholar] [CrossRef]
  16. Hao, H.; Oliveira, C.S.; Penzien, J. Multiple-station ground motion processing and simulation based on SMART-1 array data. Uclear Eng. Des. 1989, 111, 293–310. [Google Scholar] [CrossRef]
  17. Menke, W.; Lerner-Lam, A.L.; Dubendorff, B.; Pacheco, J. Polarization and coherency of 5 to 30 Hz seismic wave fields at a hard-rock site and their relevance to velocity heterogeneities in the crust. Bull. Seismol. Soc. Am. 1990, 80, 430–449. [Google Scholar] [CrossRef]
  18. Chen, Q.J.; Yang, Y.S.; Wang, Y.C. A practical spatial coherency model of seismic ground-motion based on strong earthquake array record. China Civ. Eng. J. 2016, 49, 1–6. [Google Scholar]
  19. Somerville, P.G.; McLaren, J.P.; Saikia, C.K.; Helmberger, D.V. Site-specific estimation of spatial incoherence of strong ground-motion. Geotech. Spec. Publ. 1988, 20, 188–202. [Google Scholar]
  20. Somerville, P.G.; McLaren, J.P.; Sen, M.K.; Helmberger, D.V. The influence of site conditions on the spatial incoherency of ground-motion. Struct. Saf. 1991, 10, 1–13. [Google Scholar] [CrossRef]
  21. Luco, J.E.; Wong, H. Response of a rigid foundation to a spatially random ground-motion. Earthq. Eng. Struct. Dyn. 1986, 14, 891–908. [Google Scholar] [CrossRef]
  22. Ding, H.P.; Liu, Q.F.; Jin, X.; Yuan, Y.F. A coherency model of ground-motion on base-rock corresponding to dip-slip fault. Earthq. Eng. Eng. Vib. 2003, 2, 8–11. [Google Scholar]
  23. Ding, H.P.; Liu, Q.F.; Jin, X.; Yuan, Y.F. A coherency function model of ground-motion at base-rock corresponding to strike-slip fault. ACTA Seismol. Sin. 2004, 1, 62–67. [Google Scholar] [CrossRef]
  24. Yang, Q.S.; Chen, Y.J. A practical coherency model for spatially varying ground-motion. Struct. Eng. Mech. 2000, 9, 141–152. [Google Scholar] [CrossRef]
  25. Liu, X.M.; Ye, J.H.; Li, A.Q. Space coherency function model of vertical ground-motion. Eng. Mech. 2004, 2, 140–144. [Google Scholar]
  26. Li, Y.M.; Wu, Z.Q.; Chen, H.G. Analysis and modeling for characteristics of spatially varying ground-motion. J. Vib. Shock 2013, 2, 164–170. [Google Scholar]
  27. Lu, J.B. Spatial Correlation of Simulated Near-Fault Ground-Motion Field; Institute of Engineering Mechanics: Harbin, China, 2008. [Google Scholar]
  28. Todorovska, M.I.; Trifunac, M.D.; Ding, H.P.; Orbović, N. Coherency of dispersed synthetic earthquake ground-motion at small separation distances: Dependence on site conditions. Soil Dyn. Earthq. Eng. 2015, 79, 253–264. [Google Scholar] [CrossRef]
  29. Gatti, F.; Paludo, L.D.C.; Svay, A.; Cottereau, R.; Clouteau, D. Investigation of the earthquake ground-motion coherency in heterogeneous non-linear soil deposits. Procedia Eng. 2017, 199, 2354–2359. [Google Scholar] [CrossRef]
  30. Zheng, F.; Ye, J.H. Coherency of spatial ground-motion field. J. Vib. Shock 2009, 28, 23–28+192–193. [Google Scholar]
  31. Hartzell, S.; Harmsen, S.; Frankel, A.; Larsen, S. Calculation of broadband time histories of ground-motion: Comparison of methods and validation using strong-ground-motion from the 1994 Northridge earthquake. Bull. Seismol. Soc. Am. 1999, 89, 1484–1504. [Google Scholar]
  32. Hartzell, S.; Guatteri, M.; Mai, P.M.; Liu, P.C.; Fisk, M. Calculation of broadband time histories of ground-motion, Part II: Kinematic and dynamic modeling using theoretical Green’s functions and comparison with the 1994 Northridge earthquake. Bull. Seismol. Soc. Am. 2005, 95, 614–645. [Google Scholar] [CrossRef]
  33. Brune, J.N. Tectonic stress and the spectra of seismic shear waves from earthquakes. Geophys. Res. 1970, 75, 4997–5009. [Google Scholar] [CrossRef] [Green Version]
  34. Brune, J.N. Correction to tectonic stress and the spectra of seismic shear waves from earthquakes. Geophys. Res. 1971, 76, 5002. [Google Scholar]
  35. Irikura, K.; Kamae, K. Estimation of strong ground-motion in broad-frequency band based on a seismic source scaling model and an empirical green’s function technique. Ann. Geophys. 1994, 37, 1721–1743. [Google Scholar] [CrossRef]
  36. Frankel, A. Mechanisms of seismic attenuation in the crust: Scattering and anelasticity in New York State, South Africa, and southern California. J. Geophys. Res. 1991, 96, 6269–6289. [Google Scholar] [CrossRef]
  37. Frankel, A. Simulating strong motions of large earthquakes using recordings of small earthquakes: The Loma Prieta mainshock as a test case. Bull. Seismol. Soc. Am. 1995, 85, 1144–1160. [Google Scholar] [CrossRef]
  38. Campillo, M.; Paul, A. Influence of the lower crustal structure on the early coda of regional seismograms. J. Geophys. Res. Solid Earth 1992, 97, 3405–3416. [Google Scholar] [CrossRef]
  39. Liu, P.C.; Archuleta, R.J.; Hartzell, S.H. Prediction of broadband ground-motion time histories: Hybrid low/high-frequency method with correlated random source parameters. Bull. Seismol. Soc. Am. 2006, 96, 2118–2130. [Google Scholar] [CrossRef] [Green Version]
  40. Zhu, L.; Rivera, L.A. A note on the dynamic and static displacements from a point source in multilayered media. Geophys. J. Int. 2002, 148, 619–627. [Google Scholar] [CrossRef]
  41. Finn, W.D.L.; Lee, K.W.; Martin, G.R. Stress Strain Relations for Sand in Simple Shear; Department of Civil Engineering, University of British Columbia: Vancouver, BC, Canada, 1975. [Google Scholar]
  42. Lee, K.W.; Finn, W.D.L. DESRA-2, Program for the Dynamic Effective Stress Response Analysis of Soil Deposits with Energy Transmitting Boundary including Assessment of Liquefaction Potential; Department of Civil Engineering, University of British Columbia: Vancouver, BC, Canada, 1978. [Google Scholar]
  43. Abrahamson, N.A.; Schneider, J.F.; Stepp, J.C. Spatial coherency of shear waves from the Lotung, Taiwan large-scale seismic test. Struct. Saf. 1991, 10, 145–162. [Google Scholar] [CrossRef]
  44. Ding, H.P.; Li, X. Comparison of parametric and non-parametric methods for calculating coherence function. Earthq. Eng. Eng. Dyn. 2020, 40, 11–19. [Google Scholar]
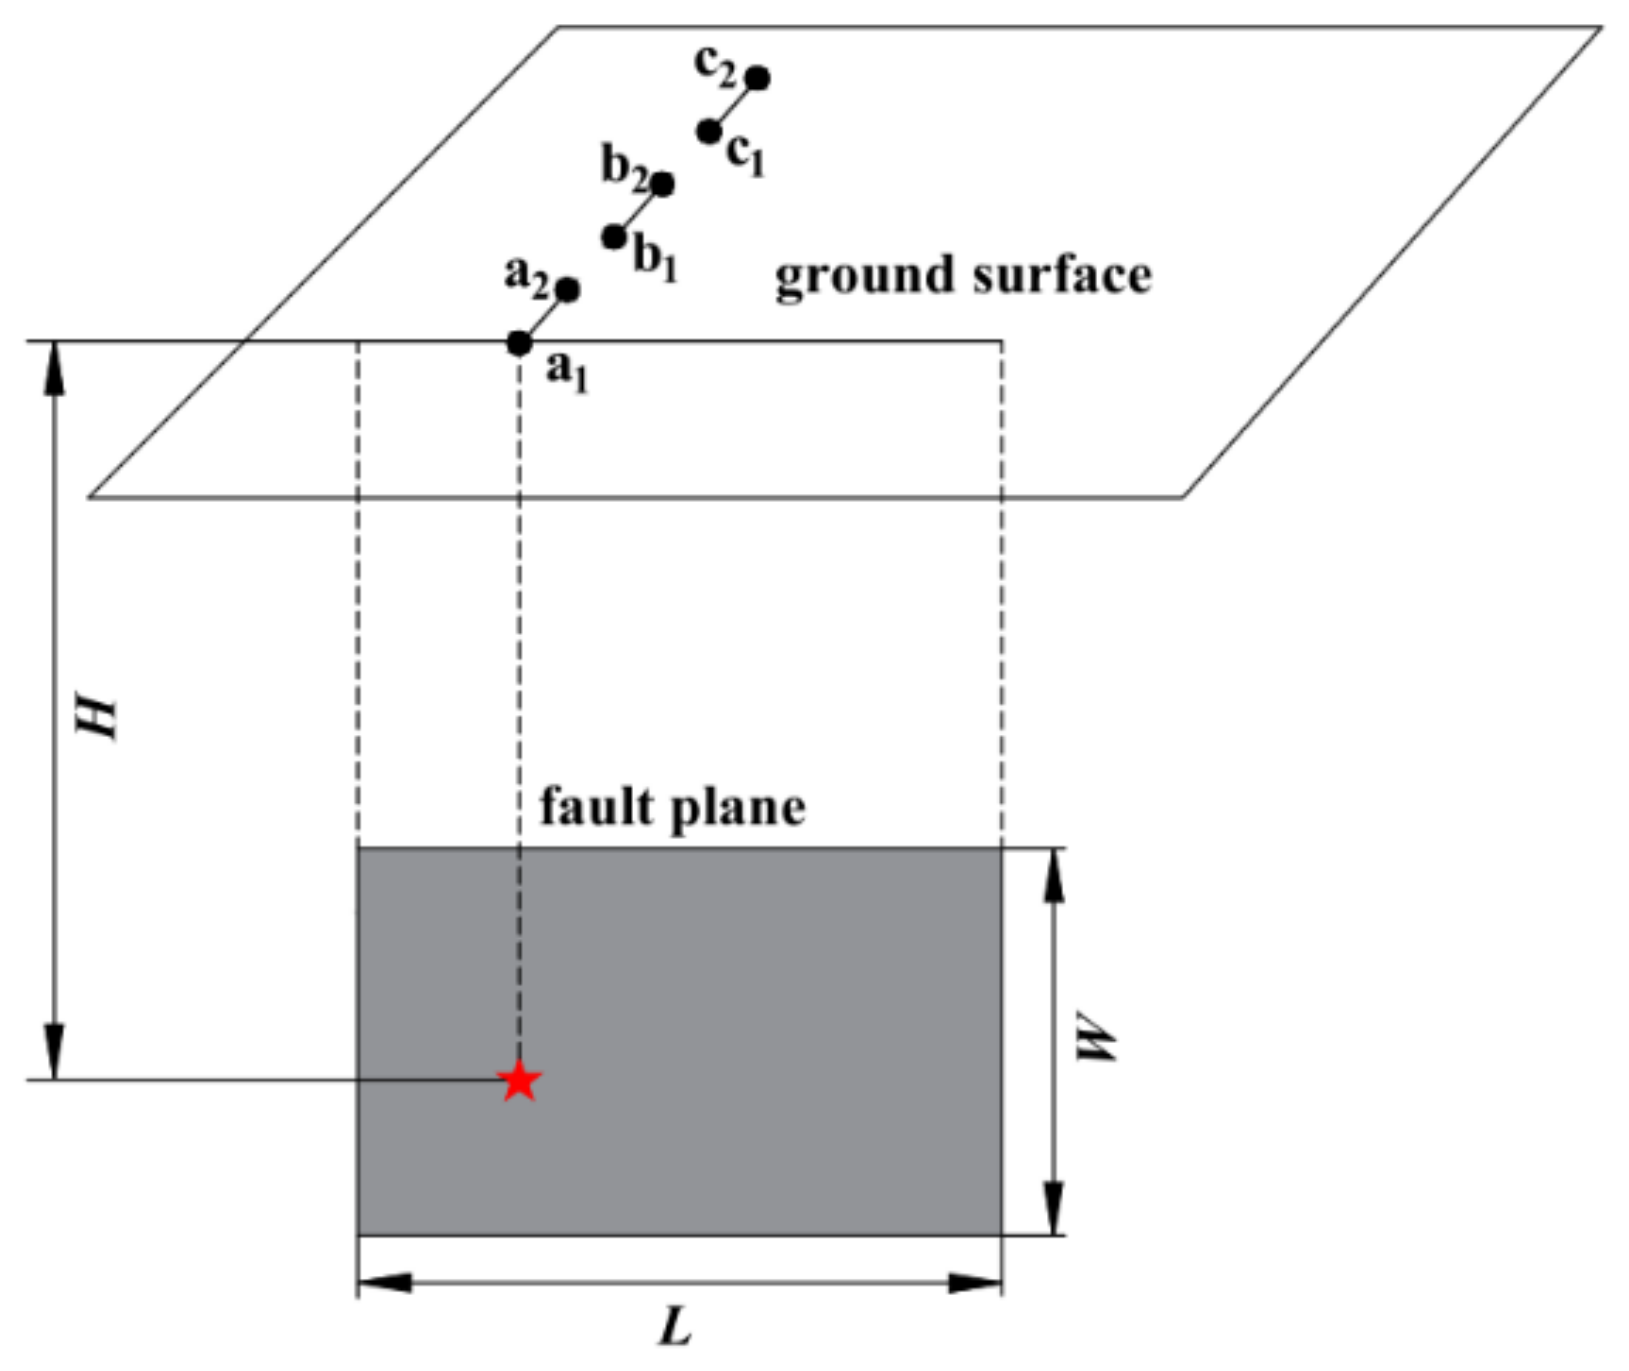
Figure 1. The calculation model of the fault and site pairs.
Sustainability 14 01989 g001
Figure 2. 1D velocity structure model used for deterministic physics-based simulations.
Sustainability 14 01989 g002
Figure 3. Parallel and perpendicular fault components of simulated ground motions at six sites for the focal mechanism scenario: strike, 0°; dip, 30°; and rake, 0°. (a,c,e) for the accelerograms of parallel fault components. (b,d,f) for the accelerograms of perpendicular fault components.
Sustainability 14 01989 g003
Figure 4. Variation of coherencies of simulated ground motions at site pairs for focal mechanism scenario: strike, 0°; dip, 30°; and rake, 0°. (a,d) for the coherencies at the site pair; a1–a2. (b,e) for the coherencies at the site pair, b1–b2; (c,f) for the coherencies at the site pair, c1–c2. (ac) for the scenarios of parallel fault components; (df) for the scenarios of perpendicular fault components.
Sustainability 14 01989 g004
Figure 5. Calculated and fitted coherencies of the perpendicular fault component for the focal mechanism scenario: strike, 0°; dip, 45°; and rake, 0°.
Sustainability 14 01989 g005
Figure 6. Fitted coherencies of parallel and perpendicular fault components for various selected focal mechanism scenarios for the site pair, b1–b2. (a,b) for scenarios where the fault rakes were 0°. (c,d) for scenarios where the fault rakes were 90°.
Sustainability 14 01989 g006
Figure 7. Fitted coherencies of parallel and perpendicular fault components for various selected focal mechanism scenarios at the site pair b1–b2. (a,b) for scenarios where the fault strikes are parallel to the site pair. (c,d) for scenarios where the fault strikes are perpendicular to the site pair.
Sustainability 14 01989 g007
Figure 8. Histograms and fitted probability distributions of a and b for the parallel and perpendicular fault components of simulated ground motions. (a,c) for distributions of a. (b,d) for distributions of b.
Sustainability 14 01989 g008
Figure 9. Variations in parameters, a and b, with the increasing strikes and fitted curves for the site pairs for the parallel fault components of simulated ground motions for various dips. (ae) for variations in a. (fj) for variations in b.
Sustainability 14 01989 g009
Figure 10. Diagram of Equation (4).
Sustainability 14 01989 g010
Figure 11. Histogram of R-squares for all focal mechanism scenarios.
Sustainability 14 01989 g011
Figure 12. Histogram of SSEs for all focal mechanism scenarios.
Sustainability 14 01989 g012
Figure 13. Comparison of the proposed coherency model with existing models. Shaded areas represent the simulated ground motions. FPa denotes the parallel faut components of the simulated ground motions; FPe denotes the perpendicular fault components of the simulated ground motions. (ad) for the 200m scenarios. (eh) for the 400 m scenarios [11,14,16,18,22,23,44].
Sustainability 14 01989 g013
Table 1. Assigned probability distribution parameters of a and b for parallel and perpendicular fault components of simulated ground motions.
Horizontal Components of Simulated Ground Motions
Parallel FaultPerpendicular Fault
Fitted DistributionDistribution Parameters 1Distribution BoundsDistribution Parameters 1Distribution Bounds
anormalμ = 0.1768, σ = 0.06117(0.05,0.33)μ = 0.1804, σ = 0.059(0.05, 0.3)
bbetaα = 3.16549, β = 5374.2296(0.00004,0.002)α = 1.92026, β = 2937.6033(0, 0.0024)
1 μ and σ are the mean and the standard deviation of the normal distribution; α and β are beta distribution parameters.
Table 2. Regression coefficients in Equation (5) for parallel and perpendicular fault components of simulated ground motions for rakes of 0° and 90°.
Rake (°)Components of Simulated Ground Motions Pλ1λ2λ3
0Parallel fault am0.00020.02180.0903
c−0.00260.01990.2579
q−0.1600−1.9400195.0000
k−0.6570−0.7500397.0000
n0.00150.02840.0135
t0.01570.00000.7730
bm0.00000.00020.0002
c0.0249−1.46120.797
q−0.3390−0.2500210.0000
k−0.147015.1000367.0000
n0.0000−0.00010.0005
t0.00930.00000.7390
Perpendicular faultam−0.00010.00620.0980
c0.0005−0.07350.0768
q−0.0065−0.8750181.0000
k0.0710−2.5600366.0000
n0.00000.03980.0982
t0.00000.00001.1700
bm0.00000.00030.0002
c−0.0106−1.33162.4462
q0.20802.5000167.0000
k−0.206033.4000367.0000
n0.0000−0.00010.0005
t−0.00050.00001.4100
90Parallel fault am0.00060.00250.0745
c0.0018−0.00390.0376
q0.0805−2.3800180.0000
k0.1690−2.0000355.0000
n0.00020.05790.0584
t0.00260.00001.2400
bm0.00000.00030.0001
c0.0145−1.67511.445
q0.05212.3100175.0000
k0.197035.6000339.0000
n0.00000.00000.0006
t−0.00180.00001.4100
Perpendicular faultam−0.00020.04190.1260
c0.0041−0.43420.4244
q−0.29900.6250205.0000
k0.094510.7000358.0000
n0.00010.01490.0527
t0.00330.00000.9050
bm0.00000.00010.0001
c−0.0126−0.20281.2409
q−0.0973−4.3800198.0000
k0.521016.2000319.0000
n0.00000.00000.0004
t0.00640.00000.8420
Publisher’s Note: MDPI stays neutral with regard to jurisdictional claims in published maps and institutional affiliations.