
Identification and Characterization of Supply Chain Operational Risk Profiles in Manufacturing Companies


Abstract
:1. Introduction
2. Literature Review
2.1. Supply Chain Risk
2.2. Supply Chain Integration
2.3. Operational Performance
2.4. Interactions between Risk, Integration, and Performance in Supply Chains
3. Objectives and Methodology
3.1. Measurement of Constructs
3.2. Data Collection: High Performance Manufacturing Project
4. Results
5. Discussion
6. A Guiding Framework for Empirical Investigation
7. Implications
7.1. Theoretical Implications
7.2. Practical Implications
8. Conclusion and Limitations
Author Contributions
Funding
Institutional Review Board Statement
Informed Consent Statement
Data Availability Statement
Conflicts of Interest
References
- Manuj, I.; Mentzer, J.T. Global Supply Chain Risk Management. J. Bus. Logist. 2008, 29, 133–155. [Google Scholar] [CrossRef]
- Ho, W.; Zheng, T.; Yildiz, H.; Talluri, S. Supply chain risk management: A literature review. Int. J. Prod. Res. 2015, 53, 5031–5069. [Google Scholar] [CrossRef]
- Macdonald, J.R.; Corsi, T.M. Supply Chain Disruption Management: Severe Events, Recovery, and Performance. J. Bus. Logist. 2013, 34, 270–288. [Google Scholar] [CrossRef]
- Chen, H.L. Supply chain risk’s impact on corporate financial performance. Int. J. Oper. Prod. Manag. 2018, 38, 713–731. [Google Scholar] [CrossRef]
- Quang, H.T.; Hara, Y. Risks and performance in supply chain: The push effect. Int. J. Prod. Res. 2017, 56, 1369–1388. [Google Scholar] [CrossRef]
- Wagner, S.M.; Bode, C. An Empirical Examination of Supply Chain Performance along Several Dimensions of Risk. J. Bus. Logist. 2008, 29, 307–325. [Google Scholar] [CrossRef]
- Kilubi, I. The strategies of supply chain risk management—A synthesis and classification. Int. J. Logist. Res. Appl. 2016, 19, 604–629. [Google Scholar] [CrossRef]
- Craighead, C.W.; Blackhurst, J.; Rungtusanatham, M.J.; Handfield, R.B. The Severity of Supply Chain Disruptions: Design Characteristics and Mitigation Capabilities. Decis. Sci. 2007, 38, 131–156. [Google Scholar] [CrossRef]
- Zhao, L.; Huo, B.; Sun, L.; Zhao, X. The impact of supply chain risk on supply chain integration and company performance: A global investigation. Supply Chain Manag. Int. J. 2013, 18, 115–131. [Google Scholar] [CrossRef]
- Jajja, M.S.S.; Chatha, K.A.; Farooq, S. Impact of supply chain risk on agility performance: Mediating role of supply chain integration. Int. J. Prod. Econ. 2018, 205, 118–138. [Google Scholar] [CrossRef]
- Kauppi, K.; Longoni, A.; Caniato, F.; Kuula, M. Managing country disruption risks and improving operational performance: Risk management along integrated supply chains. Int. J. Prod. Econ. 2016, 182, 484–495. [Google Scholar] [CrossRef]
- Wiengarten, F.; Humphreys, P.; Gimenez, C.; McIvor, R. Risk, risk management practices, and the success of supply chain integration. Int. J. Prod. Econ. 2016, 171, 361–370. [Google Scholar] [CrossRef]
- Brusset, X.; Teller, C. Supply chain capabilities, risks, and resilience. Int. J. Prod. Econ. 2017, 184, 59–68. [Google Scholar] [CrossRef]
- Manuj, I.; Mentzer, J.T. Global supply chain risk management strategies. Int. J. Phys. Distrib. Logist. Manag. 2008, 38, 192–223. [Google Scholar] [CrossRef] [Green Version]
- Knemeyer, A.M.; Zinn, W.; Eroglu, C. Proactive planning for catastrophic events in supply chains. J. Oper. Manag. 2008, 27, 141–153. [Google Scholar] [CrossRef]
- Kumar Sharma, S.; Bhat, A. Supply chain risk management dimensions in Indian automobile industry: A cluster analysis approach. Bench. Int. J. 2014, 21, 1023–1040. [Google Scholar] [CrossRef]
- Caniato, F.; Golini, R.; Kalchschmidt, M.G.M. The effect of global supply chain configuration on the relationship between supply chain improvement programs and performance. Int. J. Prod. Econ. 2013, 143, 285–293. [Google Scholar] [CrossRef]
- Tang, C.S. Perspectives in supply chain risk management. Int. J. Prod. Econ. 2006, 103, 451–488. [Google Scholar] [CrossRef]
- Wu, T.; Blackhurst, J.; Chidambaram, V. A model for inbound supply risk analysis. Comput. Ind. 2006, 57, 350–365. [Google Scholar] [CrossRef]
- Tian, Q.; Guo, W. Reconfiguration of manufacturing supply chains considering outsourcing decisions and supply chain risks. J. Manuf. Syst. 2019, 52, 217–226. [Google Scholar] [CrossRef]
- Asgary, A.; Ozdemir, A.I.; Özyürek, H. Small and Medium Enterprises and Global Risks: Evidence from Manufacturing SMEs in Turkey. Int. J. Disaster Risk Sci. 2020, 11, 59–73. [Google Scholar] [CrossRef] [Green Version]
- Ethirajan, M.; Arasu, M.T.; Kandasamy, J.; Kek, V.; Nadeem, S.P.; Kumar, A. Analysing the risks of adopting circular economy initiatives in manufacturing supply chains. Bus. Strateg. Environ. 2021, 30, 204–236. [Google Scholar] [CrossRef]
- Shishodia, A.; Sharma, R.; Rajesh, R.; Munim, Z.H. Supply chain resilience: A review, conceptual framework and future research. Int. J. Logist. Manag. 2021. [Google Scholar] [CrossRef]
- Rajesh, R. A novel advanced grey incidence analysis for investigating the level of resilience in supply chains. Ann. Oper. Res. 2020, 308, 441–490. [Google Scholar] [CrossRef]
- Byrne, P.M. Impact and ubiquity: Two reasons to proactively manage risk. Logist. Manag. 2007, 46, 24–25. [Google Scholar]
- Fabbe-Costes, N.; Jahre, M. Supply chain integration and performance: A review of the evidence. Int. J. Logist. Manag. 2008, 19, 130–154. [Google Scholar] [CrossRef]
- Pagell, M. Understanding the factors that enable and inhibit the integration of operations, purchasing and logistics. J. Oper. Manag. 2004, 22, 459–487. [Google Scholar] [CrossRef]
- Kim, Y.H.; Schoenherr, T. The Effects of Supply Chain Integration on the Cost Efficiency of Contract Manufacturing. J. Supply Chain Manag. 2018, 54, 42–64. [Google Scholar] [CrossRef]
- Flynn, B.B.; Huo, B.; Zhao, X. The impact of supply chain integration on performance: A contingency and configuration approach. J. Oper. Manag. 2010, 28, 58–71. [Google Scholar] [CrossRef]
- Swink, M.; Narasimhan, R.; Wang, C. Managing beyond the factory walls: Effects of four types of strategic integration on manufacturing plant performance. J. Oper. Manag. 2006, 25, 148–164. [Google Scholar] [CrossRef]
- Lai, K.-H.; Wong, C.W.; Cheng, T. Bundling digitized logistics activities and its performance implications. Ind. Mark. Manag. 2010, 39, 273–286. [Google Scholar] [CrossRef]
- Chen, I.J.; Paulraj, A. Towards a theory of supply chain management: The constructs and measurements. J. Oper. Manag. 2004, 22, 119–150. [Google Scholar] [CrossRef]
- Kim, S.W. An investigation on the direct and indirect effect of supply chain integration on firm performance. Int. J. Prod. Econ. 2009, 119, 328–346. [Google Scholar] [CrossRef]
- Mishra, D.; Sharma, R.; Kumar, S.; Dubey, R. Bridging and buffering: Strategies for mitigating supply risk and improving supply chain performance. Int. J. Prod. Econ. 2016, 180, 183–197. [Google Scholar] [CrossRef]
- Wong, C.Y.; Boon-Itt, S. The influence of institutional norms and environmental uncertainty on supply chain integration in the Thai automotive industry. Int. J. Prod. Econ. 2008, 115, 400–410. [Google Scholar] [CrossRef]
- Zhao, G.; Feng, T.; Wang, D. Is more supply chain integration always beneficial to financial performance? Ind. Mark. Manag. 2015, 45, 162–172. [Google Scholar] [CrossRef]
- Qi, Y.; Huo, B.; Wang, Z.; Yeung, H.Y.J. The impact of operations and supply chain strategies on integration and performance. Int. J. Prod. Econ. 2017, 185, 162–174. [Google Scholar] [CrossRef]
- Vanalle, R.M.; Lucato, W.C.; Ganga, G.M.D.; Alves Filho, A.G. Risk management in the automotive supply chain: An exploratory study in Brazil. Int. J. Prod. Res. 2019, 58, 783–799. [Google Scholar] [CrossRef]
- Talluri, S.; Narasimhan, R.; Nair, A. Vendor performance with supply risk: A chance-constrained DEA approach. Int. J. Prod. Econ. 2006, 100, 212–222. [Google Scholar] [CrossRef]
- Wagner, S.; Neshat, N. Assessing the vulnerability of supply chains using graph theory. Int. J. Prod. Econ. 2010, 126, 121–129. [Google Scholar] [CrossRef]
- Tsai, M.; Liao, C.; Han, C. Risk perception on logistics outsourcing of retail chains: Model development and empirical veri-fication in Taiwan. Supply Chain Manag. Int. J. 2008, 13, 415–424. [Google Scholar] [CrossRef]
- Johnson, N.; Elliott, D.; Drake, P. Exploring the role of social capital in facilitating supply chain resilience. Supply Chain Manag. Int. J. 2013, 18, 324–336. [Google Scholar] [CrossRef]
- Alcaide-Muñoz, C.; Pintado, A.B.; De Cerio, J.M.-D. Manufacturing strategy process: The role of shop-floor communication. Manag. Decis. 2018, 56, 1581–1597. [Google Scholar] [CrossRef]
- Tuncel, G.; Alpan, G. Risk assessment and management for supply chain networks: A case study. Comput. Ind. 2010, 61, 250–259. [Google Scholar] [CrossRef]
- Gaudenzi, B.; Borghesi, A. Managing risks in the supply chain using the AHP method. Int. J. Logist. Manag. 2006, 17, 114–136. [Google Scholar] [CrossRef]
- Naor, M.; Linderman, K.; Schroeder, R. The globalization of operations in Eastern and Western countries: Unpacking the relationship between national and organizational culture and its impact on manufacturing performance. J. Oper. Manag. 2009, 28, 194–205. [Google Scholar] [CrossRef]
- Morita, M.; Machuca, J.A.D.; Pérez Díez de los Ríos, J.L. Integration of product development capability and supply chain capability: The driver for high performance adaptation. Int. J. Prod. Econ. 2018, 200, 68–82. [Google Scholar] [CrossRef]
- Alfalla-Luque, R.; Machuca, J.A.; Marin-Garcia, J.A. Triple-A and competitive advantage in supply chains: Empirical research in developed countries. Int. J. Prod. Econ. 2018, 203, 48–61. [Google Scholar] [CrossRef]
- Arend, R.J.; Wisner, J.D. Small business and supply chain management: Is there a fit? J. Bus. Ventur. 2005, 20, 403–436. [Google Scholar] [CrossRef]
- Crum, M.; Nelson, T.; de Borst, J.; Byrnes, P. The use of cluster analysis in entrepreneurship research: Review of past research and future directions. J. Small Bus. Manag. 2020, 1–40. [Google Scholar] [CrossRef]
- Jain, A.K. Data clustering: 50 years beyond K-means. Pattern Recognit. Lett. 2009, 31, 651–666. [Google Scholar] [CrossRef]
- European Commission. User Guide to the SME Definition; Publications Office of the European Union: Luxembourg, 2015. [Google Scholar]
- Gligor, D.M.; Holcomb, M.C.; Feizabadi, J. An exploration of the strategic antecedents of firm supply chain agility: The role of a firm’s orientations. Int. J. Prod. Econ. 2016, 179, 24–34. [Google Scholar] [CrossRef]
- Cheng, Y.; Chaudhuri, A.; Farooq, S. Interplant coordination, supply chain integration, and operational performance of a plant in a manufacturing network: A mediation analysis. Supply Chain Manag. An Int. J. 2016, 21, 550–568. [Google Scholar] [CrossRef]
- Chen, J.; Sohal, A.S.; Prajogo, D. Supply chain operational risk mitigation: A collaborative approach. Int. J. Prod. Res. 2013, 51, 2186–2199. [Google Scholar] [CrossRef]
- McNally, R.C.; Griffin, A. A measure and initial test of managers’ perceptions of relationship marketing in inter-organizational exchanges. J. Acad. Mark. Sci. 2007, 35, 382–397. [Google Scholar] [CrossRef]
- Choi, K.; Narasimhan, R.; Kim, S.W. Postponement strategy for international transfer of products in a global supply chain: A system dynamics examination. J. Oper. Manag. 2012, 30, 167–179. [Google Scholar] [CrossRef]
- Lau, A.K.W.; Tang, E.; Yam, R.C.M. Effects of Supplier and Customer Integration on Product Innovation and Performance: Empirical Evidence in Hong Kong Manufacturers. J. Prod. Innov. Manag. 2010, 27, 761–777. [Google Scholar] [CrossRef]
- Chaudhuri, A.; Boer, H.; Taran, Y. Supply chain integration, risk management and manufacturing flexibility. Int. J. Oper. Prod. Manag. 2018, 38, 690–712. [Google Scholar] [CrossRef] [Green Version]
- Qazi, A.; Dickson, A.; Quigley, J.; Gaudenzi, B. Supply chain risk network management: A Bayesian belief network and ex-pected utility based approach for managing supply chain risks. Int. J. Prod. Econ. 2018, 196, 24–42. [Google Scholar] [CrossRef] [Green Version]
- Macdonald, J.R.; Zobel, C.W.; Melnyk, S.A.; Griffis, S.E. Supply chain risk and resilience: Theory building through structured experiments and simulation. Int. J. Prod. Res. 2018, 56, 4337–4355. [Google Scholar] [CrossRef]
- Zsidisin, G.A.; Ellram, L.M. An agency theory investigation of supply risk management. J. Supply Chain Manag. 2003, 39, 15–27. [Google Scholar] [CrossRef]
- Hopp, W.J.; Spearman, M.L. Factory Physics; Irwin/McGraw-Hill: Boston, MA, USA, 2000. [Google Scholar]
- Cohen, M.A.; Kunreuther, H. Operations risk management: Overview of Paul Kleindorfer’s contributions. Prod. Oper. Manag. 2007, 16, 525–541. [Google Scholar] [CrossRef]
- Lee, H.L. Aligning Supply Chain Strategies with Product Uncertainties. Calif. Manag. Rev. 2002, 44, 105–119. [Google Scholar] [CrossRef]
- Paulraj, A.; Chen, I.J. Environmental Uncertainty and Strategic Supply Management: A Resource Dependence Perspective and Performance Implications. J. Supply Chain Manag. 2007, 43, 29–42. [Google Scholar] [CrossRef]
- Munir, M.; Jajja, M.S.S.; Chatha, K.A.; Farooq, S. Supply chain risk management and operational performance: The enabling role of supply chain integration. Int. J. Prod. Econ. 2020, 227, 107667. [Google Scholar] [CrossRef]
- Das, A.; Narasimhan, R.; Talluri, S. Supplier integration—Finding an optimal configuration. J. Oper. Manag. 2005, 24, 563–582. [Google Scholar] [CrossRef]
- Riley, J.M.; Klein, R.; Miller, J.; Sridharan, V. How internal integration, information sharing, and training affect supply chain risk management capabilities. Int. J. Phys. Distrib. Logist. Manag. 2016, 46, 953–980. [Google Scholar] [CrossRef]
- Teece, D.J.; Pisano, G.; Shuen, A. Dynamic capabilities and strategic management. Strateg. Manag. J. 1997, 18, 509–533. [Google Scholar] [CrossRef]
- Rosenzweig, E.D.; Roth, A.V.; Dean, J.W. The influence of an integration strategy on competitive capabilities and business performance: An exploratory study of consumer products manufacturers. J. Oper. Manag. 2003, 21, 437–456. [Google Scholar] [CrossRef]
- Sahay, B. Supply chain collaboration: The key to value creation. Work Study 2003, 52, 76–83. [Google Scholar] [CrossRef]
- Hu, W.; Shou, Y.; Kang, M.; Park, Y. Risk management of manufacturing multinational corporations: The moderating effects of international asset dispersion and supply chain integration. Supply Chain Manag. Int. J. 2019, 25, 61–76. [Google Scholar] [CrossRef]
- Meznar, M.B.; Nigh, D. Buffer or bridge? Environmental and organizational determinants of public affairs activities in American firms. Acad. Manag. J. 1995, 38, 975–996. [Google Scholar]
- Bode, C.; Wagner, S.; Petersen, K.; Ellram, L.M. Understanding Responses to Supply Chain Disruptions: Insights from Information Processing and Resource Dependence Perspectives. Acad. Manag. J. 2011, 54, 833–856. [Google Scholar] [CrossRef]
- Lee, H. The triple-A supply chain. Harv. Bus. Rev. 2004, 82, 102–113. [Google Scholar] [PubMed]
- Childerhouse, P.; Towill, D.R. Arcs of supply chain integration. Int. J. Prod. Res. 2011, 49, 7441–7468. [Google Scholar] [CrossRef]

| Construct | Items from Literature | Items from HPM Project | References |
|---|---|---|---|
| Supply risk (reversed scale) | Supplier opportunism | Our suppliers fairly treat us in making important decisions. | [1] |
| Late delivery | Our suppliers deliver to us on a just-in-time basis. | [39] | |
| Small supply base | Our supply base is quite small, compared with our competitors. | [40] | |
| Different business vision, style, and bureaucracy degree between the two parties result in cost increase | Partners understand our goals for supply chain management. | [41] | |
| Supplier incapability | Partners understand that we expect them to continuously improve their supply chain operations. | [42] | |
| Manufacturing risk (reversed scale) | Strategy-related manufacturing risk | Manufacturing strategy is not effectively implemented. | [43] |
| Human-related manufacturing risk | Operators detect and treat abnormal operating conditions of equipment. | [44] | |
| Technology/Equipment-related manufacturing risk | There is no substitute for our production technology. | [44] | |
| Demand risk (reversed scale) | The number of not-on-time deliveries represents potential future delays | We always deliver on time to our customers. | [45] |
| Sudden production stoppages | We can adapt our production schedule to sudden production stoppages by our customers. | [19] | |
| Deficient customer linkage and attraction | Our customers are connected to us by JIT systems. | [44] | |
| Unreliable demand information | Our customers provide us with valuable information on product innovation. | [35] |
| Construct | Items from Literature | Items from HPM Project | References |
|---|---|---|---|
| Supplier integration | Product integration Process integration Information integration Strategic integration | Our suppliers are provided with sufficient technical assistance. Meetings are regularly held to share improvement ideas with our suppliers. Our suppliers are encouraged to continuously improve their production processes. Our suppliers are asked to invest in significant process improvement. Necessary trainings are offered to our suppliers. Our vision and supply chain policy are shared with suppliers. Assistance is provided when our suppliers try to improve their processes | [35,36,37] |
| Internal integration | Functional integration Strategic integration | Functions are well integrated in our plant. Problems between functions are easily solved. Functional coordination in our plant works well. Our business strategy is implemented without conflicts between functions. | [35,36,37] |
| Customer integration | Product integration Process integration Information integration Strategic integration | We are concerned about needs of both immediate and ultimate consumers. We understand marketing strategies of customers. We are very familiar with product characteristics of customers. We understand distribution processes of customers. | [35,36,37] |
| Operational performance | Manufacturing cost Quality On time delivery Flexibility Product launch Innovativenes Customer service | Unit cost of manufacturing | [9,33] |
| Conformance to product specifications | |||
| On time delivery performance | |||
| Flexibility to change product mix | |||
| Flexibility to change volume | |||
| On time new product launch | |||
| Product innovativeness | |||
| Customer support and service |
| Country | Industry Sector | Total | ||
|---|---|---|---|---|
| Electronics | Machinery | Automotive | ||
| Brazil | 5 | 7 | 9 | 21 |
| Germany | 6 | 13 | 9 | 28 |
| Spain | 8 | 7 | 10 | 25 |
| Israel | 21 | 5 | 0 | 26 |
| Sweden | 4 | 4 | 1 | 9 |
| Italy | 7 | 17 | 5 | 29 |
| Japan | 6 | 7 | 10 | 23 |
| China | 10 | 17 | 3 | 30 |
| Korea | 8 | 5 | 13 | 26 |
| Finland | 6 | 6 | 5 | 17 |
| Taiwan | 19 | 10 | 1 | 30 |
| United Kingdom | 4 | 5 | 4 | 13 |
| Vietnam | 10 | 7 | 9 | 26 |
| Total | 114 | 110 | 79 | 303 |
| Sum of Squares | df | Mean Square | F | Sig. | ||
|---|---|---|---|---|---|---|
| Supply risk | Between Groups | 25.213 | 2 | 12.607 | 59.580 | 0.000 |
| Within Groups | 63.477 | 300 | 0.212 | |||
| Total | 88.691 | 302 | ||||
| Manufacturing risk | Between Groups | 77.316 | 2 | 38.658 | 206.031 | 0.000 |
| Within Groups | 56.289 | 300 | 0.188 | |||
| Total | 133.605 | 302 | ||||
| Demand risk | Between Groups | 65.005 | 2 | 32.502 | 151.208 | 0.000 |
| Within Groups | 64.485 | 300 | 0.215 | |||
| Total | 129.490 | 302 |
| Sum of Squares | df | Mean Square | F | Sig. | ||
|---|---|---|---|---|---|---|
| Supplier integration | Between Groups | 11.637 | 2 | 5.819 | 20.532 | 0.000 |
| Within Groups | 85.018 | 300 | 0.283 | |||
| Total | 96.655 | 302 | ||||
| Internal integration | Between Groups | 9.518 | 2 | 4.759 | 13.411 | 0.000 |
| Within Groups | 106.452 | 300 | 0.355 | |||
| Total | 115.969 | 302 | ||||
| Customer integration | Between Groups | 12.110 | 2 | 6.055 | 18.398 | 0.000 |
| Within Groups | 98.736 | 300 | 0.329 | |||
| Total | 110.847 | 302 | ||||
| Operational performance | Between Groups | 4.322 | 2 | 2.161 | 10.534 | 0.000 |
| Within Groups | 61.537 | 300 | 0.205 | |||
| Total | 65.859 | 302 |
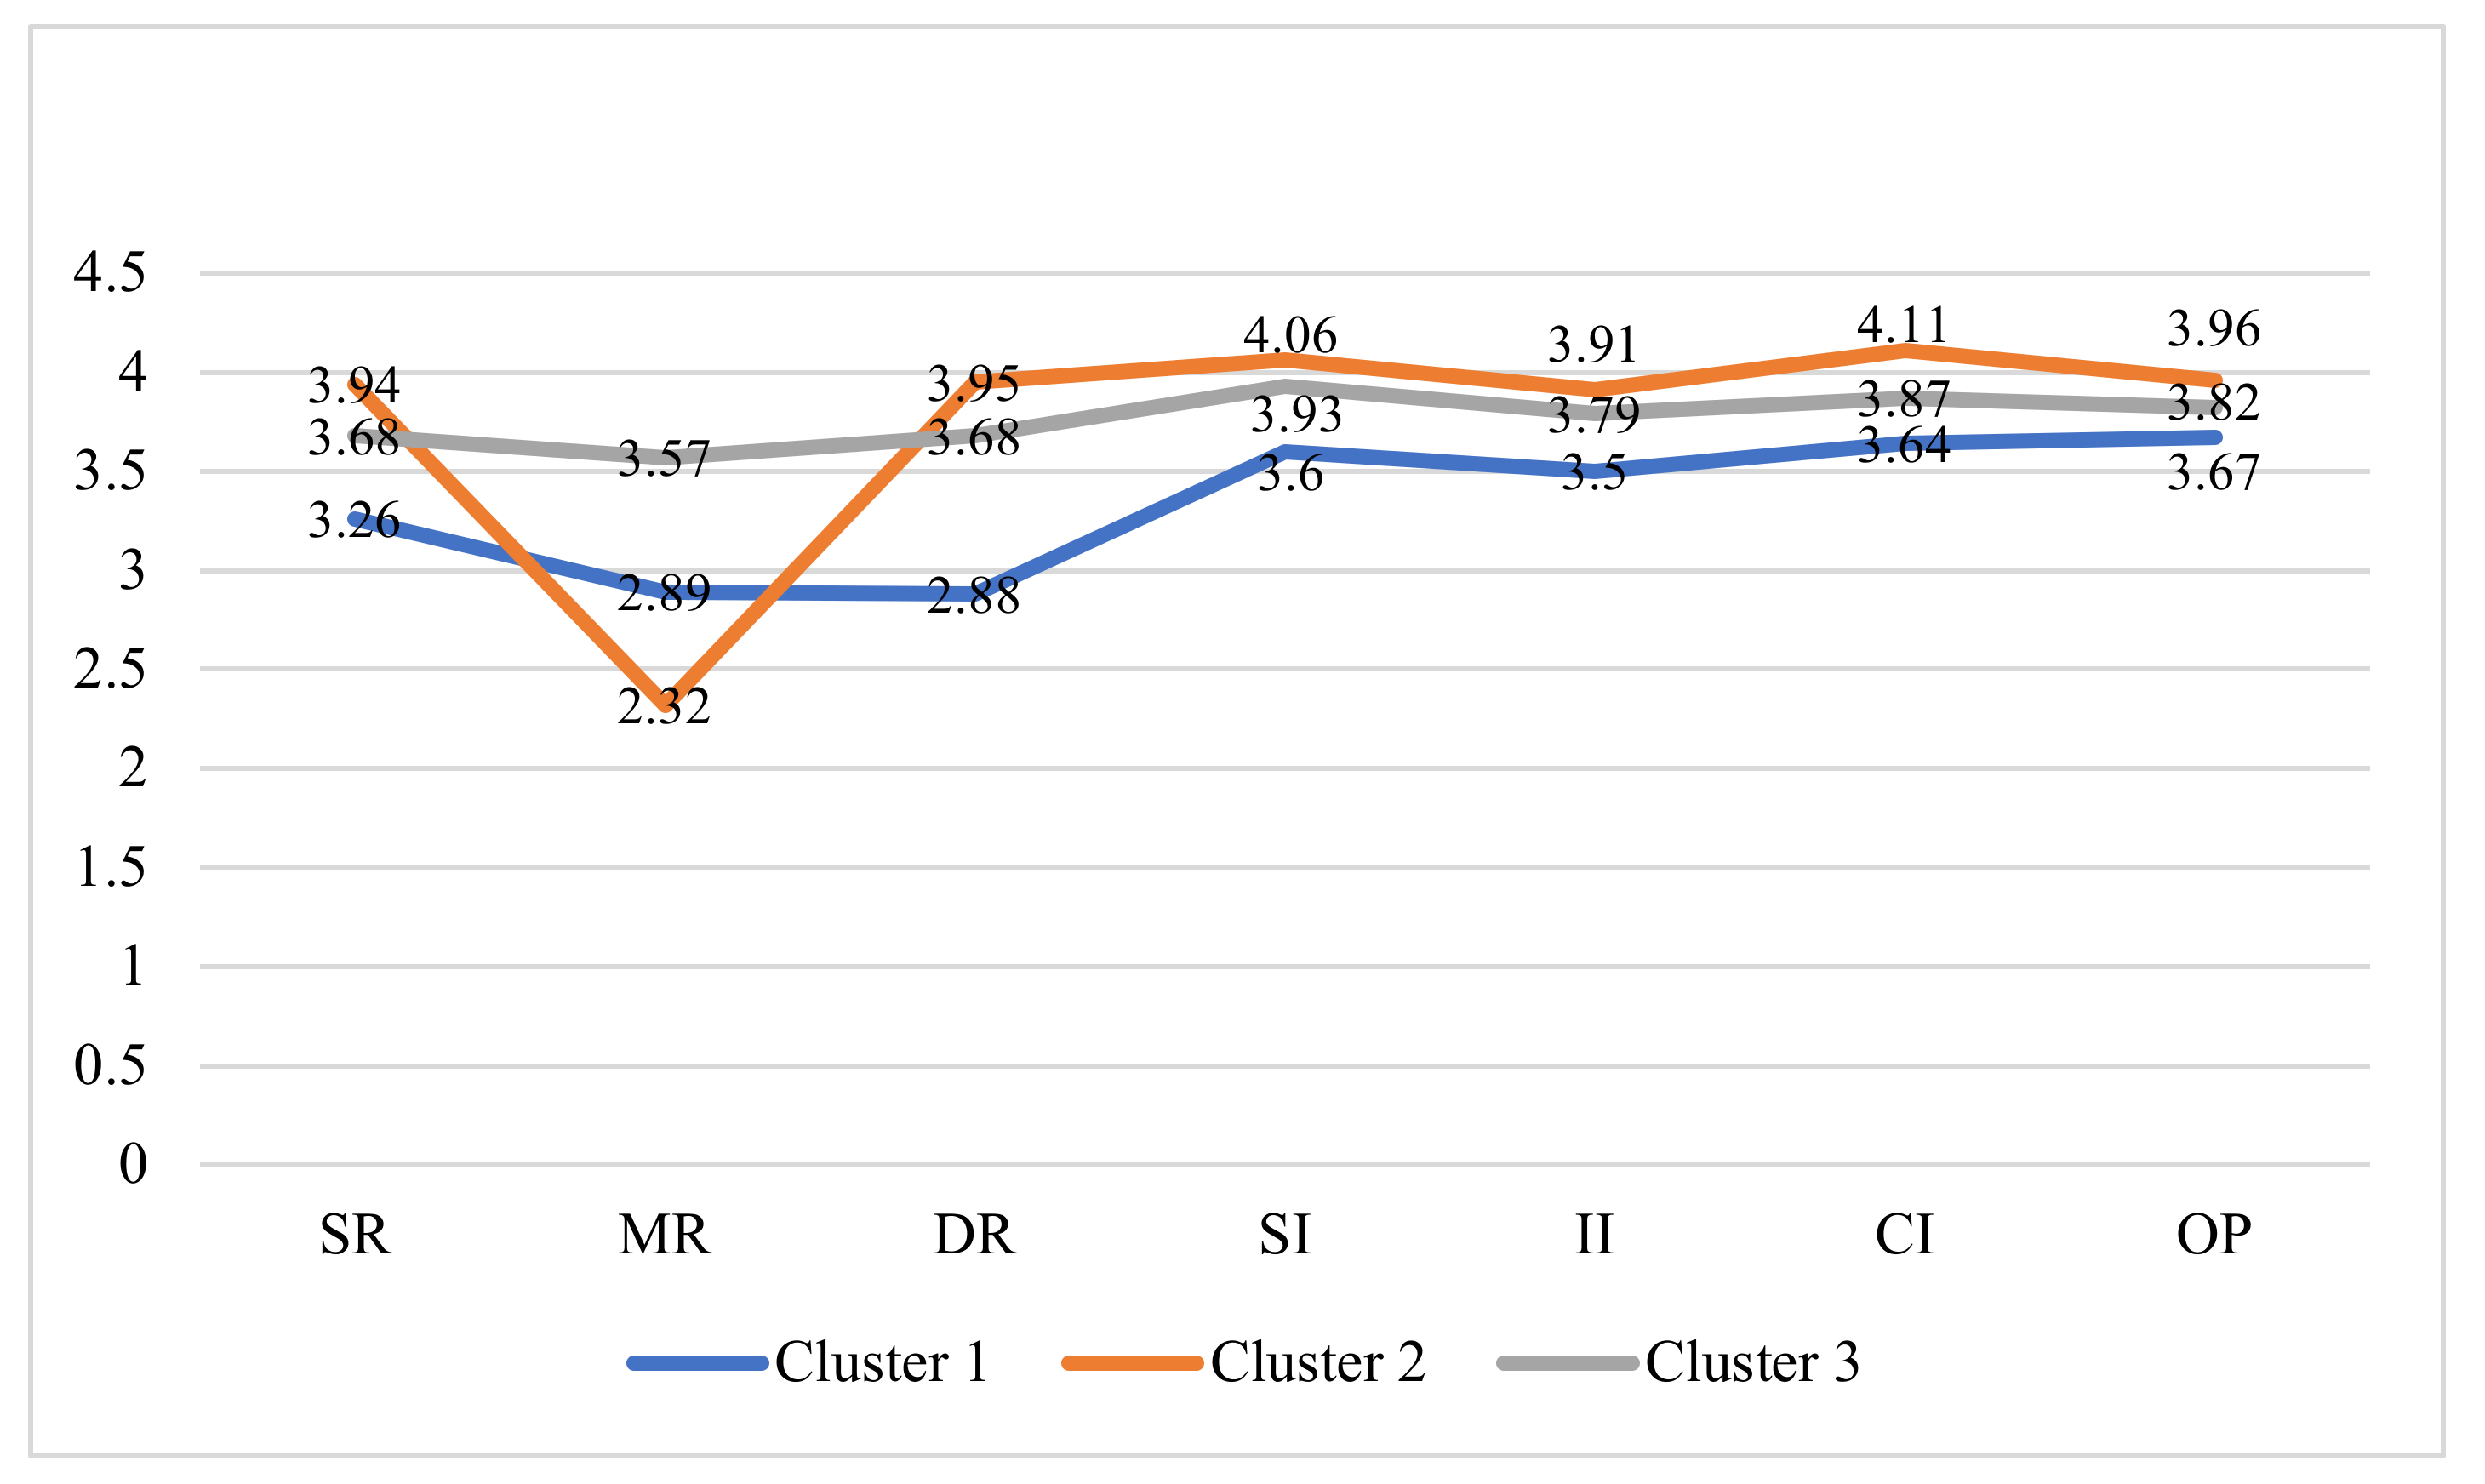
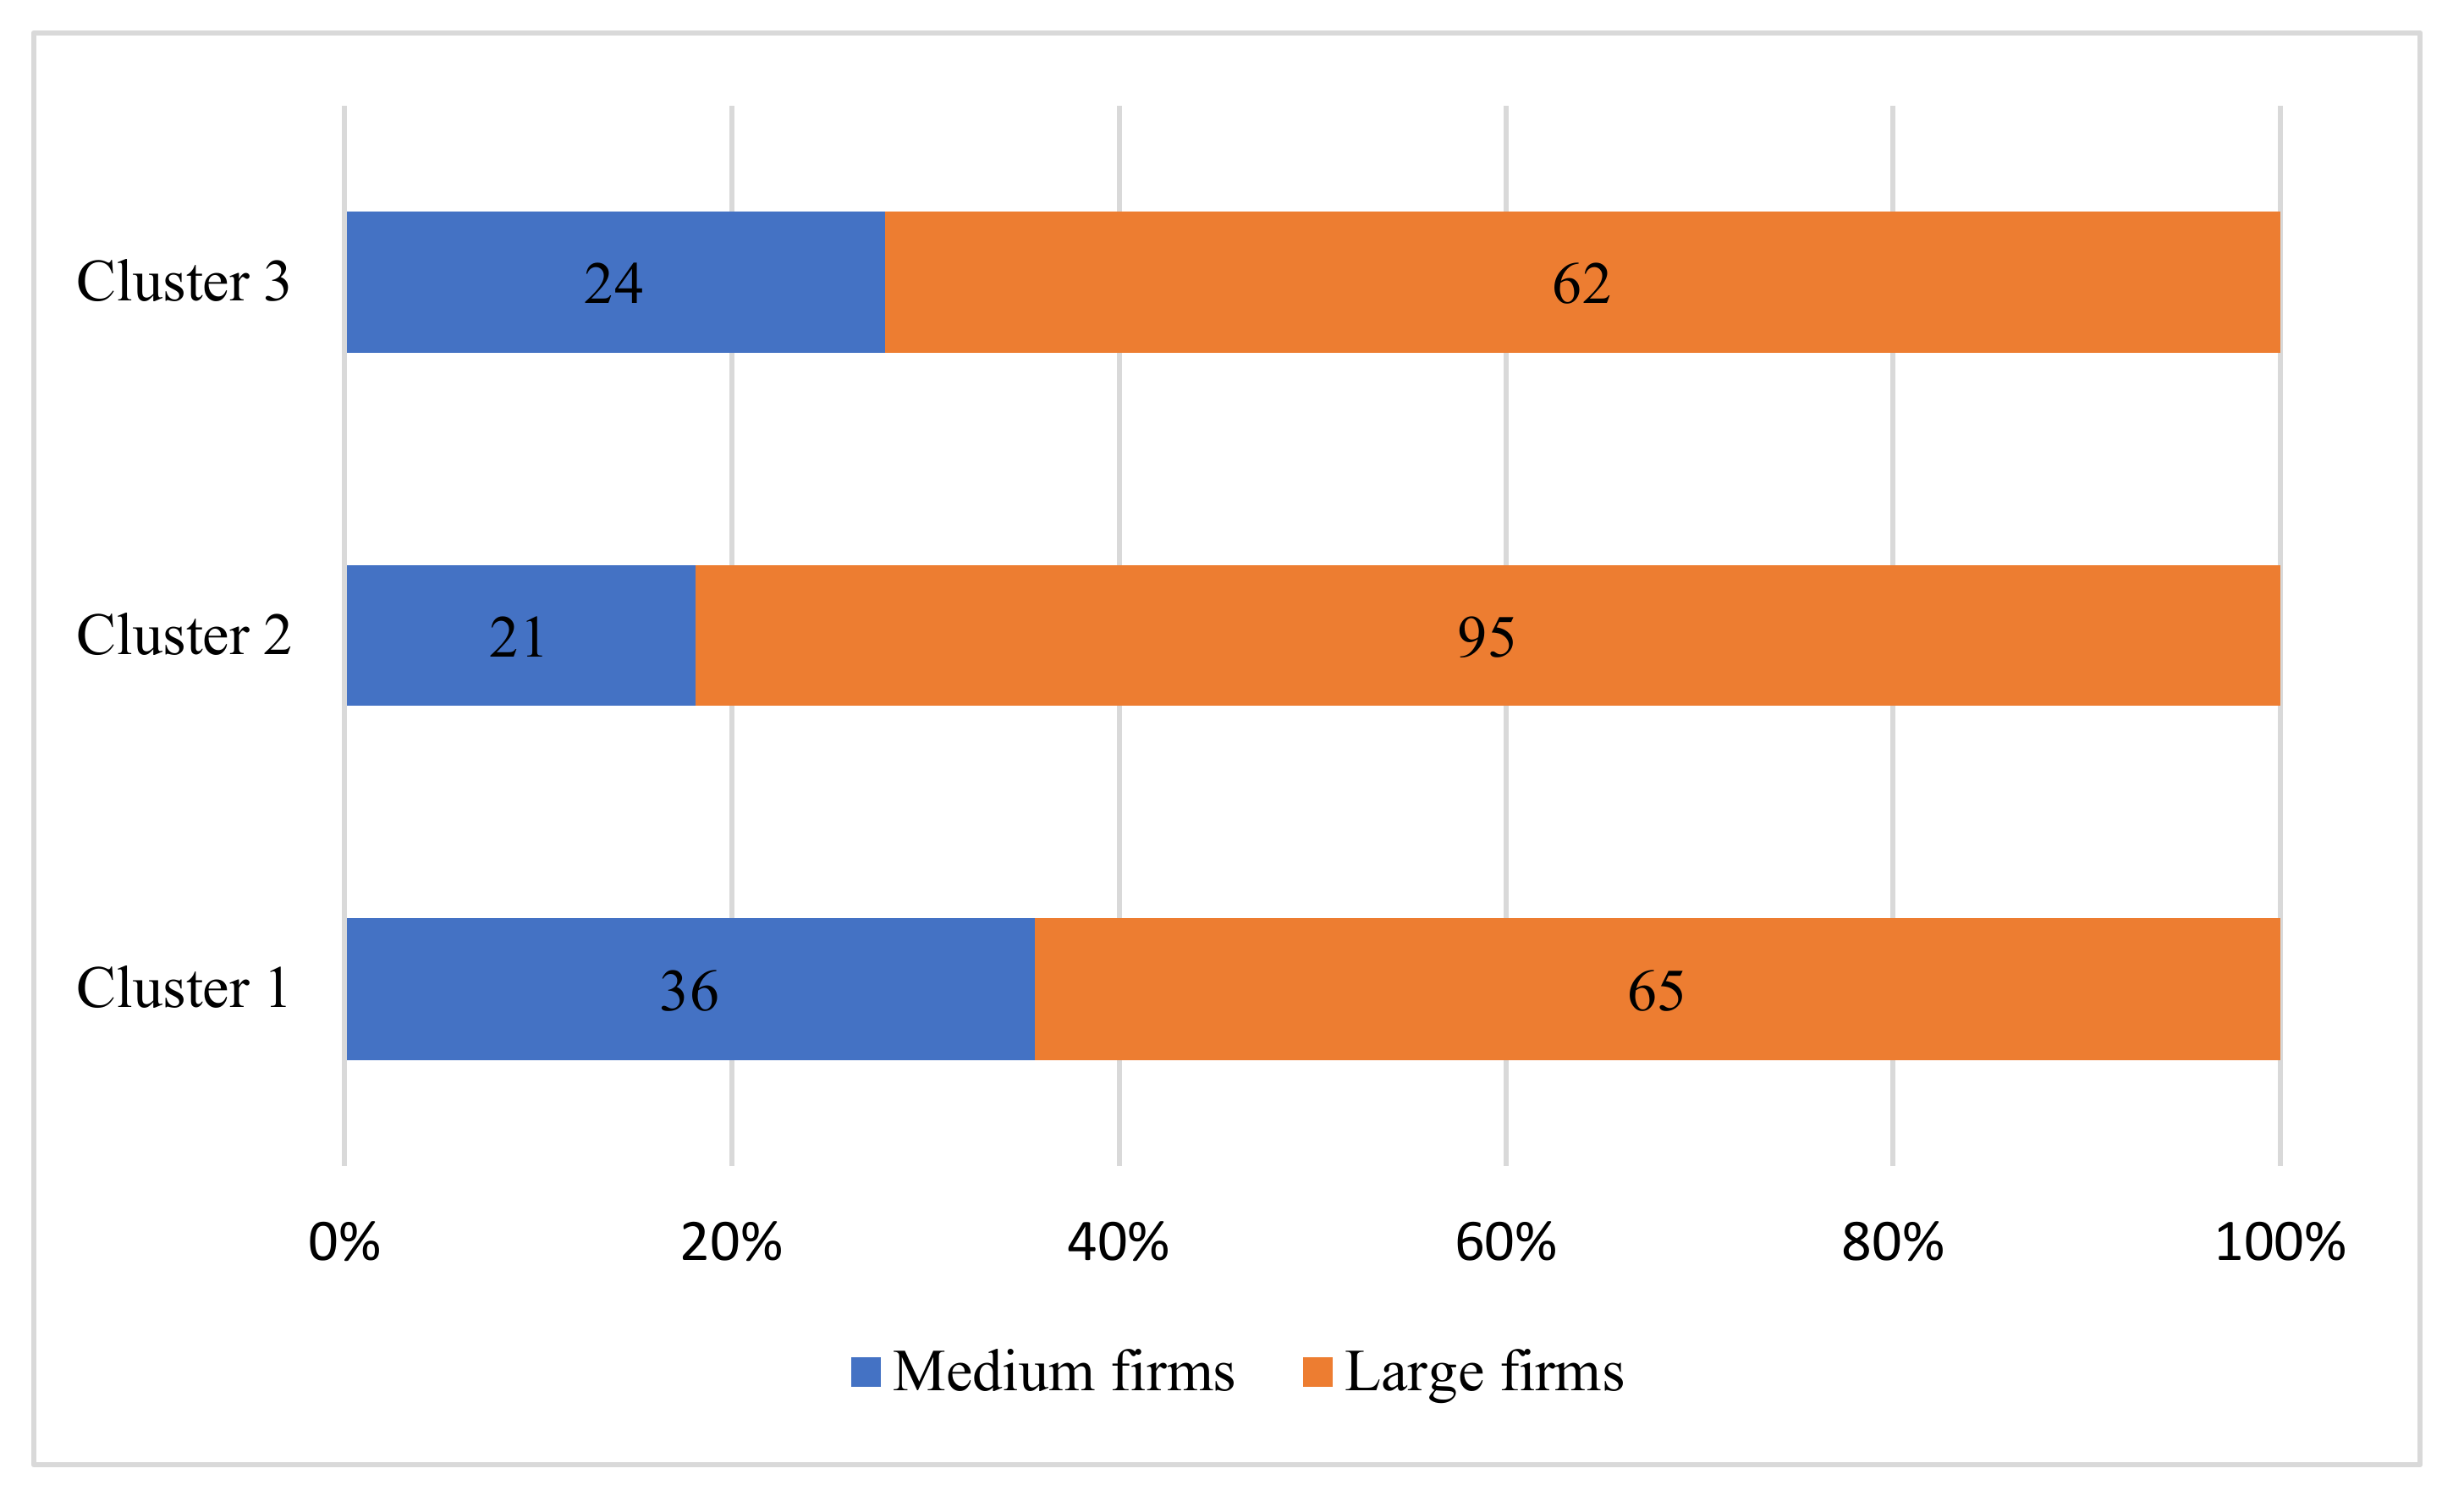
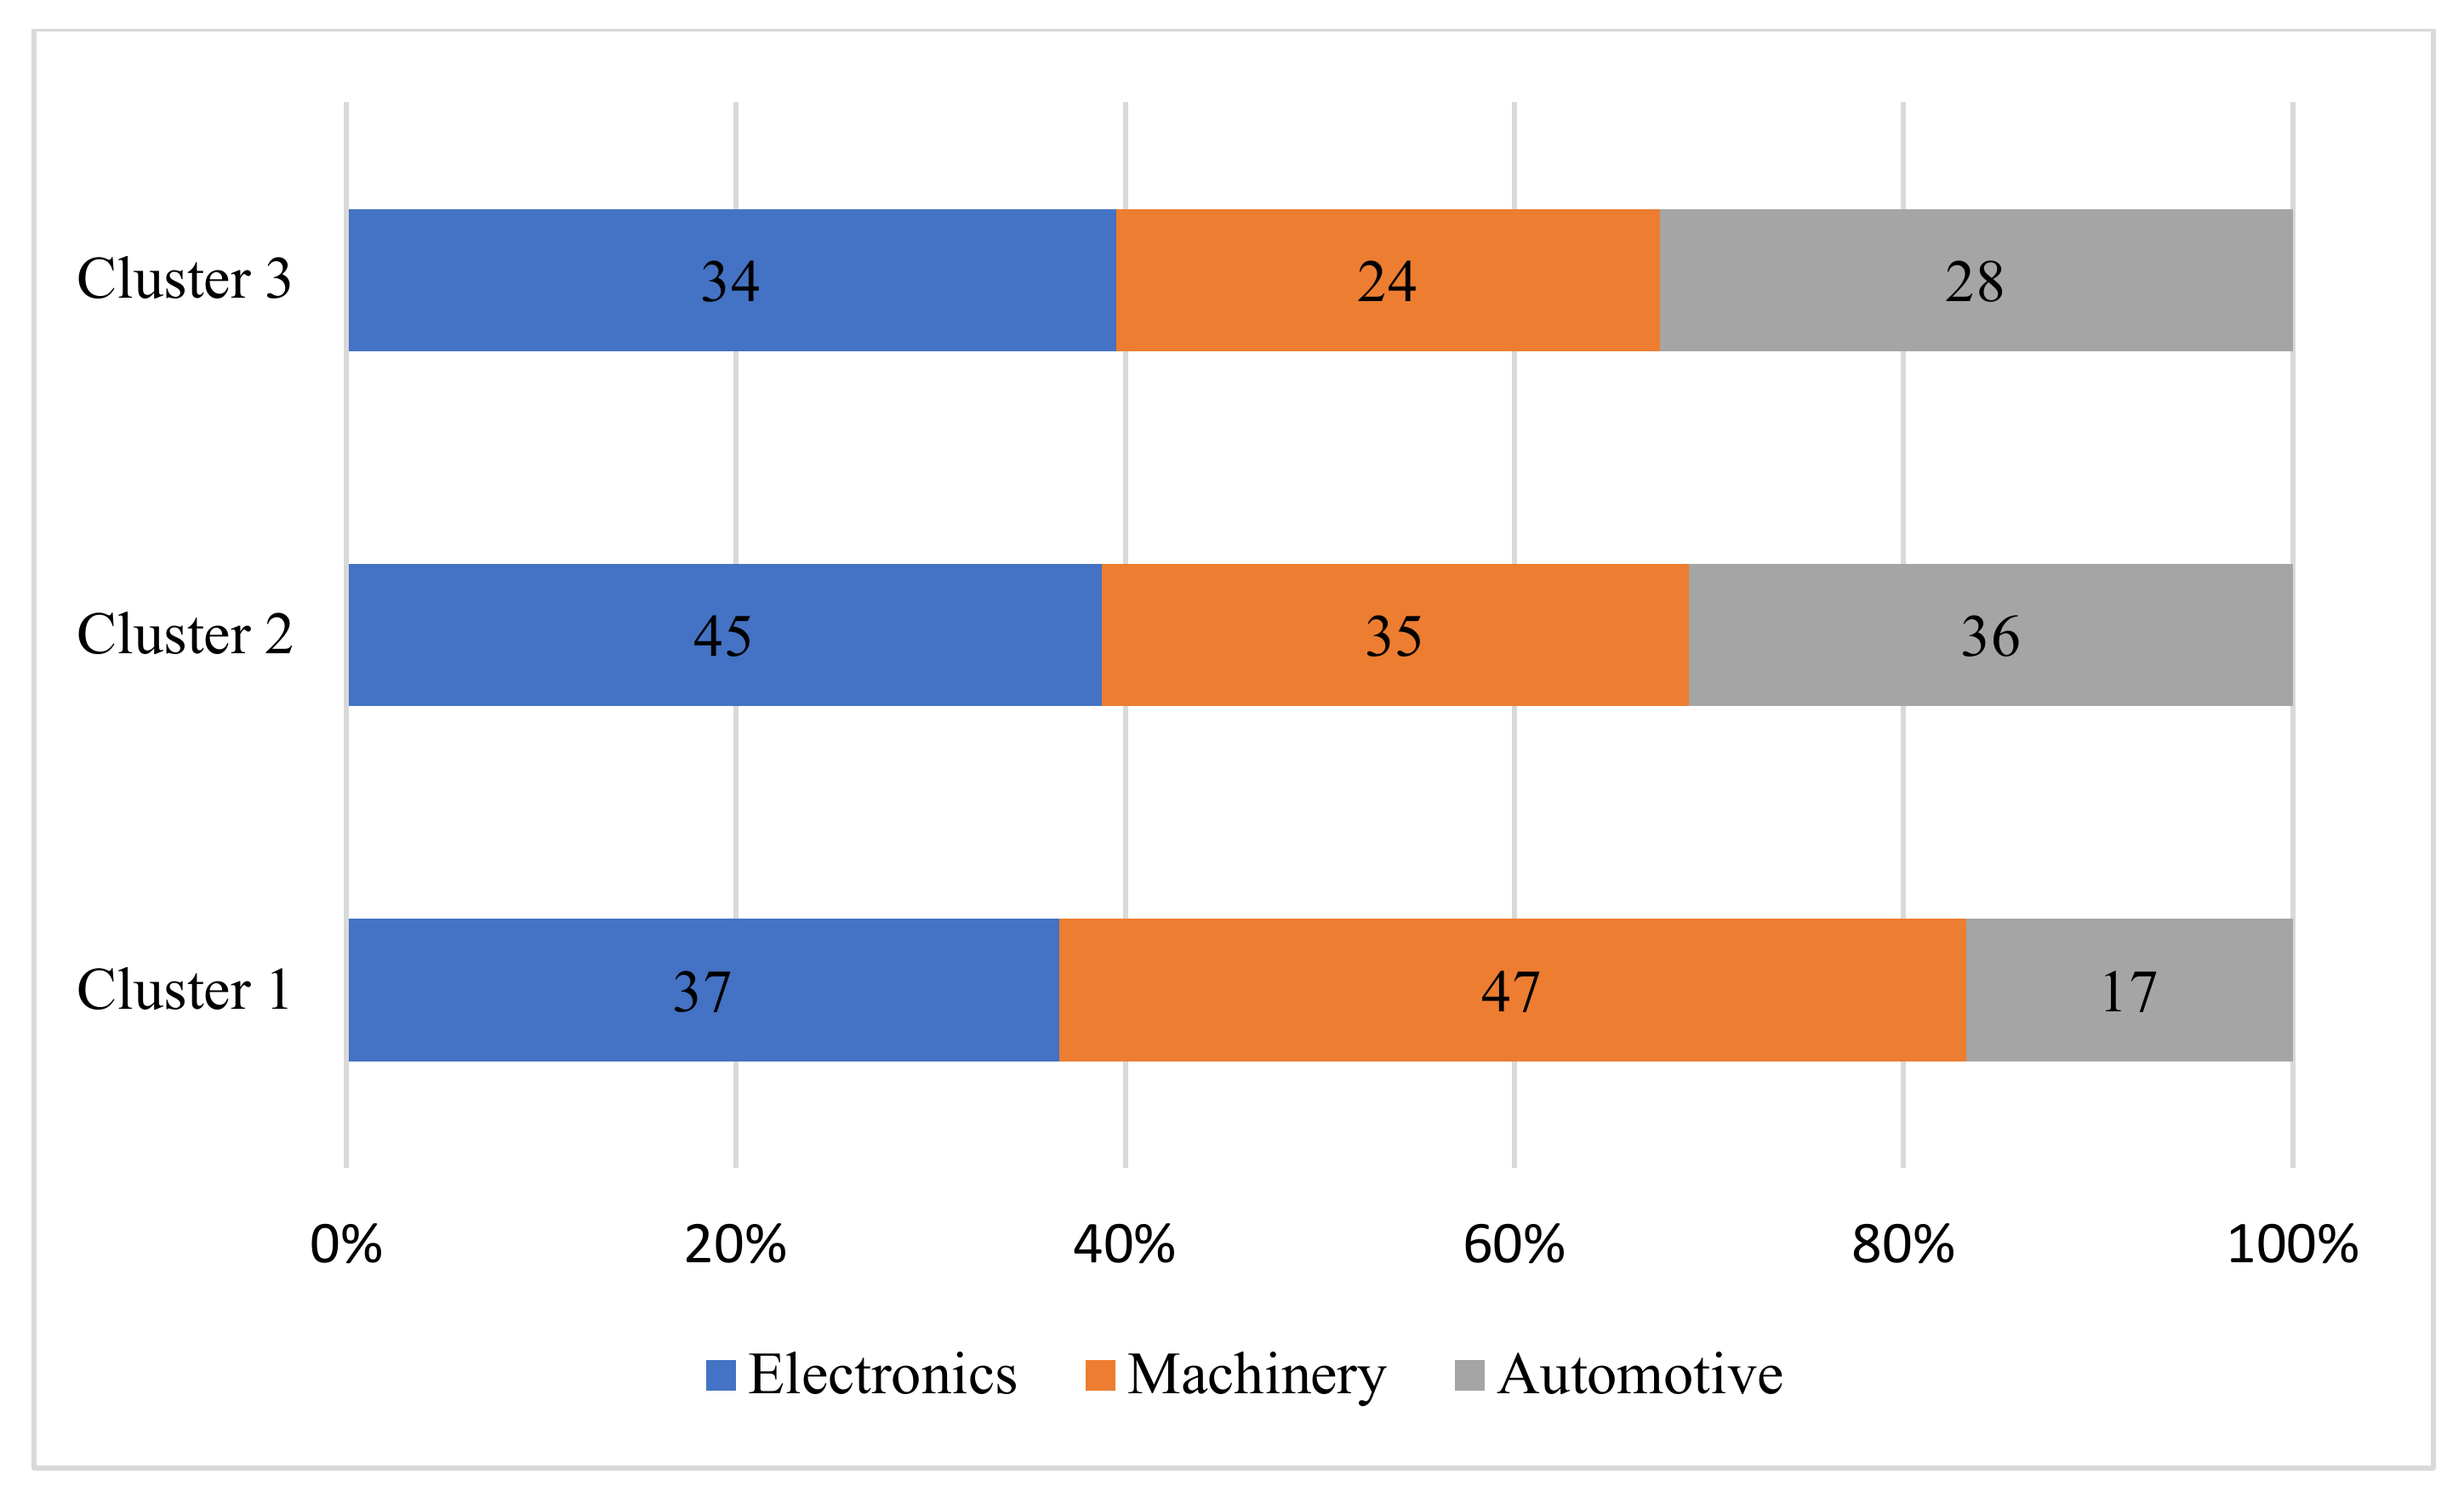
| Cluster | Operational Risks | Supply Chain Integration | Operational Performance | Industry Type | Company Size |
|---|---|---|---|---|---|
| 1 | Low supply risk Low manufacturing risk Low demand risk | Low | Low | Electronics (37%, n = 37) Machinery (46%, n = 47) Automotive (17%, n = 17) | Medium (36%, n = 36) Large (64%, n = 65) |
| 2 | High supply risk Low manufacturing risk High demand risk | High | High | Electronics (39%, 45) Machinery (30%, 35) Automotive (31%, 36) | Medium (18%, 21) Large (82%, 95) |
| 3 | Moderate supply risk Moderate manufacturing risk Moderate demand risk | Moderate | Moderate | Electronics (39%, 34) Machinery (28%, 24) Automotive (33%, 28) | Medium (28%, 24) Large (72%, 62) |
Publisher’s Note: MDPI stays neutral with regard to jurisdictional claims in published maps and institutional affiliations. |
© 2022 by the authors. Licensee MDPI, Basel, Switzerland. This article is an open access article distributed under the terms and conditions of the Creative Commons Attribution (CC BY) license (https://creativecommons.org/licenses/by/4.0/).
Share and Cite
Pham, H.T.; Verbano, C. Identification and Characterization of Supply Chain Operational Risk Profiles in Manufacturing Companies. Sustainability 2022, 14, 1996. https://doi.org/10.3390/su14041996
Pham HT, Verbano C. Identification and Characterization of Supply Chain Operational Risk Profiles in Manufacturing Companies. Sustainability. 2022; 14(4):1996. https://doi.org/10.3390/su14041996
Chicago/Turabian StylePham, Hai Thanh, and Chiara Verbano. 2022. "Identification and Characterization of Supply Chain Operational Risk Profiles in Manufacturing Companies" Sustainability 14, no. 4: 1996. https://doi.org/10.3390/su14041996
APA StylePham, H. T., & Verbano, C. (2022). Identification and Characterization of Supply Chain Operational Risk Profiles in Manufacturing Companies. Sustainability, 14(4), 1996. https://doi.org/10.3390/su14041996