Article

Assessment of Different Envelope Configurations via Optimization Analysis and Thermal Performance Indicators: A Case Study in a Tropical Climate

by
Jesús Araúz
1,2,
Dafni Mora
1,3,† and
Miguel Chen Austin
1,3,4,*,†
1
Research Group Energy and Comfort in Bioclimatic Buildings, Faculty of Mechanical Engineering, Universidad Tecnológica de Panamá, Ciudad de Panama 0819-07289, Panama
2
Departamento de Ingeniería Eléctrica, Escuela Técnica Superior de Ingenieros Industriales, Universidad Politécnica de Madrid C/José Gutíerrez Abascal, 2, 28006 Madrid, Spain
3
Centro de Estudios Multidisciplinarios en Ciencias, Ingeniería y Tecnología (CEMCIT-AIP), Panama City 0819-07289, Panama
4
Groupe Recherche Environnement, Confort, Conception Architecturale et Urbaine (GRECCAU), EA 7482, ENSAP Bordeaux, F-33400 Talence, France
*
Author to whom correspondence should be addressed.
Current address: Avenida Domingo Díaz, Panama City 0819-07289, Panama.
Sustainability 2022, 14(4), 2013; https://doi.org/10.3390/su14042013
Submission received: 19 January 2022 / Revised: 31 January 2022 / Accepted: 31 January 2022 / Published: 10 February 2022

Abstract

:
Passive solutions for more energy-efficient buildings are critical to improving our odds in the current energy crisis. This work focuses on assessing the thermal performance of different envelope construction layouts in a tropical climate through proposed indicators regarding the thermal mass degree (TMD) and insulation degree (ID). For this, a numerical study was performed for a reference building (RB) in Panama City and validated with the electricity consumption bills. Behavioral and sensitivity analyses were employed to identify critical heat gains and the most important envelope constructions, resulting in the layouts of the roof and external walls. Optimization analyses were performed to find adequate layouts to reduce the discomfort hours. Different roofs, external walls, internal partition layouts, and glazing types were evaluated. Results indicated that the adequate envelope configuration is a roof layout with low TMD and ID, along with wall layouts with high TMD and low ID.

1. Introduction

Energy represents an essential and transcendental element in the life of the human being. The development of society and the comfort of its members depend on the energy advances achieved. Fossil fuels were the first steps of civilization to reach a stage of socioeconomic stability due to their abundant presence on the planet, their ease of extraction, diversity of products that can be purchased, storage and transport capacity, and simple transformation into thermal and electrical energy and its available commercial scope for any social stratum or site of difficult access.
Despite their low efficiencies and health repercussions, throughout contemporary history, most energy industries have used petroleum derivatives to generate electricity. However, nations have noticed the negative effects of the excessive development of these technologies and electricity consumption by the world population, problems such as air pollution with gases that destroy the ozone layer, contamination of rivers and oceans with inorganic wastes with high concentrations of Nitrogen and Phosphorus that alter the natural life of rivers.
Global organizations such as the European Union (EU), the International Energy Agency (IEA), and the International Renewable Energy Agency (IRENA) have invested effort and time in studying alternatives to change the profile of energy production and influence decisions that promote investment in renewable energy and a more rational consumption by society. Due to the well-known current situation of fossil fuels in the world, in terms of their scarce reserves and the evidence of global warming, the worrying variations in world climates, which threatens the survival of many species, energy policies have taken serious positions. They have decided to abruptly reduce the use of internal combustion cars, non-renewable thermoelectric plants, and encourage the development of electric cars, wind, and solar generation, with laws focused on benefits, amenities, exemptions, and mobility facilities, such as urban special lanes or restricted battery changing sites.
Panama has relied on fossil fuels to meet national electricity demand throughout its Republican period [1]. Although having large hydroelectric projects, Panama uses fossil fuels [2]. The energy demand can be supplied with 80% renewable energy [1]. However, when the dams decrease their levels in the dry season, fossil fuel participation can be found above two-thirds of the total. Energy policies such as laws 45, 37, and 44 [3] strongly encourage micro-hydroelectric plants, photovoltaics, and wind farms. Panama’s national energy policy considers the following actions for the sustainable development of the energy sector [2]: elaboration of a long-term plan; comprehensive management of watersheds; territorial ordering; allocation of a price to the carbon content of energy; implementation of a law for the rational and efficient use of energy; reorganization of the laws of renewable sources, sustainable cities, energy, and education programs; and electric mobility.
Regarding the residential sector’s electric energy consumption, relevant participation in national consumption is perceived. According to the statistics of 2019, the residential sector represents 36.21% of all the energy sold by power plants [3], and it will increase due to the nature of a developing country which has demonstrated its incremental trend since the late 1990s [3].
Therefore, considering the global and Panamanian energy situation, policies, and sustainable urban development objectives, this article pretends to analyze a standard tropical Panamanian residential building, evaluate its thermal performance as well as the thermal comfort provided to occupants by dynamic simulation. This analysis involves recognizing the influence of envelope construction, discriminating each component’s (roof, external walls, glazing) heat gain through optimization analysis. Moreover, by developing the case study, two novel indicators will be proposed to simplify and enhance the thermal characterization of buildings according to their envelope layout.

1.1. Critical Parameters in Humid Tropical Regions

Hot and humid climates present a great challenge for a design in search of comfort conditions due to the high and variable temperatures throughout the year. Only the internal temperature of a tropical building exceeds 26 °C almost all year, a value that already exceeds the maximum allowed for thermal comfort, according to ASHRAE 55. Typical design considerations are even more important in hot climates due to high radiation and its incidences (World Bank Group, 2019), such as the design of the envelope, orientation, natural ventilation, openings such as windows, doors, balconies, roofs, and the window to wall ratio (WWR), which represent the most influential parameters in energy consumption. Furthermore, the total energy efficiency spending in 2018, according to the Global Alliance for Buildings and Construction [4], contains more than half invested in the envelope, recognizing the undisputed relevance of it, despite the region. A study in Sri Lanka simulated 300 different house models in a tropical climate which combines several orientations, shapes, and WWRs; it proved the direct relation between WWR and discomfort hours even if increasing electricity for illumination (comfort increased from 20% to 50% and electricity consumption from 1.5% to 9.5%) [5].
Usually, sensitivity analyses are carried out for energy analyses in buildings. This is used to identify key variables that affect the thermal behavior of buildings in energy simulations or observational studies. The implementation methodology consists of determining the spectrum of variation of the input variables, creating the models based on these variations, performing the simulation or development of the model, collecting the data, developing the sensitivity analysis with the results obtained, and presenting the results.
The range of input variables and their variation depends on the approach the user wants to apply to energy analysis, either in design considerations or in evaluating the energy behavior of an existing building [6]. Many sensitivity methods exist; each one has specific advantages above others. For example, a standardized regression coefficient (SRC) is the most popular choice in building energy simulations because it is easy to understand and does not require much computational capacity. It is more complex than other typical applications such as Morris design, the Extended Fourier Amplitude Sensitivity Test (FAST), and Treed Gaussian model sensitivity (TGP). Sensitivity analyses also work in a wide context to support machine learning (ML) algorithms [7]. Applying ML demands high computational power due to many mathematical relations to solve. A sensitivity analysis would be more useful for neural network applications than for the support vector machine algorithms but, in both cases, will identify the unimportant variable and decrease the computational cost.

1.2. The Envelope

Some important parameters that define the envelope of a building are appropriate orientation, external wall and roof, glazing, and external shading [8]; the University of Malaya determined the best configurations among these variables for a standard residential building in Malaysia, adopting passive design strategies in hot and humid climate zones. These configurations may be adaptable to any tropical area.
The envelope design focuses on the control of incident airflows, precipitation, and heat inputs [9]. The design is oriented to these situations to develop enclosures with specific characteristics that consider the environmental conditions depending on occupants’ thermal comfort. Among these characteristics, we have the following [10]:
  • Control of heat flow by selecting materials with high thermal mass.
  • Facades with reflective surfaces or with radioactive filters (windows).
  • Orientation considering the annual position of the Earth with respect to the Sun.
  • Insulating structures that restrict heat penetration.
  • Moisture control through waterproof foundations and drains to limit moisture.
  • Control of air flow through openings (doors, windows, high ceilings) to renew the interior air in search of good quality for the occupants.
Many authors have pointed out the relevance of envelope in the thermal performance of buildings. Depending on the construction characteristics and climate zones, the relevant sequence of elements may change. A numerical study of Danish houses [11] found out that the envelope insulation level is the most important factor respecting the capacity of limiting its heating during the time and the total effective thermal inertia determining the energy storage capacity. Moreover, it is declared that the increasing possibility of a dwelling’s time constant is up to 42% by indoor items and furniture for low structural thermal mass buildings.
Most studies conclude the necessity of modifying the envelope by adding insulation, reducing WWR, and attending orientation to consider shading devices. The analysis of traditional houses in the Mongolian winter [12] exposed the most influential design factors: insulation thickness (I.T.) of external walls, I.T. of the roof, indoor height, WWR, I.T. of ground, solar heat gain coefficient (SHGC) of windows, length/width ratio, and orientation. These conclusions may help to illustrate the overall impact of certain envelope elements. By setting the optimal values of these parameters, the energy-saving rate may be 65.9%.
In Chile [13], where there are many climate zones, a range of acceptable values of thermal conductivity and density for materials in buildings were found which may establish a thermal comfort range from 18 °C to 24 °C across the year. This study also found no impact of specific heat capacity on thermal comfort.
Many authors provided design recommendations for a combined climate [14] such as large north–south orientated facades to keep the surface area to volume ratio as low as possible to ensure compactness, optimizing WWR in each direction, appropriate shading devices, and opaque thermal insulation components. According to these recommendations, a fictitious office building in New Delhi was evaluated through the “Envelope Performance Factor”, which is the sum of the product between some facade’s transmittance and area (UA). The results confirm that the best combinations match with the previous recommendations, allowing the building to reduce its factor up to 26% in the lowest surface area to volume ratio and up to 31% in the highest one, both with a north–south orientation, shading devices, and improved transmittance concerning the Energy Conservation Building Code.
As it was seen, all these recommendations improved the thermal performance of the dwelling, but there is still the question of how much thickness would be optimal without the need to solve it by trial and error. The authors in [15] suggested a new version of genetic algorithm (GA) which optimally designed a multi-retrofit envelope including phase change material and thermal insulator. A typical residential building in the hot climate of India was analyzed with an optimized setup, and it achieved up to 33.5% of heat gain reduction and 9.2 kWh/day of electricity energy savings.

1.3. Humid Tropical Regions in America

According to demographic growth projections, in 2050, half of the population might live in the tropics. This reality justifies an increase in the quantity of realized studies in Latin America, specifically in Central America. The most studied continent is Asia, followed by America, where Brazil, Mexico, Venezuela, Colombia, and Cuba are the counties with more publications. Moreover, Peru, Guatemala, Bolivia, Haiti, and Dominican Republic are the least studied countries [16].
Concerning the Caribbean humid tropical regions, experimental improvements were made in a typical house model in Havana, Cuba [17], where annual average maximum temperatures of 29.5 °C and annual average minimum temperatures of 20 °C are presented. This was achieved by experimenting with a 12 cm thick reinforced concrete panel, interior, and exterior mortar cladding, a prevalent design in Cuban homes, a damping factor of 60%, a lag of 3.5 h, and a maximum internal temperature of about 3 °C below the outside. Then, 2 cm of PE (expanded polystyrene) III was adhered as a coating on the inner face, and the interior temperature managed to decrease 1 °C more, 26% more in damping factor, and the wave phase shift was doubled. The aim was to demonstrate the influence of insulation on buildings and, to compare, the same experiment was carried out on a 12 cm thick ceramic brick house that, although without insulation, had better characteristics than the reinforced concrete panel. After installing the same isolation from the previous case, it showed practically the same improvements. Improving the energy performance of homes is relatively easy and reduces energy consumption on a large scale.
A parametric study in hot-humid Paraguayan buildings [18] concluded that reinforcing exterior walls with 5 cm insulation may increase the annual comfort rate 7% and decrease the requirements of annual energy by 37%. Moreover, with WWR up to 15%, there is no need to improve glazing areas; simple shading devices can help increase natural ventilation rates, and thus comfort rates. It would be better to apply in roofs too. This study suggested some threshold values for roof and wall transmittance, from 0.34 W/m 2 -K to 0.79 W/m 2 -K and from 0.39 W/m 2 -K to 0.86 W/m 2 -K, respectively.
Several studies analyzed the influence of the envelope’s characteristics through alterations of its composition in Panama. In 2019, two conference proceedings evaluated thermal comfort by adjusting construction materials via simulation. The first one [19] focused on WWR, regarding national recommendations [20], along with an appropriate combination with wall insulation. This demonstrated the importance of applying insulation without obstructing the capacity of discharge. The second one [21] examined other parameters such as orientation, natural ventilation, envelope, and occupant behavior to develop low consumption techniques toward a nearly zero energy building. The results provided acceptable configurations that may considerably reduce residential energy intake, considering thermal comfort. Other experimental studies concentrated on the manufacturing insulation system from organic waste [22] and installing pluvial water pipes under the roof as a heat exchanger [23]. Others focused on evaluating comfort in a governmental institution such as banks [24] and universities [25].

2. Materials and Methods

The study was carried out through dynamic simulations in the EnergyPlus engine-based software, DesignBuilder, which allows the development of a model that contemplates the thermal-physical characteristics of each material used. The building architecture characterization was carried out by inspecting the architectural plans of an existing residential building, where the geometry, the dimensions of the sections, and materials are detailed. Hereafter, this building is considered as the reference model or reference building. The owner estimated and validated the occupants’ behavior, the sizing of electric loads, and their respective usage. The selected residential building has very typical construction characteristics (materials, dimensions, layout), which are easily found along with the considered country and suggested by local regulations. Subsequently, the owner’s family is non-structured, but the typical living schedule among the national population, such as working, eating, and resting itineraries, is defined by regional living.

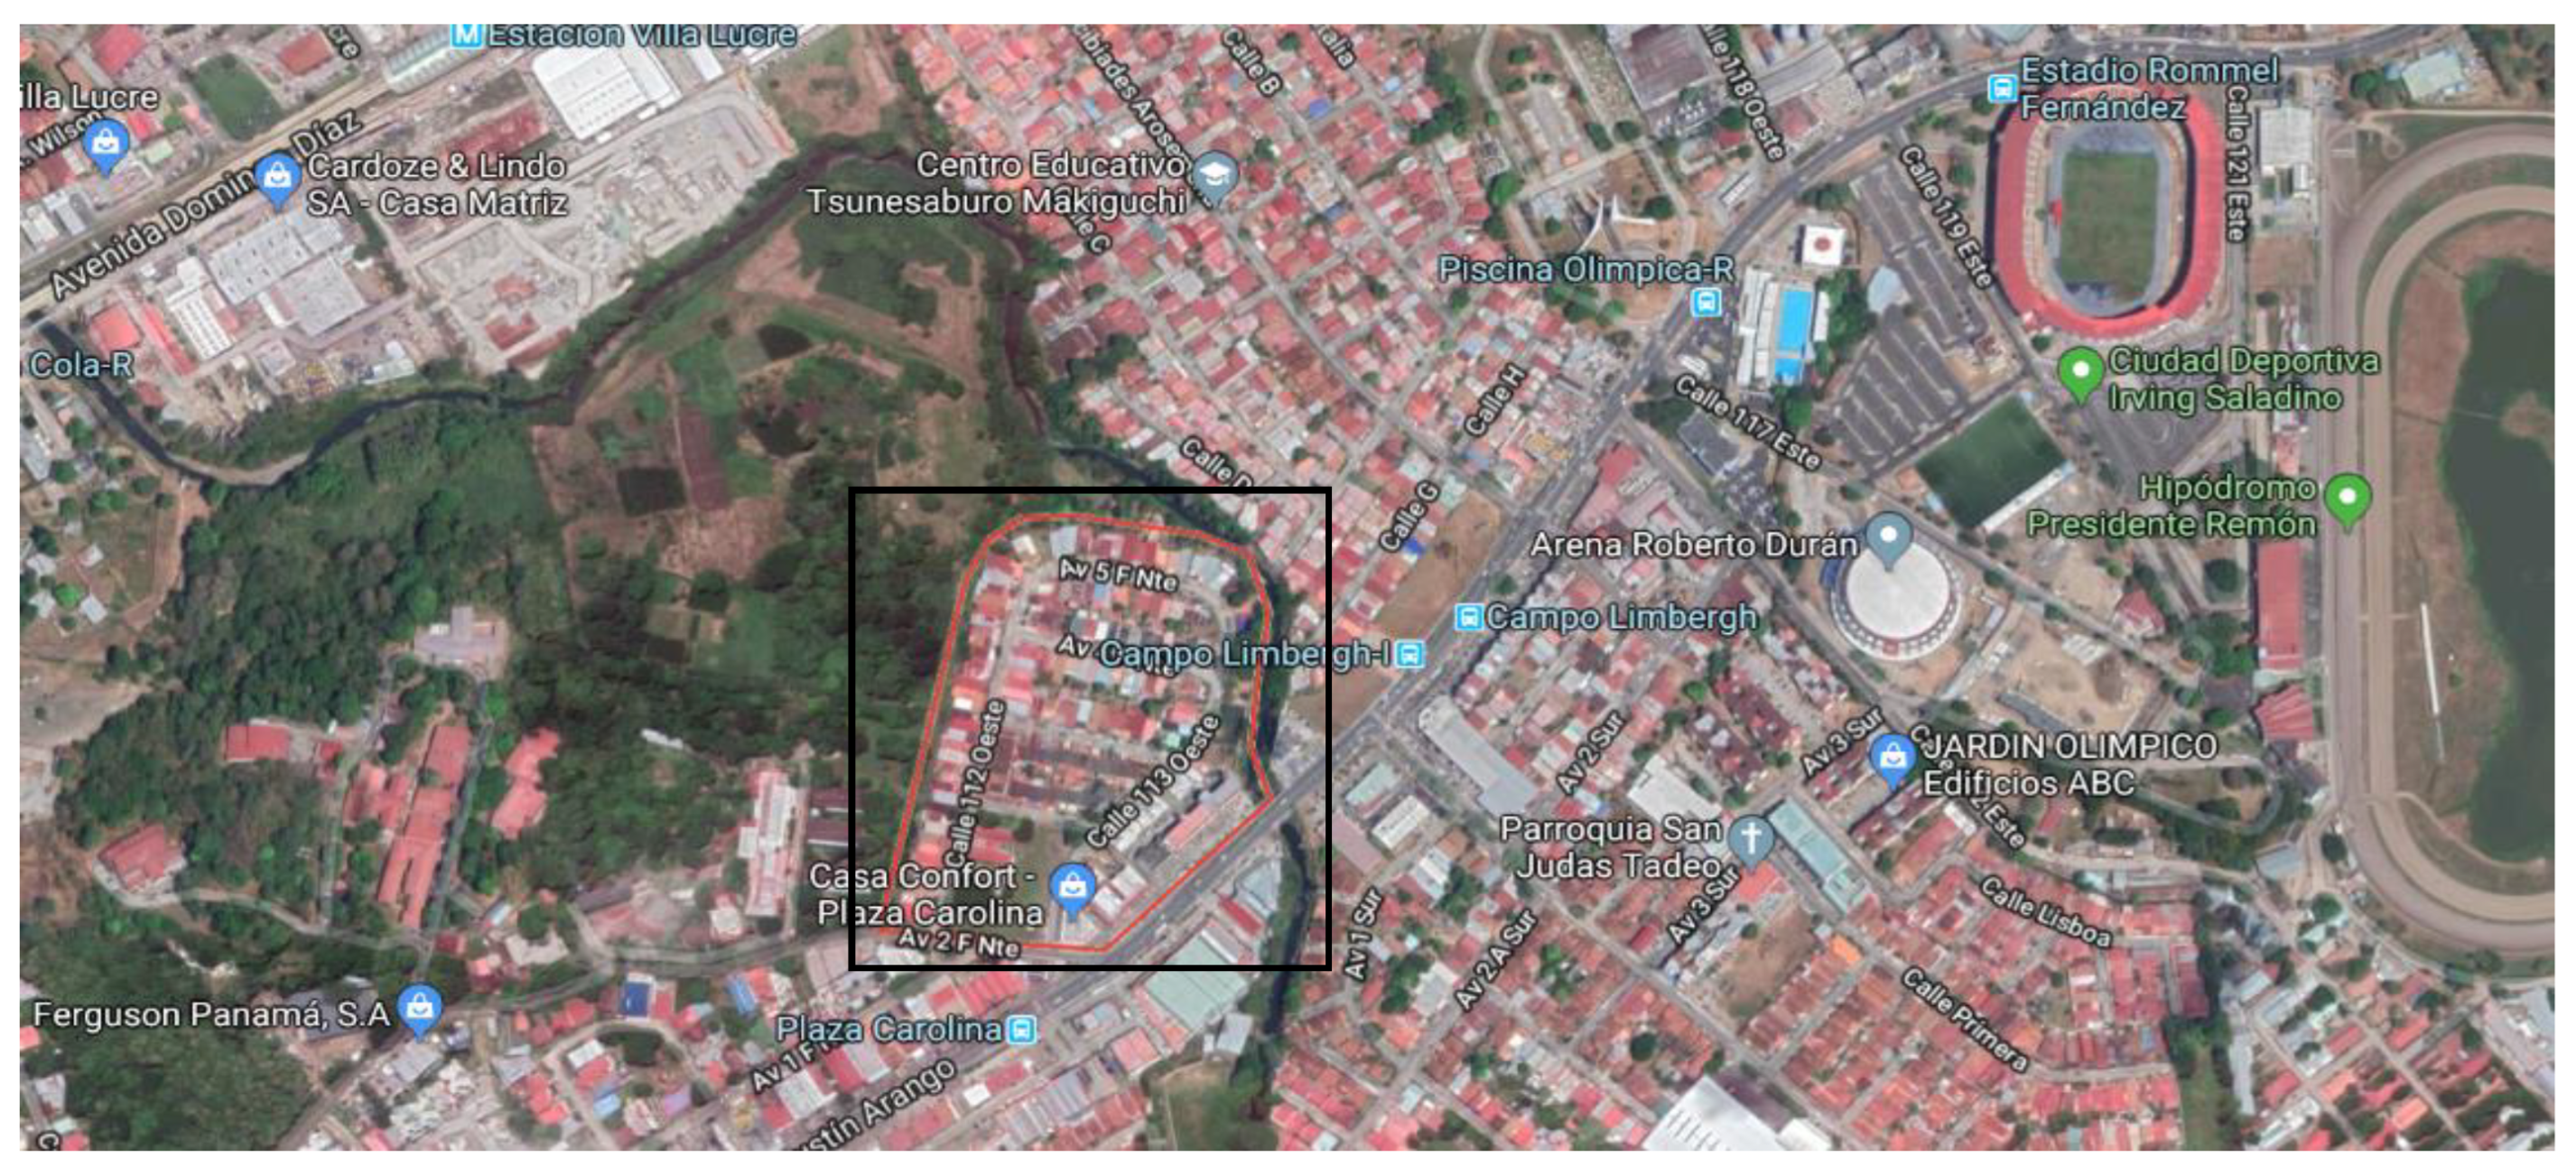
2.1. Geographic Location and Meteorological Data

The reference building is located in Panama City (8°32′16.7″ N; 80°46′55.7″ W), as shown in Figure 1, and is classified by the Köppen–Geiger climate classification system, mostly as Aw [26]. Surroundings consist mostly of low-rise buildings such as residential and commercial. Panama City is located in the narrowest part of the Province Panama, affected by Pacific Ocean, tropical humid forest, and, in lower magnitude, by northwestern mountains. The largest number of dwellings in the country are exposed to similar environments, with few exceptions such as some communities settled on low height mountains with less influence of sea winds. Hence, studying a residential building located in the capital city, where the highest population is, may contribute directly to the biggest fraction of residential energy consumption and define the initial research framework for those buildings with non-common location or characteristics.
The description of the areas surrounding the building is of great relevance in the thermal behavior of a building. Therefore, considering the distance to the coast, green areas, and tall buildings influences the wind path and the projected shadows. The reference building is located between a two-story building and a four-story building, as shown in Figure 2a.

2.2. Building Description and Occupancy Profiles

The building’s external walls consist of a 10 cm thick layer with concrete blocks and 1 cm thick layers of mortar inside and outside. The pitched roof is made of zinc sheets, and the ceiling is suspended with a maximum air space of 1 m in between due to the slope. The internal doors are made of wood, and the external doors are made of wrought iron. The building has simple window types without reflective or opaque membranes and internal shading. The building has a closed backyard enclosed by the roof and additional walls.
The configuration of external walls involves three layers: two of mortar and one of concrete. The concrete has a thermal conductivity of 1.63 W/m-K, specific heat of 1000 J/kg-K, and a density of 2300 kg/m 3 . The mortar, for both repels, has a thermal conductivity of 0.72 W/m-K, specific heat of 840 J/kg-K, and a density of 1760 kg/m 3 . The total transmittance (U) of the walls is 3.859 W/m 2 -K. The pitched roof characteristics involve three layers: 0.4 mm zinc sheets, an estimated maximum air gap of 1.0 m, and a 1 cm thick ceiling. Zinc has a thermal conductivity of 113 W/m-K, the specific heat of 390 J/kg-K, and a density of 7000 kg/m 3 . The ceiling has a thermal conductivity of 0.056 W/m-K, the specific heat of 1000 J/kg-K, and a density of 380 kg/m 3 . The resulting total transmittance U of the ceiling is 2.422 W/m 2 -K and 7.143 W/m 2 -K for the roof.
For windows, single glazing clear window type of 6 mm, where their coefficient of solar thermal gain (SHGC) is set to 0.81, the light transmission is set to 0.775, and the resulting total transmittance U is 6.121 W/m 2 -K. The internal floor configuration involves only two layers, as a simplification of what is used: a concrete slab of 10 cm and granite tiles 1.5 cm thick. The floor slab has a thermal conductivity of 1.4 W/m-K, specific heat of 840 J/kg-K, a density of 2100 kg/m 3 , and granite tiles have a conductivity of 2.8 W/m-K, specific heat of 1000 J/kg-K, and a density of 2600 kg/m 3 . The resulted total transmittance U is 3.487 W/m 2 -K.
The profiles of occupancy are presented in Table 1. The high-consumption equipment, critical for the characterization of the energy profile, is a split air conditioning unit (a refrigeration capacity of one ton, set at 26 °C), a refrigerator all day, and four fans of 50 W each of which two are used throughout the entire early morning and the other two at night. It is also essential to consider using multiple compact fluorescent luminaries of 20 W each at night and early in the morning. The consumption from other devices, such as a blender, microwave, television, coffee maker, has been omitted due to occasional usage.

2.3. Model Validation

To validate the model and results from simulations, it is necessary to compare the monthly energy consumption from simulation to the real energy consumption from electric bills. The resulting indoor temperatures and heat fluxes cannot be locally compared because no measurements were performed on site. However, knowing the monthly energy consumption from electric bills, the model can be calibrated according to the ASHRAE 14-2002 normative [27]. The model can be qualified as calibrated through the value of the Normalized Mean Bias Error (NMBE) and Coefficient of Variation of the Root Mean Square (CVRMSE). This establishes the reliability of any model to predict energy consumption and its variation through possible modifications. The NMBE provides the overall percentage difference between the actual and predicted values, and the RMSE measures the variability of the error between the measured values and the simulated values.

2.4. Numerical Study and Optimization Analysis

Once the model envelope and occupancy data are set up, the numerical study was performed via a dynamic simulation in DesignBuilder for the entire year. These dynamic simulations focus on the indoor temperatures and the total heat gains through the envelope elements as a first result, which helps to understand the thermal behavior of the building. Additionally, the thermal comfort indicators are calculated to evaluate the performance of the reference building and evaluate its performance after the modifications are introduced to the elements of the envelope with the most critical heat gains.
To identify the most important element of the envelope, behavioral and sensitivity analyses are performed based on their heat gains. After the most critical elements of the envelope are identified (objectives), different layout combinations for each element of the envelope (design variables and options) are examined through the genetic optimization algorithm integrated into the DesignBuilder software [28]. The most suitable resulting Pareto’s solution is then evaluated and compared to the reference building, using the previously established thermal comfort indicators.
Table 2, Table 3 and Table 4 show the different layouts for each envelope element: roof, partitions, and external walls. The selection of such different layouts is based on available layouts in the local market: seven roof layouts (Rop1–Rop7) were evaluated besides the original roof from the reference building (RRB), nine partitions (Pop1–Pop9), and nine wall (Wop1–Wop9) layouts were also evaluated, besides the original partitions and walls from the reference building (PRB and WRB, respectively). Similarly, nine glazing types were evaluated (Gop1–Gop9), besides the original glazing of the reference building (GRB): U G R B = 6.121 W/m 2 -K (Sgl Clr 6 mm); U G o p 1 = 4.233 W/m 2 -K (Sgl LoE Clr 6 mm); U G o p 2 = 2.715 W/m 2 -K (Dbl Clr 4 mm/16 mm Air); U G o p 3 = 2.685 W/m 2 -K (Dbl Clr 6 mm/12 mm Air); U G o p 4 = 6.121 W/m 2 -K (Sgl Grey 6 mm); U G o p 5 = 6.121 W/m 2 -K (Sgl Blue 6 mm); U G o p 6 = 6.121 W/m 2 -K (Sgl Bronze 6 mm); U G o p 7 = 3.1577 W/m 2 -K (Dbl Solar Grey 6 mm/12 mm Air); U G o p 8 = 2.725 W/m 2 -K (DblClr 4 mm/12 mm Air); U G o p 9 = 6.121 W/m 2 -K (Sgl Green 6 mm). The acronyms are kept as originally presented in the software: Clear (Clr), Double (Dbl), low emissivity (LoE), and Single (Sgl).
In this way, the optimization analysis helps to simulate and evaluate 8000 different models regarding the envelope configurations only. Note here that the total number of possible designs (or models) to test can be estimated as (n°options)∗(n°variables). Besides, it can be observed that the position of the insulation layer changes through the different layouts.
In Table 2, Table 3 and Table 4, despite the identification name of each different layout (superinsulated or uninsulated heavyweight), it can be observed that for the different layouts, the transmittance values (U) appear to be similar or not significantly different from each different layout, i.e., Rop2 and Rop6, Rop4 and Rop5, Pop4 and Pop9, Wop3 and Wop4. These similarities can also be observed along with different layouts, i.e., Rop2 and Wop1, Rop7, and Pop3. This might indicate that using only the transmittance values before is not suitable for evaluating the envelope’s thermal performance. On the contrary, the heat gains might help us evaluate such performance based on the heat gain levels themselves, e.g., weaker heat gains indicate better performance.
However, the former depends on factors such as building orientation facade shadowed by surrounded buildings or vegetation, among others. Thus, one layout with excellent performance (reducing the heat gains significantly) in one building may not suit other buildings. Therefore, this study is not limited to finding the best combination of envelope layouts for the reference building and analyzing the envelope performance by assessing each envelope layout’s thermal mass and insulation content. This, to identify a possible tendency in whether the roof layout should have a higher insulation content than the external walls, for example, or whether the external walls should have a higher thermal mass content than the roof for the roof not to store a significant amount of heat, given the critical incoming solar radiation in such tropical latitudes. Two indicators are proposed to evaluate thermal mass and insulation contents, which may give a sense of the heat storage capacity and insulation of each component envelope layout, which cannot be identified merely by the U values or the heat capacitance of each material alone.

2.5. Envelope Performance Indicators

To assess the thermal mass content of each envelope component layout, the following expression is proposed (the thermal mass degree or TMD):
T M D = C M C w a l l = e ρ c p M i = 1 e ρ c p i
where C M corresponds to the heat capacity’s heaviest layer in the wall, which layer is identified by the product of ρ c p , and e is thickness. The heaviest layer would have the highest value of ρ c p . Equation (1) can be analyzed by evaluating the resulting value for a specific envelope component layout. This means that the higher the value, the higher the thermal mass degree, and vice versa. An envelope component layout with a resulting TMD of one indicates that the layout is either composed of only one material and layer (such as RRB, Pop4, Pop9, and Wop9) or that the heaviest thermal mass layer has a heat storage capacity as high as the entire wall heat storage capacity. In other words, most of the heat stored would reside in this heaviest layer. By establishing a threshold value as 0.5, a TMD value lower than 0.5 indicates a low thermal mass degree, a TMD value of around 0.5 indicates a mild thermal mass degree, and a TMD value higher than 0.5 indicates a high thermal mass degree. Thus, such layouts are not evaluated with the TMD indicator.
To assess the insulation content, the following expression is proposed (the insulation degree):
I D = U w a l l k a i s / e a i s
where k a i s and e a i s correspond to the layer with the lowest thermal conductivity value. Equation (2) is based on the effectivity definition where the ratio of the heat conduction through the entire wall is compared to the heat conduction as if the wall consisted only of the insulating material with k a i s and e a i s . The value of this indicator can be evaluated as the TMD. As both indicators are dimensionless, they may also be used to determine whether each layout behaves mostly as an insulation material, a high heat capacity material, or both. Table 2, Table 3 and Table 4 present the physical properties and the corresponding TMD and ID for each envelope component layout, the roof, partitions, and walls.
In Table 2, Table 3 and Table 4, it can be observed that the thermal mass and insulation degree differ significantly for most of the layouts, but some are comparable in both TMD and ID, e.g., Rop1 with Rop7, Rop2 with Rop3, Wop1 with Wop2, and Wop4, and Pop1 with Pop2. The other 19 layouts present distinctive TMD and ID values, which contributes to providing a significant difference for each layout in the evaluation process through the optimization analysis.

2.6. Thermal Comfort Indicators

To evaluate the thermal comfort, the classic thermal comfort parameters are employed: the operative temperature (OT), the relative humidity (RH), the predicted mean vote (PMV), the predicted percentage of dissatisfied (PPD), and discomfort hours based on the summer adaptive comfort ASHRAE 55 with 80% acceptability (DH). As established in [29], the comfort range for the indoor air temperature lies between 23.5 °C and 28.5 °C, with a relative humidity of 60%. The thermal comfort calculator integrated in the software DesignBuilder was used to determine the corresponding OT, PMV, and PPD values, resulting in 23.5 °C < OT < 28.5 °C, 0.07 < PMV < 1.52, and 5.09% < PPD < 52%.

3. Results Analaysis

This section presents the results of energy consumption and thermal behavior. First, it is important to validate the model as calibrated to rely on the simulation results. Table 5 compares the energy consumption according to the electricity bills and the energy consumption from dynamic simulations. Therefore, the model is calibrated because the NMBE and RMSE resulted in −4.81% and 9.73%, respectively, with values between −5% and 5%, and less than 15%, correspondingly.

3.1. Behavioral and Sensitivity Analysis

Overall monthly-averaged simulation results for the reference building are presented in Figure 3. The month of March presented the highest temperature values (Figure 3a), where the indoor air (in color gray) presented a maximum temperature and an average temperature of 37.50 °C and 27.73 °C, respectively. The operative temperature presented a maximum of 35.78 °C and an average of 27.30 °C (186.5 of DH). According to the comfort temperature range, the DH resulted in 2164.1 h (24.7% of the 8760 h in a year). The indoor relative humidity (RH RB) resulted in higher than the comfort limit value (Figure 3b). Conversely, the resulting PMV and PPD values are encountered to be within the limit values.
The resulting heat gains through the envelope are presented in Figure 3c. The positive values represent the heat gain toward the indoor air (charging); meanwhile, the negative is the heat extracted from the indoor air (discharging). From Figure 3c, it can be observed that the floor (FG RB) appears to always contribute to the discharging of the indoor air (maroon line), while the roof-ceiling (RG RB, green line), external walls (WG RB, yellow line), and windows (GG RB, orange line) always contribute to the charging of the indoor air. On the contrary, internal partitions (green line) seem not to contribute significantly to indoor air’s charging or discharging. Recall here that the heat gains are monthly averaged, and the results in Figure 3 are averaged for all zones (occupied and not occupied). In some zones, the internal partitions contributed to the charging of the indoor air rather than the external walls, and thus it is a reason to also consider them as design variables. Moreover, the floor layout was not chosen as a design variable since it does not contribute to the charging of the indoor air. The heat gains through the roof and external walls dominate among all heat gains during the charge periods, and thus their layouts were also considered design variables.
To corroborate results from the behavioral analysis, a sensitivity analysis was performed (based on the regression method with Sobol-based sampling), which helps study the influence of each of the four design variables on the DH (based on the adaptive comfort ASHRAE 55 with 80% of acceptability). Each variable is measured by the resulting value of the standardized regression coefficient (SRC). Note here that the total number of possible combinations is 8000, which indicates that the same number of iterations might be needed in the analysis. However, after 1000 and even 5000, the same result was encountered.
Based on the SRC values obtained, the adaptive comfort ASHRAE 55 80% acceptability (namely DH, here) is most strongly influenced by the external walls’ construction, among the design variables chosen in this analysis. The DH is also moderately influenced by glazing type and partition construction. Some input variables have a p-value of more than 0.05, suggesting a low confidence level in their respective regression result values. Nevertheless, the p-value tells if the input variable has a statistically significant effect on the output.
In summary, the sensitivity analysis followed the behavioral analysis presented earlier, where the roof and walls heat gains resulted in high importance. However, the critical heat gains are the ones through the roof since it is the highest total heat gains for the yearly monthly-averaged simulation (Figure 3c).

3.2. Optimization Analysis

For the optimization analysis, the roof and external wall gains were chosen as objectives to be minimized, considering that minimizing such gains would reduce DH values. The internal partition gains, glazing gains, and discomfort hours were selected as additional outputs. Figure 4 shows the resulting 62 solutions at Pareto’s front from the optimization analysis via monthly-averaged simulation data. Figure 4a presents the resulting four heat gains (roof-ceiling, walls, glazing, and partitions) using a radar chart. The different resulting layouts for each of the envelope components are presented in Figure 4b, and the resulting discomfort hours (DH) based on the adaptive comfort ASHRAE 55 with 80% acceptability are presented in Figure 4c.
In Figure 4a, it can be observed that the roof gains (blue line) change significantly as the external wall gains (orange line); this might explain the results from the sensitivity analysis. The partition gains (yellow line) and glazing gains (gray line) do not change significantly. In Figure 4b, only one option for the glazing type resulted in all 62 solutions at Pareto’s front, indicating that the glazing types and heat gains influence neither the walls nor the roof heat gains. Consequently, the different resulting options for the roof, walls, and partition layouts can then indicate that they do influence the walls and roof heat gains as expected.
From Figure 4b, all the different roof layouts (RRB to Rop7) were encountered at Pareto’s front, where Rop3 appeared the most (36 times), while each of the other seven layouts appeared equally four times (except for Rop6 which appeared two times). The Rop3 layout (appearing 36 times) presents high TMD values and high ID values (Figure 4a). As such, the most appeared layout indicates that a roof layout with high TMD and ID values is preferable to lower the heat gains.
Besides Figure 4b, all the different wall layouts (WRB to Wop9) were encountered at Pareto’s front, except for layout Wop4, where Wop2 appeared the most (30 times), while each of the other eight layouts appeared four times equally. The Wop2 layout (appearing 30 times) presents mild TMD and high ID values (Figure 4b). From this, a high ID value for roof and wall layouts is expected to lower the heat gains through the roof and external walls, as expected.
For the partition layouts, only four options were encountered (PRB, Pop4, Pop6, Pop9), where Pop4 and Pop9 layouts appeared 16 times and both Pop6 and PRB layouts appeared 15 times. The PRB and Pop6 present high TMD and low ID values, while Pop4 and Pop9 (a one-material layout) present high ID values (Figure 4c). This then might indicate that if a more-than-one-material layout is chosen, a layout with high TMD and low ID values is the preferred option for internal partitions, whereas if a one-material layout is chosen, a layout with a high ID value is preferable.
To identify a preferable tendency in choosing a roof layout with high or low ID value when a wall layout with high or low ID value is chosen, the TMD and ID indicators for each of the 62 solutions are presented and compared in Figure 5 and Figure 6. Figure 5 shows that nearly 68% (42/62) of the roof layouts presented high TMD values, indicating that a roof layout with a high TMD value is preferable. For the wall layouts, only 13% (8/62) presented high TMD values (Figure 5) and about 68% (42/62) presented mild TMD values (TMD around 0.5). However, for the partition layout, about 48% (30/62) and 52% (32/62) presented high and low TMD values, respectively, which might indicate that the TMD of internal partition layouts does not have a significant influence whether you choose a layout with high or low values.
Figure 6 shows that nearly 71% (44/62) of the roof layouts presented high ID values, indicating that roof layout with a high ID value is preferable. The same can be said for the wall layouts, where only 68% (42/62) presented high ID values. Besides, around half (52% (32/62)) presented high ID values for the partition layouts, indicating again that the internal partitions do not play an important role when analyzing monthly-averaged simulation results. This might explain the weak heat gains resulting from the internal partitions presented in Figure 4a.
Now, observing Figure 4c, Figure 5 and Figure 6, a tendency appears when the envelope configuration presents high TMD and ID values. In Figure 4c, about 61% (38/62) present a DH value higher than 2000 h, and around 6.5% (4/62) presented low DH values (at solutions 3, 5, 45, and 49). For those solutions presenting DH values higher than 2000 h, for the most part, they also presented high TMD and high ID values (Figure 5 and Figure 6). As such, four solutions with low DH values presented a roof layout with high TMD and ID values and a wall layout with high TMD and low ID values. Note here that since the optimization analysis objectives were to minimize both wall and roof heat gains, the low DH values encountered (Figure 4c) might not be the lowest values one might find, and consequently, nor the adequate combination for each of the four design variables (in terms of lowering the DH values).
Therefore, since the sensitivity analysis yields that the DH is more sensitive to the external wall layouts, the optimization analysis was performed again but with the objectives of minimizing the DH and external wall heat gains, first, and then, it was performed again to minimize the DH and roof heat gains. To synthesize the reporting of results, the following only shows the results from the optimization analysis when minimizing roof heat gains. For the optimization analysis, when minimizing the DH and wall heat gains and roof heat gains, 34 and 5 different envelope configurations were encountered at Pareto’s front (solutions). For the former, solution 14 resulted in being the same as solution 1 for the latter, presenting the lowest DH value of 16 h.
Figure 7 presents the resulting solutions at Pareto’s front with their corresponding heat gains and DH values. It can be observed that only five solutions were encountered at Pareto’s front, where every solution pairs with the original wall and partition layouts and the original glazing type from the reference building. Besides, as encountered in the previous optimization analysis (Figure 6), most roof layouts presented high TMD and ID values when minimizing roof and wall heat gains. On the contrary, in the results from the optimization analysis presented in Figure 7, it can be observed that the lowest DH values are obtained with solution 1, in which a roof layout with low TMD and low ID values is presented, along with a wall layout with high TMD and low ID values (Figure 8). The authors want the reader to note that solution 1 in Figure 7 (presenting the lowest DH values) was also encountered at the optimization analysis presented in Figure 4, but it was not at Pareto’s front. The reason is shown in Figure 7a, where the resulting wall heat gains are not significantly lower than the ones from the reference building wall heat gains (Figure 3a).
Moreover, from Figure 8, wall and partition layouts with high TMD and low ID values are preferable. The higher DH values are encountered at solution 3 when the roof, wall, and partition layouts present high TMD values but a roof layout with high ID value and wall and partition layouts with low ID values.
Both optimization analyses were performed again but only for the critical month (the month where the highest outdoor temperature and highest heat gains were encountered), which resulted in March (Figure 3). The envelope configuration presenting the lowest DH values (2 h in this case) was encountered to be the same as solution 1 in Figure 7. The sensitivity analysis for March only suggested that the most important input variable was the roof construction and then the construction of the external walls, which contradicts the results in Figure 7 but is consistent with the heat gains encountered in Figure 3c.
In summary, from the previous optimization analysis, the following can be inferred from the values of proposed indicators (TMD and ID):
  • Choosing a roof layout with high TMD and ID values might not be adequate, as the highest DH values are encountered (solution 23 in Figure 4, Figure 5 and Figure 6 and solution 3 in Figure 7 and Figure 8).
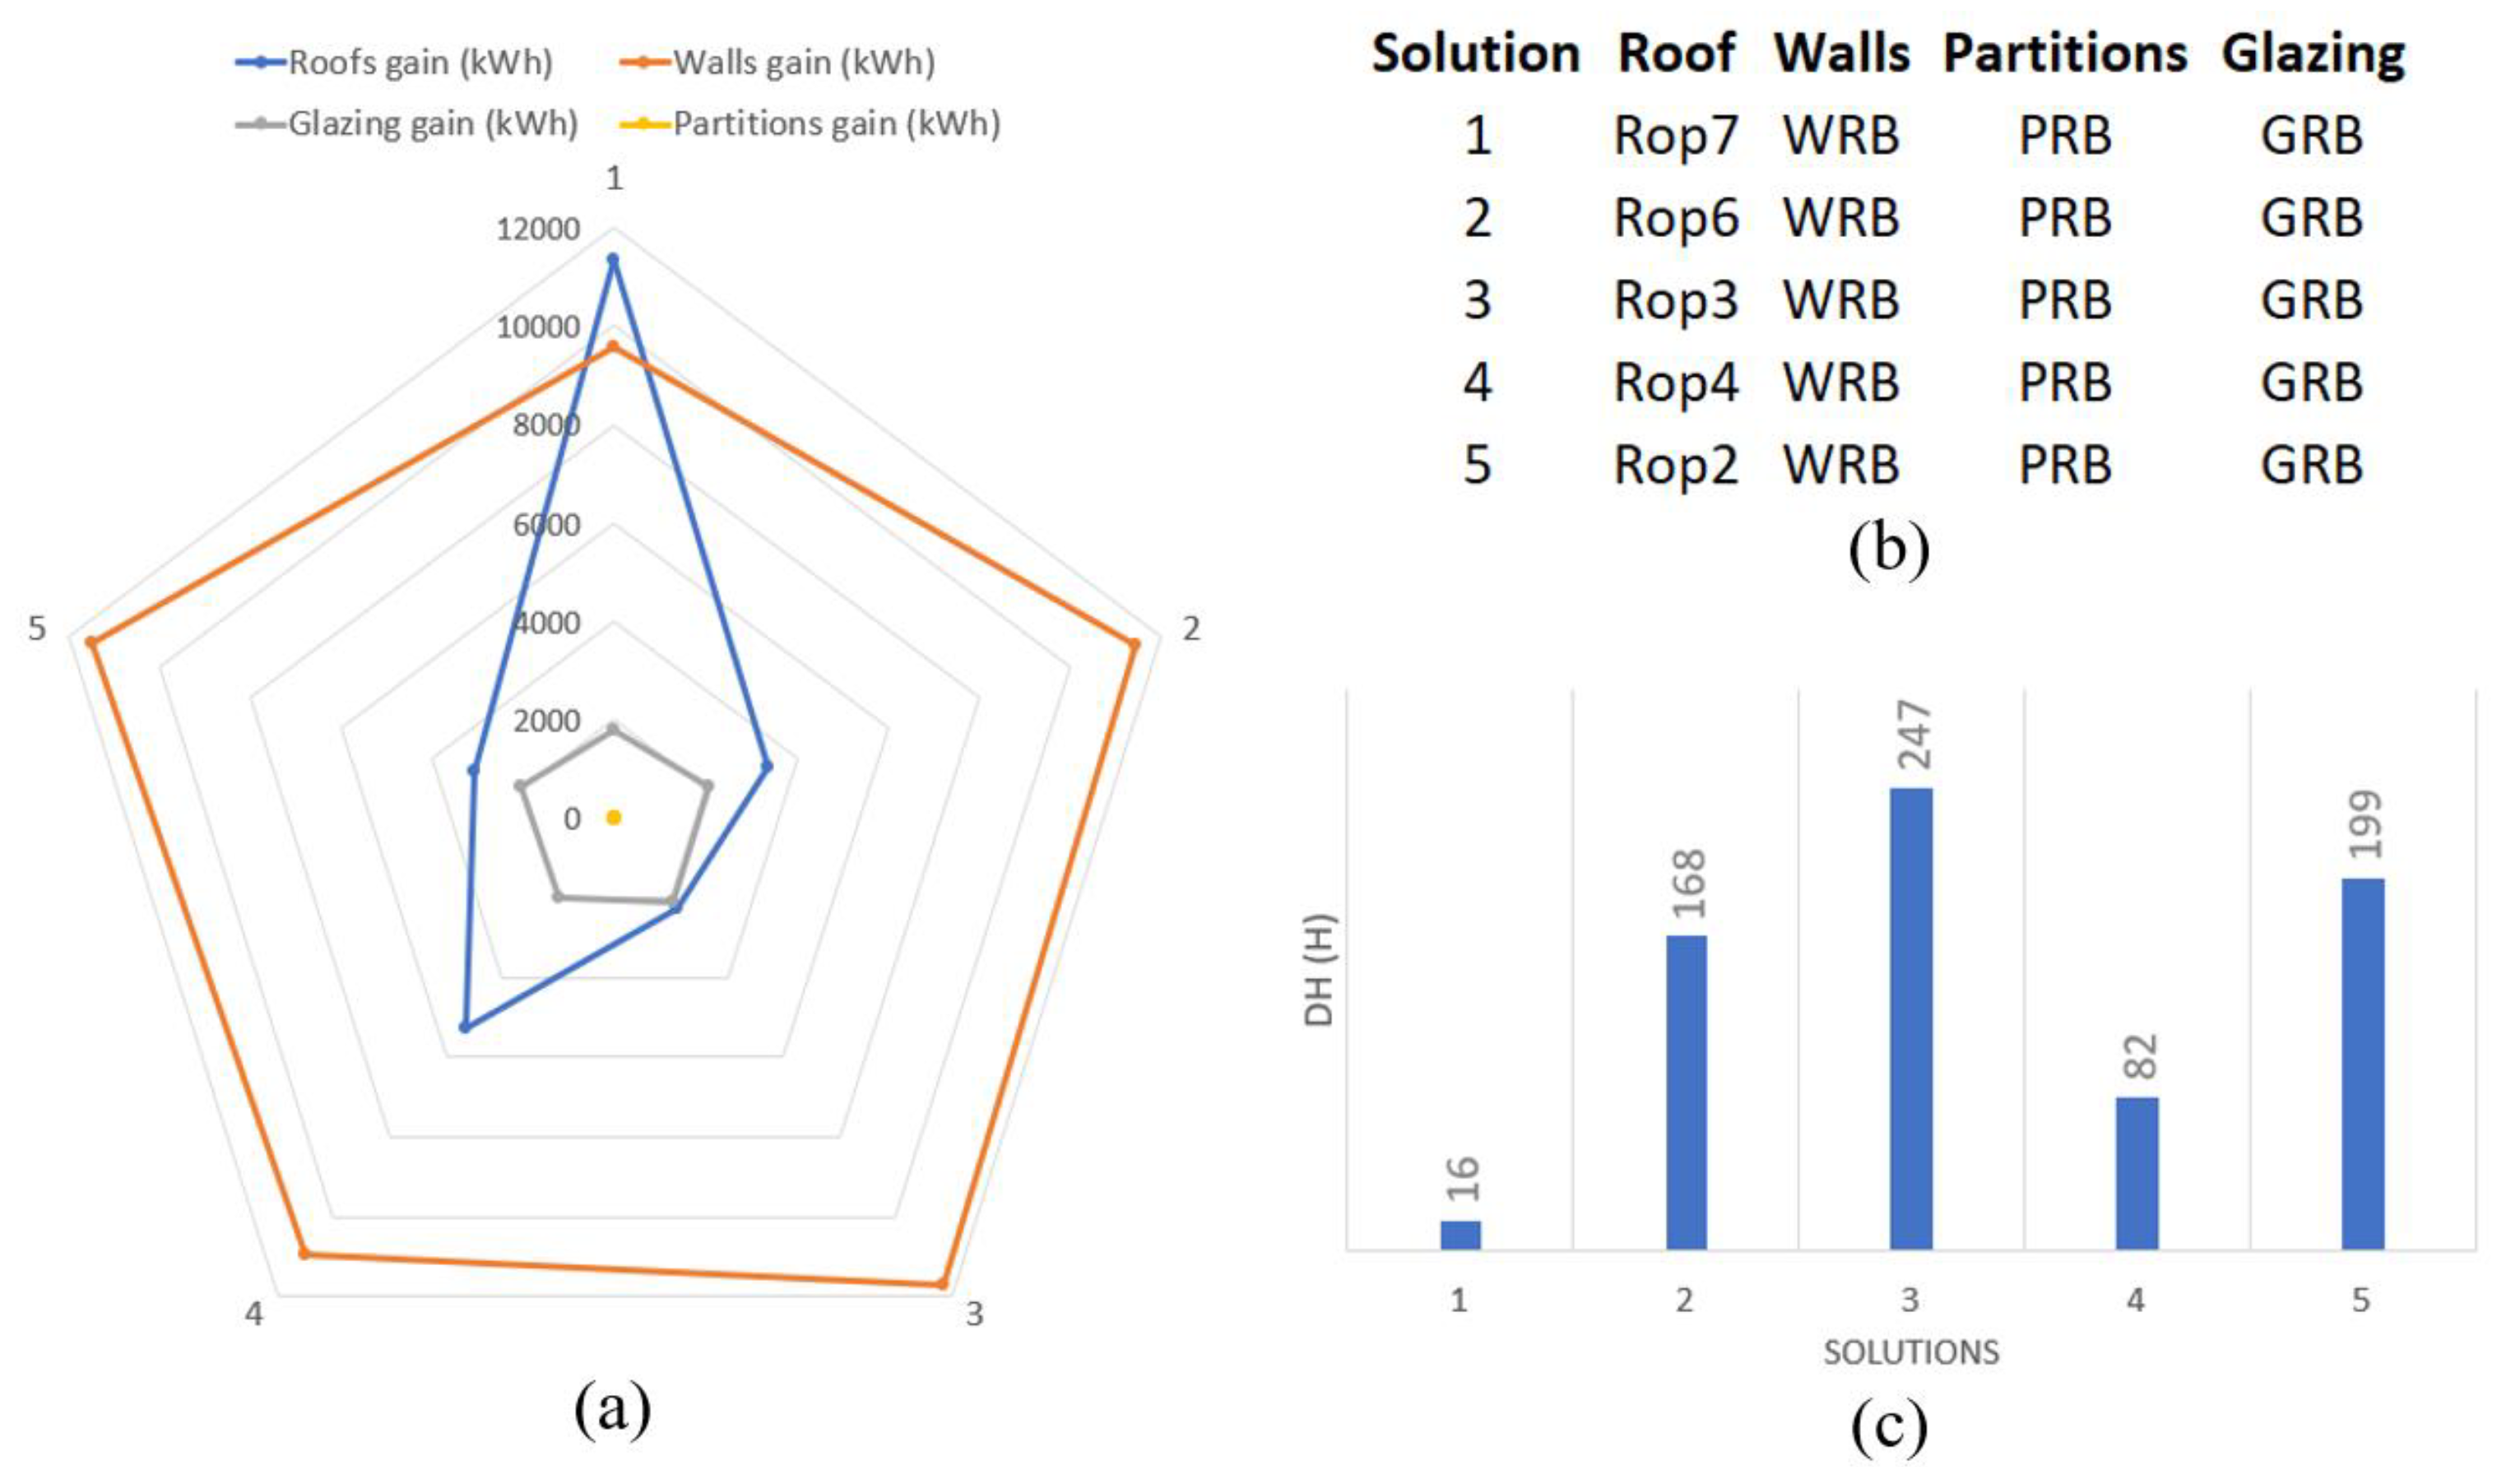
  • Choosing an envelope configuration with a roof layout with low TMD and low ID values, along with wall and partition layouts with high TMD and low ID, seems to be the adequate option (solution 1 in Figure 7).
  • The reference building glazing type appears to be adequate for every solution, but this might be due to no significant changes presented for the glazing heat gains.
  • Optimization analysis could have been performed to minimize the wall or roof heat gains, together with minimizing the DH; however, it would have led to achieving the same best solution. It should be noted that the results presented here correspond to a specific case study, and thus it might only apply to such a case (Figure 2).
Moreover, to evaluate the impact of solution 1 (Pareto 1 in Figure 7) in the current energy consumption (EC) of the reference building (RB) (Table 5), this solution was applied to the RB. The comparison between the RB EC and the RB + Pareto 1 yields a reduction that differs depending on the month (Table 6). Note here that this EC is only due to the use of the air conditioner (AC), and this AC is located in zone R1 (Figure 2b) used only during night hours (Table 1). The highest EC reduction was encountered for April.

4. Discussion

Based on the sensitivity analysis results, suggesting that the layout of the external walls influence the most, the lowest DH values were found at the maximum roof heat gains in solution 1 (Figure 7a), but also, the heat gains through external walls are not the lowest values encountered in the optimization analysis. Following this then, other studies have encountered similar situations where the roof layout is critical in tropical climates. The authors in [30] compared various roof insulation layouts and achieved a reduction in energy consumption higher than 10%. Likewise, by considering four different roof configurations, the authors [18] found it possible to reduce the annual discomfort rate by 7.4% and the annual energy requirement by 37%.
Based on the thicknesses of the RB envelope component layouts, every solution at Pareto’s front indicates that different thicknesses depending on the envelope component might be needed, i.e., different thicknesses for the walls, partitions, and roof.
Different construction guidelines based on bioclimatic architecture strategies found in the literature recommend a low insulation degree for walls [31] with low thermal mass for walls and floors [31,32] (consistent with our findings) but do not give a specific value to be included. Other studies have analyzed the position of the insulation layer within the external walls, and others suggest that a complete envelope composition with a high insulation degree with low thermal mass content improves the thermal performance in tropical climates. Regarding this last remark, the authors in [33] performed a comparative study considering 18 wall configurations having the same layers but in a different order and found that better performance was reached with a high insulation degree on the outer layer and low thermal mass but not the lowest (a configuration with almost ten times more thermal mass, and same U value, consumes 0.1 MWh/year less). Therefore, in this matter, our present study seems to support the need for local and global analysis, where each of the envelope components (roof, walls) should not be only studied individually (local) but rather by including their interactions (combining which roof with which walls, or which walls with which partitions), such that better performance can be achieved.
Other indicators commonly used to make decisions regarding envelope compositions are the U value (useful enough for steady state), which involves thickness and thermal conductivity, and the thermal diffusivity (necessary for transient studies) [14,33]. Both indicators might lead us to the same results as with the proposed ID indicator. For instance, by analyzing each solution in Figure 7, by only considering the U values of both the roof and wall layouts, the last three solutions indicate a roof layout with high insulation degree, which is consistent with the analysis performed with the proposed ID indicator (Figure 8b).
On the contrary, the first two solutions present roof layouts with a significant difference in insulation degree (1.546 W/m 2 -K and 0.258 W/m 2 -K, respectively), whereas the proposed ID indicator suggests that both layouts present the same degree of insulation. Moreover, the decision regarding the thermal mass of the envelope composition results in a difficult task by only considering the U value and the thermal conductivity. For instance, examining solution 1, despite that the roof layout (Rop7) is considered as “heavyweight” (Table 2), indicating that a roof layout with high thermal mass is adequate, the proposed TMD indicator suggests the opposite. This contradiction can be explained by the fact that even if a heavyweight material is presented in the envelope component layout, the amount of such material with respect to the total volume of the entire component layout is not significant. Rop7 (0.132 m thickness) presents a lower TMD value (where only about 14% of the entire layout is composed by the heavyweight material—asphalt, in this case, with the highest ρ c p value) than Rop6 (0.076 m thickness), which has the highest TMD value (where about 25% of the entire layout is composed by the heavyweight material—also asphalt in this case). This last remark helps realize that the roof layout thickness in the RB should be reconsidered.

5. Conclusions

The thermal performance analysis of an existing residential building (or reference building RB), considering occupant activities, construction materials, and local climate characteristics, was performed through dynamic simulations. This assessment was performed through thermal comfort indicators (mainly the adaptive comfort ASHRAE 55 with 80% acceptability, DH) and envelope heat gains. The RB model was validated by following the ASHRAE 14-2002 criteria NMBE and the electricity consumption monthly bills. The resulting envelope heat gains from the RB were analyzed through sensitivity analysis, which allowed us to identify that higher RB heat gains occur through the roof and external walls.
Due to ambiguity in using current envelope indicators, a thermal mass degree indicator (TMD) and an insulation degree indicator (ID) were proposed here to further assess the best envelope configurations (based on thermal mass and insulation) in the local climate. For such an assessment, an optimization analysis was performed where all envelope configurations at Pareto’s front (solutions) were analyzed using the proposed indicators (TMD and ID). This analysis showed that choosing a roof layout with high TMD and ID values might not be an adequate option, as the highest DH values were encountered. Besides, choosing an envelope configuration with a roof layout with low TMD and low ID values, along with wall and partition layouts with high TMD and low ID, seems to be an adequate option.
Finally, the proposed analysis can be implemented in the decision-making process in the early design stage of a new building, where more reliable thermal envelope indicators can be employed with less ambiguity expected, in terms of thermal mass content and insulation content for similar climates, along with various options of envelope layouts. Consequently, the utilization of the proposed indicators may make the selection of many others possible materials for the same building element easier since these indicators regard the thermal coupling between layers and may reach the same feasible values with different compositions. In this way, it could be possible to estimate the thermal performance and comfort due to new designs regarding novel material on the market and new configurations. Future works attempt to extend these results to experimental evidence to further confirm the usability extension of the proposed indicators.

Author Contributions

Original concept, supervision, and editing by M.C.A. and D.M.; introduction, figures, and writing of most of the manuscript by J.A. All authors have read and agreed to the published version of the manuscript.

Funding

This research was funded by Sistema Nacional de Investigación (SNI) as part of a Panamanian Institution Secretaria Nacional de Ciencia, Tecnología e Innovación (SENACYT) https://www.senacyt.gob.pa/ (accessed on 2 January 2022), project code FID18-056 and FIED19-R2-005.

Institutional Review Board Statement

Not applicable.

Informed Consent Statement

Not applicable.

Data Availability Statement

Not applicable.

Acknowledgments

The authors would like to thank the faculty of Mechanical Engineering within the Universidad Tecnológica de Panamá for their collaboration.

Conflicts of Interest

The authors declare no conflict of interest.

References

  1. Centro Nacional de Despacho. Sistema de Información en Tiempo Real (SITR): Generación; Centro Nacional de Despacho: Panama City, Panama, 2019. [Google Scholar]
  2. Agencia Internacional de Energías Renovables (IRENA). Evaluación del Estado de Preparación de las Energías Renovables: Panamá; Technical Report; Agencia Internacional de Energías Renovables: Abu Dhabi, United Arab Emirates, 2018. [Google Scholar]
  3. Secretaria Nacional de Energía. El Mercado Eléctrico de la República de Panamá; Secretaría Nacional de Energía: Panama City, Panama, 2017. [Google Scholar]
  4. International Energy Agency (IEA). 2019 Global Status Report for Buildings and Construction; UN Environment and IEA, 2019; Available online: https://www.worldgbc.org/sites/default/files/2019%20Global%20Status%20Report%20for%20Buildings%20and%20Construction.pdf (accessed on 2 January 2022).
  5. Pathirana, S.; Rodrigo, A.; Halwatura, R. Effect of building shape, orientation, window to wall ratios and zones on energy efficiency and thermal comfort of naturally ventilated houses in tropical climate. Int. J. Energy Environ. Eng. 2019, 10, 107–120. [Google Scholar] [CrossRef]
  6. Tian, W. A Review of Sensitivity Analysis Methods in Building Energy Analysis. Renew. Sustain. Energy Rev. 2018, 20, 411–419. [Google Scholar] [CrossRef]
  7. Seyedzadeh, S.; Pour Rahimian, F.; Rastogi, P.; Glesk, I. Tuning machine learning models for prediction of building energy loads. Sustain. Cities Soc. 2019, 47, 101484. [Google Scholar] [CrossRef]
  8. Mirrahimi, S.; Farid, M.; Chin, L. The effect of building envelope on the thermal comfort and energy saving for high-rise buildings in hot–humid climate. Renew. Sustain. Energy Rev. 2016, 53, 1508–1519. [Google Scholar] [CrossRef]
  9. Grandos, H. Principios y Estrategias del Diseño bioclimático en la Arquitectura y el Urbanismo, Eficiencia Energética; Consejo Superior de los Colegios de Arquitectos de España: Madrid, Spain, 2006. [Google Scholar]
  10. Baño, A. La Arquitectura Bioclimática: Términos Nuevos, Conceptos Antiguos. Introducción al diseño de Espacios Desde La óptica Medioambiental; Departamento de Arquitectura de la Universidad de Alcalá: Madrid, Spain, 2011. [Google Scholar]
  11. Johra, H.; Heiselberg, P.; Dréau, J.L.; Le, J. Influence of envelope, structural thermal mass and indoor content on the building heating energy flexibility. Energy Build. 2019, 183, 325–339. [Google Scholar] [CrossRef]
  12. Shao, T.; Zheng, W.; Jin, H. Analysis of the indoor thermal environment and passive energy-saving optimization design of rural dwellings in Zhalantun, inner mongolia, China. Sustainability 2020, 12, 1103. [Google Scholar] [CrossRef] [Green Version]
  13. Avendaño-Vera, C.; Martinez-Soto, A.; Marincioni, V. Determination of optimal thermal inertia of building materials for housing in different Chilean climate zones. Renew. Sustain. Energy Rev. 2020, 131, 110031. [Google Scholar] [CrossRef]
  14. Kaur, J.; Kaur, P.; Aggarwal, S.K. Thermal performance of a building envelope—An evaluative approach. IJRAR-Int. J. Res. Anal. Rev. 2017, 4, 122–128. [Google Scholar]
  15. Saikia, P.; Pancholi, M.; Sood, D.; Rakshit, D. Dynamic optimization of multi-retrofit building envelope for enhanced energy performance with a case study in hot Indian climate. Energy 2020, 197, 117263. [Google Scholar] [CrossRef]
  16. Rodriguez, C.M.; Alessandro, M.D.; D’Alessandro, M. Indoor thermal comfort review: The tropics as the next frontier. Urban Clim. 2019, 29, 100488. [Google Scholar] [CrossRef]
  17. Vicens, G.D.I.; Castro, S.S.; Vicente, R.; De Ignacio Vivens, G.; Soutullo Castro, S.; López-Zaldivar, O.; Lozano-Diez, R.V.; Verdú Vázquez, A. Sobre inercia térmica y aislamiento de viviendas en clima cálido-húmedo. On thermal inertia and insulation of buildings in warm-humid climate. ADE 2018, 4, 14–26. [Google Scholar] [CrossRef] [Green Version]
  18. Silvero, F.; Rodrigues, F.; Montelpare, S. A parametric study and performance evaluation of energy retrofit solutions for buildings located in the hot-humid climate of Paraguay—Sensitivity analysis. Energies 2019, 12, 427. [Google Scholar] [CrossRef] [Green Version]
  19. Araúz, J.; Mora, D.; Chen Austin, M. Impact of the Envelope Layout in the Thermal Behavior of Buildings in Panama: A Numerical Study. In Proceedings of the 7th International Engineering, Sciences and Technology Conference (IESTEC), Panama City, Panama, 9–11 October 2019; IEEE: Panama City, Panama, 2019; pp. 209–214. [Google Scholar] [CrossRef]
  20. Gaceta Oficial, Resolución de la JTIA N°035, 26 de junio 2019; Ministerio de Obras Públicas/Junta Técnica de Ingeniería y Arquitectura: Panama City, Panama, 2019; p. 61.
  21. Mora, D.; Araúz, J.; Chen Austin, M. Towards Nearly Zero Energy Buildings in Panama through Low-Consumption Techniques: A Numerical Study towards Nearly Zero Energy Buildings in Panama through Low-Consumption Techniques: A Numerical Study. In Proceedings of the AIP Conference, Panama City, Panama, 17 December 2019; p. 2191. [Google Scholar] [CrossRef]
  22. Canto, A.; Batista, M.; Sanchez, J.; James, A. Aislante térmico a base de materiales orgánicos Development of a thermal-insulation based on organic materials. Rev. Iniciacion Cient. 2018, 4, 48–51. [Google Scholar] [CrossRef]
  23. Labastid, D.; Bolobosky, M.; Mogollón, L.; James, A. Implementación de un Intercambiador de Calor en Techos de Zinc. KEG 2018, 3, 747. [Google Scholar] [CrossRef] [Green Version]
  24. Segundo, D.; Araúz, A.; Mora, A.; Perén, J.I. Primer paso en la eficiencia energética, confort ambiental y sostenibilidad de edificios en Panamá: Percepción ambiental de usuarios de la Casa Matriz del Banco Nacional de Panamá. Rev. Iniciacion Cient. 2017, 3, 70–75. [Google Scholar]
  25. Carvajal, R.; Robles, J.; Solís, J.; Vargas, J.; Marín, N. Sistema de análisis energético y de temperatura de las ventanas de un aula de clase con y sin aislamiento térmico Energetic and temperature analysis system of classroom windows with and without thermal insulation. Rev. Iniciacion Cient. 2018, 4, 26–30. [Google Scholar] [CrossRef]
  26. Carver, S.; Mikkelsen, N.; Woodward, J. Long-term rates of mass wasting in Mesters Vig, northeast Greenland: Notes on a re-survey. Permafr. Periglac. Process. 2002, 13, 243–249. [Google Scholar] [CrossRef]
  27. Ruiz, G.R.; Bandera, C.F. Validation of calibrated energy models: Common errors. Energies 2017, 10, 1587. [Google Scholar] [CrossRef] [Green Version]
  28. DesignBuilder Software Ltd.—Optimisation. Available online: https://designbuilder.co.uk/optimisation (accessed on 2 January 2022).
  29. Gaceta Oficial; Secretaría Nacional de Energía. Resolución N° 3142 del 17 de Noviembre de 2016, que Adopta la guía de Construcción Sostenible Para el Ahorro de energía en Edificaciones y Medidas Para el uso Racional y Eficiente de la Energía, para la Construcción de Nuevas Edificaciones en la República; Secretaría Nacional de Energía: Panama City, Panama, 2016; Volume 3142, pp. 1–66. [Google Scholar]
  30. Raut, A.; Khatoon, S.; Goud, P. A comparative study on effects of various insulating layers of roof system on energy usage of building envelope. IOP Conf. Ser. Earth Environ. Sci. 2019, 354, 012055. [Google Scholar] [CrossRef]
  31. Serra Florensa, R.; Coch Roura, H. Arquitectura y Energía Natural, 1st ed.; Number 40 in Politext; Edicions UPC: Barcelona, Spain, 1995. [Google Scholar]
  32. Mahony, C.; Koenigsberger, O.H.; Evans, M. Climate and House Design; United Nations: New York, NY, USA, 1971; p. 93. [Google Scholar]
  33. Jannat, N.; Hussien, A.; Abdullah, B.; Cotgrave, A. A comparative simulation study of the thermal performances of the building envelope wall materials in the tropics. Sustainability 2020, 12, 4892. [Google Scholar] [CrossRef]
Figure 1. Location of the reference building (inside the black box).
Sustainability 14 02013 g001
Figure 2. Reference building in DesignBuilder: (a) 3D model with surrounded buildings and (b) plan view oriented 297°.
Sustainability 14 02013 g002
Figure 3. Monthly-averaged simulation results: comfort indicators (a,b) where PMV (in blue) with right axis scale, (c) heat gains through the envelope, and (d) internal heat gains.
Sustainability 14 02013 g003
Figure 4. Pareto’s front results from optimization analysis with yearly simulations, from minimizing roof and walls gains: (a) heat gains, (b) envelope configurations, and (c) DH.
Sustainability 14 02013 g004
Figure 5. Envelope indicators for roof-ceiling, external walls, and internal partition layouts at Pareto’s front comparing the thermal mass degree.
Sustainability 14 02013 g005
Figure 6. Envelope indicators for roof-ceiling, external walls, and internal partition layouts at Pareto’s front comparing the insulation degree.
Sustainability 14 02013 g006
Figure 7. Pareto’s front results from optimization analysis with yearly simulations, from minimizing roof gains and DH: (a) heat gains, (b) envelope configurations, and (c) DH.
Sustainability 14 02013 g007
Figure 8. Envelope indicators for roof-ceiling, external walls, and internal partition layouts at Pareto’s front: (a) TMD and (b) ID values.
Sustainability 14 02013 g008
Table 1. Estimated occupation and consumption profiles.
Occupancy and Energy ConsumptionProfiles
  Overall occupation (3 people)Mon to Fri: 19h00 a 05h00
Sat to Sun: 0h00 a 23h59
Luminaires in common areas:
hallway, garage, laundry, and kitchen (15 W)
  Sun to Sat: 19h00 a 07h00
Room luminaire (15 W)Sun to Sat: 19h00 a 22h00
  Dining room fans (50 W)Mon to Fri: 05h00 a 06h30
Sat to Sun: 17h00 a 22h00
Room fans (50 W)Sun to Sat: 22h00 a 05h00
PC: desktop (40 W)Sun to Sat: 19h00 a 01h00
Refrigerator (70 W)Sun to Sat: 00h00 a 23h59
Air conditioner (1 TON)Sun to Sat: 22h00 a 05h00
Table 2. Roof layouts tested.
Layout  e (m)k
(W/m-K)
ρ
(kg/m 3 )
c p
(J/Kg-K)
ρ c p e
(×10 3 )
U
(W/m 2 K)
  TMD  ID
RRBZinc0.000511370003901.367.143-3.16 × 10 5
Rop1Stone
chipping
0.0250.9618001000453.4390.320.3355
Asphalt0.0190.72100100039.9
screed0.040.41120084040.3
Rop2Asphalt0.0190.72100100039.90.2520.80.904
Fireboard0.0130.0630010003.9
XPS Extruded
Polystyrene
CO 2 blowing
0.1220.0343514005.98
Rop3Clay Tile0.02512000800400.2110.820.9595
MW Stone0.18190.04308404.58
Roofing Felt0.0050.199608374.02
Rop4Asphalt0.0190.72100100039.90.4860.240.6861
Fireboard0.0130.0630010003.9
XPS Extruded
Polystyrene
CO 2 blowing
0.0480.0343514002.35
Cast Concrete0.10.3812001000120
Rop5Zinc0.000511370003901.360.4960.460.93
EPS Standard0.0750.041514001.57
Rop6Asphalt0.0190.72100100039.90.2580.870.334
Fireboard0.0130.0630010003.9
XPS Extruded
Polystyrene
CO 2 blowing
0.0440.0343514002.16
Rop7Asphalt0.0190.72100100039.91.5460.2440.335
Fireboard0.0130.0630010003.9
Cast Concrete0.10.3812001000120
Table 3. Partition layouts.
Layoute (m)k
(W/m-K)
ρ
(kg/m 3 )
c p
(J/Kg-K)
ρ c p e
(×10 3 )
U
(W/m 2 K)
TMDID
PRBCement/plaster/
mortar-cement blocks
0.010.33204052010.63.0170.920.091
Concrete block
(heavyweight)
0.11.6310002300230
Cement/plaster/
mortar-cement blocks
0.010.33204052010.6
Pop1Brickwork outer0.1050.848001700142.80.8250.60.5156
Air gap0.0250.0451.2100130.03
Phenolic foam0.0250.041400301.05
Concrete block
(heavyweight)
0.11.6310002300230
Plaster (lightweight)0.0130.1610006007.8
Pop2Brickwork outer0.1050.848001700142.80.4650.620.5813
Urea formaldehyde
Foam
0.050.041400100.7
Thermalite high
strength
0.10.19105076079.8
Plaster (lightweight)0.0130.1610006007.8
Pop3Brickwork outer0.1050.848001700142.81.5620.4721.74
Air gap0.050.0451.2100160.06
Brickwork inner0.1050.628001700142.8
Plaster (dense)0.0130.51000130016.9
Pop4Concrete block
(lightweight)
0.10.191000600601.272-0.6695
Pop5Plaster (lightweight)0.0130.1610006007.81.0540.1030.0856
Concrete block
(lightweight)
0.10.19100060060
Plaster (lightweight)0.0130.1610006007.8
Pop6Plaster (lightweight)0.0130.1610006007.82.0670.9360.168
Concrete block
(heavyweight)
0.11.6310002300230
Plaster (lightweight)0.0130.1610006007.8
Pop7Brickwork outer0.1050.848001700142.80.5960.6030.3725
Air gap 10 mm0.0250.0451.2100130.03
Phenolic foam0.0250.041400301.05
Concrete block
(lightweight)
0.10.19100060060
Plaster (lightweight)0.0130.1610006007.8
Pop8Gypsum plasterboard0.0150.25100090013.51.8870.50.1132
Air gap 10 mm0.050.0451.2100160.06
Gypsum plasterboard0.0150.25100090013.5
Pop9Plywood (heavyweight)0.10.15142070099.41.195-0.7967
Table 4. External wall layouts.
Layoute (m)k
(W/m-K)
ρ
(kg/m 3 )
c p
(J/Kg-K)
ρ c p e
(×10 3 )
U
(W/m 2 -K)
TMDID
WRBCement/plaster/
mortar-cement blocks
0.010.33204052010.63.8590.9160.1169
Concrete block
(heavyweight)
0.11.6310002300230
Cement/plaster/
mortar-cement blocks
0.010.33204052010.6
Wop1Brickwork outer0.1050.848001700142.80.2510.4640.8674
XPS Extruded
Polystyrene
CO 2 blowing
0.11750.0341400355.76
Concrete block
(medium)
0.10.5110001400140
Gypsum plastering0.0130.41000100013
Wop2Brickwork outer0.1050.848001700142.80.1560.4670.9176
XPS Extruded
Polystyrene
CO 2 blowing
0.20.0341400359.8
Concrete block
(medium)
0.1050.5110001400147
Gypsum plastering0.0150.41000100015
Wop3Lightweight metallic
cladding
0.0060.29100012507.50.3750.3050.9154
XPS Extruded
Polystyrene
CO 2 blowing
0.0830.0341400354.1
Gypsum plastering0.0130.41000100013
Wop4Brickwork outer0.10.8480017001360.3510.4780.8197
XPS Extruded
Polystyrene
CO 2 blowing
0.07940.0341400353.89
Concrete block
(medium)
0.10.5110001400140
Gypsum plastering0.0130.41000100013
Wop5Brickwork outer0.1050.848001700142.82.0710.4890.067
Brickwork inner0.10.628001700136
Gypsum plastering0.0130.41000100013
Wop6Brickwork outer0.1050.848001700142.80.8250.6030.5156
Air gap0.0250.0451.2100130.03
Phenolic foam0.0250.041400301.05
Concrete block
(heavyweight)
0.11.6310002300230
Plaster (lightweight)0.0130.1610006007.8
Wop7Brickwork outer0.1050.848001700142.80.5960.870.3725
Air gap 10 mm0.0250.0451.2100130.03
Phenolic foam0.0250.041400301.05
Concrete block
(lightweight)
0.10.19100060060
Plaster (lightweight)0.0130.1610006007.8
Wop8Concrete block
(lightweight)
0.20.1910006001200.7080.0260.3933
Air gap 10 mm0.0250.0451.2100130.03
Steel0.0015045078003.51
Gypsum plasterboard0.010.2510009009
Wop9Plywood
(heavyweight)
0.10.15142070099.41.195-0.7967
Table 5. Comparison between energy consumption for model validation.
MonthsEnergy Consumption from Simulation
(kWh)
Energy Consumption from Bills
(kWh)
Jan252.67266.00
Feb228.93225.00
Mar254.51216.00
Apr244.76216.00
May252.67232.00
Jun246.60232.00
Jul252.67232.00
Aug253.59289.00
Sep245.68231.00
Oct252.67228.00
Nov245.68231.00
Dec253.59260.00
Table 6. Comparison of the energy consumption due to air conditioner usage.
Energy Consumption Due to Air Conditioner (kWh)
MonthsJanuaryFebruaryMarchAprilMayJuneJulyAugustSeptemberOctoberNovemberDecember
RB76.061.965.578.290.092.388.792.790.492.486.790.0
RB+Pareto174.053.458.962.976.987.385.878.190.091.083.185.7
Difference (%)2.613.710.119.614.65.43.315.70.41.54.24.8
Publisher’s Note: MDPI stays neutral with regard to jurisdictional claims in published maps and institutional affiliations.

