Article

Walkability Compass—A Space Syntax Solution for Comparative Studies

by
Kestutis Zaleckis
1,
Szymon Chmielewski
2,*,
Jūratė Kamičaitytė
1,
Indre Grazuleviciute-Vileniske
1 and
Halina Lipińska
2
1
Faculty of Civil Engineering and Architecture, Kaunas University of Technology, 48-413 Kaunas, Lithuania
2
Department of Grassland and Landscape Studies, University of Life Sciences in Lublin, 20-950 Lublin, Poland
*
Author to whom correspondence should be addressed.
Sustainability 2022, 14(4), 2033; https://doi.org/10.3390/su14042033
Submission received: 21 January 2022 / Revised: 3 February 2022 / Accepted: 7 February 2022 / Published: 11 February 2022
(This article belongs to the Special Issue Quantifying Landscape for Sustainable Land Use Planning)

Abstract

:
The ongoing discourse on air quality and climate changes positions walkability as a pivotal point of sustainable urban planning. Urban studies examine a city’s walkability in terms of pedestrian flows, design qualities, and street network topology, leaving walkability comparative frameworks under development. Building on the space syntax theory, this research introduces a “walkability compass”, a four spatial indicator-designed tool for city walkability assessment and comparison. The tools are being tested on eight Baltic region cities: Vilnius, Kaunas (LT), Malmö (SE), Riga (LV), Tallinn (ES), Gdansk, Bialystok, Lublin (PL). The nine-step method framework integrates four indexes: Gravity (Gr), Reach (Re), Straightness (St), and Population density (Pop). The “walkability compass” results reveal significant Re and St correlations; thus, visual and cultural aspects become the main factors in pedestrian-friendly cities. The spatial pattern typology has matched similar cities (Malmö and Kaunas) to work closely on sustainable urban planning development. In all case studies, specific walkability zones were mapped, but the Gr zones turned out to be the most compact ones (the Z-score of Gr was ranged from 355.4 to 584; other indexes oscillated between 209.4 and 542.6). The walkability mapping results are publicly shared via WebMap to stimulate the participatory discussion on case studies cities further development.

1. Introduction

1.1. Walkability Understanding

Walking has been the fundamental way of moving in cities since this territorial form of living. However, since the industrial revolution of the 20th century, urban planning was increasingly re-oriented towards dimensions and speed of automobiles; therefore, numerous features of urban space, lifestyle and consumption have changed dramatically. Nowadays, most cities are heavily dependent on private cars [1]. Furthermore, the looming climate change mitigation and adaptation challenges urge rethinking urban lifestyles and particularly the movement in cities. Moreover, the COVID-19 (coronavirus disease 2019) pandemic accelerated the need for walkable neighbourhood development, especially within metropolitan areas [2]. The discussion on sustainable urban forms has rolled since the 1990s [3], and nowadays urban systems are becoming a major nexus of global sustainability [4]. Numerous research studies turn back to walking in cities and the suitability of urban environments for walking—walkability. Walkability is a composite measure of how friendly an area is to walking, thus regarded as a critical factor striving towards urban sustainability [5,6]. Leslie and Edwards (2006) define walkability as “the extent to which characteristics of the built environment and land use may or may not be conducive to residents in the area walking for either leisure, exercise or recreation, to access services, or to travel to work” [7]. Walkability is recognised as the property of a residential environment that promotes cycling with safety, comfort, and easy access to the attractions of daily life [8]. Walkability can also enhance issues not directly related to urban transport, such as nature appreciation or cultural geography teaching [8]. Moreover, the road network system’s historical analysis can bring some narrative interpretations into a walk [9]; however, these approaches are more familiar to the most recent rural rather than urban geography studies [10].
Walkability is also investigated using space syntax theory (explained in the next section), urban design, lifestyle, and spatial features [11]. Notably, the study uses space syntax theory and contributes to walkability research. Furthermore, the research method uses a graph theory to calculate spatial indexes, making the walkability phenomenon more predictive. Moreover, the study provides a decision support tool—the “walkability compass”. The tool aims to diagnose and compare cities’ walkability or neighbourhoods. The “compass” idea we describe (Section 2.2.3) and discuss (Section 5) is in terms of spatial planning implementation; hence, these research results may impact sustainable city development strategies as well.

1.2. Explaining Walkability with Space Syntax

1.2.1. Space Syntax as Background Theory

This research uses space syntax as a background theory and its spatial indexes to explain the walkability phenomenon, explicitly comparing studies scientifically. The term space syntax was conceived by Hillier and Hanson (1984) [12]; it uses a graph theory to analyse the spatial configurations related to how people move and adopt. The space syntax quantifies the spatial layout using topological distance approaches in network analysis. In practice, it can be applied both to street layout and enclosed within building spaces. Basically, the theory distinguishes the “spaces” and “routes” and ranks them from the most integrated to most segregated; the more integrated a space or route, the easier it is to reach. The assumption mentioned above became the basis for the Re index, also used in this research. Although space syntax uses several spatial measures, their theoretical background and calculation process has been described by, among others, (2003) and Peponis and Wineman (2002) [13,14] and will not be described in the details here.
Moreover, a comprehensive overview of evolving space syntax concepts and analytical techniques has been recently (2021) presented by Yamu et al. [15]. The review starts from the very beginning of the Hillier (1937–2019) space syntax concept, through a convex map, axial map, isovist field, to the most recent concepts such as segment map and agent-based modelling. In the context of walkability analysis, the review points out the relationship between building density and transportation as key aspects of cities’ sustainability; this study follows the above interpretation (details of PoP metrics in the method section) [15]. Across the walkability interdisciplinary research methods, the time accessibility analysis [16,17] and the graph theory can be applied; however, no study has started to apply both criteria simultaneously to assess their impact on pedestrian movement patterns [18]. The pedestrian trajectory can also be used as a related method of walking condition assessment [19]. The Space Syntax techniques are well-recognised approaches in this field. The Space Syntax interprets street network geometry using, among others, the connectivity and integration measures [12]. Street connectivity as a property of street network reflecting favourability for walking, which in three reviewed cases out of four is counted as the density of crossroads.
It should be noted that the plain number of intersections addresses just the density of the street network and potential walking routes but says nothing about the character of urban spaces related to visibility, street facades. Furthermore, the number of objects could be a more precise and straightforward way to measure proximity. At the same time, the land use mix addresses it indirectly based on the premise that more land use functions create more potential travel destinations. Importantly, the residential or dwelling density identifies the concentration of walkers and the starting points of walking journeys. The connectivity and the integration as core space syntax measures [20] can contribute to walkability understanding [21]. Notwithstanding, they leave the passers-by visual contact to the urban feature unrecognised. The sole ability to quickly reach as many destinations as possible, preferably in a straight line, does not make the city walkable. The nature of the environment in which a person moves is of key importance here. The more diverse functions and the higher density of buildings within a short distance, the more walkable the space is [22]. Space Syntax, using physical features such as street networks, points of interest (POI) or buildings footprints, can also explain visual perception qualities [23]. The visual graph analysis, built on the logic of isovist analysis [24] by default applied on an at-eye level to estimate what people can see, can also be used on an at-knee level to investigate where people can move [25]. Moreover, studies on pedestrian walking behaviour [26] showed that the visibility of specific spaces impacts pedestrian wayfinding choices and triggers intentional visual design practice [27]. Similar relationships were established for mixed land use [28]. This transfers space syntax to urban design practice. Unless the space syntax cannot predict featured societal effects, it can provide well identifications and descriptions of spatial properties [29]. Furthermore, to make the walkability frameworks comprehensive, up to three research levels are recommended to be set up: physicals, perceptual and individual [30]; our research uses four different measures to maintain this standard.

1.2.2. The Growing Interest in Space Syntax Application into Walkability Studies—A Systematic Literature Review

The following literature review concerns research that uses space syntax tools to explain city walkability. The growing importance of walkability in cities and various approaches towards its analysis is reflected in the increasing number and diversifying content of scientific publications; the quantitative and qualitative methods can reveal this trend. First, the quantitative approach involved a Web of Science (WoS) search query. Next, the qualitative process involves selected paper content analysis using “walkability” and “space syntax” keywords—the query resulted in more than 2500 scientific papers. Since the first publications in 2001 [31], the interest in space syntax-based walkability studies has grown to 360 scientific papers dated 2020. The walkability topic falls in public occupational, environmental health, transportation and environmental-oriented journals, but the urban studies research field is foremost. Importantly, it is an issue usually studied using space syntax theory. The international literature’s graphical connotations between space syntax and walkability are described in Figure 1.
Both keywords were reported jointly, but concerning the walkability research, two research methods have been distinguished, the first using on-site data collection (e.g., field surveys) and the second based on geospatial data approaches, which this research belongs to. On-site data collection tools such as, e.g., the Path Environment Audit Tool, Walking Suitability Assessment Form, Neighbourhood Environment Walkability Survey, among others, takes into account urban factors such as pedestrian counting and direct observations of human activities [33], street width, street flatness, street cleanliness, shade coverage, presence of trees and sound decibels [34]. Furthermore, survey-based walkability assessments may include subjective data, such as people’s perceptions of aesthetics, traffic and crime safety, or neighbourhood satisfaction [35]. For example, Frank et al.’s [36] Walkability Index can be given regarding geospatial approaches. The index considers the net residential density, street connectivity, and land-use diversity.
On the other hand, the WalkScore algorithm, created by Front Seat Management LLC, calculates neighbourhood walkability by assigning a 1.6 km buffer zone around the participant’s residential address and assessing the presence of facilities in the buffer zone, population density and road metrics [6]. The WalkScore is a well-recognised tool for quantitative analysis or a walk-friendly environment [35], despite its criticism on the lack of topological structure [37]. A brief comparison of space syntax-related case studies is presented in Table 1. The examples use essential walkability explanatory indexes: street connectivity, land use mix [36], residential density [38,39]. An additional indexes are: frequency and variety of buildings, entrances and other sensations along street frontages, transparency, such as the amount of glass in windows and doors, orientation and proximity of homes, structures to observe over the street, plenty of places to go to near the majority of homes (services such as stores, restaurants, bars, theatres, schools, parks or sport centres) [5,6,40], hilliness, the presence of bus stops, street lamps, and trees [41], and retail floor area ratio as the ratio of a building’s total floor area (gross floor area) to the size of the piece of land upon which it is built [5]. The multitude of spatial indicators reflects the interpretative potential of the space syntax. On the one hand, this potential offers great analytical opportunities; however, on the other hand, it becomes the starting point for the simple index searching that allows us to understand the walkability in its essence, which was the starting point of our research too.
Nonetheless, the complementing walkability concept with a visual relation to the building’s facades, so architectural and urban design visual qualities, becomes the second focus of our research. Specifically, we selected space syntax indices that explain the visible link between an urban space where the walk takes place and building facades accompanying a passer-by. However, there is still a lack of scientific reports on space syntax visual quality analysis that contributes to walkability research. Therefore, we propose a comparative framework to interpret specific space syntax metrics emphasising walkability visual perception qualities to fill this knowledge gap. The study aims to set up a comparative framework with a limited number of indicators but suitable for city walkability physical and visual quality analysis. We assume that the framework will be based on open spatial data with global coverage. We hypothesise that statistically significant correlations between analysed indices reveal spatial patterns of city walkability, and their synergy, like a compass, points to the strengths and weaknesses. Notably, the research method shifts from the street network analysis (we use it at the model validation stage) and follows mathematical graph centrality calculations proposed by [43,44]. The approach involves building footprint geometry for space syntax calculation, specifically the Reach (Re) and the Straightness (St) indices, herein used as walkability visual quality explanatory indicators. To make the framework comprehensive, we also provide the Gravity index (Gr) and Population density (PoP) measures (the framework indexes are described in detail in the method section). The study contributes to the walkability research by extending its paradigm to urban form quality, making the critical factor of city sustainability better known at the background of space syntax theory. The research framework contributes to walkability science too. The proposed “walkability compass” graphically expresses the synergy between factors shaping walking-friendly urban spaces.
The “compass” evaluates the agreement between walkability explanatory variables, which we interpret as a synergy of urban design qualities with several walk destinations and inhabitant density. Foremost, the presented walkability concept takes after the 15 min city idea [45], thus providing insights to urban planners involved in city sustainable development and SDG 2030 no. 11 achievement [46]. Lastly, this research looks for a relatively simple and repetitive method with clear spatial indexes so that its execution would not carry high costs and systematic errors and could be replicated using global extent open geospatial data. Nevertheless, the input data level of details refers to the street level as required by the very concept of walkability, drawn from the perspective of a pedestrian moving between buildings. The Open Street Map [47] and Copernicus Living Atlas [48] open geospatial datasets meet the requirements mentioned above and feed this framework geodatabase. As walkability is an issue for each inhabitant, we share the research results via an open and intuitive web mapping application, thus building open access to walkability knowledge.

2. Method

2.1. The Case Study Cities Description

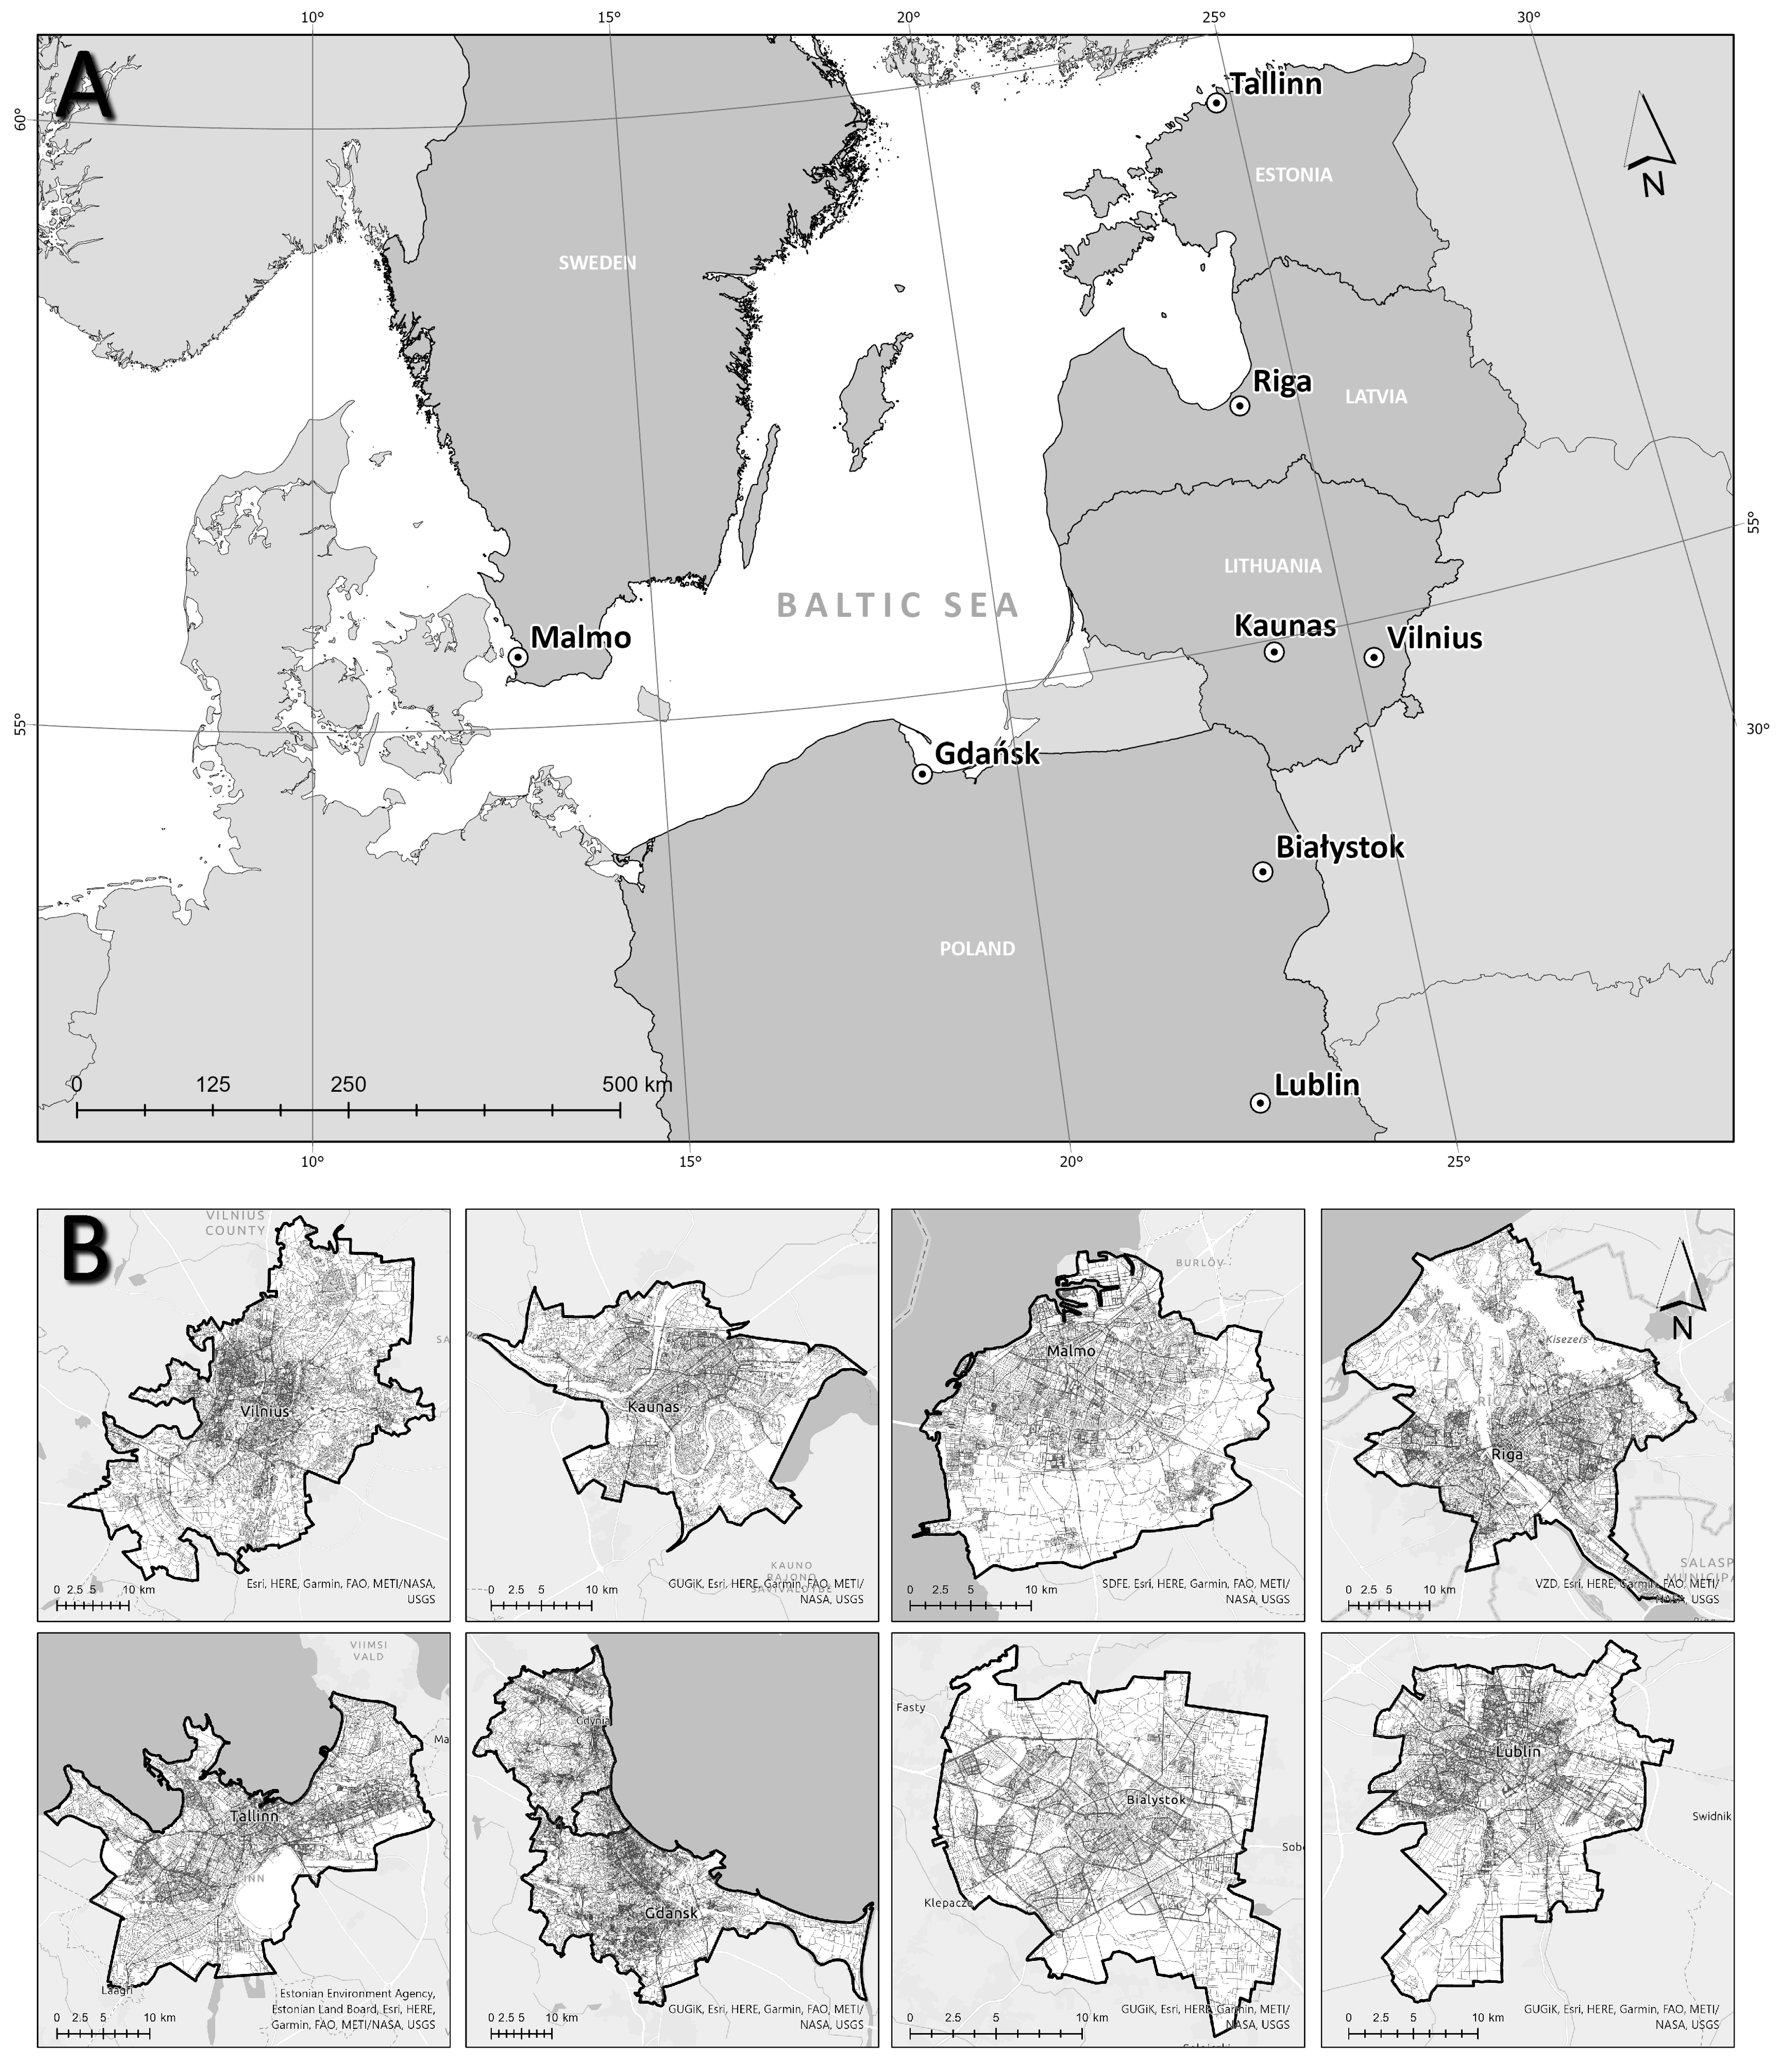
The proposed walkability compass and spatial pattern comparison method is not a sole theoretical framework since it is tested on eight case study cities. Moreover, the case studies are not related; however, the choices result from the possibility of field verifying research outcomes by the authors’ team (live there or know these cities from visits). As case studies, the following cities were selected: Vilnius, Kaunas, Malmö, Riga, Tallinn, Gdansk, Bialystok, Lublin. Below we describe them briefly and present the geographical location within the Baltic Sea region (Figure 2).
Tallinn, Riga and Vilnius are the capitals of three Baltic States: Estonia, Latvia, and Lithuania, respectively. Vilnius is the largest city in Lithuania, located in the country’s southeastern area. According to the differentiation of the city’s functioning, the differences in the quality of life and the peculiarity of the environment, the city of Vilnius is divided into three zones of the city structure: central, secondary (historical suburbs, middle of the 20th c. mass-construction residential, industrial areas) and peripheral (extensively urbanised and non-urbanised areas) [49]. The master plan of Vilnius gives priority to the development of green spaces, modernisation of the residential regions, development of social infrastructure, pedestrian and cycle paths, public transport and the sharing economy that is closely related to city walkability increase. Vilnius and Kaunas are the first-level centres in the urban framework of Lithuania. Kaunas is within the leading Lithuanian roads and national and international axis of integration, located in the central part of Lithuania. The city has a concentric urban structure; the Old and New Town are next to Nemunas and Neris rivers confluence [50].
Malmö is Sweden’s third-largest city in the southernmost province of Skåne, a central transport hub in southern Sweden. The city pays much attention to sustainable mobility. Riga is the largest city of Latvia, located on the Gulf of Riga at the mouth of the Daugava. Riga is home to a third of Latvia’s population and is the largest city in the Baltic States. According to the Sustainable Development Strategy of Riga, until 2030 [51], the city will strive to become pedestrian, cyclist, and public transport-friendly. Tallinn is the economic centre and most important port in the north of Estonia, on the Gulf of Finland in the Baltic Sea. According to Tallinn’s development strategy [52], the goal is to compact the city centre, help make more efficient use of Tallinn’s space, provide an alternative high-quality living environment and limit urban sprawl. Gdansk is a county town in northern Poland, on the Gulf of Gdańsk on the Baltic Sea. Since 2011, Gdańsk, together with Sopot and Gdynia, created the metropolitan area established to strengthen cooperation and achieve harmonious development. It has a typical linear structure for transit-oriented development cities. Bialystok is the largest city in northeastern Poland, the administrative centre of Podlaskie voivodship. About 17.2% of the municipality is forested, and it is the fifth most forested city in the country. Lublin is a county town in southeastern Poland, the administrative centre of the Lublin Voivodeship.

2.2. The Research Method

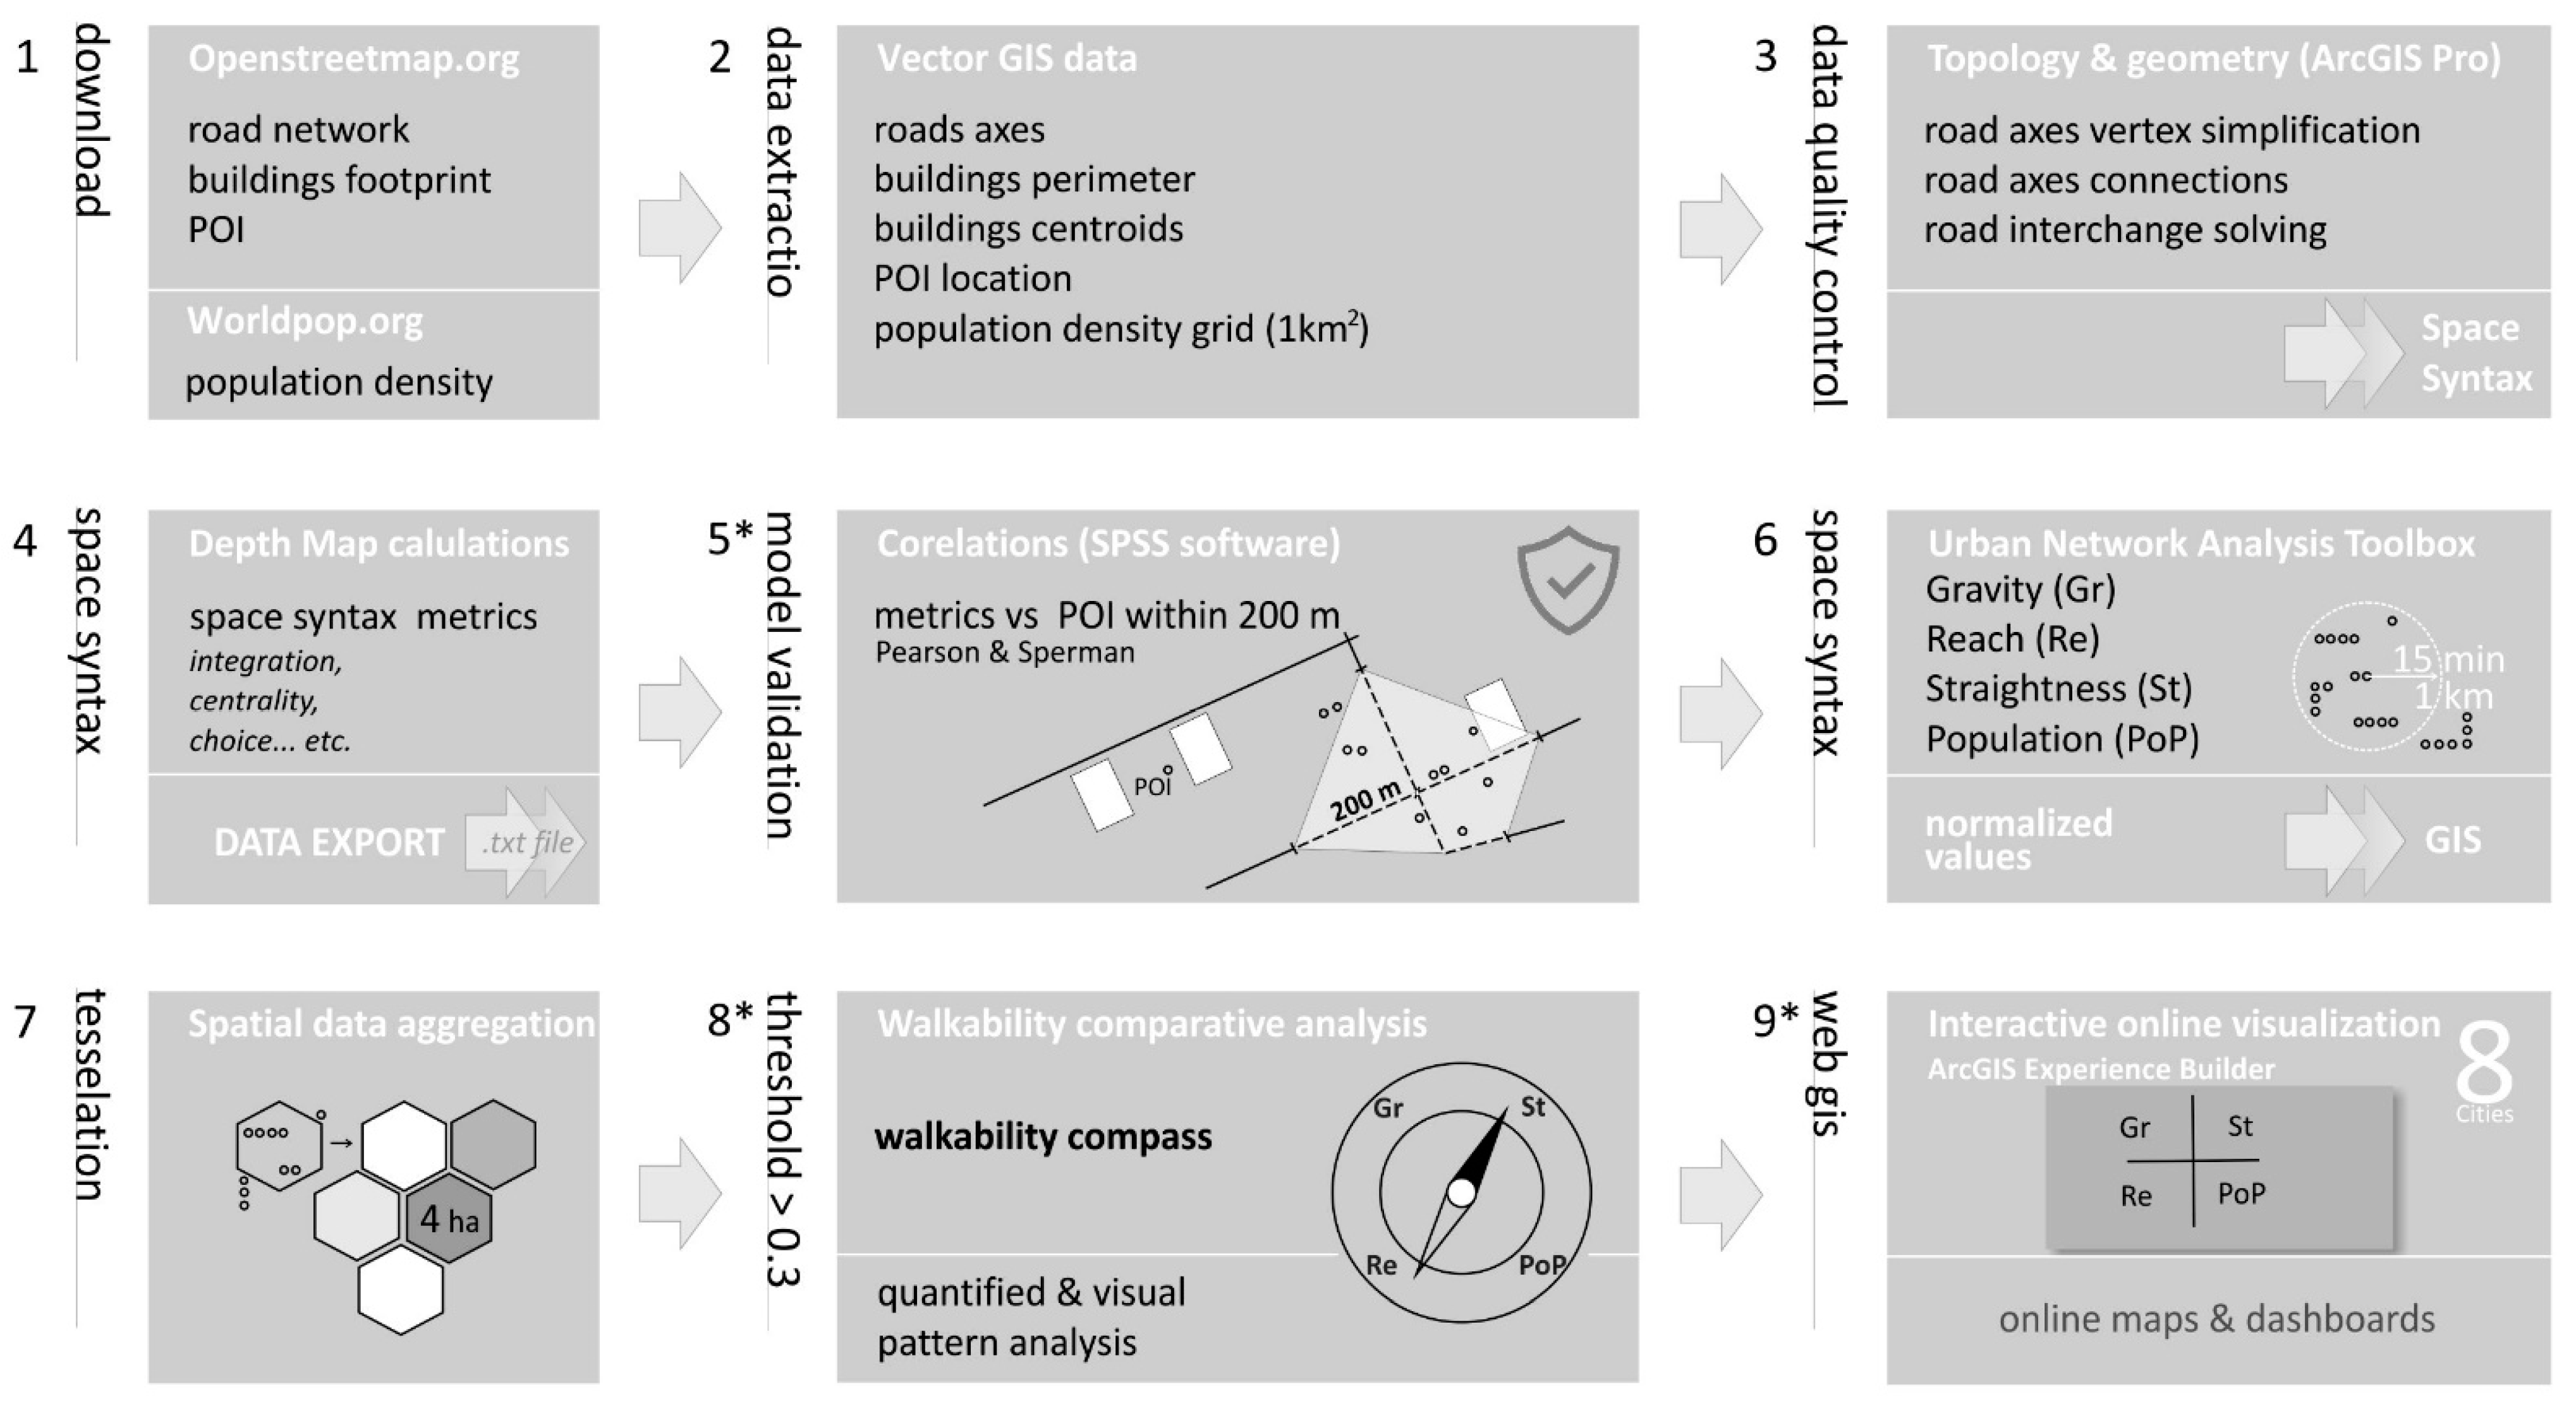
The research framework comprises nine stages involving space syntax, geographic information systems (GIS) and statistical methods. Each step has been graphically described at the method workflow (Figure 3), detailing its implementation software. Basically, the 1st to the 3rd stages aim to open geospatial data acquisition along with topology quality assurance. For those starting from the 4th to 6th, the framework integrates space syntax tools; the 5th validates the space syntax calculation results using basic statistical methods, and the three last steps, from the 7th to the 9th, consume space syntax calculations to execute pattern analysis (7th and 8th) and interactively visualise the case study cities’ walkability using the “walkability compass”. The following section describes the method details, while steps 5, 8 and 9 are also subjects of research outcomes reporting (Section 4).

2.2.1. Open Geospatial Data Management Method (Steps 1–3)

The first stage aims to download the open geospatial data on road street networks: building footprint, road network (cars and pedestrian road axis), points of interest (POI) and public transport bus stops. The core data were obtained from the openstreetmap.org [47] project, specifically the geofabric.de [53] server, which sorts the city databases into ready-to-download packages, thus imposing no restrictions on the amount of downloaded data. Next, the city administration boundary was downloaded from Living Atlas (2018) [48] database. Data were retrieved in Esri Shapefile format and transformed into the following EPSG coordinate system: 2180 (PL), 3346 (LT), 3059 (LV), 3301 (ES) and 3006 (SE). Since the Space Syntax technique requires a slightly wider extent of spatial datasets relating to the core research area, the data were downloaded with a buffer zone of no less than 4 km from the cities’ administrative borders. However, no equal buffer zones were used; the input data were clipped to the geometry of the main roads (city ring roads) surrounding the city’s administrative borders rather than an equal buffer zone. Such an approach results from the specificity of the space syntax method, which is based on the geometric properties of the streets network, which we had to maintain concerning analysed area borders.
In the second step (Figure 3, the following source layers for space syntax calculations were extracted: road axes, building footprints with perimeter and area attributes, POI and population density 1 km2 grid. Additionally, the building’s footprint geometrical parameters were calculated too. Any errors in the urban street network geometry are a potential cause of space syntax biases. Therefore, the third step aims at spatial data topology control and geometry simplification. In order to reduce the street network vertex number, the generalisation procedure was the 3 m radius parameter was set up. The task includes deleting excessive roads from the street network, e.g., sidewalks, duplicated central street lines, and some secondary roads; reconnecting isolated street lines; identification of bridges and tunnels and marking two-level crossroads. The topology rule, as well as geometry simplification (3 m radius), were executed using ArcGIS Pro (v2.8) software (Environmental Systems Research Institute, Redlands, CA, USA) [54]. The case study cities’ buildings of active industrial production and buildings with a storage function were eliminated since they do not support street culture and walkability. The quality control-passed database was used for further calculations (the 4th step).

2.2.2. Space Syntax Calculations Method (Steps 4–6)

Next, the graph analysis of the street network as a pre-validation of the graph model was performed in the 4th step (validated in step 5). In total, the seven following Space Syntax metrics, including angular segment measures [55] and metric segment measures [23], were calculated using different analysis radius size parameters:
  • Angular segment choice or betweenness centrality, which identifies the probable axes of transit within various radiuses and is calculated as a sum of simulated journeys according to the shortest paths between nodes;
  • Angular segment integration or closeness centrality, which identifies the possible zones of attraction or urban centres within various radiuses; it is calculated as reciprocal to a sum of distances between the nodes multiplied by a segment number in Space Syntax Segment analysis;
  • Metric segment choice within a radius of 1000 m differs from angular segment choice in how the shortest path is found: it is based on measured distances instead of a sum of angles of the turns on the path. According to Hillier [56], metric distances reflect pedestrian behaviour better in some cases;
  • Metric reach within the radius of 1000 m as the length of the reachable street network;
  • The total metric depth of 1000 as a sum of distances between nodes while distance is calculated in meters;
  • Node count as several nodes/street segments within selected radiuses;
  • Angular segment total depth as a sum of distances between nodes while distance is calculated in angles of turns.
Step 4 was executed using open-source DepthMapX (v. 0.8) software (Space Syntax Limited, London, UK) [57]. The calculation results exported as a text file to SPSS software were the subject of the correlation analysis aimed to validate the model.
The validation performed in the 5th step allowed us to assess whether the Space Syntax model works properly and reflects regularities of the fundamental urban functions. The obtained measures are not random and reflect the urban structure recorded in the spatial data. Any potential lack of correlation indicates topological errors or lacks in the source data. The models were validated by comparing the segment graph models of the street networks of all the investigated cities with the allocation of POI and public transport stops. The idea of comparison is based on Hillier’s concept of movement economy [56]. The 5th step procedure includes Pearson and Spearman correlations between the space syntax metrics obtained in the 4th step and density of POI, including bus stops as indicators of real urban centralities. Calculations were made using SPSS Statistic software (v. 26) [58]. In practice, two layers of data (space syntax indicators and POI) were spatially joined within 200 m. The distance of 200 m was chosen as the smallest meaningful urban resolution grid size according to [59], which reflects the physical size of POI and the closest catchment area of bus stops. The correlation results were presented in Section 3.1 within a table format highlighting values higher or equal to 0.5, which were regarded as strong and significant to validate the network space syntax model used as a background for a more expanded walkability model.
The next stage ensures that the model works correctly and calculates the key walkability metrics. As the model was validated against POI, the explanatory walkability metrics were calculated as the main task of method workflow 6th step. At this stage, the analysis environment of the building’s centroids was added to the analysis, and all the calculations were made using Urban Network Analysis Toolbox [60]—an ArcGIS software plugin. The tool input parameters specify the calculation radius. At this point, we applied the 15 min city concept [45], approximating that a 1 km distance can be beaten at such a time. The Urban Network Analysis toolbox can compute five different types of centrality metrics on spatial networks of buildings—Gravity Index, Reach, Betweenness, Closeness, and Straightness. Metrics mathematics and potential fields of use are described in Sevtsuk’s works [60,61]. Based on this, we decided to focus on three measures related to the walkability issue: Gravity index (Gr), Reach (Re), and Straightness (St). The space syntax metrics were completed with population density data retrieved from the worldpop.org database, recalculated to building centroids, and reported as PoP metrics. The PoP metric assumes that the presence of people fulfils the walkability [16,17]. Four selected metrics (indicators) were used as case studies of cities’ walkability explanatory indexes. Indexes were calculated at the method workflow step 6. The mathematical formulas are explained below. For practical reasons, indexes calculated on point type feature layer (building centroids) are interactively visualised using the clustering method implemented in WebMap (step 9). In order to analyse the spatial pattern drawn by walkability high attribute values, an aggregation procedure was proceeded using 4 ha hexagon tessellation (step 7).
The study walkability explanatory index mathematical formulae are:
The Gr index in the graph is calculated as the sum of walking destinations (e.g., shops, schools, cultural establishments) divided by the sum of distances to the destinations within 15 min distances. The centrality of gravity was introduced by Hansen (1959) and is calculated by the following, a little simplified for the presented research, Sevtsuk’s [61] Formula (1):
G[i]r = Σ j ∈ G-{i},d[i,j] ≤ r W[j]/d[i,j]
where G[i] means gravity of the building i; Σ—sum of all buildings j, weights W, reachable on the graph G, within the radius r on the shortest distance d between i and j divided by the shortest distance from i to j.
Weight in this calculation was not used, so it is equal to one in all cases, and the Gr index represents the number of reachable buildings divided by the shortest distances. The result reflects not the only number of destinations but the distances between them. For example, two buildings have three travel destinations within 15 min—in the case of simple destination counting, both buildings would have the same walkability, but, if the destinations would be located closer to the first building, then its gravity would be higher and better reflect a possibly shorter travel time. In the presented research, the weight of the travel destinations was not used. The higher gravity means it is allocated closer to a more significant number of travel destinations.
The Re index is calculated as the number of buildings weighted by the perimeter of the facades reachable within 15 min. The index captures how many surrounding buildings each building reaches within a given search radius on the network [61] (Formula (2))
R[i]r = Σ j ∈ G-{i},d[i,j] ≤ r W[j]
where R[i] means the reach of the building i; Σ—sum all buildings j, weights W, reachable on the graph G, within the radius r on the shortest distance d between i and j. If no weight is assigned, then W is equal to 1 and Reach, in such a case, simply represents the number of reachable buildings. In the presented research, the building perimeter is used as a weight.
The St index measures how the shortest path from a building to the other buildings within a 15 min radius resembles a straight line. It is calculated as ratios between linear Euclidean line distances and the shortest distances between the buildings within a 15 min radius. It is estimated by the following Formula (3) [61,62]:
S[i]r = Σ j ∈ G-{i},d[i,j] ≤ r δ [i,j]/d[i,j] W[j]
where S[i] means straightness of the building i; Σ—the sum of ratios between the straight-line distance δ from i to j and the shortest path distance in the graph G multiplied by weights W of j. Building perimeter was used as a weight in the presented research.
The PoP index estimates population density per grid-cell using Random Forest-based dasymetric redistribution [63]. The raw index datasets were dated 2020 and downloaded from worldpop.org as a raster layer. Next, the data were recalculated into case study cities’ local coordinate system using a 1 km grid and summary zonal statistics. The 1 km cell values in this layer contain estimates of the count of people living within the area represented by the cell—the potential number of users of walkable streets. The 6th step of the method workflow applies the calculated walkability indexes values normalisation to make city comparison possible. The normalisation ranges the index values from zero to one. Notably, values were normalised within individual cities to avoid a situation where a high index in one city resulted in a low index in another. (In each of the case studies cities, the value of 1 was reached.)

2.2.3. Walkability Compass, Pattern and WebGIS Sharing Method (Steps 7–9)

Since calculations were made at the single building scale, spatial data aggregation methods have been used for more broad-scale analysis and pattern detection. Step 7 uses 4 ha-sized hexagon tessellations to provide mean Gr, Re, St and PoP values. In urban studies, hexagon tessellations are well-recognised spatial generalisation methods. Due to their topological similarities to real-world irregular partitions, compact shape and simple recursive hierarchical nesting, they are used as spatial data aggregation units [64]. The larger the hexagon, the stronger the data generalisation is; thus, choosing the optimal size becomes a challenging task, especially in different-sized city comparative studies like this one. The earlier 200 m parameter used at the Space Syntax model validation stage (step 5) was our starting point. At the same time, for an urban unit of 200 m, Feick et al. (2015) recommend a 4 ha hexagon size [64]; this was also used in this research. Hexagon tessellation was clipped to the city administrative boundary, and the mean values of Gr, Re, St and PoP were calculated.
A further assumption regarding the walkability spatial pattern mapping task was made. So far, the literature does not provide any recommendations on this point, except straightforward hot and cold spot analysis not used in this study. Therefore, apriority assumptions were made. Initially, it was assumed that for values ranging from 0 to 1, 0.5 would be suitable and unambiguous to detect walkability hot spots; however, it turned out that in some case studies of cities, this value is represented by a single hexagon. For this reason, the threshold was decreased to 0.3. Hexagons with index values equal to or higher than 0.3 were mapped using the following symbology: hatched grey, light blue, purple and grey for Gr, Re, St and PoP, respectively. Finally, the mapped zones were counted in the manner presented in Figure 4. To complete the case study descriptions, patterns created by walkability zones were the object of initial typology. Proposed pattern typology, very initial at this stage, takes after patterns suggested by the American Planning Association (APS) [65] and is the subject of discussion and further development.
The clustering effect has been examined using the Getis-Ord General G statistic and z-score [66] (step 8). Significantly, these calculations were based on non-aggregated datasets (uses points instead of hexagons). The Getis-Ord General G statistics interpret results in the context of the null hypothesis about no spatial clustering of feature values. As the null hypothesis is rejected (p < 0.01), the z-score value is positive, the observed General G index is larger than the expected General G index, thus indicating that high values for the attribute are clustered in the study area. Conversely, suppose the z-score value is negative. Then, the observed General G index is smaller than expected, indicating that low values are clustered in the study area [67]. In other words, the G statistics’ high values reveal walkability clusters tendency.
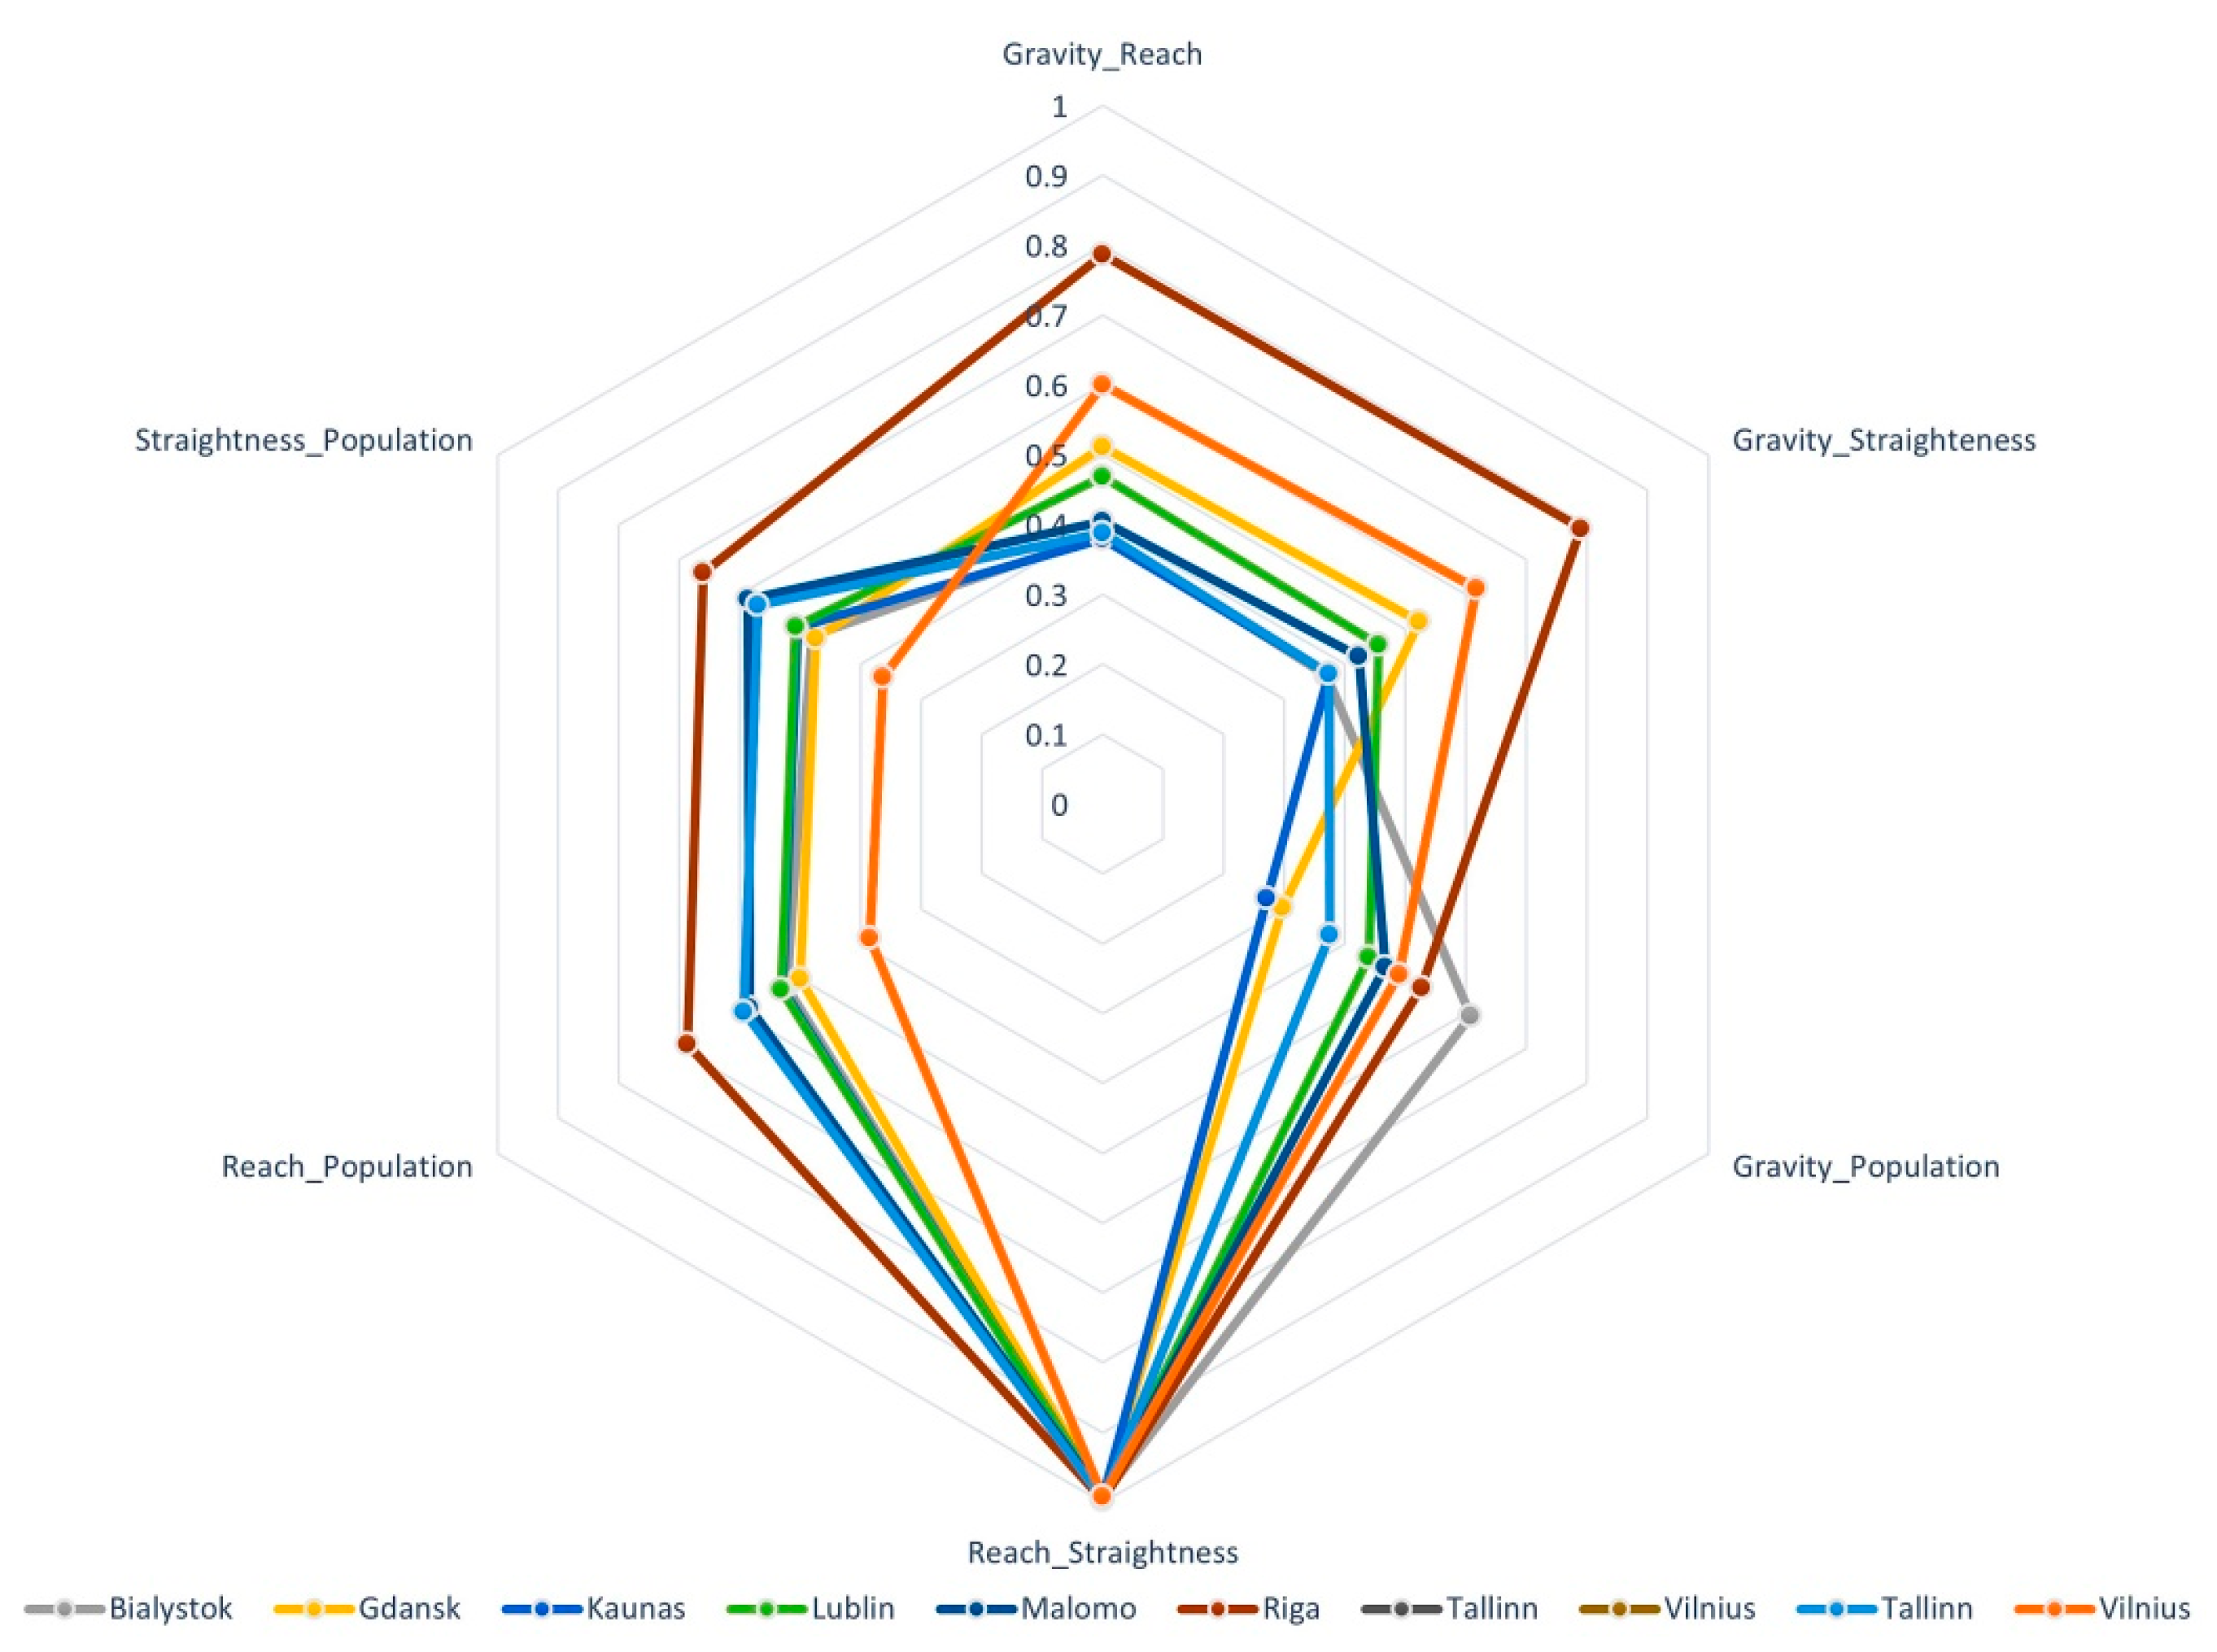
The “walkability compass” consumes the 6th step’s calculations at the city-scale level by producing a graphical comparison of all analysed walkability aspects. The walkability compass visualises the synergies or Pearson correlation between the pairs of four walkability components: Gr-Re, Gr-St; Gr-PoP; Re-St; Re-PoP; St-PoP. The values closer to one show better synergy between ingredients, while close to zero—very little synergy. It allows us to evaluate not the numerical values of reachable destinations, people, or building perimeters, which could differ significantly between the cases, but the synergy between them, which could be high even within a low inhabitant density with just a few travel destinations if they are correctly allocated, and low in high population density zones with the random allocation of POI and bus stops.
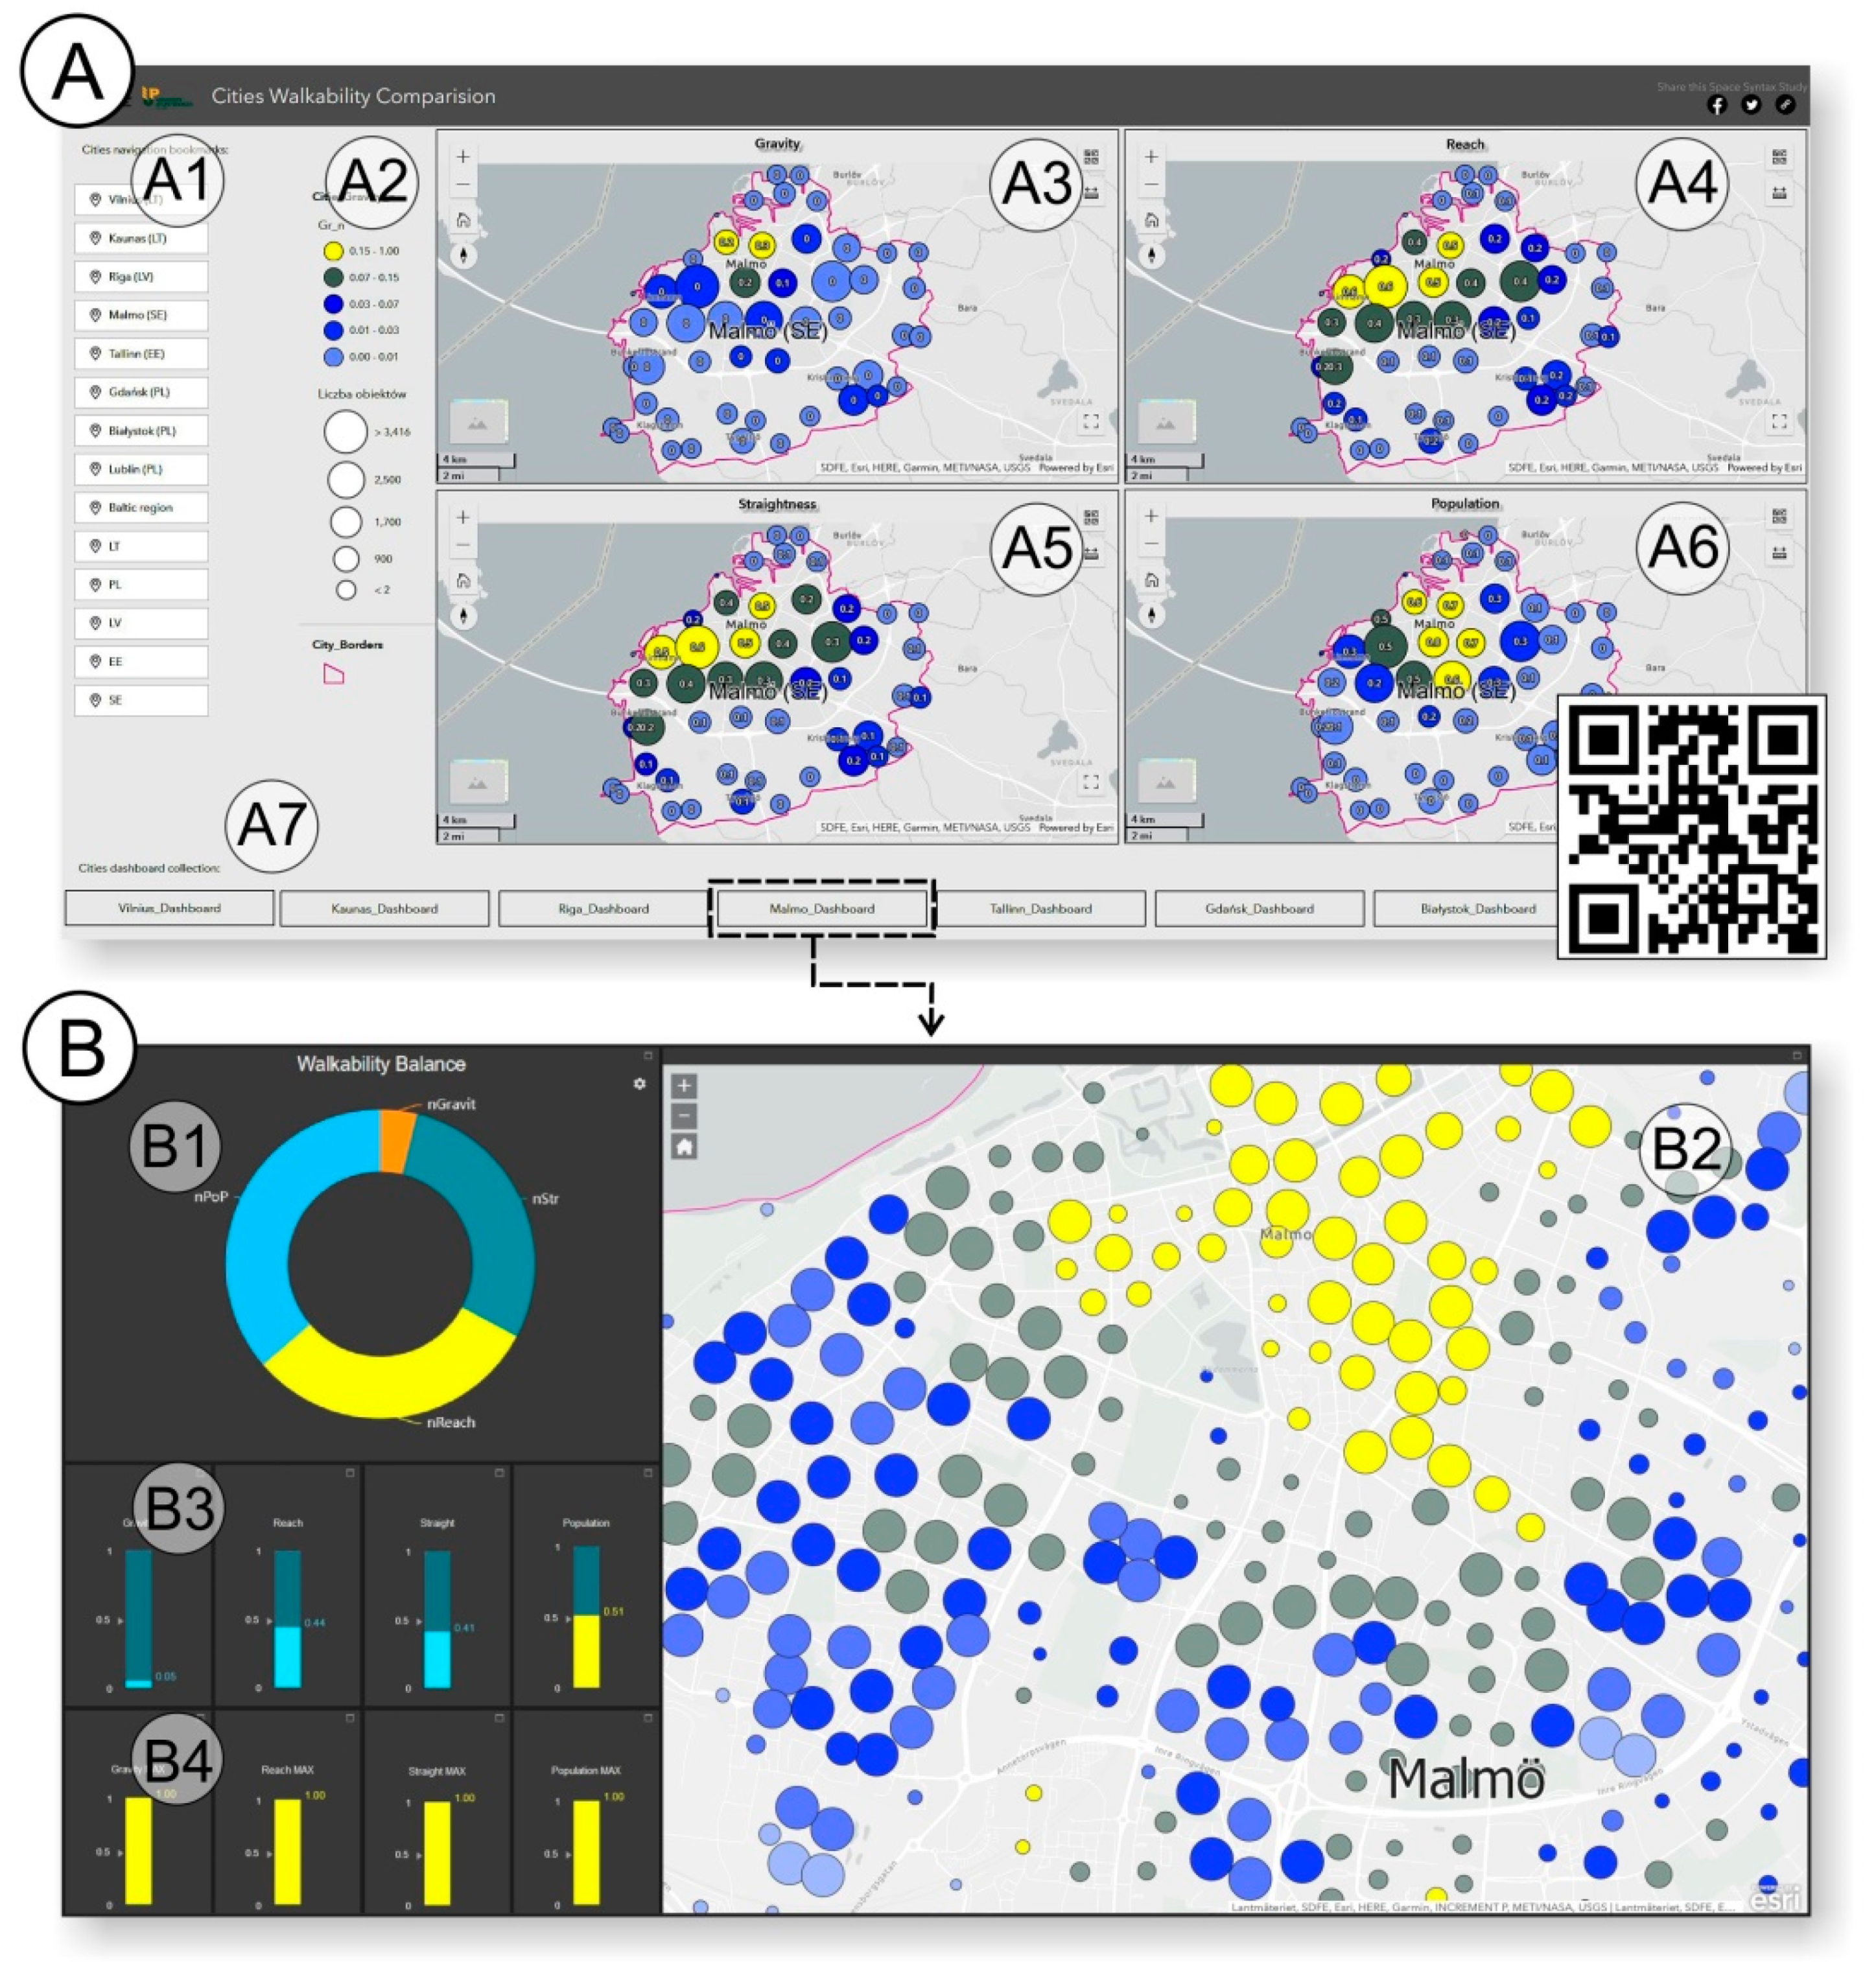
The last step (9th) was the walkability results’ interactive visualisation. For this purpose, two ArcGIS Online (AGOL) web mapping wizards were used: ArcGIS Experience Builder and WebMap App Builder. Both frameworks are well integrated with the desktop GIS software used in previous framework steps and enable quick data export to the online environment. First, the web maps and hosted feature layers were created using hexagon tessellation and building centroids layers. Then, the calculated Gr, Re, St and PoP values were stored in the attribute table.
A visibility range was set up beyond the 1:5000 scale; for the remaining scale, point clustering was used. The size of clusters reflects the number of aggregated building centroids, the colour of the clusters corresponds to the walkability indices values (applied symbology uses colour scale and quartile division scheme). Next, the maps were used to create a web mapping application. The application user interface was designed using bookmarks, which allow the user to navigate to one of the eight analysed cities, the application map window was divided into four sections displaying explanatory walkability indexes simultaneously, and the map windows were linked. At the bottom of the web map application window, the hyperlinks to single case studies’ cities’ dashboards are listed. Those dashboards were created using Web App Builder wizards and introduced interactive graphs displaying explanatory walkability index mean values within the map window extent. The web mapping application is shared publicly via a web link and accessed via any web browser.

3. Results

3.1. Model Validation Results

As a result of both Pearson and Spearman correlations between segment graph models of the street networks and the allocation of POI and public transport stops, moderate and strong correlations were found at the significance level of 0.01 (Table 2 and Table 3). Both results thus demonstrate the relations between urban spatial configuration described by space syntax measures and virtual urban processes as concentration and flows of functions, objects and people.
Statistical analysis of relations between the space syntax indicators and allocation and density of potential walking destinations as POI and public transport stops was conducted to validate possibilities of space syntax models to simulate urban processes in general and walkability based on reflection of allocations of travel destinations in a particular case. As a result, three strong correlations are pointed out between POI and stops. First, the integration or closeness of the street network segments to the rest of the network and density of the network within radiuses of 1000, 3000 and 5000 m in the more significant number of the investigated cities. These radiuses represent the walking and public transport journey distance as could be concluded based on the size of the studied cities. Second, the reachable street length is at a 1000 m radius. This correlation is of great importance for the presented research as the indicator is related to the attractiveness of the street network for walking. Third, the total depth was at a 1000, 3000 and 5000 m radius. The decrease in the correlation with the increased radius was identified, thus pointing out stronger relations between street network centralities and densities of travel destinations within walkable distances. Moreover, weak and moderate significant correlations were found between the street network transit flows and simulated choice metrics. The density of street networks could explain it and the availability of many alternatives, more or less equal in travel distance routes in the investigated cities.
The Pearson correlations results are presented in Table 2; the Spearman correlation results are in Table 3. Stronger correlations were found between the concentration of POI and so-called closeness centralities or integration, densities of street segments and accessible street perimeter of metric reach. The positive results of both Pearson’s and Spearman’s correlations confirm the validation procedure based on the triangulation of scientific models.

3.2. Walkability Patterns Analysis Results

A graphical representation of these zones for all eight analysed cities is presented in Figure 5. Out of all eight patterns mentioned by APS [65] in the case study cities, the following have been identified:
  • Linear—where the majority of an investigated urban phenomenon are allocated along a clear line possibly influenced by a not-evenly-dispersed transport network.
  • Hierarchical—with a clear centre and smaller “islands” clustered around it, possibly caused by relatively even transport networks and perhaps longer evolution of the urban network.
  • Clusters—made of more or less “even islands”, which depend on some local resources, e.g., specific spatial configurations, accessibility to distinctive landscapes.
  • Sectoral—which combines concentric features as clearly expressed, but not dominating the centre, semi-concentric rings of lower intensity around it and dominant corridors—linear centres. Such patterns usually appear because of not-so-evenly spread but concentric street networks and possibly positive and negative synergies between phenomena considered while identifying patterns.
  • A multi-nuclei pattern of autonomous islands does not demonstrate the clear presence of the centre. Instead, this pattern indicates the specialisation of territories related to car-oriented street networks where local neighbourhoods do not make a continuous urban background, various social media, and decreased social importance of public spaces.
  • Concentric—probably based on a clear multifunctional centre, the radial street network around it and more or less isolated islands at the periphery. The periphery of isolated islands could be seen as a potential continuing outer ring of this pattern in the future.
  • The dispersal pattern represents little controlled sprawls of the modelled activities and could be related to car dominance, extensive use of territories and lost spatial synergies.
The detailed data on zones, sub-zones, and pattern recognitions are listed in Table 4. Seven of eight proposed APS patterns have been recognised in terms of walkability; the peripheral model was not identified in these case studies.
The pattern mapping results provide insights into the Gr index that creates small and concentrated zones within a city centre. Thus, this measure is well suited for determining the size and the location of the city walkability at the very centre. The Re index creates hierarchical patterns, allowing the sectoral and linear patterns and making the Re the most diverse walkability indicator. The St index also tends to the hierarchical pattern. Importantly, Re and St patterns usually follow each other. The PoP index revealed a high centrality tendency; however, it also allows the hierarchical and sectoral patterns.
The identified patterns of the analysed cities can be described as follows.
Regarding the Gr: one prolonged medium island, thus demonstrating its possibly linear characteristics and based on the “main street” origin in Kaunas (13.5% of all territory) and Malmö (12.7%). It could be considered a critical core of future development for concentric or sectoral patterns. One or few very small islands in Bialystok (1.13%), Riga (1%), Tallinn (0.5%), Vilnius (0.6%), Lublin (0.8%), or Gdansk (0.5%). Because of the practically minimal relative size of the islands, not depending on the number and configuration of pattern islands, gravity patterns could be considered as dispersal essentially in all six cases.
Regarding the Re and St: Kaunas has a hierarchical cluster in both cases with overlapping, but more robustly expressed the Re pattern (18%) versus St (9%). A sectoral pattern in Bialystok for Re (37%) and hierarchical cluster could be seen as a less developed sectoral model for straightness (13%). Practically identical in both cases, the linear pattern is visible in Gdansk for the Re (11%) and St (9%). There are nearly equally discernible sectoral patterns with some parametric clusters and possibly growing into even more strongly expressed sectoral or concentric patterns in Lublin for both reach (14%) and straightness (10%). Hierarchical clusters for Re (16%) and straightness (14%) in Malmö demonstrate some signs of a future concentric model because of a few tiny islands in the periphery. There is a hierarchical, not strongly expressed cluster in Riga for both Re (4%) and St (3%). Because of the relatively small area of the pattern, it still could be seen as not so much differing from the dispersal pattern. Strongly expressed multi-nuclei patterns in Tallinn are very high within this research percentage for Re (21%) and St (14%). It is unique within the presented research situation in Vilnius with clearly differing patterns for Re and St: Re demonstrates dispersal islands (4%), while for St, a concentric island (11%) overlaps with one zone of higher Re. Regarding the PoP: a concentric pattern or its nodes in a whole territory is considered in Kaunas (17%), Bialystok (59%), Malmö (21%), and Vilnius (11%). A lower percentage could point out a weaker expression of the pattern. A mix of linear and sectoral patterns in Gdansk (23%) and Tallinn (35%) are located along the coastal line. Because of spatial limitations, hierarchical clusters in Lublin (21%) and Riga (21%) are not transformed into the nodes of concentric patterns.
The pattern shape analysis allows us to state that among the compared cities, only Kaunas Gr has an elongated shape impacted by the linear shape and very long Kaunas Promenade (Figure 6).
Furthermore, the Re and St usually adopt a similar pattern. However, the St patterns occurring are more challenging to describe unequivocally, e.g., Bialystok has been classified as hierarchical, but the pattern can also be recognised as sectoral. Finally, the pattern of Vilnius is the most diverse (island, dispersal and concentric patterns), so is more walkable than less varied patterns. The walkability zones and sub-zones drew a spatial pattern. An unambiguous zone count number interpretation is challenging as zones are accompanied by more- or less-distanced and sparse sub-zones; this is reflected in the discrepancy shown in Table 4 between the number of zones and their sub-zones. The G and Z-score statistics (outputs of research workflow step 8) objectively compare the walkability at the whole city scale. In the case of all case study cities, the null hypothesis of random walkability distribution was rejected (in all the instances, p < 0.001). The observed G was higher than the expected G index, which indicates the high walkability value clustering effect. The Z-score explains how strong this effect is. The Z-score values ranged from 209.4 (the Re for Białystok) to 584.0 (the Gr for Gdańsk), indicating a significant walkability clustering effect within case study cities. Except for Riga, the Re index turned out to be the least clustered walkability explanatory index, and the Gr confirmed its highly clustered nature.
The pattern observation and analysis concluded that the most substantial synergies exist between urban form aspects important for walkability—the Re and St. The most clearly expressed spatial patterns of PoP overlap with the other layers. The Re-St and PoP patterns could point out a perspective for walkability improvement based on non-overlapping parts. The spatial patterns of Gr demonstrate certain synergy with the other layers only in Malmö and Kaunas. In contrast, it could be seen as just dispersal allocation of POI in the other cases. The pattern analysis results indicate a large diversity between cities; however, in such a diverse group, there are cities with a similar pattern, such as Kaunas (LT) and Malmö (Se); thus, the exchange of knowledge and practice experiences between towns with a similar walkability spatial pattern may turn out to be more fruitful. In the analysed eight case studies, potentially not linked with each other, there was no full compatibility between walkability patterns; Riga was the most coherent in this respect. The other cities always had three different patterns. The noted frequency allows us to conclude that the diversity of patterns shapes the city’s walkability more significantly than pattern overlays that would indicate a single walkable zone.

3.3. The Walkability Compass

A “walkability compass” was designed to compare all eight cities on a single picture. The “compass” visually expresses the statistical correlation between four analysed walkability explanatory indices (Figure 7). The background values used for the “compass” calculation is provided in Table 5; these data were also used for k-means clustering analysis and synergy insights (Figure 8). At the “compass”, higher correlation values indicate synergy between walkability components. The tool allows us to compare eight case study cities in terms of strong and weak synergies between walkability aspects. However, the “compass” does not allow the evaluation of the numerical values of reachable destination, people, and building perimeter, which could differ significantly between the cases. However, their synergy could be high even within a low inhabitant density with just a few travel destinations if allocated low and adequately in a high population density zone with the random allocation of POI and bus stops.
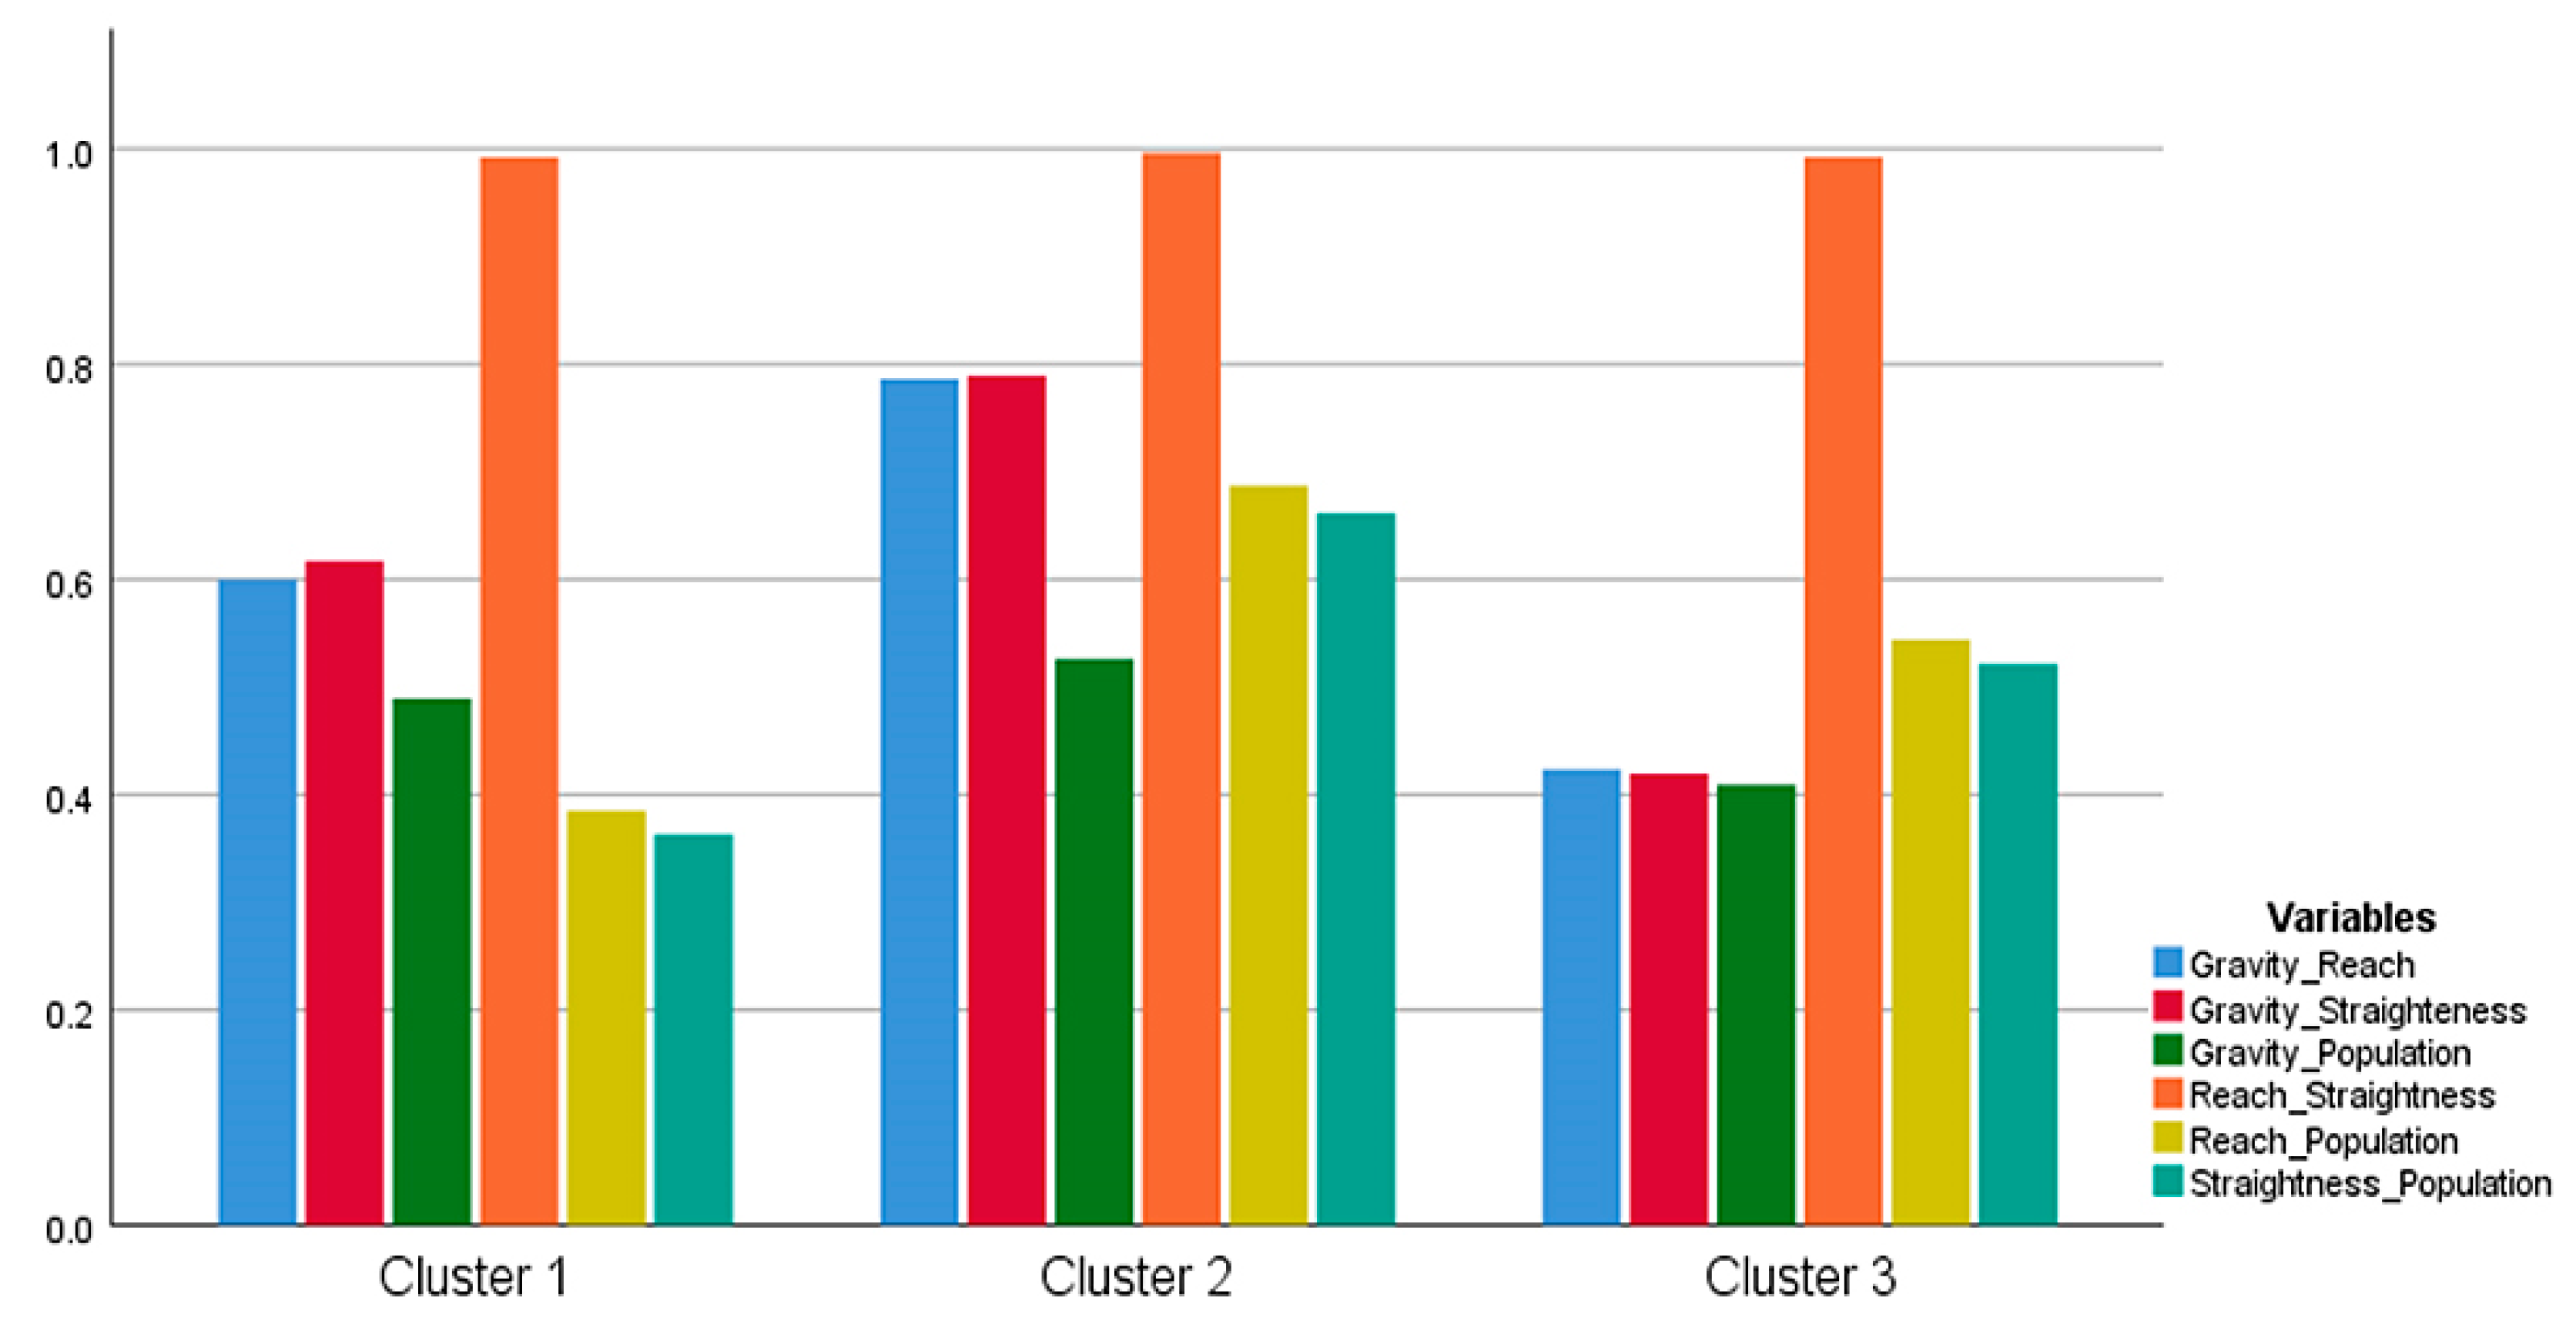
The “compass” points Re-St values as the most synergising. Because of high synergies in every city between these two indicators, their importance in k-means cluster analysis is relatively low (significance 0.295 according to ANOVA tests where more significant values represent lower importance when maximum could be 1). The application of k-means cluster analysis (input data from Table 5) reveals three walkability synergy clusters (Figure 8). The clusters can be explained using synergising indicators pairs. The first pair is made of Gr-Re and Gr-St. It describes how many travel destinations are attractive for walking city zones because of spatial structure and urban design peculiarities. The second pair made by Re-Pop and St-PoP identifies how many inhabitants live in the walkability zone.
The first cluster demonstrates the relative mean synergies of Gr-Re and Gr-St and low values of both Re-PoP and St-PoP. The first cluster also shows medium values of the first pair within the context of the presented research and low values of the second pair. Vilnius is the only city in this cluster. The second cluster shows high values of the first pair and high values of the second one—it is “the ideal” city in the presented research, and it is Riga. All the other cities are assigned to the third cluster with the lowest values of the first pair and medium values of the second one. Furthermore, the Gr–PoP correlation was not significant during the analysis, possibly because of the small areas with the high gravity concentration identified in pattern analysis—its significance for identifying the clusters, according to ANOVA tests, was low (0.634).

3.4. The WebGIS Solution for Cities Walkability Comparison

The results described in Section 3.1, Section 3.2 and Section 3.3 use indicators and pattern typology to compare the case study cities, and the walkability compass point is the “direction” of explanatory indices’ synergy. The pattern map (Figure 5) is substantial to the typology we wanted to investigate and use for city comparison. However, these static maps do not reflect the walkability details at the street or even building-scale level, especially as space syntax offers it. Therefore, the results at the fine-grain city scale are presented using the WebGIS solution. Since scientific data started to be visualised in a dynamic manner and supplied with detailed statistics [68,69], online maps became part of the research workflow [70]. Online maps meet the expectations of open science; therefore, walkability study results are made available using this technology. An online map application is shared via the following link: https://arcg.is/0u0POa1, Cities Walkability Comparison, accessed on 10 January 2022. The application has four map windows; each displays a single explanatory index, herein not aggregated to the hexagon tessellation.
By changing the display, extent map windows adjust the scale and location to each other. The user can read Gr, Re, St and normalised PoP values of every building using the labelling function at the fine grain scale. The resulting WebGIS solutions interface is described in Figure 9A,B. Importantly, Figure 9B refers to the online dashboard, making the city walkability exploration more detailed by displaying the Gr, Re, St and PoP values within the maps extent. Interactive infographics on the left (Figure 9(B3)) report the averaged and maximum (Figure 9(B4)) index values of map window extent. By sharing the results with society, we enable the inhabitants’ and other researchers’ feedback on Gr, Re, St, and PoP further interpretations of walkability.

4. Discussion

This study undertakes walkability using the mathematical graph and space syntax method. The research output is the walkability compass setting of the city walkability strengths and weaknesses. In addition, the study explains the walkability pattern typology as well. The proposed research method has been tested on the example of several cities, so the comparison results allow us to identify significantly common traits (e.g., common walkability patterns) and differences. The “compass” and spatial patterns make the framework suitable for comparative purposes. A WebGIS solution is used to disseminate the results to enhance the comparison. Botch results were achieved with limitations, primarily due to pulling only the street network geometry out of vast walkability factors, and secondly due to space syntax tools itself simplifications (e.g., the urban feature geometry simplification). Both of the above aspects are discussed below.
The Space Syntax was chosen for several reasons: as a spatial model, it focussed on the reflection of self-organising forces of complex urban networks. The Space Syntax model is constantly developed by a scientific community and reacting to discovered weaknesses. For example, the criticised axial analysis [71] has been updated to segment analysis [57] and applied in this case study. The approach uses street segments instead of crossroads (criticised approach) for graph construction [72]. The above-described approach is also seen as more walkability analysis-oriented because the space syntax graph focuses on street segments, which during the last stage of the research was continued with a more detailed focus on buildings.
The walkability compass emphasises the phenomenon’s cultural and visual aspects and utilises Re and St metrics to measure it. Assigning visual issues to the metrics results from urban studies literature. For example, Alexander points out the importance of public spaces created beside a building for street culture and liability of a street by describing the following patterns: Public Outdoor Room (pattern 69), Common Areas at the Heart (129), Seat Spots (241), Activity Pockets (124), Building Edge (160), and Outdoor Room (163) [73]. The concept of placemaking, when it is focussed on the access and linkage of physical public spaces, identify an essential aspect of placemaking as proximity, connectivity, walkability, convenience and accessibility and suggest the following quite general indicators of the features mentioned above: mode split, transit use, pedestrian activity, and parking usage patterns [74]. On the other hand, the proposed indexes of gravity, reach, and straightness could be seen as clear and measurable alternatives at least to part of the placemaking aspects and indicators as reach and straightness for pedestrian activity, transit-oriented development, proximity, connectivity.
Furthermore, “The city in its complete sense is a geographic plexus, an economic organisation, an institutional process, a theatre of social action, and an aesthetic symbol of collective unity.” [75]. So-called “New Traditionalists” such as Andres Duany, Elizabeth Plater-Zyberk, and Jaime Correa seek to return urban living arrangements to human-scale communities that are pedestrian-oriented [76]. Based on Hillier’s [12,56,77] study, it could be concluded that the more accessible the building perimeter from the street as a simple quantitative indicator, the higher probability of its attractiveness for walkers.
Cullen’s [78] concept of humans perceiving a city as “space by space” make a theoretical base regarding the St metrics. The viewspace in which the observer is now is called “here”, while the space to which there is a possibility to move is “there”. “Here” is always known, but “there” could be either known or unknown depending on spatial relation between spaces, e.g., if “there” space is located behind the corner, then it is unknown, if it is at least partially visible—known. The St becomes a key index for walkability visualspace measurement as a series of known “here” and “there”, and thus becomes related to the recognisable path as the mental City Image, as explained by Lynch [79].
The “compass” is the main output of our research; it contributes to walkability research and sustainable urban planning practice. Above this, additional discussion requires spatial pattern mapping and analysing methods adopted in our framework. From a technical point of view, zones of high-value concentration are analysed using hot-spot analysis—a GIS technique of spatial grouping aimed to map similarity patterns and anomalous values. The de Getis–Ord statistics [66] accompany the hot-spot analysis [80]; its mathematical formula and analysis pros and cons are discussed by Sánchez-Martín et al. (2019) [81]. In our study, these statistical measures (the Getis–Ord and z-score) were functional, while the tests performed with the hot and cold spots gave a relatively local result. In other words, we could detect more spatial pattern similarities using spatial tessellation thresholding techniques rather than hot-spot techniques. Additional research is necessary to answer whether it resulted from the specificity of space syntax metrics. As such, space syntax metrics also require other comments. The PoP identifies the concentration of walkers and the starting points of walking journeys—the proximity of the walking destinations in numbers of various objects or a mix of land use. The number of objects could be a more precise and straightforward way to measure proximity. At the same time, the land use mix addresses it indirectly based on the premise that more land use functions create more potential travel destinations. It should be noted that the number of destinations should be counted, but walking distance to each of them should be evaluated to improve walkability modelling. Connectivity as a property of street network reflects favourability for walking, which in three reviewed cases of four is counted as the density of crossroads. It should be noted that the plain number of intersections addresses just a density of the street network and potential walking routes but says nothing about the character of urban spaces related to visibility and street facades.
Finally, this research method workflow adopts the model validation procedure that compares the segment graph models with POI allocation and public transport stops. This idea is based on the movement economy concept by Hillier [56]. The theory states that “(...) evolving space organisation in settlements first generates the distribution pattern of busier and quieter movement pattern flows, which then influence land-use choices, and these, in turn, generate multiplier effects on movement with further feedback on land-use choices and the local grid as it adapts itself to more intensive development” [56]. In such a case, allocation and concentration of the more critical urban features such as shops, administrative and cultural buildings, and schools could be seen as a result of the generative field of the street network, and thus used to check if the mathematical simulation model is working well.
The “walkability compass” could also be applied at a city division scale, thus comparing various neighbourhoods or even urban blocks and presenting universal decision support models for multiple stakeholders of city development: city administration, urban planners, developers, and NGOs. Furthermore, it could be pointed out that because of the simulative nature of the mathematical graph model, the same calculation could be made for a predicted plan, thus expanding the usability of the proposed model. The “walkability compass” concept relies on space syntax theory—a knowledge-based solution, thus contributing to the analytical and evidence-based design [82]. In addition to city walkability comparison, the study uses a web-mapping application to share results at the urban space level. The web-mapping solution significantly enables public urban spaces’ evidence-based design since data on urban walkability is at the urban planner fingertips. The placemaking concept focused on the access and linkage of physical public spaces identifies an essential aspect of placemaking: proximity, connectivity, walkability, convenience, and accessibility [74]. This study indexes could be measurable alternatives at least to part of the placemaking aspects and indicators, such as Re and St for pedestrian activity, transit-oriented development, proximity, and connectivity. Notably, the compass could also be applied to the WebMap solution created by the WebGis developer; in this case, the study of the online mapping task was limited to the ArcGIS Online wizard and widget functionality.
In the broader context of the theoretical discussion, the term walkability can hold a different content. Forsyth [11], among several walkability definitions, emphasises a compact form that makes walking destinations well reachable and safe with many possible meanings, starting with crime and ending with transport safety. Furthermore, these urban design elements make walking attractive, such as street furniture, proper sidewalks, street trees [11]. Therefore, our research is rooted in reach, gravity, straightness, and population density indicators after the above definition.

5. Conclusions

The direction of pedestrian-friendly city transformation is pointed by the walkability compass and the space syntax solution to assess the synergy effect of walking-friendly factors. The tool indicates the core factors shaping city walkability and, if necessary, corrects the direction by taking sustainable urban planning scenarios. The scenarios can be shared with common spatial pattern cities; the above-described research method leads to the typology using APA pattern classification as a research base. The diagnosis of eight Baltic regions’ cities confirmed the well-established urban planning standards on the example of the Scandinavian city of Malmö. Moreover, it points out pedestrian-friendly urban planning strategies’ development needs regarding cities of relatively small and overlayed walkability zones. Based on buildings’ footprint geometry, the calculation improves the space syntax usability, enabling the modelling of a city development scenario. Every urban feature can be assessed according to its impact on walkability instead of the whole street section. Walkability is a viable solution for sustainable urbanism and a possible indicator to integrate into urban sustainability assessment.

Author Contributions

Conceptualization, K.Z. and S.C.; methodology, K.Z. and S.C.; software, K.Z. and S.C.; validation, K.Z.; formal analysis, K.Z. and S.C.; investigation, K.Z., S.C., J.K., I.G.-V. and H.L.; resources K.Z. and S.C.; data curation, K.Z. and S.C.; writing—original draft preparation, S.C. and K.Z.; writing—review and editing, S.C. and H.L.; visualisation, S.C., K.Z. and I.G.-V.; supervision, K.Z.; project administration, S.C.; funding acquisition, S.C. and H.L. All authors have read and agreed to the published version of the manuscript.

Funding

The preparation, analysis and modelling of Kaunas and Riga cities, presented in this article, has received funding from the Research Council of Lithuania (LMTLT), agreement No S-LLT-20-3 and has been performed in cooperation with Taipei Mission in the Republic of Latvia and Lithuania, and Taiwan’s Ministry of Science and Technology (MOST 109–2923-E-011—002—MY3). The other conducted tasks and presented results received no external funding. The research was carried out as part of a correspondence author’s (SC) research internship in 2021 at the KTU in Kaunas, the internship was granted by the University of Life Sciences in Lublin, the Department of Grassland and Landscape Studies.

Institutional Review Board Statement

Not applicable.

Informed Consent Statement

This statement if the study did not involve humans.

Data Availability Statement

Not applicable.

Acknowledgments

The authors would like to thank the three reviewers for giving fruitful comments, thanks to which the manuscript has been improved.

Conflicts of Interest

The authors declare no conflict of interest.

References

  1. Loo, B.Y.P. Walking towards a happy city. J. Transport. Geogr. 2021, 93, 103078. [Google Scholar] [CrossRef]
  2. Kato, H.; Takizawa, A. Which Residential Clusters of Walkability Affect Future Population from the Perspective of Real Estate Prices in the Osaka Metropolitan Area? Sustainability 2021, 13, 13413. [Google Scholar] [CrossRef]
  3. Jenks, M.; Burton, E.; Williams, K. The Compact City. A Sustainable Urban Form? E. & FN Spon: New York, NY, USA, 1996. [Google Scholar]
  4. Bettignies, Y.; Meirelles, J.; Fernandez, G.; Meinherz, F.; Hoekman, P.; Bouillard, P.; Athanassiadis, A. The Scale-Dependent Behaviour of Cities: A Cross-Cities Multiscale Driver Analysis of Urban Energy Use. Sustainability 2019, 11, 3246. [Google Scholar] [CrossRef] [Green Version]
  5. Bolgar, B. Planning for Walkability and Mixed Use. Walkability and Mixed Use. Making Valuable and Healthy Communities. The Prince’s Foundation. 2020. Available online: https://princes-foundation.org/journal/walkability-report (accessed on 20 December 2021).
  6. de Courrèges, A.; Occelli, F.; Muntaner, M.; Amouyel, P.; Meirhaeghe, A.; Dauchet, L. The relationship between neighborhood walkability and cardiovascular risk factors in northern France. Sci. Total Environ. 2021, 772, 144877. [Google Scholar] [CrossRef] [PubMed]
  7. Leslie, E.; Butterworth, I.; Edwards, M. Measuring the walkability of local communities using Geographic Information Systems data. In Proceedings of the Walk21-VII, the Next Steps, 7th International Conference on Walking and Liveable Communities, Melbourne, Australia, 23–25 October 2006; Volume 6. [Google Scholar]
  8. Kato, H.; Kanki, K. Development of walkability indicator for visualising smart shrinking—A case study of sprawl areas in North Osaka Metropolitan Region. Int. Rev. Spat. Plan. Sustain. Dev. 2020, 8, 39–58. [Google Scholar]
  9. Clark, G. The educational value of the rural trail: A short walk in the Lancashire countryside. J. Geogr. High. Educ. 1997, 21, 349–362. [Google Scholar] [CrossRef]
  10. Paniagua, A. The hidden life of the historical system of rural roads in a sector of the Guadarrama mountains, Central Spain. Adv. Appl. Sociol. 2020, 10, 257–277. [Google Scholar] [CrossRef]
  11. Forsyth, A. What is a Walkable Place? The Walkability Debate in Urban Design. Urban. Des. Int. 2015, 20, 274–292. [Google Scholar] [CrossRef]
  12. Hillier, B.; Hanson, J. The Social Logic of Space; Cambridge University Press: Cambridge, UK, 1984; pp. 48—51, 103, 105, 106, 108, 109. [Google Scholar]
  13. Bafna, S. Space syntax: A brief introduction to its logic and analytical techniques. Environ. Behav. 2003, 35, 17–29. [Google Scholar] [CrossRef]
  14. Peponis, J.; Wineman, J. Spatial structure of environment and behavior. In Handbook of Environmental Psychology; Bechtel, R.B., Churchman, A., Eds.; John Wiley: New York, NY, USA, 2003; pp. 271–291. [Google Scholar]
  15. Yamu, C.; van Nes, A.; Garau, C. Bill Hillier’s Legacy: Space Syntax—A Synopsis of Basic Concepts, Measures, and Empirical Application. Sustainability 2021, 13, 3394. [Google Scholar] [CrossRef]
  16. Ribeiro, A.I.; Hoffimann, E. Development of a neighbourhood walkability index for Porto metropolitan area. How strongly is walkability associated with walking for transport? Int. J. Environ. Res. Public Health 2018, 15, 2767. [Google Scholar] [CrossRef] [PubMed] [Green Version]
  17. Stockton, J.C.; Duke-Williams, O.; Stamatakis, E.; Mindell, J.S.; Brunner, E.J.; Shelton, N.J. Development of a novel walkability index for London, United Kingdom: Cross-sectional application to the Whitehall II Study. BMC Public Health 2016, 16, 416. [Google Scholar] [CrossRef] [Green Version]
  18. Jabbari, M.; Fonseca, F.; Ramos, R. Accessibility and Connectivity Criteria for Assessing Walkability: An Application in Qazvin, Iran. Sustainability 2021, 13, 3648. [Google Scholar] [CrossRef]
  19. Kim, J.; Tak, S.; Bierlaire, M.; Yeo, H. Trajectory Data Analysis on the Spatial and Temporal Influence of Pedestrian Flow on Path Planning Decision. Sustainability 2020, 12, 10419. [Google Scholar] [CrossRef]
  20. Klarqvist, B. A Space Syntax Glossary. Nord. Arkit. 1993, 2, 11–12. [Google Scholar]
  21. The Prince’s Foundation. Walkability and Land Mixed-Use Making Valuable and Healthy. 2020. Available online: https://d16zhuza4xzjgx.cloudfront.net/files/walkability-and-mixed-use-making-valuable-and-healthy-communities-7667-0df54aa9.pdf (accessed on 21 December 2021).
  22. van Nes, A. Spatial Configurations and Walkability Potentials. Measuring Urban Compactness with Space Syntax. Sustainability 2021, 13, 5785. [Google Scholar] [CrossRef]
  23. Peponis, J.; Bafna, S.; Zhang, Z. The Connectivity of Streets: Reach and Directional Distance. Environ. Plan. B Plan. Design. 2008, 35, 881–901. [Google Scholar] [CrossRef]
  24. Benedikt, M.L. To take hold of space: Isovists and isovist fields. Environ. Plan. B Plan. Des. 1979, 6, 47–65. [Google Scholar] [CrossRef]
  25. Turner, A.; Doxa, M.; O’Sullivan, D.; Penn, A. From Isovists to Visibility Graphs: A Methodology for the Analysis of Architectural Space. Environ. Plan. B 2001, 28, 103–121. [Google Scholar] [CrossRef] [Green Version]
  26. Huang, B.-X.; Chiou, S.-C.; Li, W.-Y. Accessibility and Street Network Characteristics of Urban Public Facility Spaces: Equity Research on Parks in Fuzhou City Based on GIS and Space Syntax Model. Sustainability 2020, 12, 3618. [Google Scholar] [CrossRef]
  27. Zhang, T.; Hua, W.; Xu, Y. “Seeing” or “Being Seen”: Research on the Sight Line Design in the Lion Grove Based on Visitor Temporal–Spatial Distribution and Space Syntax. Sustainability 2019, 11, 4348. [Google Scholar] [CrossRef] [Green Version]
  28. Seong, E.Y.; Lee, N.H.; Choi, C.G. Relationship between Land Use Mix and Walking Choice in High-Density Cities: A Review of Walking in Seoul, South Korea. Sustainability 2021, 13, 810. [Google Scholar] [CrossRef]
  29. van Nes, A.; Yamu, C. Exploring Challenges in Space Syntax Theory Building: The Use of Positivist and Hermeneutic Explanatory Models. Sustainability 2020, 12, 7133. [Google Scholar] [CrossRef]
  30. Ewing, R.; Handy, S.; Brownson, R.C.; Clemente, O.; Winston, E. Identifying and Measuring Urban Design Qualities Related to Walkability. J. Phys. Act. Health 2006, 3, S223–S240. [Google Scholar] [CrossRef] [PubMed]
  31. Hayashiyama, Y.; Tanabe, S.; Hara, F. Economic evaluation of snow-removal level by contingent valuation method. Transp. Res. Rec. 2001, 1741, 183–190. [Google Scholar] [CrossRef]
  32. Chen, C.; Ibekwe-SanJuan, F.; Hou, J. The structure and dynamics of co-citation clusters: A multiple-perspective co-citation analysis. J. Am. Soc. Inf. Sci. Technol. 2010, 61, 1386–1406. [Google Scholar] [CrossRef] [Green Version]
  33. Istrate, A.-L.; Bosák, V.; Nováček, A.; Slach, O. How Attractive for Walking Are the Main Streets of a Shrinking City? Sustainability 2020, 12, 6060. [Google Scholar] [CrossRef]
  34. Zuo, J.; Mu, T.; Xiao, T.-Y.; Luo, J.-C. Evaluation of Walking Comfort in Children’s School Travel at Street Scale: A Case Study in Tianjin (China). Int. J. Environ. Res. Public Health 2021, 18, 10292. [Google Scholar] [CrossRef]
  35. Otsuka, N.; Wittowsky, D.; Damerau, M.; Gerten, C. Walkability assessment for urban areas around railway stations along the Rhine-Alpine Corridor. J. Transport. Geogr. 2021, 93, 103081. [Google Scholar] [CrossRef]
  36. Frank, L.D.; Schmid, T.L.; Sallis, J.F.; Chapman, J.; Saelens, B.E. Linking objectively measured physical Activity with objectively measured urban form: Findings from SMARTRAQ. Am. J. Prev. Med. 2005, 28, 117–125. [Google Scholar] [CrossRef]
  37. McCormack, G.R.; Koohsari, M.J.; Turley, L.; Nakaya, T.; Shibata, A.; Ishii, K.; Yasunaga, A.; Oka, K. Evidence for urban design and public health policy and practice: Space syntax metrics and neighborhood walking. Health Place 2021, 67, 102277. [Google Scholar] [CrossRef] [PubMed]
  38. Cervero, R.; Kockelman, K. Travel demand and the 3ds: Density, diversity, and design. Transport. Res. Part D Transport. Environ. 1997, 3, 199–219. [Google Scholar] [CrossRef]
  39. Lee, S.; Yoo, C.; Seo, K.W. Determinant Factors of Pedestrian Volume in Different Land-Use Zones: Combining Space Syntax Metrics with GIS-Based Built-Environment Measures. Sustainability 2020, 12, 8647. [Google Scholar] [CrossRef]
  40. Chan, E.T.C.; Schwanen, T.; Banister, D. Towards a multiple-scenario approach for walkability assessment: An empirical application in Shenzhen, China. Sustain. Cities Soc. 2021, 71, 102949. [Google Scholar] [CrossRef]
  41. Kim, S.; Park, S.; Lee, J.S. Meso- or micro-scale? Environmental factors influencing pedestrian satisfaction. Transp. Res. Part D Transp. Environ. 2014, 30, 10–20. [Google Scholar] [CrossRef]
  42. Bartzokas Tsiompras, A.; Photis, N.Y. What matters when it comes to “Walk and the city”? Defining a weighted GIS-based walkability index. Transp. Res. Procedia 2017, 24, 523–530. [Google Scholar] [CrossRef]
  43. Paolini, M. Manifesto for the Reorganisation of the City after COVID-19. 2020. Available online: https://www.degrowth.info/en/blog/manifesto-for-the-reorganisation-of-the-city-after-covid-19 (accessed on 20 December 2021).
  44. Sevtsuk, A.; Basu, R.; Chancey, B. We shape our buildings, but do they then shape us? A longitudinal analysis of pedestrian flows and development activity in Melbourne. PLoS ONE 2021, 16, e0257534. [Google Scholar] [CrossRef] [PubMed]
  45. Moreno, C.; Allam, Z.; Chabaud, D.; Gall, C.; Pratlong, F. Introducing the “15-Minute City”: Sustainability, Resilience and Place Identity in Future Post-Pandemic Cities. Smart Cities 2021, 4, 6. [Google Scholar] [CrossRef]
  46. UN. Tier Classification for Global SDG Indicators (Updated 29 March 2021). Available online: https://unstats.un.org/sdgs/files/Tier%20Classification%20of%20SDG%20Indicators_29%20Mar%202021_web.pdf (accessed on 10 December 2021).
  47. Map Data Copyrighted OpenStreetMap Contributors. Available online: https://www.openstreetmap.org (accessed on 3 December 2021).
  48. Map Data Free. Available online: https://land.copernicus.eu/local/urban-atlas/urban-atlas-2018 (accessed on 3 December 2021).
  49. Vilnius Master Plan. Available online: https://vilnius.lt/lt/savivaldybe/miesto-pletra/vilniaus-miesto-bendrasis-planas/bendrojo-plano-keitimas-esama-bukle/ (accessed on 21 December 2021).
  50. Kaunas Master Plan. Available online: http://old.kaunoplanas.lt/bendrieji_planai/kauno_miesto_bendrasis_planas_2013_2023_metams (accessed on 21 December 2021).
  51. Sustainable Development Strategy of Riga until 2030. Available online: https://www.rdpad.lv/wp-content/uploads/2014/11/ENG_STRATEGIJA.pdf (accessed on 23 December 2021).
  52. Development Strategy “Tallinn 2035”. Available online: https://www.tallinn.ee/eng/strateegia/Arengustrateegia-Tallinn-2035-avalikustamine (accessed on 22 December 2021).
  53. Geofabrike.de—Map Data Free. Available online: https://download.geofabrik.de/europe/ (accessed on 3 December 2021).
  54. ESRI. ArcGIS Pro: Release 2.8; Environmental Systems Research Institute: Redlands, CA, USA, 2021. [Google Scholar]
  55. Turner, A.; Penn, A.; Hillier, B. An algorithmic definition of the axial map. Environ. Plan. B Plan. Des. 2005, 32, 425–444. [Google Scholar] [CrossRef]
  56. Hillier, B. Space is the Machine: A Configurational Theory of Architecture; Space Syntax: London, UK, 2007; pp. 125–127. [Google Scholar]
  57. Turner, A. DepthMap4: A Researcher’s Handbook; Bartlett School of Graduate Studies, University College London: London, UK, 2004; p. 26. [Google Scholar]
  58. IBM Corporation. IBM SPSS Statistics for Windows, Version 26; IBM Corp.: Armonk, NY, USA, 2019. [Google Scholar]
  59. Dijkstra, L.; Poelman, H. Regional Working Paper: A Harmonised Definition of Cities and Rural Areas: The New Degree of Urbanisation, European Commision. 2014. Available online: https://ec.europa.eu/regional_policy/sources/docgener/work/2014_01_new_urban.pdf (accessed on 3 January 2022).
  60. Sevtsuk, A.; Mekonnen, M. Urban Network Analysis Toolbox. Int. J. Geomat. Spat. Anal. 2012, 22, 287–305. [Google Scholar]
  61. Sevtsuk, A. Path and Place: A Study of Urban Geometry and Retail Activity in Cambridge and Somerville. Ph.D. Thesis, Cambridge MIT, Cambridge, MA, USA, 2010. [Google Scholar]
  62. Vragovic, I.; Louis, E.; Diaz-Guilera, A. Efficiency of information transfer in regular and complex networks. Phys. Rev. 2005, 71, 026122. [Google Scholar]
  63. WorldPop. Global High Resolution Population Denominators Project—Funded by the Bill and Melinda Gates Foundation (OPP1134076). Available online: www.worldpop.org (accessed on 10 December 2021).
  64. Feick, R.; Robertson, C. A multi-scale approach to exploring urban places in geotagged photographs. Comput. Environ. Urban. Syst. 2015, 53, 96–109. [Google Scholar] [CrossRef]
  65. American Planning Association. Planning and Urban Design Standards; Willey: Hoboken, NJ, USA, 2006. [Google Scholar]
  66. Getis, A.; Ord, J.K. The Analysis of Spatial Association by Use of Distance Statistics. Geogr. Anal. 1992, 24, 189–206. [Google Scholar] [CrossRef]
  67. Mitchell, A. The ESRI Guide to GIS Analysis; ESRI Press: Redlands, CA, USA, 2005; Volume 2. [Google Scholar]
  68. Shamoun-Baranes, J.; Farnsworth, A.; Aelterman, B.; Alves, J.A.; Azijn, K.; Bernstein, G.; Branco, S.; Desmet, P.; Dokter, A.M.; Horton, K.; et al. Innovative Visualisations Shed Light on Avian Nocturnal Migration. PLoS ONE 2016, 11, e0160106. [Google Scholar] [CrossRef] [Green Version]
  69. Smith, A.D. Domestic energy use in England and Wales: A 3D density grid approach. Reg. Stud. Reg. Sci. 2014, 1, 347–349. [Google Scholar] [CrossRef]
  70. Zastrow, M. Data visualisation: Science on the map. Nature 2015, 519, 119–120. [Google Scholar] [CrossRef] [PubMed] [Green Version]
  71. Ratti, C. Space syntax: Some inconsistencies. Environ. Plan. B Urban. Anal. City Sci. 2004, 31, 487–499. [Google Scholar] [CrossRef]
  72. Porta, S.; Latora, V.; Strano, E. Networks in urban design. Six years of research in multiple centrality assessment. In Oppo GL Network Science Complexity in Nature and Technology; Estrada, E., Fox, M., Higham, D.J., Eds.; Springer: Berlin/Heidelberg, Germany, 2010; pp. 107–130. [Google Scholar]
  73. Alexander, C.; Ishikawa, S.; Silverstein, M.; Jacobson, M.; Fiksdahl-King, I.; Angel, S. A Pattern Language: Towns, Buildings, Construction; Oxford University Press: Oxford, UK, 1977; p. 1171. [Google Scholar]
  74. Project for Public Spaces. Placemaking: What If We Built Our Cities around Places? 2018. Available online: https://uploadsssl.webflow.com/5810e16fbe876cec6bcbd86e/5b71f88ec6f4726edfe3857d_2018%20placemaking%20booklet.pdf (accessed on 1 February 2022).
  75. Mumford, L. What is a City? In The City Reader, 3rd ed.; LeGates, R., Stout, F., Eds.; Routledge: London, UK, 2003; pp. 93–96. [Google Scholar]
  76. Gottdiener, M.; Budd, L. Key Concepts in Urban Studies; SAGE Publications: Thousand Oaks, CA, USA, 2005; pp. 109–110. [Google Scholar]
  77. Hillier, B.; Yang, T.; Turner, A. Advancing Depthmap to Advance our Understanding of Cities. In International Space Syntax Symposium, 8th ed.; Greene, M., Reyes, J., Castro, A., Eds.; Pontificia Universidad Catholica de Chile: Santiago, Chile, 2012. [Google Scholar]
  78. Cullen, G. Concise Townscape; Architectural Press: New York, NY, USA, 1995; p. 200. [Google Scholar]
  79. Lynch, K. The Image of the City; The MIT Press: Cambridge, MA, USA, 1960; pp. 99–103. [Google Scholar]
  80. Cheng, K.-L.; Hsu, S.-C.; Li, W.-M.; Ma, H.-W. Quantifying potential anthropogenic resources of buildings through hot spot analysis. Resour. Conserv. Recycl. 2018, 133, 10–20. [Google Scholar] [CrossRef]
  81. Sánchez-Martín, J.-M.; Rengifo-Gallego, J.-I.; Blas-Morato, R. Hot Spot Analysis versus Cluster and Outlier Analysis: An Enquiry into the Grouping of Rural Accommodation in Extremadura (Spain). ISPRS Int. J. Geo-Inf. 2019, 8, 176. [Google Scholar] [CrossRef] [Green Version]
  82. Karimi, K. Space Syntax as a Platform for Teaching Analytical, Research-Based Design: A Pedagogical Experience. In Proceedings of the 12th Space Syntax Symposium, 268–1, Beijing, China, 8–13 July 2019; Available online: https://discovery.ucl.ac.uk/id/eprint/10081811/1/1562663096_karimi.pdf (accessed on 1 February 2022).
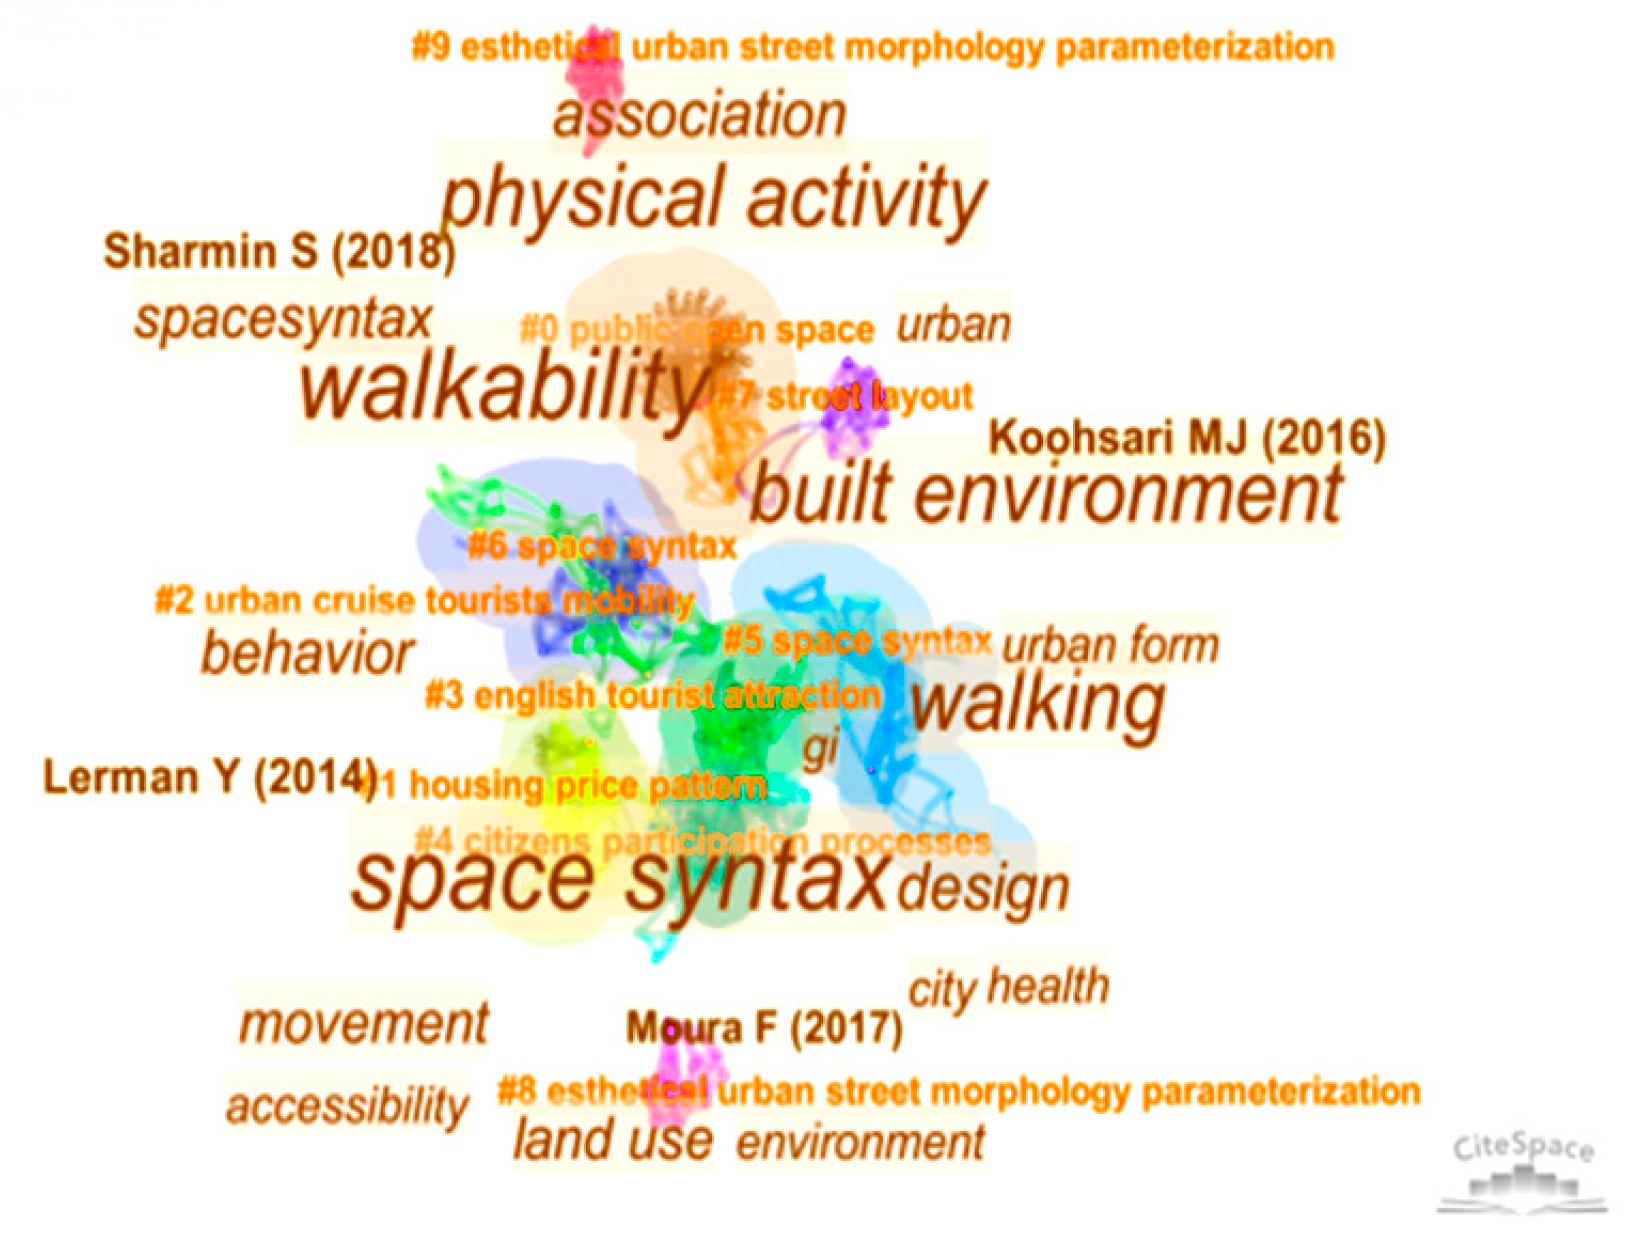
Figure 1. Predominant keywords, authors, and thematic clusters in the research volume encompassing walkability and space syntax topics according to CiteSpace [32] search results.
Sustainability 14 02033 g001
Figure 2. The case study cities: (A) location within Baltic Sea region, (B) cities’ administrative borders and roads network: (upper left) Vilnius, Kaunas, Malmö, Riga; (bottom left) Tallinn, Gdansk, Bialystok, Lublin (authors own elaboration using Open Street Map datasets [47]).
Sustainability 14 02033 g002
Figure 3. The method workflow includes spatial data download and management (step 1–3), space syntax calculations (step 4–6), walkability compass and walkability patterns analysis (step 7–8) and research outputs sharing via WebMap (step 9); stages that are subject to results reporting are marked with an asterisk.
Sustainability 14 02033 g003
Figure 4. Walkability patterns counting scheme: the pattern created by three zones and seven sub-zones.
Sustainability 14 02033 g004
Figure 5. Spatial pattern maps of case study cities’ walkability.
Sustainability 14 02033 g005
Figure 6. The straight 3 km-long promenade impacts the Kauna’s Gr pattern’s elongated shape (Photo by Chmielewski Sz., December 2021).
Sustainability 14 02033 g006
Figure 7. The walkability compasses for case study walkability comparisons.
Sustainability 14 02033 g007
Figure 8. Cities’ walkability explanatory indices pairs clusters.
Sustainability 14 02033 g008
Figure 9. The WebGIS solutions for comparative analysis of explanatory walkability indexes. (A) main Web Map interface: (A1)—bookmarks facilitating switching between cities; (A2)—the legend; (A3)—the Gr map, (A4)—the Re map, (A5)—the St map; (A6)—the PoP map; (A7)—the hyperlinks to single city online maps with interactive dashboards. (B) the Web Map dashboard: (B1)—walkability balance graph, (B2)—the interactive map window, (B3)—the walkability indexes mean values graphs, (B4)—the walkability index max values graphs. The application can be freely accessed via https://arcg.is/0u0POa1, Cities Walkability Comparison, accessed on 10 January 2022.
Sustainability 14 02033 g009
Table 1. Selected case studies representing potential objective walkability indicators.
Case Study 1
The Prince’s Foundation Space Syntax Model [5]
Case Study 2
Weighted GIS-Based Walkability Index by A. Bartzokas Tsiompras and Y. N. Photis [42]
Case Study 3
Neighbourhood Walkability Index for Porto Metropolitan Area by A. I. Ribeiro and E. Hoffmann [16]
Case Study 4
Novel Walkability Index by J.C. Stockton et al. [17]
Potential of usage or number of usersResidential dwelling densityPopulation densityResidential dwelling densityResidential dwelling density
Convenience of
walking
Every day, non-residential uses and distance from people’s homes are mainly influenced by the connectivity of the street network and the size of urban blocks. It is normalised by comparison to the etalon cities: Clifton in Bristol and Faversham in Kent.Pathway network connectivity as intersection densityStreet connectivity as the density of intersectionsStreet connectivity as the indicator of street connectivity was junction density within neighbourhoods.
ProximityNot specifiedLand use mix Proximity to destinationsEntropy-based on general entropy index while considering retail, recreation, services, institutions, residential. Generalised entropy index ratio of retail building floor areas (mentioned but not included because of the absence of data)Land use mix
NotesSpace Syntax graph is used for modelling, and it could be seen as a complex yet straightforward indicator related to land use mix, pathways, connectivity.The survey’s findings were used for weightingObservation: more connected are streets—more direct the route through the network-
Table 2. Pearson’s correlations between Space Syntax indicators and density of POI in the eight case study cities.
Ch
1000
Ch
3000
Ch
5000
Ch
n
In
1000
In
3000
In
5000
In
n
MCh
1000
MR
1000
MTD
1000
NC
1000
NC
3000
NC
5000
TD
1000
TD
3000
TD
5000
TD
n
Vilnius0.270 0.205 0.158 0.031 0.5120.5700.5400.382 0.333 0.5620.6040.5900.5910.5370.5750.5530.487 −0.329
Kaunas0.260 0.159 0.134 0.029 0.491 0.432 0.429 0.227 0.313 0.481 0.5370.5570.464 0.455 0.5500.450 0.432 −0.211
Malmö0.078 0.172 0.104 0.015 0.380 0.368 0.332 0.192 0.215 0.423 0.426 0.423 0.351 0.284 0.357 0.263 0.182 −0.169
Riga0.202 0.180 0.154 0.028 0.443 0.484 0.468 0.294 0.262 0.496 0.491 0.5020.492 0.466 0.493 0.460 0.431 −0.243
Tallinn0.197 0.117 0.082 0.009 0.345 0.345 0.329 0.212 0.250 0.406 0.439 0.413 0.400 0.367 0.433 0.423 0.381 −0.198
Vilnius0.270 0.205 0.158 0.031 0.5120.5700.5400.382 0.333 0.5620.6040.5900.5910.5370.5750.5530.487 −0.329
Bialystok0.310 0.228 0.169 0.0030.557 0.5360.4770.258 0.365 0.5830.6440.6340.5590.486 0.6280.5350.456 −0.241
Gdansk0.243 0.124 0.084 0.015 0.480 0.375 0.340 0.235 0.298 0.5150.5500.5510.381 0.315 0.5320.323 0.243 −0.230
Lublin0.171 0.120 0.086 0.030 0.281 0.368 0.386 0.196 0.221 0.417 0.454 0.440 0.424 0.420 0.458 0.415 0.397 −0.175
Strong correlations are bolded, please note that even weak and medium correlations are significant.
Table 3. Spearman correlations between Space Syntax indicators and density of POI in the eight case study cities.
Ch
1000
Ch
3000
Ch
5000
Ch
n
In
1000
In
3000
In
5000
In
n
MCh
1000
MR
1000
MTD
1000
NC
1000
NC
3000
NC
5000
TD
1000
TD
3000
TD
5000
TD
n
Vilnius0.181 0.111 0.090 −0.045 0.5500.6160.6210.5220.3870.5920.6300.6350.6310.6220.6380.6090.589−0.522
Kaunas0.231 0.163 0.135 −0.018 0.6010.6100.5920.3180.4590.6240.6480.6540.6200.6010.6460.5960.568−0.318
Malmö0.052 0.203 0.102 −0.028 0.483 0.439 0.354 0.144 0.358 0.5480.5670.5640.465 0.365 0.548 0.417 0.303 −0.144
Riga0.260 0.157 0.118 −0.077 0.6290.6340.6080.406 0.5220.6740.6810.6860.6390.6030.6840.6180−0.406
Tallinn0.296 0.210 0.162 −0.051 0.6590.6730.6420.463 0.5370.6820.7010.7050.6860.6490.7010.6710.629−0.463
Vilnius0.181 0.111 0.090 −0.045 0.5500.6160.6210.522 0.387 0.5920.6300.6350.6310.6220.6380.6090.589−0.522
Bialystok0.303 0.193 0.140 −0.048 0.7090.7190.6900.458 0.5710.7490.7740.7780.7450.7210.7710.7320.699−0.458
Gdansk0.213 0.092 0.051 −0.048 0.6150.6090.5710.412 0.420 0.6390.6730.6880.6130.5270.6630.5400.404−0.412
Lublin0.208 0.141 0.108 0.0030.5120.6340.6410.288 0.417 0.6630.7010.7070.6820.6680.7100.6590.631−0.288
Strong correlations are bolded, please note that even weak and medium correlations are significant.
Table 4. Walkability spatial pattern statistics.
Riga City (7 993 Hexagons)
IndicatorsGrReStPop
Hexagon count at index value ≥0.386 3342751 639
Zones count (sub-zones)1 (1)1 (1)3 (3)3 (10)
Observed G (exp. G 0.000027)0.0001120.0000460.0000480.000038
Z-score375.455809316.714872318.830688281.892394
Detected pattern typeIslandsHierarchicalHierarchicalHierarchical
Kaunas City (4 107 hexagons)
IndicatorsGrReStPop
Hexagon count at index value ≥0.340751376703
Zones count (sub-zones)1 (1)7 (14)6 (11) 1 (1)
Observed G (exp. G 0.000027)0.0001760.0000300.0000310.000038
Z-score418.688224303.473986305.751315355.719158
Detected pattern typeLinearHierarchicalHierarchicalConcentric
Vilnius City (10 547 hexagons)
IndicatorsGrReStPop
Hexagon count at index value ≥0.3714543161 174
Zones count (sub-zones)1 (5)6 (11)5 (15)1 (8) *
Observed G (exp. G 0.000027)0.0001230.0000180.0000180.000029
Z-score586.364994450.826360455.353348542.769738
Detected pattern typeIslandsDispersalConcentricConcentric
Tallinn City (4 235 hexagons)
IndicatorsGrReStPop
Hexagon count at index value ≥0.3228726011463
Zones count (sub-zones)1 (1)5 (11)3 (9)1 (8)
Observed G (exp. G 0.000027)0.0002290.0000250.0000260.000029
Z-score458.522811302.480298306.209806348.686820
Detected pattern typeIslandsMulti-nucleiMulti-nucleiSectoral
Malmö City (4 199 hexagons)
IndicatorsGrReStPop
Hexagon count at index value ≥0.341689581881
Zones count (sub-zones)1 (1)3 (8)3 (8)1 (3)
Observed G (exp. G 0.000027)0.0001800.0000350.0000370.000039
Z-score410.752427318.813301326.751735341.621988
Detected pattern typeLinearHierarchicalHierarchicalConcentric
Białystok City (2 730 hexagons)
IndicatorsGrReStPop
Hexagon count at index value ≥0.3311008358935
Zones count (sub-zones)1 (1)2 (8)7 (14)1 (3)
Observed G (exp. G 0.000027)0.0001030.0000340.0000340.000041
Z-score355.475254209.424025212.638612280.465816
Detected pattern typeIslandsSectoralHierarchicalConcentric
Gdansk City (10 965 hexagons)
IndicatorsGrReStPop
Hexagon count at index value ≥0.35111689612566
Zones count (sub-zones)4 (4)16 (35)16 (36)2 (20)
Observed G (exp. G 0.000027)0.0000530.0000150.0000160.000016
Z-score584.021909409.330307413.772253439.286352
Detected pattern typeIslandsLinearLinearSectoral
Lublin City (3 918 hexagons)
IndicatorsGrReStPop
Hexagon count at index value ≥0.335532408830
Zones count (sub-zones)1 (2)4 (10)7 (8)2 (4)
Observed G (exp. G 0.000027)0.0000950.0000340.0000350.000040
Z-score393.877912293.515790299.634254327.068993
Detected pattern typeIslandsSectoralSectoralHierarchical
Table 5. Pearson correlations constitute walkability compasses.
Gr-ReGr-StGr-PoPRe-StRe-PoPSt-PoP
Bialystok0.3870.3690.6070.9910.5230.481
Gdansk0.5110.5220.2970.990.50.475
Kaunas0.380.3730.2710.9930.530.505
Lublin0.4690.4560.4390.9940.5320.508
Malmö0.4050.4230.4660.9910.5840.587
Riga0.7860.7890.5260.9960.6870.661
Tallinn0.3880.3730.3740.9950.5940.57
Vilnius0.60.6170.4890.9920.3850.363
All correlations are of 0.01 significance, meaning that the chance of the random correlations is equal to 1.
Publisher’s Note: MDPI stays neutral with regard to jurisdictional claims in published maps and institutional affiliations.