Article

Drying of Carrot Strips in Indirect Solar Dehydrator with Photovoltaic Cell and Thermal Energy Storage

by
Pedro Cerezal-Mezquita
1,* and
Waldo Bugueño-Muñoz
1,2
1
Departamento de Ciencias de los Alimentos y Nutrición, Facultad de Ciencias de la Salud, Universidad de Antofagasta, Avenida Universidad de Antofagasta #02800, Campus Coloso, Antofagasta P.O. Box 1240000, Chile
2
Programa de Magister en Desarrollo Energético, Facultad de Ingeniería, Universidad de Antofagasta, Avenida Universidad de Antofagasta #02800, Campus Coloso, Antofagasta P.O. Box 1240000, Chile
*
Author to whom correspondence should be addressed.
Sustainability 2022, 14(4), 2147; https://doi.org/10.3390/su14042147
Submission received: 31 December 2021 / Revised: 6 February 2022 / Accepted: 10 February 2022 / Published: 14 February 2022

Abstract

:
Minimizing agricultural losses, accompanied by employing technologies capable of taking advantage of solar energy, are the current challenges of the Antofagasta region of Chile due to having an average solar irradiance of 7.2 kWh/m2 per day. With this objective, using an indirect solar dryer with storage of thermal energy in the form of sensible heat, the effect of drying on the quality of carrot strips was studied using chromatic coordinates CIEL*a*b*, the color difference (ΔE), the relationship between redness/yellowness (R = a*/b*), browning index (BI), whiteness index (WI), chroma (C), hue angle (h°) and drying kinetics. The experimental drying data were fitted to 15 typically employed nonlinear regression models. The ΔE = 14.11 ± 0.14 between the carrots in the dry and fresh conditions represented a detectable color change, the R ratio increased from 0.75 to 0.89, the BI index decreased from 209.82 ± 0.62 to 148.38 ± 0.26 and the WI index increased from 24.5 ± 0.11 to 31.8 ± 0.17, indicating color affectations due to the process. The coefficients of determination, (R2) close to 1 and the values closest to 0 of χ2, SSE and RMSE, led to the best fit corresponding to the Weibull distribution model. In addition, it was found that the operation of the drying installation in the hours without incident solar radiation maintained the drying temperature values throughout the process.

Graphical Abstract

1. Introduction

Among the 39 main fruits and vegetables, carrots occupy the tenth place in the ranking of nutritional value, being a good source of dietary fiber and trace element molybdenum, which is rarely found in vegetables [1]. Carrot is one of the important root crops cultivated worldwide, with annual production in 2017 of 42.8 million tons, reported as carrot + turnip. China has been the world’s leading carrot-producing country for many years, with 45% of the global production. Other key carrot-producing countries are the United States and Ukraine. However, Chile reported a production of 168,484 tons in 2017 [2]. In many cases, carrot must be dried before its use. Many drying techniques have indeed been employed to dry carrots to maintain their appearance and their nutrients, especially β-carotene [3].
Vegetable cultivation in Chile stands out in second place; after corn, the carrot represents 2.8% of the hectares sown at the national level [4], being not only an attractive raw material for its designation of origin but also by its contribution in carotenoids and antioxidant capacity [5]. In addition, it is considered one of the most commonly used vegetables for human nutrition due to its high content of vitamins and fiber [6].
The agriculture of the Antofagasta Region in Chile, in addition to its potential contribution to regional food autonomy, constitutes the basis of the existence and reproduction of Atacama culture (Lickan Antay) since it is a form of agriculture but in the desert heights, associated with water scarcity and abundance of the sun [7]. The solar resource of the Atacama Desert of this region reaches an average global horizontal irradiance (GHI) of 7.2 kWh/m2 per day [8], positioning this area as a potential pole of development of technologies that take advantage of solar energy (SE), defined as one of the non-conventional renewable energies (NCRE) due to its inexhaustible, non-polluting character and because it does not present associated environmental hazards [9,10].
Sun-drying is the most common method used to preserve agricultural products in tropical and subtropical countries, despite the problems and the risk of pollution involved, as opposed to conventional drying, which is one of the unit operations that require more intensive energy, and many investigations have been carried out to explore savings in their use [11]. It is considered a high-cost procedure, which restricts the supply of dehydration services for small producers. It is because of this that the economy of the drying process is affected and dependent on a stable supply of fuel, which, in developed countries, must satisfy between 7–15% of the industrial energy for drying [9]. The inefficiency of the drying processes due to the high energy expenditure, estimated at 75% of the total cost of the process [12], has led to the use of alternative sources of energy, such as the SE, as well as the development of models to achieve the best process conditions.
In the direct solar dryers (DSD), the SE received by the material to be dried comes directly from the sun’s rays. However, in the indirect solar dryers (ISD) with natural circulation (ISDNC) or forced circulation (ISDFC), the SE heats directly to the air that circulates inside, which, in turn, delivers the heat to the material to be dried, or the air is simply heated by solar irradiance through collectors, which are responsible to perform this action [13]. The most modern ISDFC can heat the air through liquid media (water, alcohols, oils, etc.) that are previously heated by the direct action of the sun and can be used for the storage of energy in the form of sensible heat [14]. Moreover, ionic liquids or other solid materials are also being used, whose energy reserve is made through the storage of the latent heat of phase change, its acronym in English being “PCM” [15,16].
For research on the dehydration of biological products, the ISDFC-type facilities, which use collectors for the capture of energy in their configuration for heating the water and its thermal storage in hydropneumatic isothermal tanks, have been developed by the Department of Science of the Food and Nutrition of the University of Antofagasta [14].
Different pretreatments, cutting forms and drying methods have been used to dehydrate the carrot. Regarding the application of pretreatments in the carrot for enzyme inactivation, the following have been used: (a) blanched by immersing it in hot water at 80 ± 1 °C for 2 min; (b) pre-treated with a potassium carbonate solution + olive oil solution (5% potassium carbonate + 0.5% olive oil) at 20 ± 1 °C for 2 min; (c) steam for 3 min; (d) infrared radiation for 15 min and (e) not pre-treated with anything (control) [17,18]. To alleviate the adverse effect of hot air drying, many pretreatment methods have been proposed with citric acid, using it as an anti-darkening agent and a texture-modifier, were investigated; carrots were soaked in citric acid at a pH of 4 or 5 or blanched in citric acid at a pH of 4 or 5 before hot air drying. Untreated carrots, carrots soaked in water and carrots blanched in water were used as control samples [3].
Several authors have used carrots in drying studies using different methods, including microwave-assisted ones [19,20], and those who have added reduced pressure to this experience [21,22], preferably experimenting with carrots cut into discs and cylinders. Another traditionally used method is conventional hot air drying. In the food industry, hot air drying is probably the most widely used drying technique [3,17,23], although fluidized bed drying has also been used with carrots cut into slices and cubes [20,24].
Drying studies carried out in areas of high solar radiation, such as the Atacama Desert in Chile, have not been documented, much less in the form of cutting into strips. ISDFC is more similar and comparable in terms of the drying chamber (cabinet), shape of carrot cut (cubes and slices) and drying condition to those proposed in the present investigation, which are (a) the one developed by Romano et al. [25] and (b) the triple-pass solar drier for drying of carrot slices [26].
Safe and accurate estimates of the effective moisture diffusivity (Deff) for food drying systems in solar drying conditions and the development of a simple methodology with general applicability for reliable simulation of the drying process are some of the major challenges faced by the researchers at present. Furthermore, the modeling and simulation of the mass transport phenomenon during solar drying of carrot slices has not been studied yet [27], as well as in the forms of cutting, cubes and strips.
With this objective, using an indirect solar dryer, the effect of drying on the color degradation of the carrot (Daucus carota L.) cut into longitudinal strips was studied, and the thermal behavior of the installation was also determined, which uses the recirculation of air and thermal storage in water based on sensible heat as characteristics that allow the use of energy for drying day and night.

2. Materials and Methods

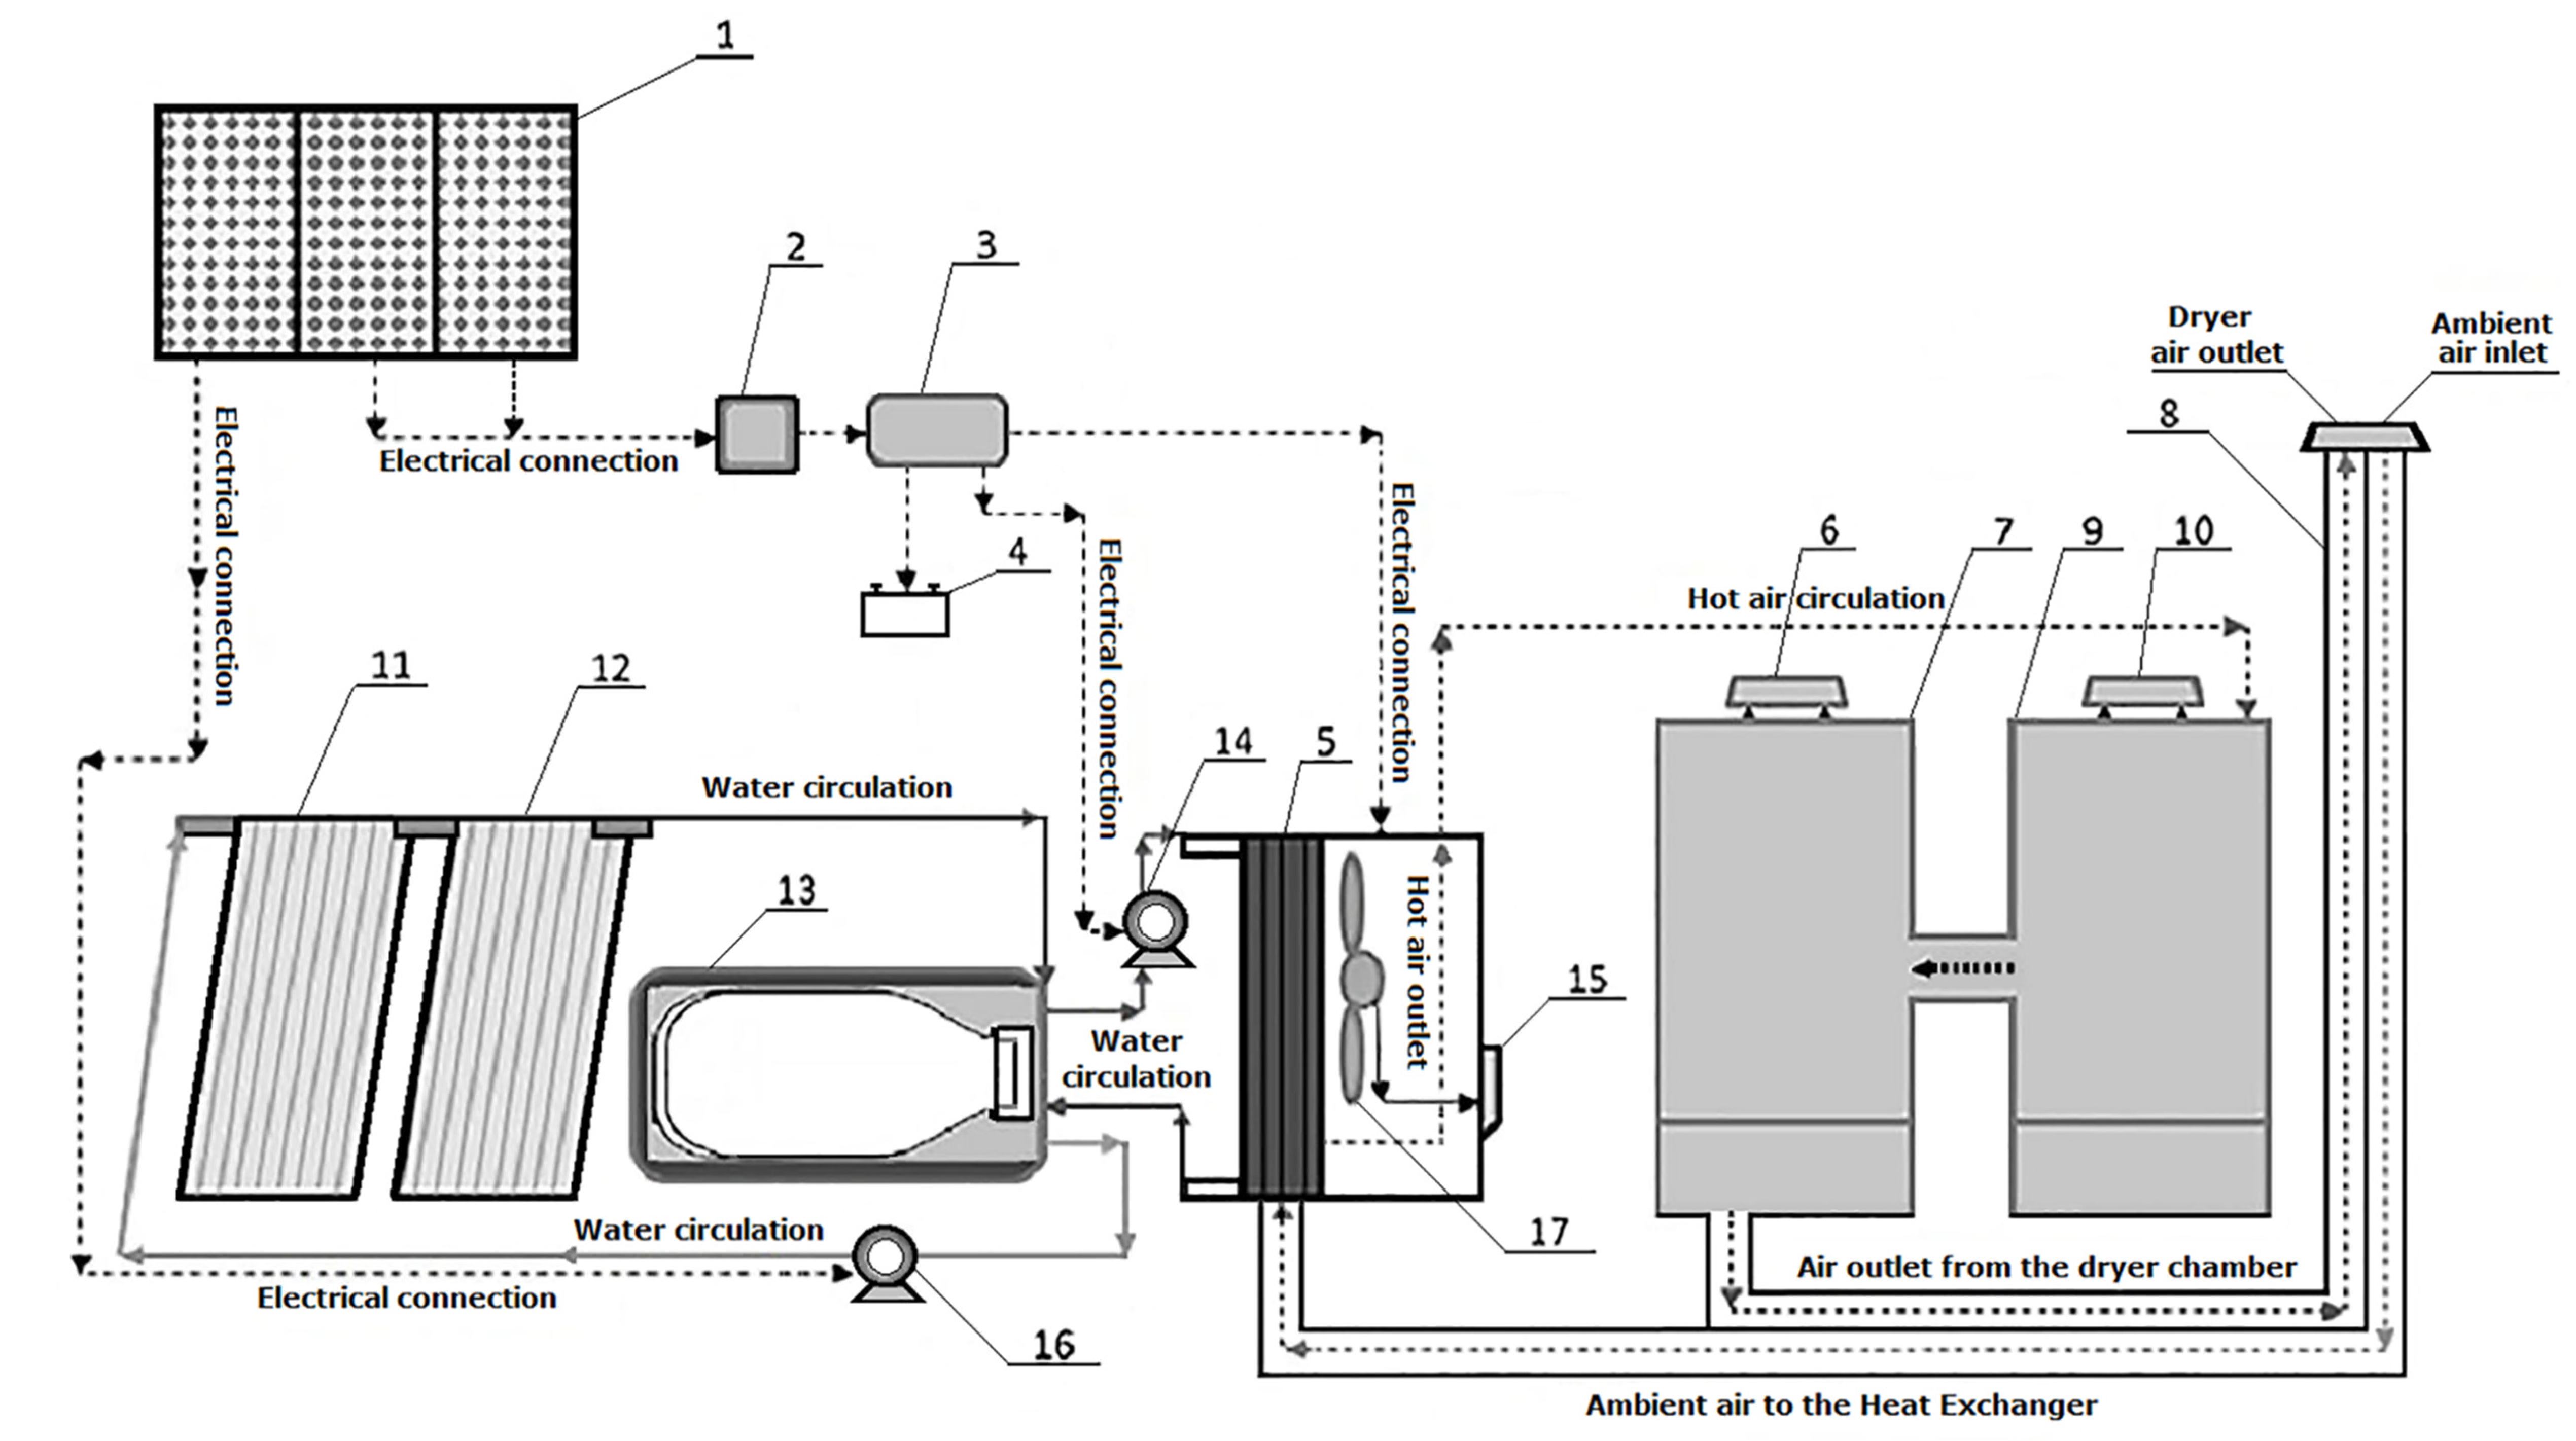
2.1. Solar Drier Equipment and Complementary Equipment

The experimental equipment mainly consists of a pilot solar dryer of indirect operation using thermal energy storage in water and equipped with solar collectors (U-pipe) for converting the solar irradiance in heat energy and photovoltaic cells (monocrystalline) for converting the solar irradiance in electricity (Figure 1). The description of the operation, the mode in which the air heating is performed and the complementary equipment that make up the solar drying installation are exhaustively described by Mezquita et al. [14].

2.2. Experimental Procedure

Carrots used in the research were purchased from a central market of vegetables in the city of Antofagasta through a supplier from the community of Chiu-Chiu, a locality in El Loa Province, recognized as one of the main carrot producing areas in the region of Antofagasta, Chile.
Carrots were washed with water manually, rubbed with brushes, cut in strips (without removing the skin) 0.2 cm thick by 2 cm long and placed between 327 to 342 g of weight per tray, distributed evenly on three trays before starting the drying process; the thickness of the thin layer was 4 mm. During the drying period, the weight of the trays was determined with the strips of carrots every 20 min in each of the drying chambers using the coupled balances. The drying process was continued until constant weight. In all experiments, a constant airflow velocity of 1 m/s was set for the entire drying process. Experimental processes were performed in the spring (southern hemisphere) between September and October of 2016.
The initial moisture determination of the carrot sample was performed by drying on infrared balance, model ML-50 (A&D, Moisture Analyzer, Tokyo, Japan). The initial amount used in each analysis was 5 g, and it was not concluded until a constant weight was reached. The analyzes were carried out in triplicate at 100 °C.

2.3. Drying Curves and Mathematical Modeling

Calculations for Making Drying Curves and Determining the Drying Ratios

For the preparation of the drying curves, a record of the data obtained experimentally was taken at constant time intervals (minutes), with which the moisture (g of water/g dry solid) of the product was calculated at each time, being able to obtain the graphs that relate the moisture loss concerning time. The moisture content (g water/g dry solid) was determined using the following equation [28]:
M = ( W o W ) W 1 W 1
where M: moisture content at any time (g water/g dry solid); Wo: initial weight of the sample (g); W: the amount of evaporated water (g); W1: dry matter content of the sample (g)
The moisture ratio (MR) was simplified to ( M M 0 ) , (where Mo is the content of the initial moisture at time = 0) instead ( M M e ) ( M o M e )   because, in solar drying, the sample can be dried until very close to the equilibrium condition and reach approximately the content of the dry matter [28]. In such a way, the measurement of the equilibrium moisture content is not necessary (Me).
Different mathematical models have been proposed to describe the characteristics of agricultural products (fruits and vegetables) during the conventional drying process and in solar dryers [14,29]. All the equations applied in this study to model the drying kinetics of carrot strips are shown in Table 1. Three of these models are: “models derived from Newton’s law of cooling”; nine are: “models derived from Fick’s second law of diffusion”; three are: “empirical models” [29].

2.4. Color Analysis

Color determination of the fresh and dried samples was measured by a Hunter laboratory tristimulus colorimeter (Color Flex, Hunter Lab Inc., Reston, VA, USA). The instrument, equipped with D65 illuminant and 10° observer optical position, was calibrated using black and white reference tiles provided. All measurements were made using the CIEL*a*b* system. The parameters L*, a* and b* indicate whiteness/brightness, redness/greenness and yellowness/blueness, respectively. For each sample, at least ten measurements were made at different positions of the sample, and each of the measurements were made in triplicate. The color change was determined by color difference (Equation (2)), the chroma (Equation (3)) and Hue angle (Equation (4)) [37].
Δ E = Δ L * 2 + Δ a * 2 + Δ b * 2
Chroma = ( a * 2 + b * 2   ) 1 2
Hue   angle = tan 1 ( b * a * )
where Δ L * = L 2 *   L 1 * : Luminosity difference; Δ a * = a 2 *   a 1 * : Redness difference; Δ b * = b 2 *   b 1 * : Yellowness difference. The subscripts 1 and 2 were used to designate the conditions (initial and final) in which the colors were determined, establishing the color differences between both points. The relationship of redness on yellowness was calculated as follows (Equation (5)) [38]:
R = a * b *
where: a* and b* are chromatic coordinates
A color parameter that was also calculated is that which represents the purity of brown color (brown) and is reported as an important parameter in the processes in which enzymatic and non-enzymatic browning take place [39]. This calculation is performed mainly in the drying processes to indicate degradative aspects of the color, such as the browning index (BI) (dimensionless) and whiteness index (WI) (dimensionless) [40], represented by the Equations (6)–(8):
BI = [ 100   ( x 0.31 ) ] 0.172
where x is:
x = ( a * + 1.75 L * ) ( 5.645 L * + a * 3.012 b * )  
WI = 100 ( 100 L * ) 2 + a * 2 + b * 2

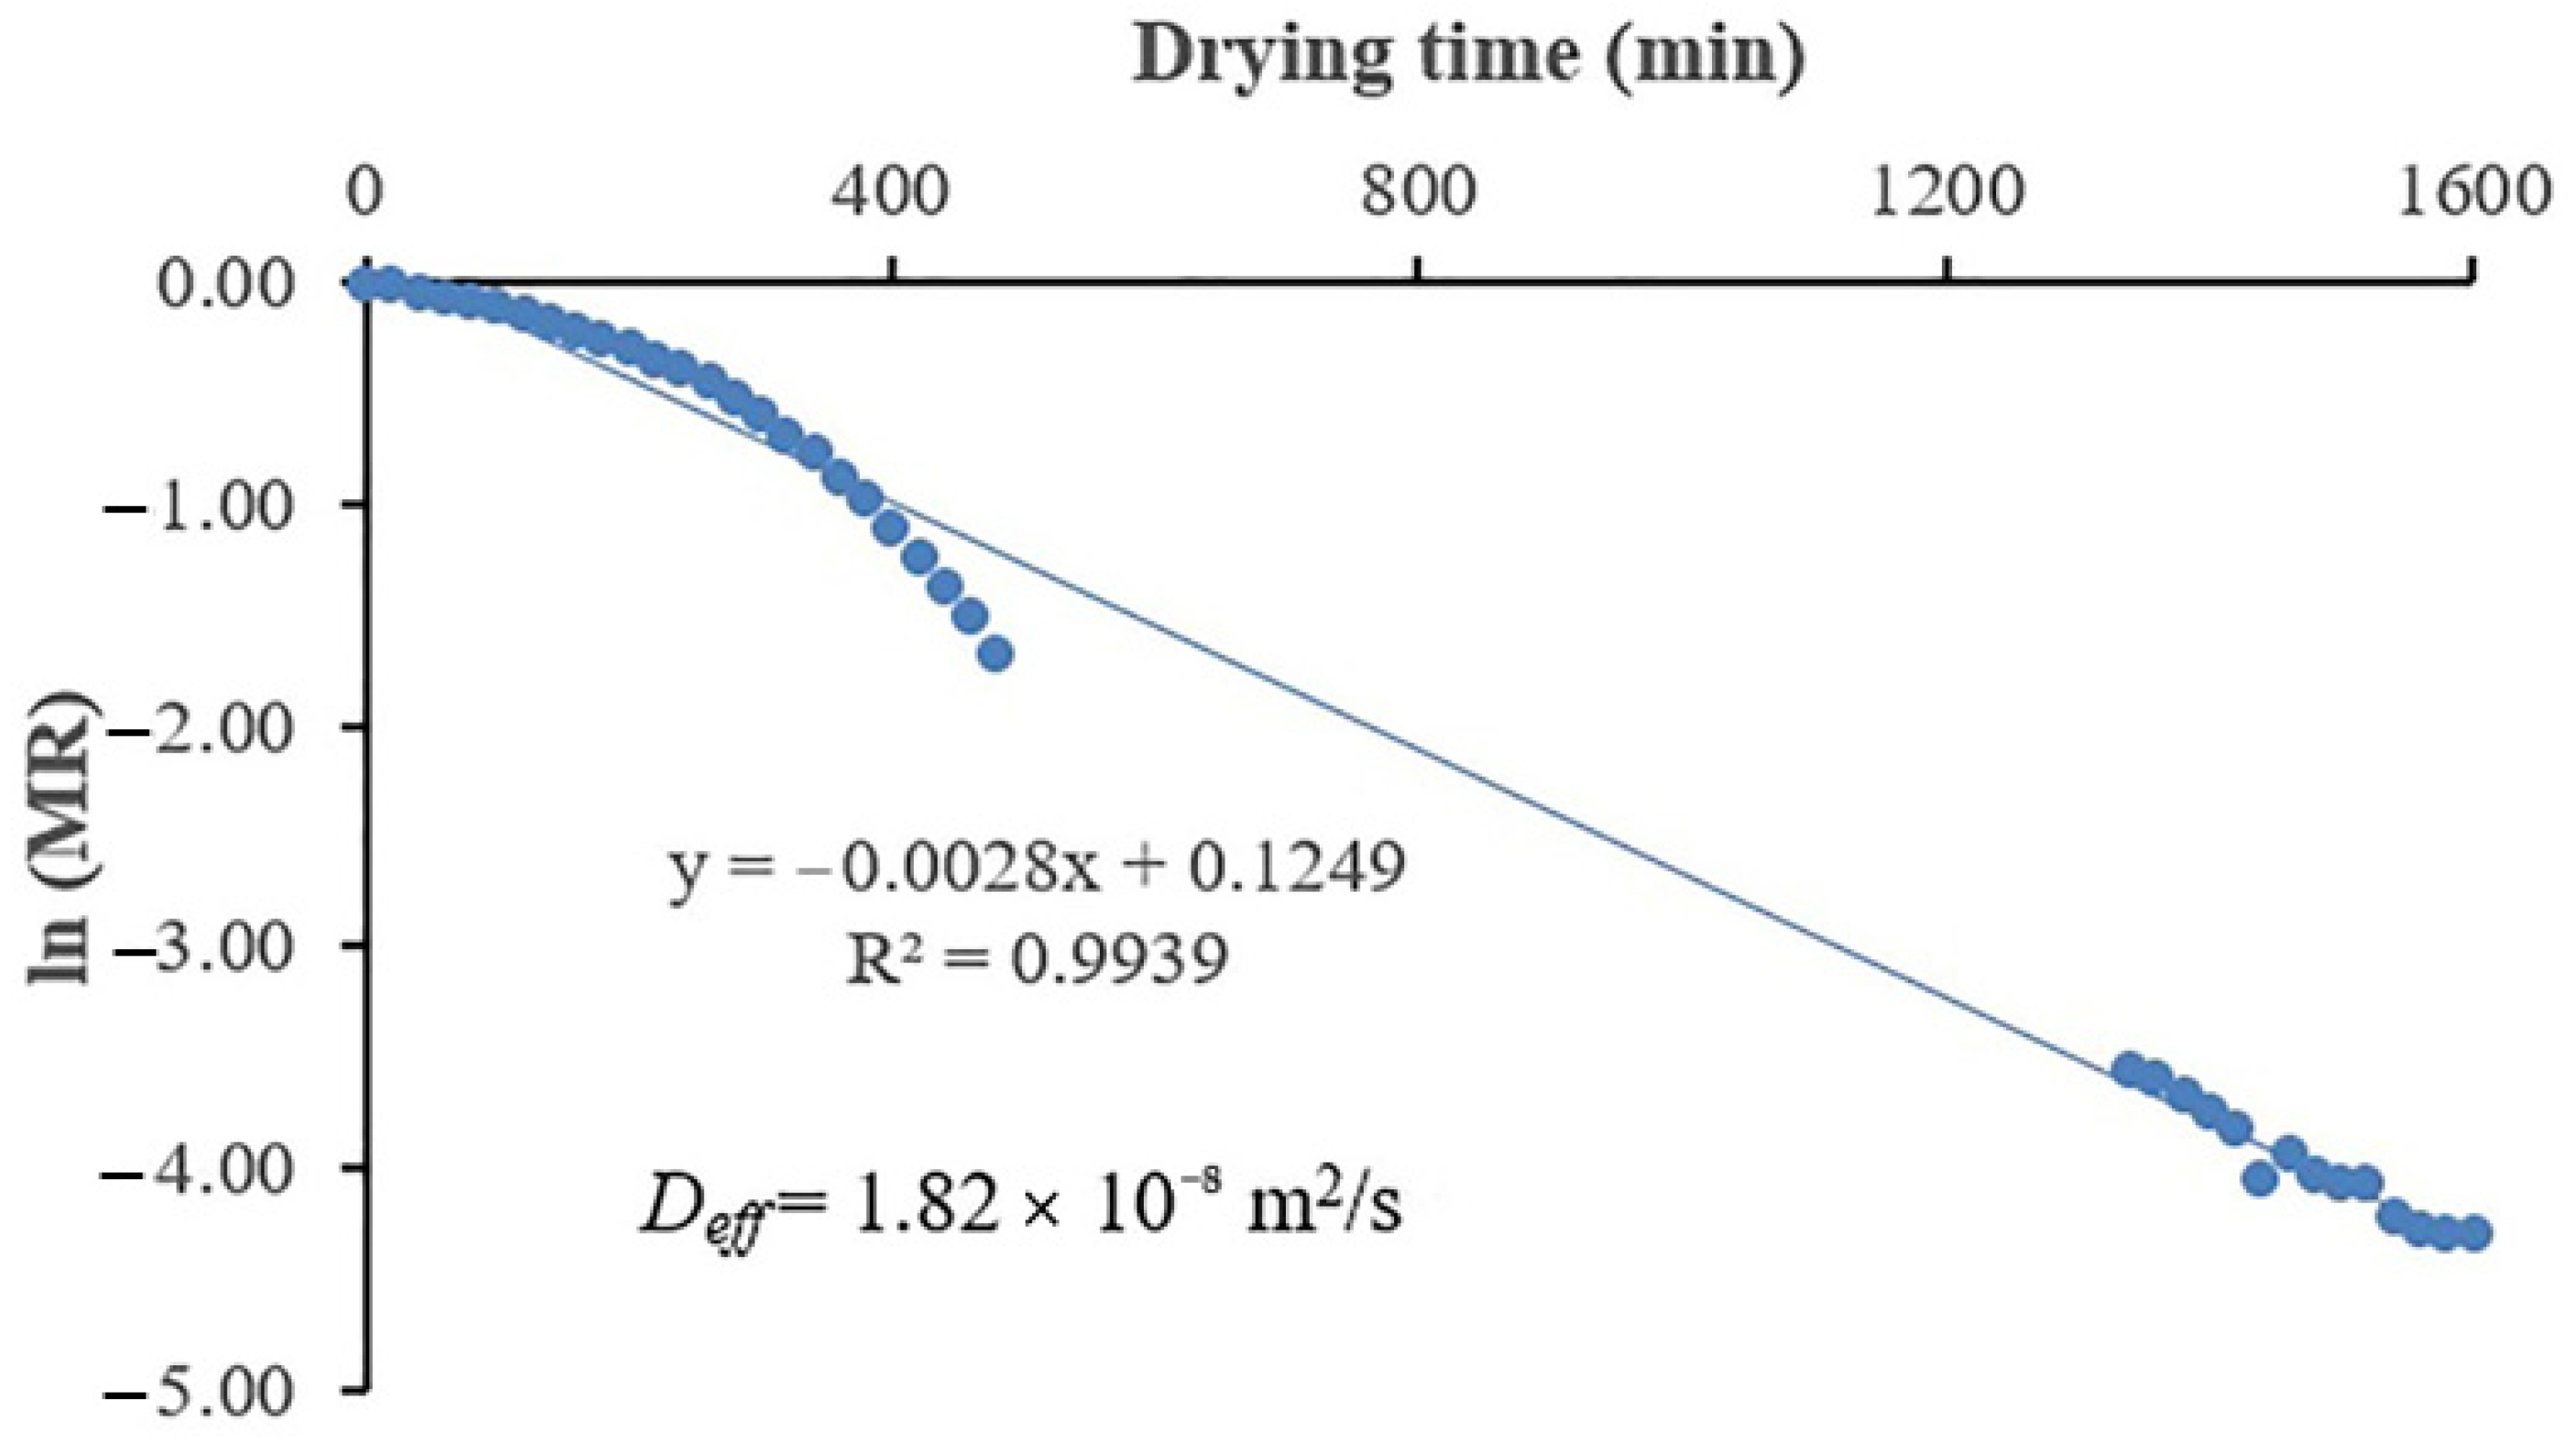
2.5. Calculation of Effective Diffusivity Coefficient

Fick’s second law was used to determine the effective diffusivity coefficient, which is adequate for diffusive phenomena during the mass transfer in the food during drying until reaching equilibrium. Fick’s second law, symbolized as a mass-diffusion equation for drying of agricultural products in a falling rate period, is shown in the following Equation (9):
M t = D eff 2 M
The analytical solutions of Fick’s second law (Equation (9)) for infinite slab can be given as Equation (10) with the assumptions of neglecting shrinkage, constant temperature, diffusion coefficients and uniform initial moisture distribution [41].
MR = 8 π 2 n = 0 1 ( 2 n + 1 ) 2 exp ( ( 2 n + 1 ) 2 π 2 D eff t 4 L 2 )
where Deff is the effective moisture diffusivity in m2/s, t is the time (h), n is a positive integer and L is the half-thickness of samples (m). For long drying periods, Equation (10) can be further simplified to only the first term of the series. Equation (11) is written in a logarithmic form as follows:
ln ( MR ) = ln ( 8 π 2 ) ( π 2 D eff   t 4 L 2 )
The effective moisture diffusivity is calculated from the slope of a straight line by plotting data in terms of ln (MR) versus drying time, for which slope is K (Equation (12)):
K = π 2 D eff 4 L 2

2.6. Statistical Analysis

The fit of the best mathematical model that describes the thin layer drying curve of carrot strips samples was done using the 15 models presented in Table 1, employing the non-linear regression analysis through the Statgraphics-Centurion XVI.1 software (StatPoint Technologies Inc., Warrenton, VA, USA).
The determination coefficient (R2) (Equation (13)) [17] was one of the main criteria to evaluate the fit quality of proposed mathematical models, complemented by the calculation of the statistical parameters: root means square error (RMSE) (Equation (14)) [17], sum square errors (SSE) (Equation (15)) [17] and the reduced chi-square (χ2) (Equation (16)) [17]. These parameters were calculated with the following equations:
R 2 = 1 i = 1   N ( MRpre , i MRexp , i ) 2 i = 1   N ( MRpre MRexp , i ) 2
RMSE = [ 1 N   i = 1 N ( MR pre , i     MR exp , i ) 2 ] 1 / 2
SSE = 1 N   j = 1 N ( MR exp , i     MR pre , i ) 2
χ 2 = i = 1   N ( MR exp , i MR pre , i ) 2 N n
where MR exp , i is the ith experimentally observed moisture ratio found in any measurement and MR pre , i   is the ith predicted moisture ratio for the measurement under consideration. N and n are the number of observations and the number of constants, respectively.
The statistical analysis of experimental data was determined by applying an analysis of variance (ANOVA) to estimate any statistically significant difference at a confidence level of 95% (p < 0.05). Differences between mean values were established using Duncan’s multiple range tests. The highest values of R2 (≈1.0), along with the closeness of RMSE, SSE and χ2 values to zero, were selected as optimal criteria to evaluate the fit quality of the proposed drying models. All data were presented as mean values with standard deviations. All solar drying experiments were replicated thrice under similar conditions.

3. Results and Discussion

3.1. Drying Characteristics

3.1.1. Drying Curve

The initial moisture content of the carrot samples was 9.07 g of water/g of dry solid, corresponding to 9.93 ± 0.08% of the total solids, and, in that condition, they were subjected to the solar drying process until the weight losses were made practically constant. This moisture content in the fresh carrot, an ecotype of the community of Chiu-Chiu, is within the ranges of percentages reported in different investigations, which are between 87.0 and 93.0% (bh) [6,21,42].
In Figure 2, the drying curve, moisture ratio ( M M 0 ) vs. drying process time (min), is presented, in which a total average time of the drying processes of 1600 min (26.7 h) was recorded. In addition, three stages stand out, the first consisting of the induction period, called “stage A”, of 80 min (1.3 h), the second consisting of the constant drying rate period, called “stage B”, of 380 min (6.3 h), which was defined through the best fit of the straight line shown in Figure 2 with R2 = 0.9941, between the end of the induction period and the beginning of the third stage, which is made up of the falling drying rate period, called “stage C”, of 1140 min (19 h).
Regarding the hours of incidence of solar irradiance, up to 591 min (≈10 h) profited on the first day of drying, and 200 min (3.3 h) on the second day of drying, equivalent to 47.4% of the total process time, where the maximum average temperatures of 56.1 °C (air in chamber 1) were reached (Figure S1 and Table S1; Supplementary Materials), with an average relative humidity of 43.4 ± 1.5%.
Due to the thermal storage of heat carrier liquid (distilled water) in the drying installation, it was possible to continue with the drying process in the night period without the influence of solar radiation, which represented 46.1% of the total time of the drying process, 770 min (12.83 h), achieving the carrot strips moisture (bh) of 20% at end of the night. However, the final moisture content reached by the carrot strips was 0.131 ± 0.001 g of water/g of dry solid, which corresponded to 11.56% moisture (bh), a value lower than 14%, which is recommended for a dry agricultural product that remains without deterioration [43] and is within the range of 5.7 to 22.5%, which are the optimal values to ensure microbiological stability.
Urrea et al. [44] reported that the loss of carotenoids depends on the drying temperature to which the carrot samples are exposed. In the carotenoids, where β-carotene, the main component of carrots, is found, it is usually in a concentration of 45 to 80% [45], and they are relatively stable when drying takes place at low temperatures (40 to 60 °C) but are very sensitive to higher temperatures (70 to 90 °C) [46,47]. Moreover, Sun et al. [48] reported, using a heat pump assisted convective dryer, and Zielinska & Markowski [49], employing a fluidized bed dryer, concluded that the highest retention of β-carotene in carrot drying was observed at temperatures of 40 °C, 50 °C and 60 °C, reaching 81.8%, 77.9% and 73.0%, respectively. This indicated that the retention of β-carotene was largely dependent on the drying temperature. Due to this approach, it is to be expected that, in the present investigation, the sensitive components have not been significantly altered during the indirect solar drying process by maintaining an average temperature of 37.2 °C with a maximum of 56.1 °C during the process, which can be observed in Figure S1 and Table S1 (Supplementary Materials) in chambers 1 and 2.

3.1.2. Drying Rate Curve

The drying rate curve observed in Figure 3 shows a typical curve of a convective drying process with its induction period (A), constant drying rate period (B) and falling drying rate period (C), similar to those obtained by Doymaz [27] for convective hot-air drying carrot slices. The maximum temperature of the drying air was obtained in the period of constant drying speed, being 56.1 and 40.3 °C in drying chambers 1 and 2, respectively. In this period, the highest average value of the drying speed was also reached, being 0.023 ± 0.001 g water/g dry solid * minute. This period can be seen in Figure S1 (Supplementary Materials) between 11:50 and 18:10 h (380 min), this last hour being where the critical moisture (Mc) of the process was established, 2.01 g of water/g of dry solid (Figure 3), which is defined by the end of the constant drying rate period and the start of the falling drying rate period [50], showing the fitted straight line MR = −0.0019 Dt + 1.1071 (R2 = 0.9941) of the constant rate period (Figure 2 and Figure 3).
Critical moisture (Mc) is not a property of the food but depends on the ease of movement of moisture through the solid, the porosity of the food structure [51] and the drying process conditions. In a forced-air convective drying study using cubed carrots, Mc values were obtained between 2.4 and 3.9 g water/g dry solid [52].
In Figure 3, the induction period began with an initial moisture content value (Mo) of 9.07 g of water/g of dry solid until reaching a moisture value of 8.32 g of water/g of dry solid at 80 min. From there, the constant drying rate period began where a drying rate of 0.010 to 0.023 g of water/g of dry solid * min is reached for a mean value of 0.0165 g of water/g of dry solid. This variation is due to fluctuations in air temperatures in the drying chambers, which is logical for this type of indirect solar dryer that depends on the air–water heat exchange that occurs when the constant temperature in the heat carrier liquid is not maintained. At this stage, the air temperature in drying chambers 1 and 2 reached values of 30.4 °C and 22.4 °C for the beginning and 55.5 °C and 40.3 °C for the end, respectively (Figure S1 in Supplementary Materials). Once the Mc was reached, the falling drying rate period began, and the drying rate progressively decreased until equilibrium, reaching mean values of 0.00045 g water/g dry solid*min and final moisture, called equilibrium moisture (Meq), with mean values of 0.129 g of water/g of dry solid (Figure 3).
In other studies performed with carrots in the form of slices and/or cubes using convective solar drying, similar results have been obtained both in the behavior of the drying curves and in the drying rate curves [27,53,54].

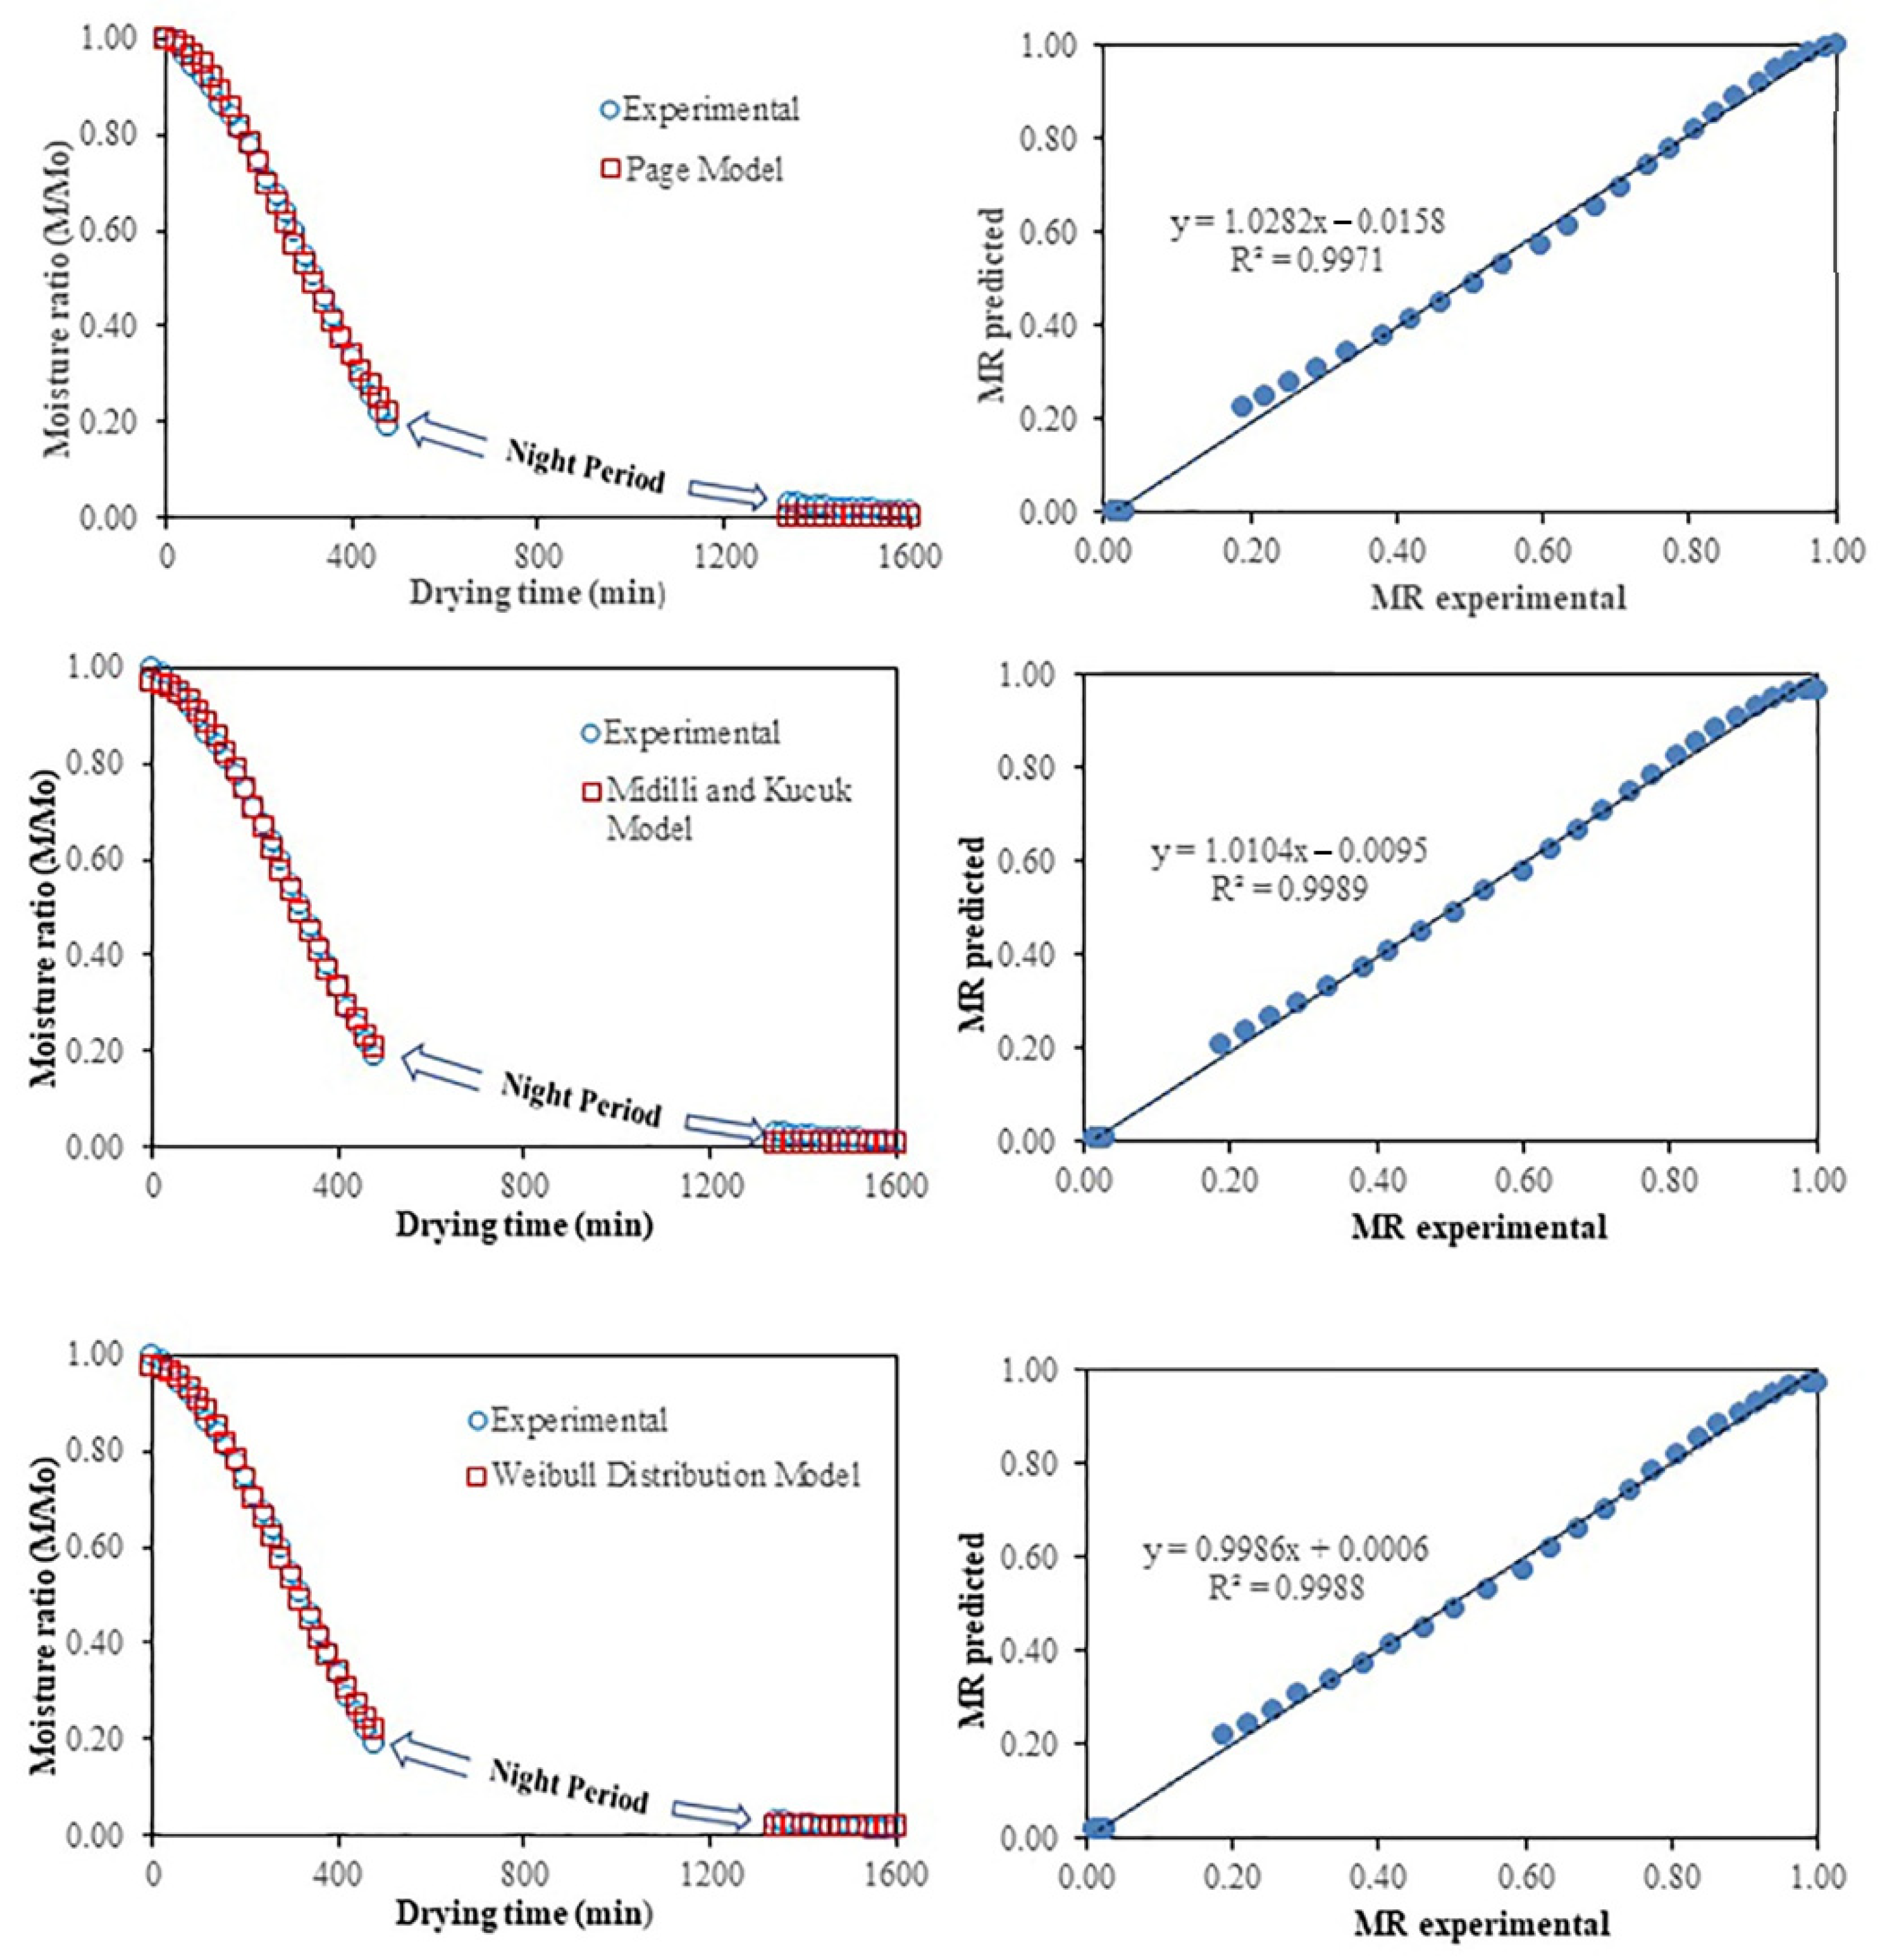
3.2. Modeling of Drying Curves Statistical Parameters

Table 2 shows the results of the statistical parameters, R2, χ2, SSE and RMSE, which were used to determine the goodness of fit of the drying curves of the fifteen models studied in carrot strips [33]. The values closer to 1 for R2 and closest to 0 for χ2, SSE and RMSE were considered optimal criteria to assess the quality of fit of the models [55]. Thus, the best fit model, according to the thermal history displayed in the process drying curve for the group of the three models derived from Newton’s law of cooling, Newton, Page and modified Page, was the Page model with R2, χ2, SSE and RMSE values of 0.9971, 4.0 × 10⁻⁴, 3.7 × 10⁻⁴ and 1.936 × 10⁻², respectively. The values of the kinetic constant (k) and the empirical parameter (n) were: 1.836 × 10⁻⁵ min−1 and 1.83288, respectively.
Amongst the tested models for the group of the nine models derived from Fick’s second law of diffusion, Henderson and Pabis, modified Henderson and Pabis, logarithm, approach of diffusion, Midilli–Kucuk, two-term, two-term exponential, Aghbashlo and Verma models (Table 2), the one with the best fit was the Midilli–Kucuk model with R2, χ2, SSE and RMSE values of 0.9989, 2.1 × 10⁻⁴, 1.9 × 10⁻⁴ and 1.376 × 10⁻², respectively; with empirical constants a, b and n of 0.967416, 1.3 × 10⁻⁵, 2.047330 and the kinetic constant (k) of 5.0 × 10⁻⁶ min−1, respectively.
Of the three tested models that belong to the group of so-called empirical models, the one that resulted in the best fit was the Weibull distribution model with values to R2, χ2, SSE and RMSE of 0.9988, 1.7 × 10⁻⁴, 1.6 × 10⁻⁴ and 1.252 × 10⁻², respectively; being the empirical constants a, b and n of 1.812 × 10⁻², −0.95691, 1.9768 and the kinetic constant (k) of 7.87 × 10⁻⁶ min−1, respectively (Table 2).

3.3. Model Validation

Figure 4 shows the process curves made with the experimental values versus the predicted values from the three models that presented R2 ≥ 0.997 (Table 2). The moisture ratio (MR) values for the predicted drying time followed a trend in a straight line at 45°, which showed the correlation of the data fitting to the best models that could predict the drying kinetics of carrot strips in the indirect solar drying system assisted with U-pipe solar collectors and thermal energy storage in the form of sensible heat, with a maximum air velocity of 1 m/s through in the drying chamber.
As already mentioned, when comparing the values of the 15 empirical models presented in Table 2, those proposed by Page, Midilli–Kucuk and the Weibull distribution presented the highest values of determination coefficients (R2), 0.9971, 0.9989 and 0.9988, representing the first two, the category of so-called semi-theoretical models and, finally, empirical models [29]. However, once the other statistical parameters (SSE, RMSE and χ2) were analyzed, a good quality of fit was observed based on this evaluation since values of SSE = 1.6 × 10⁻⁴, RMSE = 0.01252 and χ2 = 1.7 × 10⁻⁴ were obtained through the Weibull distribution model closer to zero than the rest of the models according to a proposal by Erbay & Icier [29]. Therefore, the following Weibull Equation (17) distribution can be used to model the rate and drying time of carrot strips.
MR = (0.01812 + 0.95691 exp [−(−7.87 × 10⁻⁶ ∗ (t1.9768)])
Although this model can be used to predict changes in moisture content over time, it does not have the combined effect of the other drying parameters, such as airspeed and drying temperature, since the present study is limited only to air velocity of 1 m/s and variable drying temperatures, which did not exceed 56.1 °C.
The Midilli–Kucuk model presented the best fit in investigations of thin-layer drying of carrot slices using the infrared dryer [56], by electric resistance convective dryer [17] and with ultrasound pretreatment [57]. On the other hand, for drying carrots in cubes and/or slices [6,42] or carrot pomace [28] employing a convective dryer, the best fit model corresponded to Page’s model.

3.4. Chromatic Coordinates

The color of food represents a very important quality and acceptability parameter and is within the optical properties to be evaluated in dehydrated products [58]. In addition, it is a nutritional index valuation of carrots by significantly relating this attribute to the content of β-carotene determined [59]. Color affects consumers’ preferences when choosing food products. Due to this, it is suggested that it is interrelated with other properties of food and can represent them. Additionally, color is controlled by reactions that occur throughout the supply chain. For these reasons, food industries and many researchers use this attribute to measure product quality [40].
Table 3 shows the values of the chromatic coordinates L*, a* and b* of the carrot strips, before and after the drying process, indicating that there were statistically significant differences (p < 0.05) analyzed by Duncan’s multiple range test. The value of L* indicates that. once the drying process was completed, the carrot strips acquired a darker luminosity, with values that were 9.4% lower than the value of the state before drying. This condition can be attributed to a loss of brightness due to the effect of the measurement method since, as Nowacka & Wedzic [60] indicate, the instrumental concept is based on measuring the radiation reflected from the surface, and. in this case, the dry sample compared to the fresh sample has less water and stops reflecting the light that falls on the sample. This result can be compared with those obtained by Huang et al. [61] and Kowalski et al. [62], who observed a slight decrease in this chromatic coordinate when dehydrating carrots.
The results for the a* values showed a decrease in this chromatic coordinate at the end of the drying process, which indicated a red color change of 14.4%. This could be explained due to the degradation of the carotenoids in carrot tissue, which affects the color of the product [63]. A more pronounced decrease showed the b* values, which indicated that the fresh sample is 27.6% more yellow than the dry one. This behavior agrees with the results obtained by Demiray & Tulek [64] when drying sliced carrots in a cabin dryer with hot air, who indicated that the decrease in the value of the chromatic coordinate b* can be referred to as the degradation of carotenoid pigments [3,65], non-enzymatic Maillard browning and brown pigment formation [59].
The color differences ∆E = 14.11 ± 0.14 shown in Table 3 represent a perceptible color change to human vision since ∆E ≥ 5.0. Obón et al. [66] report that a difference in color from 0.0 ≤ ΔE ≤ 1.5 can be considered small and almost identical for visual observation; in the range from 1.5 ≤ ΔE ≤ 5.0, the color difference can be distinguished, while the color difference is evident for ∆E > 5. On the other hand, Hong et al. [67] state that it is generally known that values of ΔE < 3.0 cannot be easily detected by the human eye. This color change can be attributed to the degradation of compounds, long drying times and/or exposure to high drying temperatures [68]; however, this value is considered to be expected when compared with the results obtained for hot air-drying carrot slices of ΔE = 14.43 reported by Kowalski et al. [62]. Similarly, Liu et al. [63] reported values of 12.5 ≤ ΔE ≤ 22.5 when dehydrating carrots by convective drying with oxygen levels of 20.9% in the circulating air of the drying chamber. The other color parameters given by h° and C suffered losses of 9.1% and 23.0%, respectively. When the values of dehydrated carrots were compared with the samples before the drying process, with the decrease in hue, the saturation also decreased. For its part, R, the redness/yellowness ratio (a*/b* value), which is an index of great applicability when studying possible incidences of browning in food products, increased its ratio [69], going from the initial mean values for the fresh sample from R = 0.75 ± 0.01 to the dry state of R = 0.89 ± 0.01.
Non-enzymatic browning is a quality criterion for dried foods. It is caused by reactions between sugars and proteins in the form of either free amino acids or amino groups of the lysine residues as a result of high-temperature drying. The browning occurrence can lead to dark pigments and decreased nutritive value of amino acids and proteins and other undesirable changes in dried product’s flavors and texture [70]. That is why non-enzymatic browning is another quality indicator in the drying of carrots. The extent of browning is mainly attributed to the color changes resulting in Maillard reactions in the carrot. The application of solar drying reduces the BI values and increases the WI values of the carrot strips at the end of the drying process, BI = 148.38 ± 0.26 and WI = 31.8 ± 0.17, compared to their initial values, BI = 209.82 ± 0.62 and WI = 24.5 ± 0.11, indicating that there was a degradation in compounds, such as sugars and organic acids. The reduction in BI values and increase in WI values samples show that the rate of brown pigment formation reduced with drying application [71]. Moreover, Wiktor & Witrowa-Rajchert [72] suggest that, in the case of carrots, nonenzymatic browning may occur in the drying process, for instance, due to the reactions between carbonylic molecules, which are the products of carotenoids oxidation, with other food constituents.

3.5. Estimation of the Effective Moisture Diffusivity (Deff)

Deff was calculated using the slope K from the representation of the natural logarithm of the moisture ratio concerning the time of drying process ((Figure 5), Equations (11) and (12)), where Deff is effective moisture diffusivity (m2/s) and L is the thickness dimension of the thin layer in which the carrot was placed in strips on the drying trays in (m).
The mean value of Deff obtained for the present indirect solar dryer with a photo-voltaic cell and thermal energy storage as a function of the dehydration of the carrot strips and an airspeed of 1 m/s was 1.82 × 10⁻⁸ m2/s. This value agrees with the general ranges indicated for thin-layer drying characteristics, where the Deff for carrots, using methods of drying by ultrasound and vacuum at 65 °C, reached values of Deff 5.44 × 10⁻⁸ and 2.85 × 10⁻⁸ m2/s, respectively [68].
This value of Deff = 1.82 × 10⁻⁸ m2/s was obtained for low temperatures of the drying chambers in the 26.6 h of the drying process and did not exceed 56.1 °C ± 0.4 as the maximum value of temperature reached by air in drying chamber 1, which agrees with Mahapatra & Tripathy [27], who studied the dried process of carrot slices of 0.03 m diameter and 0.005 m thickness in direct, indirect and mixed-mode type natural convection solar dryers without thermal energy storage and obtained results for Deff ranging from 2.59 × 10⁻⁸ to 6.36 × 10⁻⁸ m2/s, respectively, with the maximum values obtained for mixed-mode solar-dried samples followed by direct and indirect solar-dried samples. In other investigations, Doymaz [7] reported Deff values from 0.776 to 9.335 × 10⁻⁹ m2/s for temperatures from 50 to 70 °C of carrots cut into cubes of 1 cm × 1 cm × 1 cm and 2 cm × 2 cm × 2 cm. In general, the time required to reduce the moisture ratio to any given level was dependent on the drying condition, being the highest at 50 °C and lowest 70 °C. With the drying process, the time needed to reduce the moisture content of the carrot cubes (d = 2 cm) from the initial 87.5% to the final 6% was 21, 16, 14 and 11 hours at 50, 60, 65 and 70 °C, respectively. The drying times of the carrot cubes (d = 1 cm) at 50 and 60 °C were 13.5 and 9.5 h, respectively. On the other hand, Aghbashlo et al. [73] carried out the drying process in a semi-industrial continuous belt dryer for carrot slices with a thickness of 5 mm, using, for the drying experiments, three air temperatures, 50, 60 and 70 °C, three speeds of the air, 0.5, 1.0 and 1.5 m/s, and Deff varied from 3.21 × 10⁻⁷ to 8.98 × 10⁻⁷ m2/s. Through another type of dryer, Hu et al. [74] studied the dehydration kinetics of previously treated carrot slices to prevent color loss using microwave-assisted fluidized bed drying at drying air temperatures of 40, 50 and 60 °C and evaluated the microwave power density between 0.44 and 1.21 W/g, reaching Deff values in the range of 0.720 × 10⁻⁸ to 1.890 × 10⁻⁸ m2/s.

4. Conclusions

The results of the present study led to the conclusion that the dryer that was used, of an indirect type, with storage of thermal energy in the form of sensible heat and with partial recovery of the exhaust air, allowed a continuous drying process of the carrot strips, verifying good operation in the hours without incidence of solar radiation, ending the night period with a difference of 9.8 °C concerning the ambient temperature after 26.6 h of processing. This total process time is relatively shorter considering that, in other types of indirect convective solar dryers, without thermal energy storage, the times would be longer. Of the 15 thin-film drying models studied, only the Weibull distribution model had the best fit according to the established statistical parameters. Moreover, the Page and Midilli–Kucuk models cannot be discarded since they had high adjustments and can be considered satisfactory in the investigation. The dried carrot strips’ quality for this type of process was as expected, although they presented color differences concerning the fresh product, as well as different evaluated colorimetric parameters, such as tone angle, chroma, BI, WI and R. In the present investigation, the energy savings due to the non-use of fossil fuels in the drying installation were not quantified.

Supplementary Materials

The following supporting information can be downloaded at: https://www.mdpi.com/article/10.3390/su14042147/s1, Solar irradiance and thermal history of the drying vehicles, water and air in the solar installation [75,76]. Figure S1. Variation of solar irradiance and temperatures in the stages of the solar drying process; Table S1. Average values of temperature and solar irradiance determined in different parts of the solar drying installation.

Author Contributions

Conceptualization, P.C.-M.; Data curation, P.C.-M. and W.B.-M.; Formal analysis, W.B.-M.; Funding acquisition, P.C.-M.; Investigation, P.C.-M. and W.B.-M.; Methodology, P.C.-M. and W.B.-M.; Resources, P.C.-M.; Software, W.B.-M.; Supervision, P.C.-M.; Writing—original draft, P.C.-M. and W.B.-M.; Writing—review & editing, P.C.-M. All authors have read and agreed to the published version of the manuscript.

Funding

This research was funded by two projects with public funds: Competitive Regional Innovation Fund of Antofagasta—Chile, (Grant: FIC-R 4602) and by the University of Antofagasta through the Seedbed Project No. 4467 entitled: “Solar Energy Available to the New Technological Challenges in the Drying of Biological Products”.

Institutional Review Board Statement

Not applicable.

Informed Consent Statement

Not applicable.

Data Availability Statement

All research data are found in this manuscript.

Acknowledgments

The authors would like to gratefully acknowledge Antofagasta Energy Development Center (Spanish acronym CDEA), Faculty of Engineering, the University of Antofagasta for the support in the installation of the thermocouples and other measurement accessories, as well as in the software for the collection of data. Finally, we want to give special recognition to Carlos Dario Alfonso for his help in translation.

Conflicts of Interest

The authors declare no conflict of interest.

References

  1. Da Silva Dias, J.C. Nutritional and health benefits of carrots and their seed extracts. Food Nutr. Sci. 2014, 5, 2147–2156. [Google Scholar] [CrossRef] [Green Version]
  2. FAOSTAT. Comparison of World Crops Production Quantities 2017. Food and Agriculture Organization Corporate Statistical Database. 2017. Available online: http://www.fao.org/faostat (accessed on 15 September 2021).
  3. Hiranvarachat, B.; Devahastin, S.; Chiewchan, N. Effects of acid pretreatments on some physicochemical properties of carrot undergoing hot air drying. Food Bioprod. Process. 2011, 89, 116–127. [Google Scholar] [CrossRef]
  4. ODEPA. Oficina de Estudios y Políticas Agrarias. 2017. Available online: http://www.odepa.gob.cl/wp-content/files_mf/1501684642Antofagastajulio.pdf/ (accessed on 18 May 2020).
  5. Leja, M.; Kamińska, I.; Kramer, M.; Maksylewicz-Kaul, A.; Kammerer, D.; Carle, R.; Baranski, R. The content of phenolic compounds and radical scavenging activity varies with carrot origin and root color. Plant Food Hum. Nutr. 2013, 68, 163–170. [Google Scholar] [CrossRef] [PubMed] [Green Version]
  6. Doymaz, I. Convective air drying characteristics of thin layer carrots. J. Food Eng. 2004, 61, 359–364. [Google Scholar] [CrossRef]
  7. Anonymous. Estrategia Regional de Innovación de la Región de Antofagasta. 2017. Available online: https://www.opia.cl/static/website/601/articles-77269_archivo_03.pdf (accessed on 27 August 2019).
  8. Ferrada, P.; Araya, F.; Marzo, A.; Fuentealba, E. Performance analysis of photovoltaic systems of two different technologies in a coastal desert climate zone of Chile. Sol. Energy 2015, 114, 356–363. [Google Scholar] [CrossRef]
  9. Lee, G.H. A Study for the Use of Sol Energy for Agricultural Industry—Solar Drying System Using Evacuated Tubular Solar Collector and Auxiliary Heater. J. Biosyst. Eng. 2013, 38, 41–47. [Google Scholar] [CrossRef]
  10. Urbano, J.B.; González, F.H.T.; Perilla, P.E.V.; Contreras, J.U.C. Estudio para el uso de la tecnología solar fotovoltaica. Ing. Solidar. 2011, 6, 69–81. [Google Scholar]
  11. Ekechukwu, O.V.; Norton, B. Design and measured performance of a solar chimney for natural-circulation solar-energy dryers. Renew. Energ. 1997, 10, 81–90. [Google Scholar] [CrossRef]
  12. Oliveros, C.E.; Sanz, J.R.; Ramirez, C.A.; Peñuela, A.E. Aprovechamiento eficiente de la energía en el secado mecánico del café. Av. TéCnicos Cenicafé. 2009, 380, 1–8. [Google Scholar]
  13. Sharma, A.; Chen, C.R.; Lan, N.V. Solar-energy drying systems: A review. Renew. Sustain. Energy Rev. 2009, 13, 1185–1210. [Google Scholar] [CrossRef]
  14. Mezquita, P.C.; López, A.Á.; Muñoz, W.B. Effect of Drying on Lettuce leaves using Indirect Solar Dryer Assisted with Photovoltaic Cells and Thermal Energy Storage. Processes 2020, 8, 168. [Google Scholar] [CrossRef] [Green Version]
  15. Agyenim, F.; Hewitt, N.; Eames, P.; Smyth, M. A review of materials, heat transfer and phase change problem formulation for latent heat thermal energy storage systems (LHTESS). Renew. Sustain. Energy Rev. 2010, 14, 615–628. [Google Scholar] [CrossRef]
  16. Charvát, P.; Klimeš, L.; Ostrý, M. Numerical and experimental investigation of a PCM-based thermal storage unit for solar air systems. Energy Build. 2014, 68, 488–497. [Google Scholar] [CrossRef]
  17. Doymaz, İ. Drying kinetics, rehydration and colour characteristics of convective hot-air drying of carrot slices. Heat Mass Transf. 2017, 53, 25–35. [Google Scholar] [CrossRef]
  18. Vishwanathan, K.H.; Giwari, G.K.; Hebbar, H.U. Infrared assisted dry-blanching and hybrid drying of carrot. Food Bioprod. Process. 2013, 91, 89–94. [Google Scholar] [CrossRef]
  19. Lin, T.M.; Durance, T.D.; Scaman, C.H. Characterization of vacuum microwave, air and freeze dried carrot slices. Food Res. Int. 1998, 31, 111–117. [Google Scholar] [CrossRef]
  20. Prakash, S.; Jha, S.K.; Datta, N. Performance evaluation of dried blanched carrots by three different driers. J. Food Eng. 2004, 62, 305–313. [Google Scholar] [CrossRef]
  21. Béttega, R.; Rosa, J.G.; Corrêa, R.G.; Freire, J.T. Comparison of Carrot (Daucus carota) Drying in Microwave and in Vacuum Microwave. Braz. J. Chem. Eng. 2014, 31, 403–412. [Google Scholar] [CrossRef] [Green Version]
  22. Li, Z.; Raghavan, G.S.V.; Wang, N. Carrot volatiles monitoring and control in microwave drying. LWT—Food Sci. Technol. 2010, 43, 291–297. [Google Scholar] [CrossRef]
  23. Rawson, A.; Tiwari, B.K.; Tuohy, M.G.; O’Donnell, C.P.; Brunton, N. Effect of ultrasound and blanching pretreatments on polyacetylene and carotenoid content of hot air and freeze dried carrot discs. Ultrason. Sonochem. 2011, 18, 1172–1179. [Google Scholar] [CrossRef]
  24. Zielinska, M.; Markowski, M. Air drying characteristics and moisture diffusivity of carrots. Chem. Eng. Process. 2010, 49, 212–218. [Google Scholar] [CrossRef]
  25. Romano, G.; Kocsis, L.; Farkas, I. Analysis of Energy and Environmental Parameters during Solar Cabinet Drying of Apple and Carrot. Dry. Technol. 2009, 27, 574–579. [Google Scholar] [CrossRef]
  26. Seshachalam, K.; Thottipalayam, A.; Selvaraj, V. Drying of carrot slices in a triple pass solar dryer. Therm. Sci. 2017, 21, S389–S398. [Google Scholar] [CrossRef]
  27. Mahapatra, A.; Tripathy, P.P. Modeling and simulation of moisture transfer during solar drying of carrot slices. J. Food Process Eng. 2018, 41, 1–15. [Google Scholar] [CrossRef]
  28. Kumar, N.; Sarkar, B.C.; Sharma, H.K. Effect of air velocity on kinetics of thin layer carrot pomace drying. Food Sci. Technol. Int. 2011, 17, 459–469. [Google Scholar] [CrossRef]
  29. Erbay, Z.; Icier, F. A Review of thin layer drying of foods: Theory, modeling, and experimental results. Crit. Rev. Food Sci. Nutr. 2010, 50, 441–464. [Google Scholar] [CrossRef]
  30. Aghbashlo, M.; Kianmehr, M.H.; Khani, S.; Ghasemi, M. Mathematical modelling of thin-layer drying of carrot. Int. Agrophys. 2009, 23, 313–317. [Google Scholar]
  31. Page, G.E. Factors Influencing the Maximum Rates of Air Drying Shelled Corn in Thin Layers. Master’s Thesis, Department of Mechanical Engineering, Prude University, Prude, IN, USA, 1949. [Google Scholar]
  32. Henderson, S.M.; Pabis, S. Grain drying theory. IV. The effect of air flow rate on the drying index. J. Agric. Eng. Res. 1961, 7, 85–89. [Google Scholar]
  33. Yaldiz, O.; Ertekin, C.; Uzun, H.I. Mathematical modeling of thin layer solar drying of sultana grapes. Energy 2001, 26, 457–465. [Google Scholar] [CrossRef]
  34. Midilli, A.; Kucuk, H.; Yapar, Z. A new model for single-layer drying. Dry. Technol. 2002, 20, 1503–1513. [Google Scholar] [CrossRef]
  35. Henderson, S.M. Progress in developing the thin layer drying equation. Trans. ASAE 1974, 17, 1167–1172. [Google Scholar] [CrossRef]
  36. Thompson, T.L.; Peart, R.M.; Foster, G.H. Mathematical simulation of corn drying—A new model. Trans. ASAE 1968, 11, 582–586. [Google Scholar] [CrossRef]
  37. Hutchings, J.B. Food Color and Appearance; Aspen Publishers: Gaithersburg, MD, USA, 1999. [Google Scholar] [CrossRef]
  38. Chandran, J.; Nisha, P.; Singhal, R.S.; Pandit, A.B. Degradation of colour in beetroot (Beta vulgaris L.): A kinetics study. J. Food Sci. Technol. 2014, 51, 2678–2684. [Google Scholar] [CrossRef] [PubMed] [Green Version]
  39. Palou, E.; Lopez-Malo, A.; Barbosa-Canovas, G.V.; Welti-Chanes, J.; Swanson, B.G. Polyphenoloxidase activity and color of blanched and high hydrostatic pressure treated banana puree. J. Food Sci. 1999, 64, 42–45. [Google Scholar] [CrossRef]
  40. Pathare, P.B.; Opara, U.L.; Al-Said, F.A.J. Colour Measurement and Analysis in Fresh and Processed Foods: A Review. Food Bioprocess Technol. 2013, 6, 36–60. [Google Scholar] [CrossRef]
  41. Crank, J. The Mathematics of Diffusion, 2nd ed.; Clarendon Press: Oxford, UK, 1975; p. 414. ISBN 0-19-853411-6. [Google Scholar]
  42. Erenturk, S.; Erenturk, K. Comparison of genetic algorithm and neural network approaches for the drying process of carrot. J. Food Eng. 2007, 78, 905–912. [Google Scholar] [CrossRef]
  43. Ayensu, A. Dehydration of food crops using a solar dryer with convective heat flow. Sol. Energy 1997, 59, 121–126. [Google Scholar] [CrossRef]
  44. Urrea, D.; Eim, V.; Roselló, C. Modelos cinéticos de degradación de carotenoides, polifenoles y actividad antioxidante durante el secado convectivo de zanahoria (Daucus carota V. Nantesa). Aliment. Hoy 2012, 21, 68–101. [Google Scholar]
  45. Lawaetz, A.J.; Christensen, S.M.U.; Clausen, S.K.; Jørnsgaard, B.; Rasmussen, S.K.; Andersen, S.B.; Rinnan, Å. Fast, cross cultivar determination of total carotenoids in intact carrot tissue by Raman spectroscopy and Partial Least Squares calibration. Food Chem. 2016, 204, 7–13. [Google Scholar] [CrossRef]
  46. Cui, Z.-W.; Xu, S.-Y.; Sun, D.-W. Effect of microwave-vacuum drying on the carotenoids retention of carrot slices and chlorophyll retention of Chinese chive leaves. Dry. Technol. 2004, 22, 563–575. [Google Scholar] [CrossRef]
  47. Goula, A.M.; Adamopoulos, K.G. Kinetic models of β-carotene degradation during air drying of carrots. Dry. Technol. 2010, 28, 752–761. [Google Scholar] [CrossRef]
  48. Sun, X.F.; Zhu, W.X.; Li, X.L.; Fan, J.L. Effects of heat pump drying temperature and dietary fat on carrot β-carotene bioaccessibility. Int. J. Agric. Biol. Eng. 2017, 10, 234–242. [Google Scholar] [CrossRef]
  49. Zielinska, M.; Markowski, M. Color Characteristics of Carrots: Effect of Drying and Rehydration. Int. J. Food Prop. 2012, 15, 450–466. [Google Scholar] [CrossRef]
  50. Lam Ip, R.W.L.; Cheong, W.C.I. The New Use of Diffusion Theories for the design of heat setting process in fabric Drying. In Advances in Modeling of Fluid Dynamics; Liu, C., Ed.; Copyright InTech: Croatia, Brazil, 2012; Chapter 7; pp. 143–170. [Google Scholar] [CrossRef] [Green Version]
  51. Joardder, M.U.H.; Kumar, C.; Karim, M.A. Prediction of porosity of food materials during drying: Current challenges and directions. Crit. Rev. Food Sci. Nutr. 2018, 58, 2896–2907. [Google Scholar] [CrossRef] [PubMed] [Green Version]
  52. Gamboa-Santos, J.; Soria, A.C.; Fornari, T.; Villamiel, M.; Montilla, A. Optimisation of convective drying of carrots using selected processing and quality indicators. Int. J. Food Sci. Technol. 2013, 48, 1998–2006. [Google Scholar] [CrossRef] [Green Version]
  53. Darvishi, H.; Banakar, A.; Zarein, M. Mathematical Modeling and Thin Layer Drying Kinetics of Carrot Slices. Glob. J. Sci. Front. Res. Math. Decis. Sci. 2012, 12, 57–64. [Google Scholar]
  54. Raut, S.; Md Saleh, R.; Kirchhofer, P.; Kulig, B.; Hensel, O.; Sturm, B. Investigating the Effect of Different Drying Strategies on the Quality Parameters of Daucus carota L. Using Dynamic Process Control and Measurement Techniques. Food Bioprocess Technol. 2021, 14, 1067–1088. [Google Scholar] [CrossRef]
  55. Akpinar, E.K. Determination of suitable thin layer drying curve model for some vegetables and fruits. J. Food Eng. 2006, 73, 75–84. [Google Scholar] [CrossRef]
  56. Doymaz, İ. Infrared Drying Kinetics and Quality Characteristics of Carrot Slices. J. Food Process. Pres. 2015, 39, 2738–2745. [Google Scholar] [CrossRef]
  57. Yilmaz, B.; Cakmak, H.; Tavman, S. Ultrasonic pretreatment of carrot slices: Effects of sonication source on drying kinetics and product quality. An. Da Acad. Bras. De CiÊNcias 2019, 91, e20180447. [Google Scholar] [CrossRef]
  58. Markowski, M.; Stankiewicz, I.; Zapotoczny, P.; Borowska, J. Effect of Variety on Drying Characteristics and Selected Quality Attributes of Dried Carrots. Dry. Technol. 2006, 24, 1011–1018. [Google Scholar] [CrossRef]
  59. Koca, N.; Burdurlu, H.S.; Karadeniz, F. Kinetics of colour changes in dehydrated carrots. J. Food Eng. 2007, 78, 449–455. [Google Scholar] [CrossRef]
  60. Nowacka, M.; Wedzik, M. Effect of ultrasound treatment on microstructure, colour and carotenoid content in fresh and dried carrot tissue. Appl. Acoust. 2016, 103, 163–171. [Google Scholar] [CrossRef]
  61. Huang, J.; Zhang, M.; Adhikari, B.; Yang, Z. Effect of microwave air spouted drying arranged in two and three-stages on the drying uniformity and quality of dehydrated carrot cubes. J. Food Eng. 2016, 177, 80–89. [Google Scholar] [CrossRef]
  62. Kowalski, S.J.; Szadzińska, J.; Pawłowski, A. Ultrasonic-assisted osmotic dehydration of carrot followed by convective drying with continuous and intermittent heating. Dry. Technol. 2015, 33, 1570–1580. [Google Scholar] [CrossRef]
  63. Liu, Y.; Wu, J.; Miao, S.; Chong, C.; Sun, Y. Effect of a modified atmosphere on drying and quality characteristics of carrots. Food Bioprocess. Technol. 2014, 7, 2549–2559. [Google Scholar] [CrossRef]
  64. Demiray, E.; Tulek, Y. Color degradation kinetics of carrot (Daucus carota L.) slices during hot air drying. J. Food Process. Preserv. 2015, 39, 800–805. [Google Scholar] [CrossRef]
  65. Lavelli, V.; Zanoni, B.; Zaniboni, A. Effect of water activity on carotenoid degradation in dehydrated carrots. Food Chem. 2007, 104, 1705–1711. [Google Scholar] [CrossRef]
  66. Obón, J.M.; Castellar, M.R.; Alacid, M.; Fernández-López, J.A. Production of a red–purple food colorant from Opuntia stricta fruits by spray drying and its application in food model systems. J. Food Eng. 2009, 90, 471–479. [Google Scholar] [CrossRef]
  67. Hong, S.; Han, J.; Krochta, J. Optical and surface properties of whey protein isolate coatings on plastic films as influenced by substrate, protein concentration, and plasticizer type. J. Appl. Polym. Sci. 2004, 92, 335–343. [Google Scholar] [CrossRef]
  68. Chen, Z.G.; Guo, X.Y.; Wu, T. A novel dehydration technique for carrot slices implementing ultrasound and vacuum drying methods. Ultrason. Sonochem. 2016, 30, 28–34. [Google Scholar] [CrossRef] [PubMed]
  69. Batu, A. Determination of acceptable firmness and colour values of tomatoes. J. Food Eng. 2004, 61, 471–475. [Google Scholar] [CrossRef]
  70. Abano, E.E.; Amoah, R.S.; Opoku, E.K. Temperature, microwave power and pomace thickness impact on the drying kinetics and quality of carrot pomace. J. Agric. Eng. 2019, 50, 28–37. [Google Scholar] [CrossRef]
  71. Abano, E.E.; Sam-Amoah, L.K.; Bart-Plange, A. Variation in ultrasonic frequency and time as pre-treatments to air-drying of carrot. J. Agric. Eng. 2013, 43, 149–158. [Google Scholar] [CrossRef]
  72. Wiktor, A.; Witrowa-Rajchert, D. Drying kinetics and quality of carrots subjected to microwave-assisted drying preceded by combined pulsed electric field and ultrasound treatment. Dry. Technol. 2019, 38, 176–188. [Google Scholar] [CrossRef]
  73. Aghbashlo, M.; Hossien, M.; Arabhosseini, A.; Nazghelichi, T. Modelling the Carrot Thin-Layer Drying in a Semi-Industrial Continuous Band Dryer. Czech. J. Food Sci. 2011, 29, 528–538. [Google Scholar] [CrossRef] [Green Version]
  74. Hu, X.; Kurian, J.; Gariepy, Y.; Raghavan, V. Optimization of microwave-assisted fluidized-bed drying of carrot slices. Dry. Technol. 2017, 35, 1234–1248. [Google Scholar] [CrossRef]
  75. Mekhilef, S.; Saidur, R.; Safari, A. A review on solar energy use in industries. Renew. Sustain. Energy Rev. 2011, 15, 1777–1790. [Google Scholar] [CrossRef]
  76. Parrado, C.; Girard, A.; Simon, F.; Fuentealba, E. 2050 LCOE (Levelized Cost of Energy) projection for a hybrid PV (photovoltaic)-CSP (concentrated solar power) plant in the Atacama Desert, Chile. Energy 2016, 94, 422–430. [Google Scholar] [CrossRef]
Figure 1. Schematic of the indirect solar dryer assisted with photovoltaic cells and with thermal energy storage unit. (1) Three photovoltaic cells, (2) voltage controller, (3) electrical switches board, (4) battery, (5) heat exchanger air–water, (6) digital balance # 2, (7) drying chamber # 2, (8) window for entry and exit of air dryer, (9) drying chamber # 1; (10) digital balance # 1, (11), (12) solar collectors for water (U-pipe), (13) hydro-pneumatic tank water with inner membrane for thermal energy storage (with external insulation), (14) water pump, (15) variable speed drive for airflow, (16) water pump, (17) variable speed fan.
Sustainability 14 02147 g001
Figure 2. Drying curve with air velocity of 1 m/s and mean values of the three runs performed. (A) induction period, (B) constant drying rate period and (C) falling drying rate period.
Sustainability 14 02147 g002
Figure 3. Drying rate vs. moisture content from mean values of the two drying chambers (n = 3). (A) induction period, (B) constant drying rate period and (C) falling drying rate period.
Sustainability 14 02147 g003
Figure 4. Validation of experimental and predicted moisture ratio values from (A) Page; (B) Midilli and Kucuk and (C) Weibull distribution model.
Sustainability 14 02147 g004
Figure 5. Linear relationship between ln (MR) and drying time (t) for temperature value < 57 °C.
Sustainability 14 02147 g005
Table 1. Mathematical models applied to the drying curves.
NModel NameModel EquationRef.
Models derived from Newton’s law of cooling
1NewtonMR = exp (−kt)[30]
2PageMR = exp (−ktn)[31]
3Modified PageMR = exp – (kt)n[30]
Models derived from Fick’s second law of diffusion
4Henderson and PabisMR = a exp (−kt)[32]
5Modified Henderson and PabisMR = a exp (−kt) + b exp (−gt )+ c exp (−ht)[30]
6LogarithmicMR = a exp (−kt) + c[30]
7Approximation of diffusionMR = a exp (−kt) + (1−a) exp (−kbt)[33]
8Midilli and KucukMR = a exp – (–ktn) + bt[34]
9Two TermMR = a exp (−k0 t)+ b exp (−k1 t)[35]
10Two Term exponentialMR = a exp (−kt) + (1−a) exp (−k a t)[30]
11AghbashloMR = exp[−((k1 t)/(1 + k2 t))][30]
12VermaMR = a exp (−k t) + (1−a) exp (−g t)[30]
Empirical models
13Wang and SingMR = 1 + at + bt2[30]
14ThompsonMR = exp ((−a –(a2 + 4 ⋅ bt)0.5)/2b[36]
15Weibull distributionMR = a−b exp [−(ktn)][30]
MR: moisture ratio; k: kinetical parameter (min−1); n and a: empirical parameters (dimensionless); t: drying time (min); b, c, g, h, ko and k1: empirical constants in the drying models [27].
Table 2. Statistical results of mathematical drying models for carrot strips dried in the indirect solar dryer.
NModelCoefficients and ConstantsR2χ2SSERMSE
1Newtonk = 0.00222 0.96320.004930.004800.06930
2Pagek = 1.836 × 10⁵n = 1.83288 0.99710.000400.000370.01936
3Modified Pagek = 0.033307n = 0.066613 0.96320.005060.004800.06930
4Henderson and Pabisa = 1.11853k = 0.00260 0.97610.003280.003120.05582
5Modified Henderson and Pabisa = 7.30508b = 0.00051c = −6.34683k = 0.00548g = −0.00232h = 0.006540.99530.000720.000610.02474
6Logarithmica = 1.13061c = −0.01778k = 0.00251 0.97670.003300.003040.05515
7Approximation of diffusiona = 10.67910b = 1.11492k = 0.00546 0.99410.000840.000780.02787
8Midilli and Kucuka = 0.967416b = 0.000013n = 2.047330k = 0.000005 0.99890.000210.000190.01376
9Two Terma = 0.93984b = 0.17859k = 0.00260k1 = 0.00260 0.97610.003470.003120.05582
10Two Term exponentiala = 2.08704k = 0.00418 0.99330.000920.000880.02962
11Aghbashlok1 = 0.00175k2 = −0.00059 0.97910.002870.002730.05222
12Vermaa = 23.18260k = 0.00562g = 0.00590 0.99410.000840.000780.02784
13Wang and Singa = −0.00181b = 7.733 × 10⁷ 0.97440.003520.003340.05780
14Thompsona = −342.165b = 0.44676 0.97600.010320.009790.09896
15Weibull distributiona = 0.01812b = −0.95691k = 7.87 × 10⁶n = 1.9768 0.99880.000170.000160.01252
Table 3. Chromatic coordinates of the carrot strips in their fresh state (before drying) (n = 10) and after the drying process (n = 10). Color difference (ΔE), ratio of redness over yellowness (R), browning index (BI) and whiteness index (WI) (n = 3).
Chromatic Coordinates and Other
Parameters
Carrot Strips
Before DryingDried
L*51.71 ± 0.04 a48.71 ± 0.05 b
a*34.76 ± 0.07 a29.76 ± 0.07 b
b*46.47 ± 0.14 a33.62 ± 0.09 b
ΔE-14.11 ± 0.14
ho53.20 ± 0.14 a48.48 ± 0.14 b
C58.03 ± 0.07 a44.90 ± 0.04 b
R = a * b * 0.75 ± 0.01 a0.89 ± 0.01 b
BI209.82 ± 0.62 a148.38 ± 0.26 b
WI24.5 ± 0.11 a31.8 ± 0.17 b
Different letters in the same row indicate a significant difference (p < 0.05) analyzed by Duncan’s multiple range tests.
Publisher’s Note: MDPI stays neutral with regard to jurisdictional claims in published maps and institutional affiliations.

