Abstract
This paper contributes to the tourism–growth literature by applying the new vector autoregressive-based Granger causality test in the presence of instability to reassess the Granger causality between Hong Kong’s tourism and economic growth. The results of the traditional and recursive Granger causality test under the VAR framework show that the tourism-led economic growth hypothesis (TLEGH) and the economy-driven tourism growth hypothesis (EDTGH) are both unstable in Hong Kong. The results of the vector autoregressive-based Granger causality test in the presence of instability generally support bidirectional causality between tourism and economic growth. However, the relationship between tourism and economic growth is vulnerable to sudden major political incidents, public health incidents, and financial crises. Among these incidents and crises, political events have long-term effects on the relationship between Hong Kong’s tourism and economic growth. In contrast, economic policies, financial crises, and public health emergencies have short-term impacts on the relationship.
1. Introduction
Tourism creates new employment opportunities, increases infrastructure investment, increases foreign exchange income, provides significant tax benefits, and reduces poverty for a country or region [1,2]. In addition, tourism contributes to generating investment flows and financial resources for local and central public administrations; thus, it contributes to solving social issues by improving employment opportunities and the standard of living, as well as harmonizing the rate of local and regional growth [2,3]. The various sectors in an economy are usually interrelated [4]. For example, changes in tourism revenue and expenditure will have a certain impact on economic growth depending on the links between tourism and the economy [5]. Hence, there has been a proliferation of empirical studies testing the relationship between tourism and economic growth [6,7]. It is crucial therefore, to investigate the unstable causal relationship between tourism and economic development.
COVID-19 has caused adverse shocks that have significantly limited the possibility of economically efficient long-term resource deployment, and it has become a priority in many health systems in developing nations [8,9]. Therefore, it is of the utmost importance for policymakers to formulate tourism and growth policies by verifying the validity of the tourism-led economic growth hypothesis (TLEGH) and the economy-driven tourism growth hypothesis (EDTGH) since the causal relationship between them has also been influenced by shocks. As a result of COVID-19, Hong Kong’s real GDP in the first quarter of 2020 slipped by 8.9% compared to the same period in the previous year. The number of tourists declined by 81% from the previous year [10]. It can be seen that emergencies significantly impact tourism and economic growth. Thus, do emergencies affect the relationship between tourism and economic growth? This study reassesses the temporal Granger causality between tourism and economic growth in Hong Kong using quarterly tourism arrival data and quarterly GDP data from 1973:Q1 to 2021:Q1. The purpose of the study is to detect whether an emergency impacts the relationship between tourism and economic growth in Hong Kong by adopting the new robust Granger causality test in the presence of instability [11]. In summary, this study contributes to the existing literature in its discussion of the two typical hypotheses of tourism and economic growth: TLEGH and EDTGH. First, it is important to discuss how the results of the two hypotheses change over time in economic and social development. Second, it is crucial to investigate how major events affect the sustainability of the two hypotheses. Our paper provides strong evidence of the time-varying causality between tourism and economic growth, and significantly contributes to the existing literature by clarifying the impact of sudden major events on the relationship between tourism and the economy. The methods used consider the impact of emergencies and uncertain events on the relationship between tourism and economic growth, and the robust and reliable results could help the development of appropriate policies and the promotion of the harmonious development of tourism and the economy.
The rest of the article is organized as follows. The second section covers the literature review and the third part describes empirical methods and data. We then analyze and discuss the empirical results, finishing with the study’s conclusion.
2. Literature Review
Sustainability has moved from the fringe to the center [12]. Clarifying the relationship between tourism and economic growth can aid the sustainability of both sectors. Following Ghali [13] research on the connection between tourism and economic growth, there has been further literature on this relationship, and it continues to generate significant interest [14]. There are four hypotheses on the relationship between tourism and economic growth [15].
The first hypothesis is TLEGH, advocating that tourism actively promotes economic growth. Empirical studies have supported the validity of TLEGH in Laos [15], Greece [16,17], and other Mediterranean countries [18]. The second hypothesis is EDTGH, arguing that economic growth promotes tourism growth, and evidence supporting this hypothesis has been found in various countries and regions [19,20]. The third hypothesis is grounded on a series of studies highlighting the bidirectional influence of tourism and economic growth in a certain number of countries and time frames [21,22]. Evidence shows that the bidirectional relationship between tourism and economic growth has commonly been confirmed using the Granger causality test or its extension [21,23]. Fourth is the neutrality hypothesis, claiming the non-existence of causality between tourism and growth. This has been described in the work of Ozturk and Acaravci [24] on Turkey, and of Tang and Jang [25] on the US. Overall, we found that most studies support TLEGH, despite mixed evidence in the existing literature. Lean and Tang [26] argued that the causal relationship between tourism and economic growth might not be stable due to frequent global environmental changes. Tang and Tan [27] assessed the stability of TLEGH in the case of Malaysia in 12 different source markets by applying the recursive Granger causality test. Liu and Song [5] verified the strength of TLEGH in Hong Kong by applying the rolling Granger causality test and the mixed frequency Granger causality test. Another issue is that parameter estimation is unstable due to varying macroeconomic time series data [28,29].
In recent decades, most international organizations have agreed that tourism can be seen as a tool for economic development in many parts of the world [30]. However, the tourism industry is vulnerable to social unrest. For example, Saha and Yap [31] found that some countries experiencing high levels of political risk witness a significant reduction in their tourism businesses. Political volatility and terrorism can also cause severe damage to the tourism industry. Elshaer and Saad [32] found that political unrest in Egypt, framed by a series of terrorist attacks and mass demonstrations, has been a significant factor in the collapse of Egypt’s tourism industry since 2011. Political instability associated with violence can negatively impact tourists’ risk perceptions, thereby inhibiting the inflow of potential tourists [33]. However, Dibeh et al. [34] found the tourism sector in Lebanon to be robust to the political instability engendered by the Syrian crisis, and supported both TLEGH and EDTGH. Due to the occurrence of recent major events, such as COVID-19, it is essential to study the impact of major events on the relationship between tourism and economic growth. Thus, we aimed to use the method invented by Rossi and Wang [11] to re-examine the time-varying causal relationship between tourism and economic growth from the perspective of major events.
3. Materials and Methods
3.1. Methodology
The traditional Granger causality test under the VAR framework assumes that the result is stable, meaning that the coefficient matrix of the test model equation is constant. However, there is evidence that the size and sign of the VAR model’s variable coefficients vary over time: that is, the parameters are unstable. Hence, it is not reliable in the presence of instability and may lead to incorrect inference [35]. This article uses a robust method to test Granger causality in response to instability, namely, the robust Granger causality test [11].
The study adopts the model to examine the relationship between quarterly visitor arrivals (VA) and quarterly GDP. The model is a direct multistep forecasting model. We begin our empirical framework by specifying the following model with time-varying parameters
where are 2 × 2 time-varying coefficient matrices, is the vector of the error terms, and is a special case, which is the reduced-form with time-varying parameters. The form of is as follows
The model can then be written as
Let be a subset of vector ; the null hypothesis of the robust Granger causality test is
For example, economic growth does not Granger-cause tourism if . The robust Granger causality test statistics are ExpW* (the exponential Wald test), (the mean Wald test), (the Nyblom test), and (the Quandt likelihood ratio (QLR) test). The optimal ExpW* and the optimal MeanW* tests are based on the exponential test statistics proposed in Andrews and Ploberger [36]. The optimal is based on the Nyblom test [37]. The optimal is based on the QLR test [38]. Hence, in the presence of instability, the robust Granger causality tests are more powerful than the traditional Granger causality tests. As is standard in the structural break literature, the possible break dates are usually trimmed to exclude the beginning and end of the sample period [11]. Therefore, the time series graph of the Wald statistics is a line chart after the initial observations of the sample are trimmed.
3.2. Data
We used 100× annual log differences of Hong Kong VA and real GDP quarterly from 1973:Q1 to 2021:Q1 for the modeling. The real output value was derived from quarterly real GDP data deflated by the price level in 2010 and downloaded from the Hong Kong SAR Government’s Census and Statistics Department website. VA in Hong Kong is used as a proxy for inbound tourism and is taken from the Hong Kong Tourism Board’s annual statistical reviews.
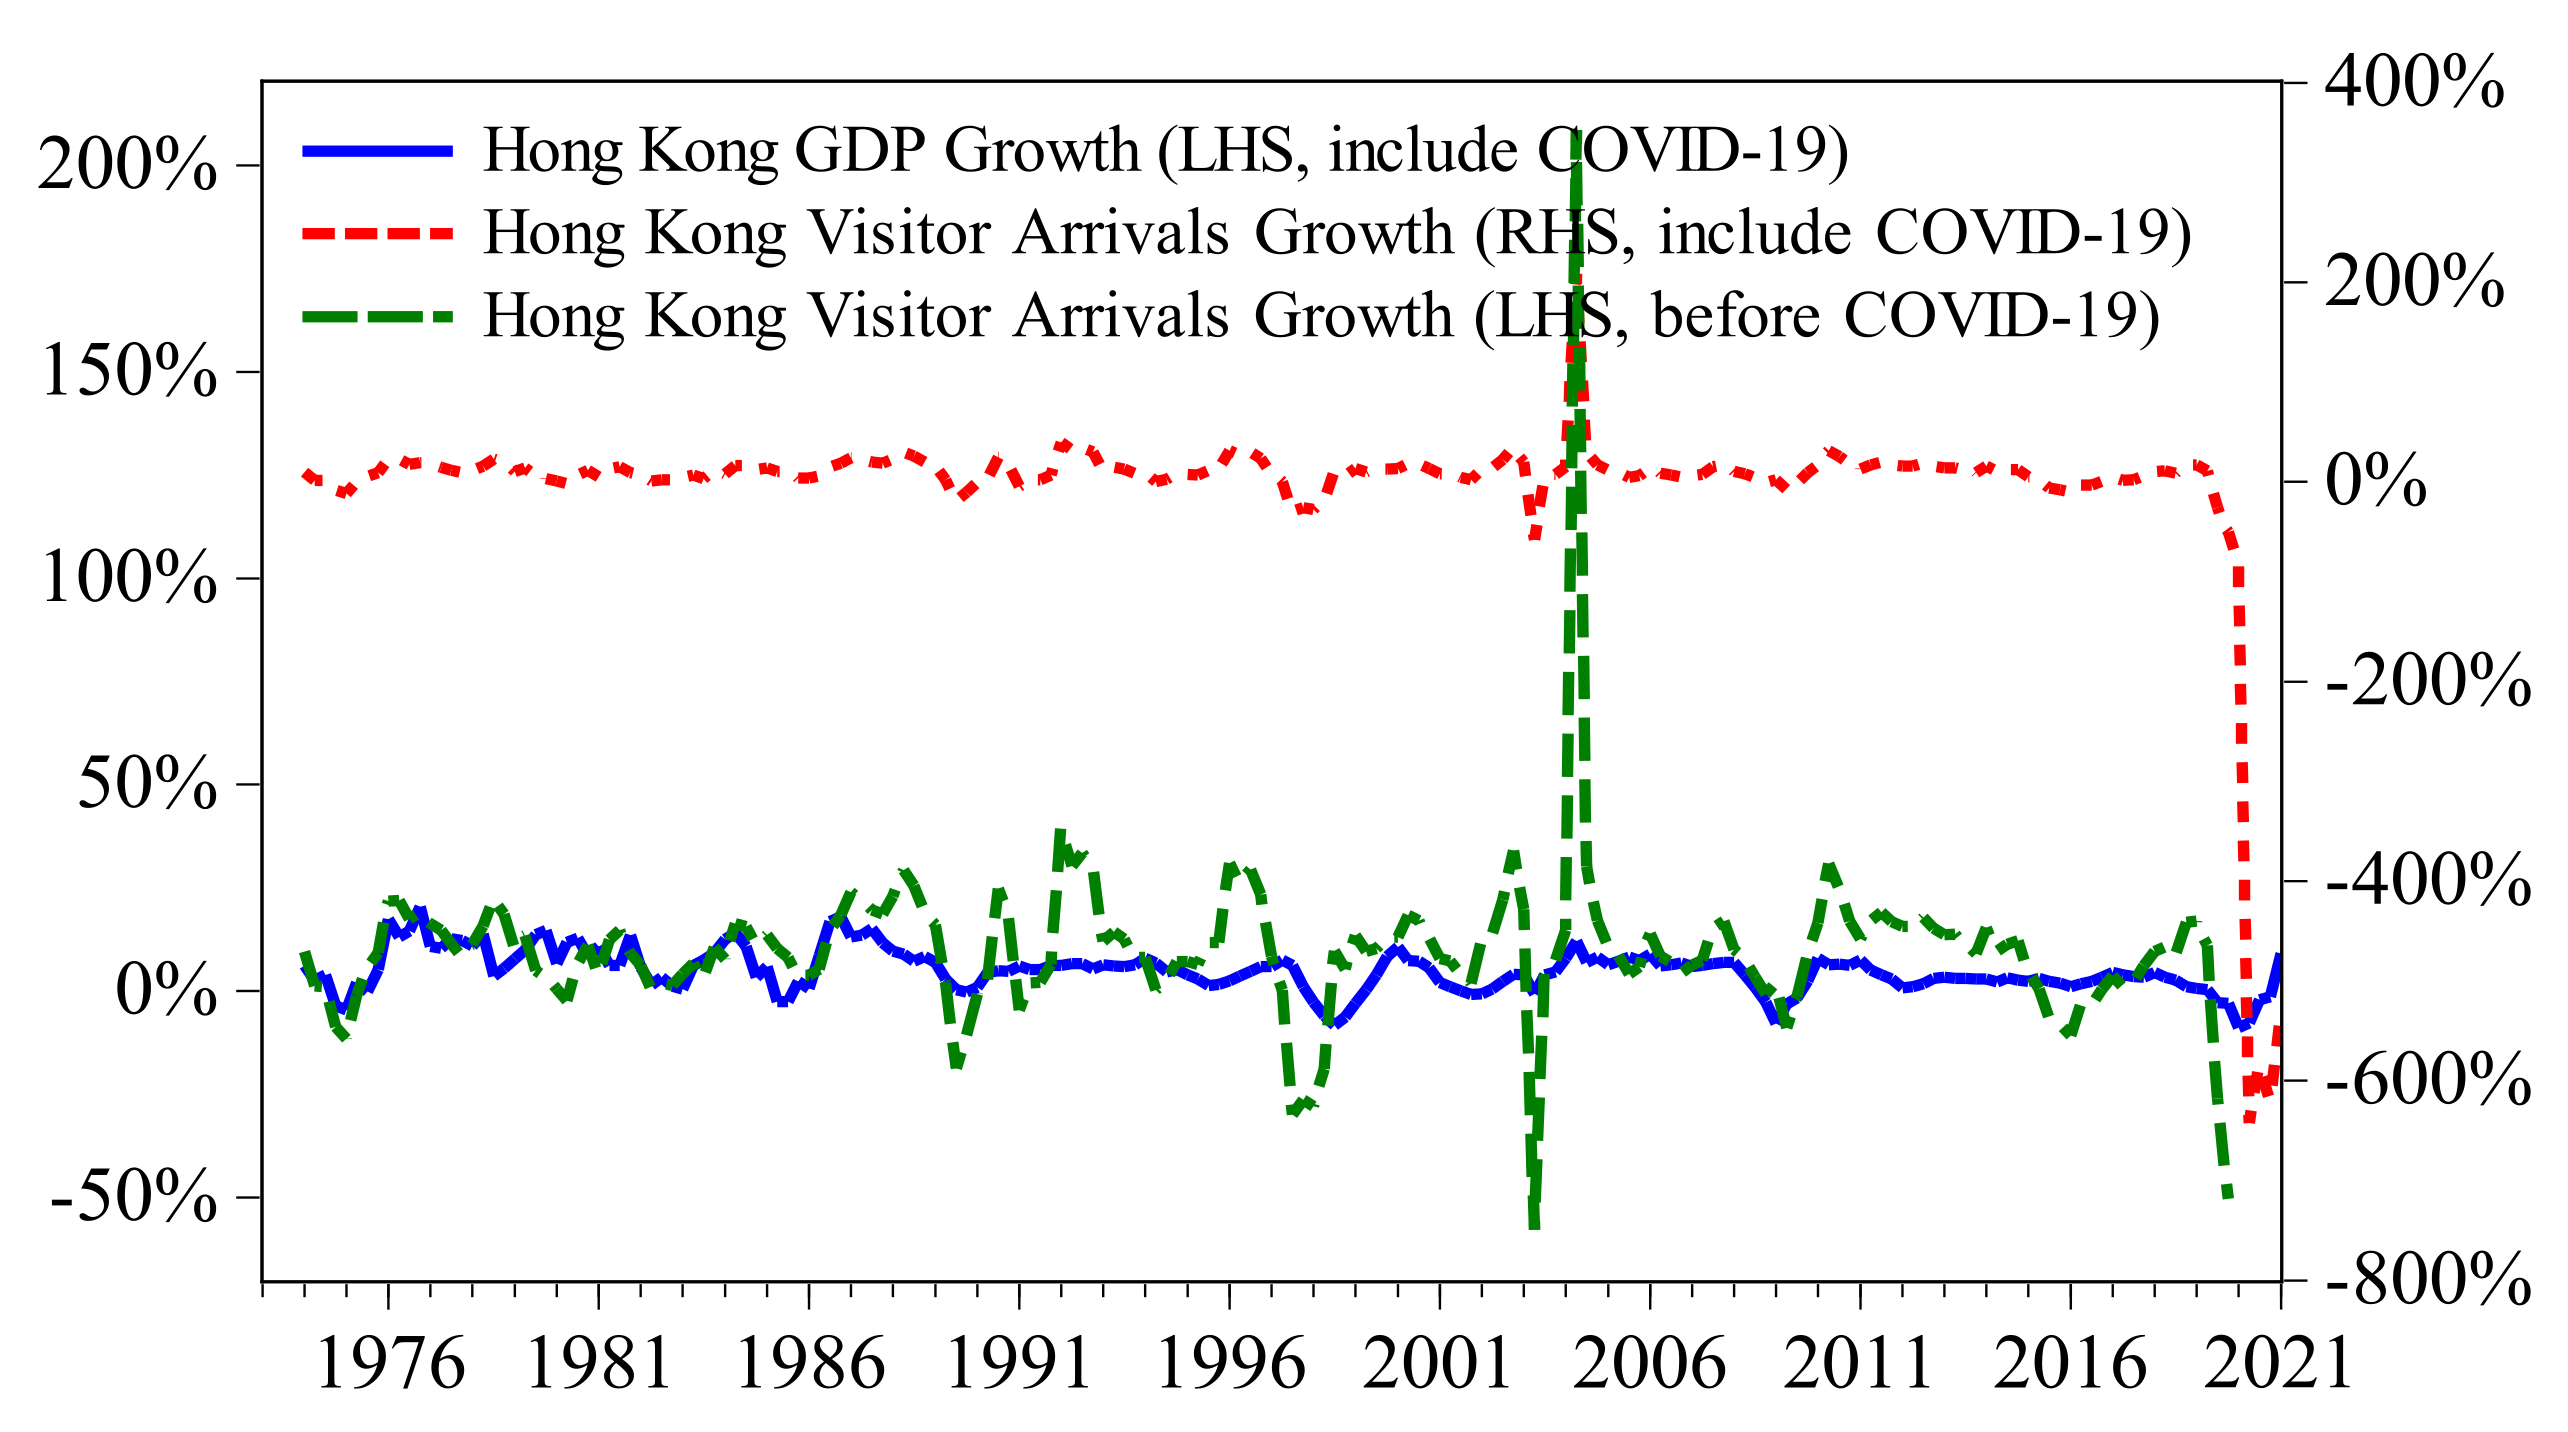
Figure 1 shows that tourist arrivals and real GDP in Hong Kong are sensitive to political and economic shocks and one-off events. For example, after the Sino-British Joint Declaration was issued in 1984, Hong Kong’s economy suffered a severe decline. The number of tourist arrivals and real GDP in Hong Kong decreased noticeably after the domestic political turmoil in 1989. A more severe drop was seen after the handover of sovereignty from the United Kingdom to China in 1997, and that drop was further magnified by the Asian financial crisis of 1997–1998. There was also a severe drop in the number of tourist arrivals during the SARS epidemic (2003). However, the decline in the real GDP growth rate was not as deep as that in the tourism growth rate. The real GDP growth rate suffered a severe decline as a result of the global economic crisis (2008). The tourism and real GDP growth rates, which are extremely sensitive to one-off public health events, also suffered a severe decline due to the COVID-19 pandemic in 2020. Compared to the period of SARS, the COVID-19 pandemic period produced a more severe “cliff-like” decline in the number of tourist arrivals.

Figure 1.
Time series of visitor arrivals and real GDP in Hong Kong.
The growth rates in Figure 1 indicate that tourism and the economy before COVID-19 (2020) were highly correlated. However, due to the impact of COVID-19, the fluctuation characteristics of VAg are severely masked, and, thus, the relationship between VAg and GDPg is foggy. Therefore, investigating the influence of uncertain events on the relationship between tourism and economic growth is important and necessary.
Table 1 presents the sample statistics, including the sample standard deviations of 89.86% for VAg and 5.07% for GDPg. As VAg and GDPg have positive sample means of −3.43% and 4.89%, respectively, we demean each series and fit the VAR model without a constant term. The sample skewness coefficient of VAg is −6.11 with the left-skewed distribution, whereas GDPg is the right-skewed distribution. The sample kurtosis coefficients of VAg and GDPg are both greater than three with a spike distribution. The J–B statistic identifies that VAg follows a normal distribution, whereas GDPg does not.

Table 1.
Descriptive statistics.
4. Results and Discussion
The first task when modeling is to choose a suitable lag order. A reasonable lag order of the VAR model is essential to reflect the relationship between variables. Ghysels, E. et al. [39] argue that including redundant lags would have a large adverse effect on power (particularly for a longer prediction horizon, h). We used five information criteria to select the optimal lag order. The results in Table 2 show that the optimal lag order varies with differing maximum lag orders, except that the Schwarz information criterion (SIC) always chooses lag 1 and the five information criteria all choose lag 1 when the maximum lags are under four. Hence, we finally selected lag 1.
Table 2.
The optimal VAR lag order selected by different conditions.
4.1. Traditional and Recursive Granger Causality Test
Before using the robust Granger causality test method to investigate the unstable relationship between tourism and Hong Kong’s economic growth, we tested TLEGH and EDTGH by applying traditional and recursive Granger causality. We first used the traditional Granger causality test method under the VAR framework to investigate the Granger causality between VAg and GDPg (Table 3). The results show that TLEGH is not supported, whereas EDTGH is supported.
Table 3.
Traditional Granger causality test.
The traditional Granger causality test is based on the full sample, and it assumes that Granger causality is stable. However, some scholars later studied the stability of the causal relationship between tourism demand and economic growth and found that this causal relationship is easily changed by external shocks [27,40]. Therefore, we used the recursive Granger causality test to explore the stability of the relationship between tourism (VAg) and economic growth (GDPg) in Hong Kong.
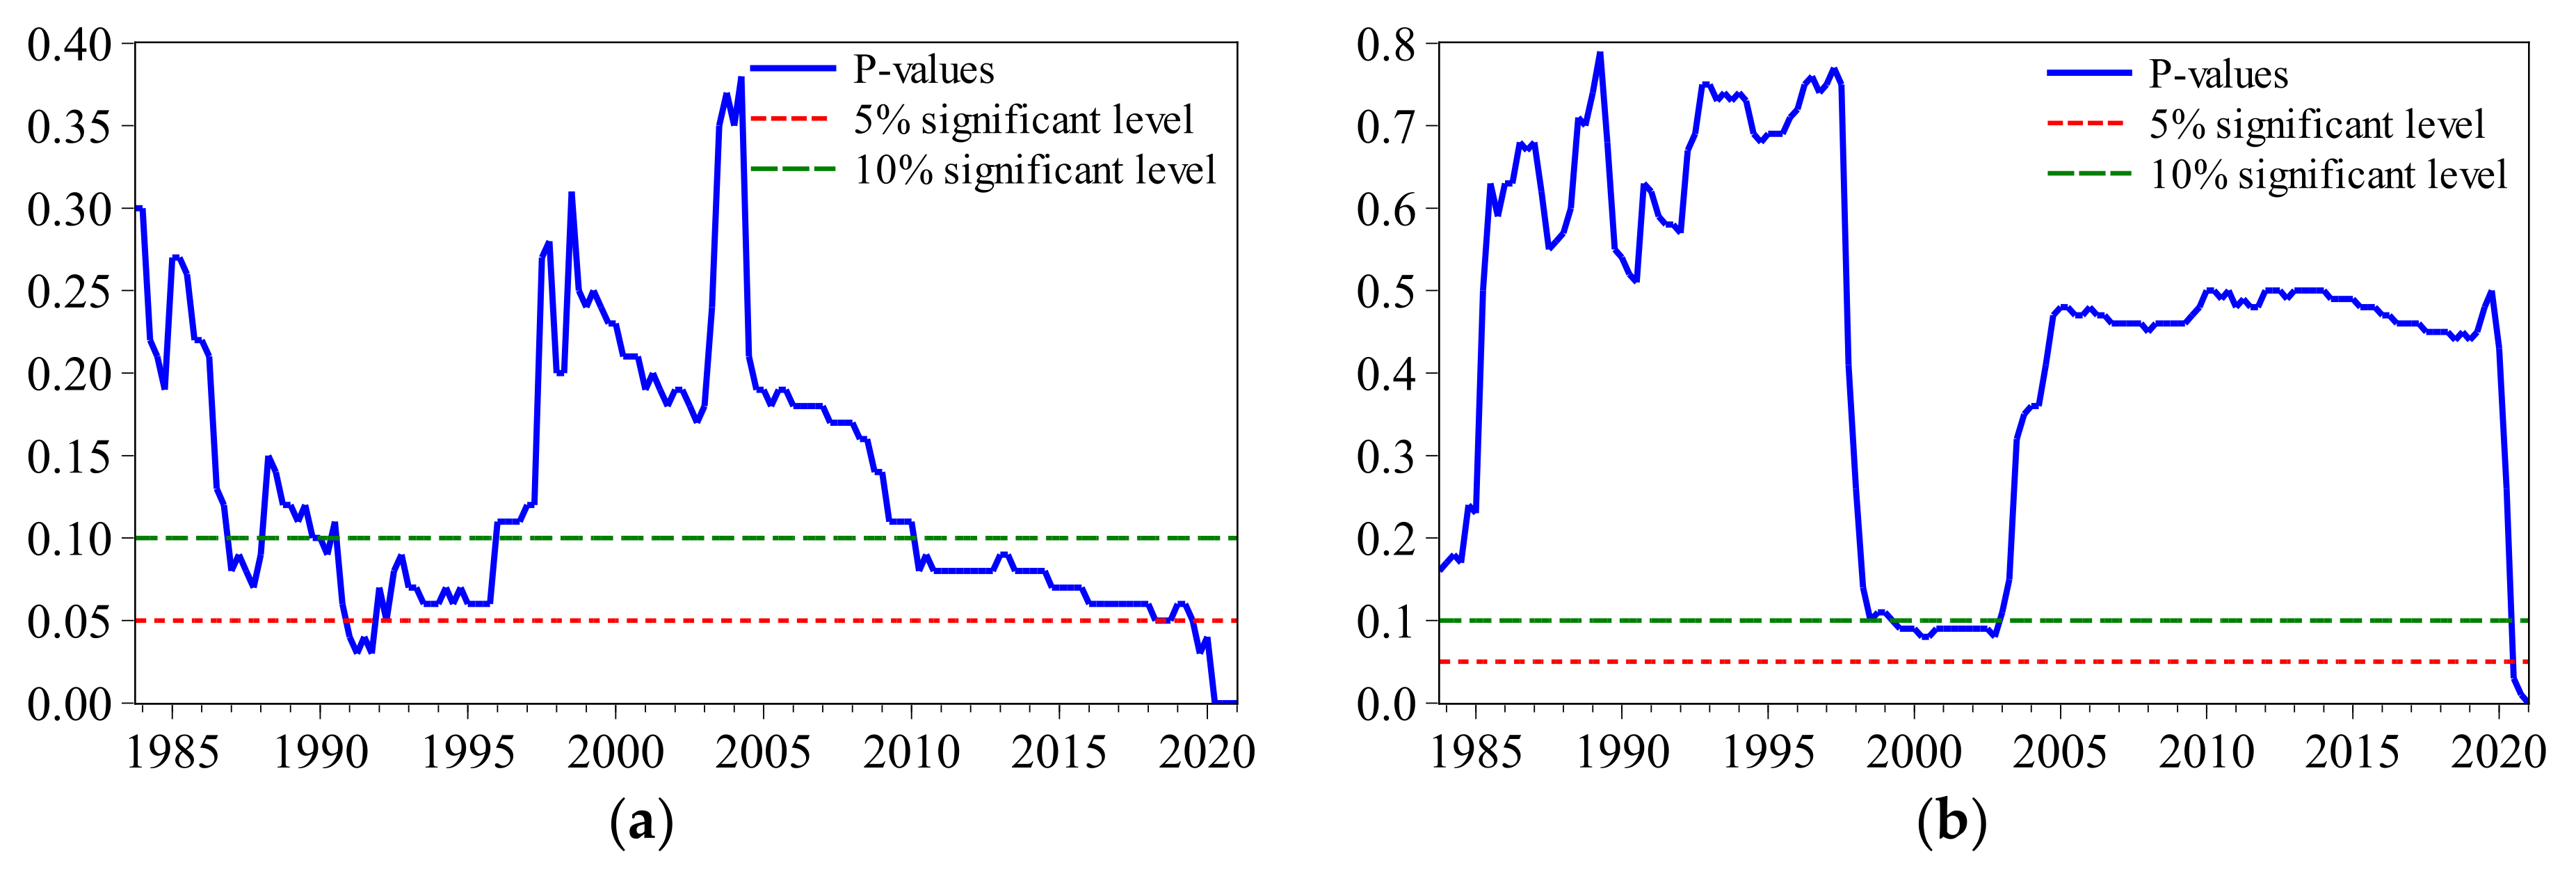
The recursive Granger causality tests are conducted by setting the initial sample size T, and a new observation is added to the end of the sample (i.e., N + 1). For example, if we begin with ten years (i.e., N = 40 observations), the first Granger causality test statistic is obtained by using the subsample period from 1974:Q1 to 1983:Q4 (i.e., N = 40 observations). The second test statistic is then obtained by using data from 1974:Q1 to 1984:Q1. This process continues until the last observation is included. The hypothesis that VAg does not Granger-cause GDPg is rejected if the p value is lower than the 10% and 5% significance levels. Hence, we should be observing a large number of p values fluctuating below the cut-off line if TLEGH is valid and stable for Hong Kong.
Figure 2a indicates that EDTGH is valid for some years but is generally not stable. Figure 2b indicates that for most years, except for around 2000, TLEGH is valid. As shown in Figure 2, we also found that the Wald statistic quickly dropped below the 0.05 significance level in the first quarter of 2020. This proves that the COVID-19 pandemic (2020) had an impact on the relationship between VAg and GDPg; however, it needs to be emphasized that this causal relationship is negatively correlated. In summary, the causal relationship between VAg and GDPg is not stable, a finding that is related to the nonstationary nature of macroeconomic development.
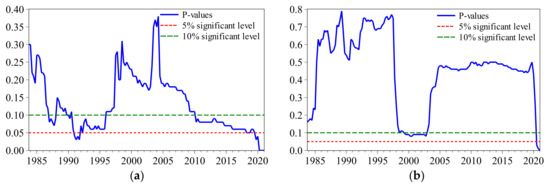
Figure 2.
P values of the recursive Granger causality test; (a) p values for EDTGH; (b) p values for TLEGH.
4.2. Robust Granger Causality Test
The traditional and recursive Granger test results verify that the causal relationship between tourism (VAg) and economic growth (GDPg) is not stable in Hong Kong. Paying attention to the mutations at the beginning and the end of the time point is one of the crucial steps of the robust Granger causality test; hence, the mutation point is an essential factor affecting it. In Figure 1, the two growth rates series show a high correlation between tourism and the economy before COVID-19 (2020) and a low correlation after COVID-19 (2020). VAg and GDPg had strong mutations during the COVID-19 period. Therefore, we need to detect the impact of major historical events on the relationship between tourism and economic growth on the basis of the data before COVID-19 in order to compare it with the impact of COVID-19.
VAR provides a systematic way to capture the rich dynamics in a multiple time series. Before building the VAR model, we used the augmented Dickey–Fuller (ADF) test method to perform a unit root test on the variables. We determined the optimal lag order according to the minimum criteria of the Akaike information criterion (AIC) and the Schwartz information criterion (SIC). The unit roots test results, listed in Table 4, show that the two variables are both stationary series.
Table 4.
ADF tests (1973:Q1–2021:Q1).
We considered the one-year-ahead forecasting model with no constant term: that is, we specified h = 3 and relaxed the homoscedasticity assumption. Next, in the presence of instability, we analyzed the long-term causality relationship between tourism (VAg) and economic growth (GDPg) under the framework.
Table 5 reports the p values of the robust Granger causality test statistics (for ExpW*, MeanW*, Nyblom*, and QLR*, respectively). The robust Granger causality test also returned a graph showing the whole sequence of the Wald statistics across time, which gives more information on when the Granger causality was varying.
Table 5.
Robust Granger causality tests.
- Null hypothesis: GDPg does not Granger-cause VAg.
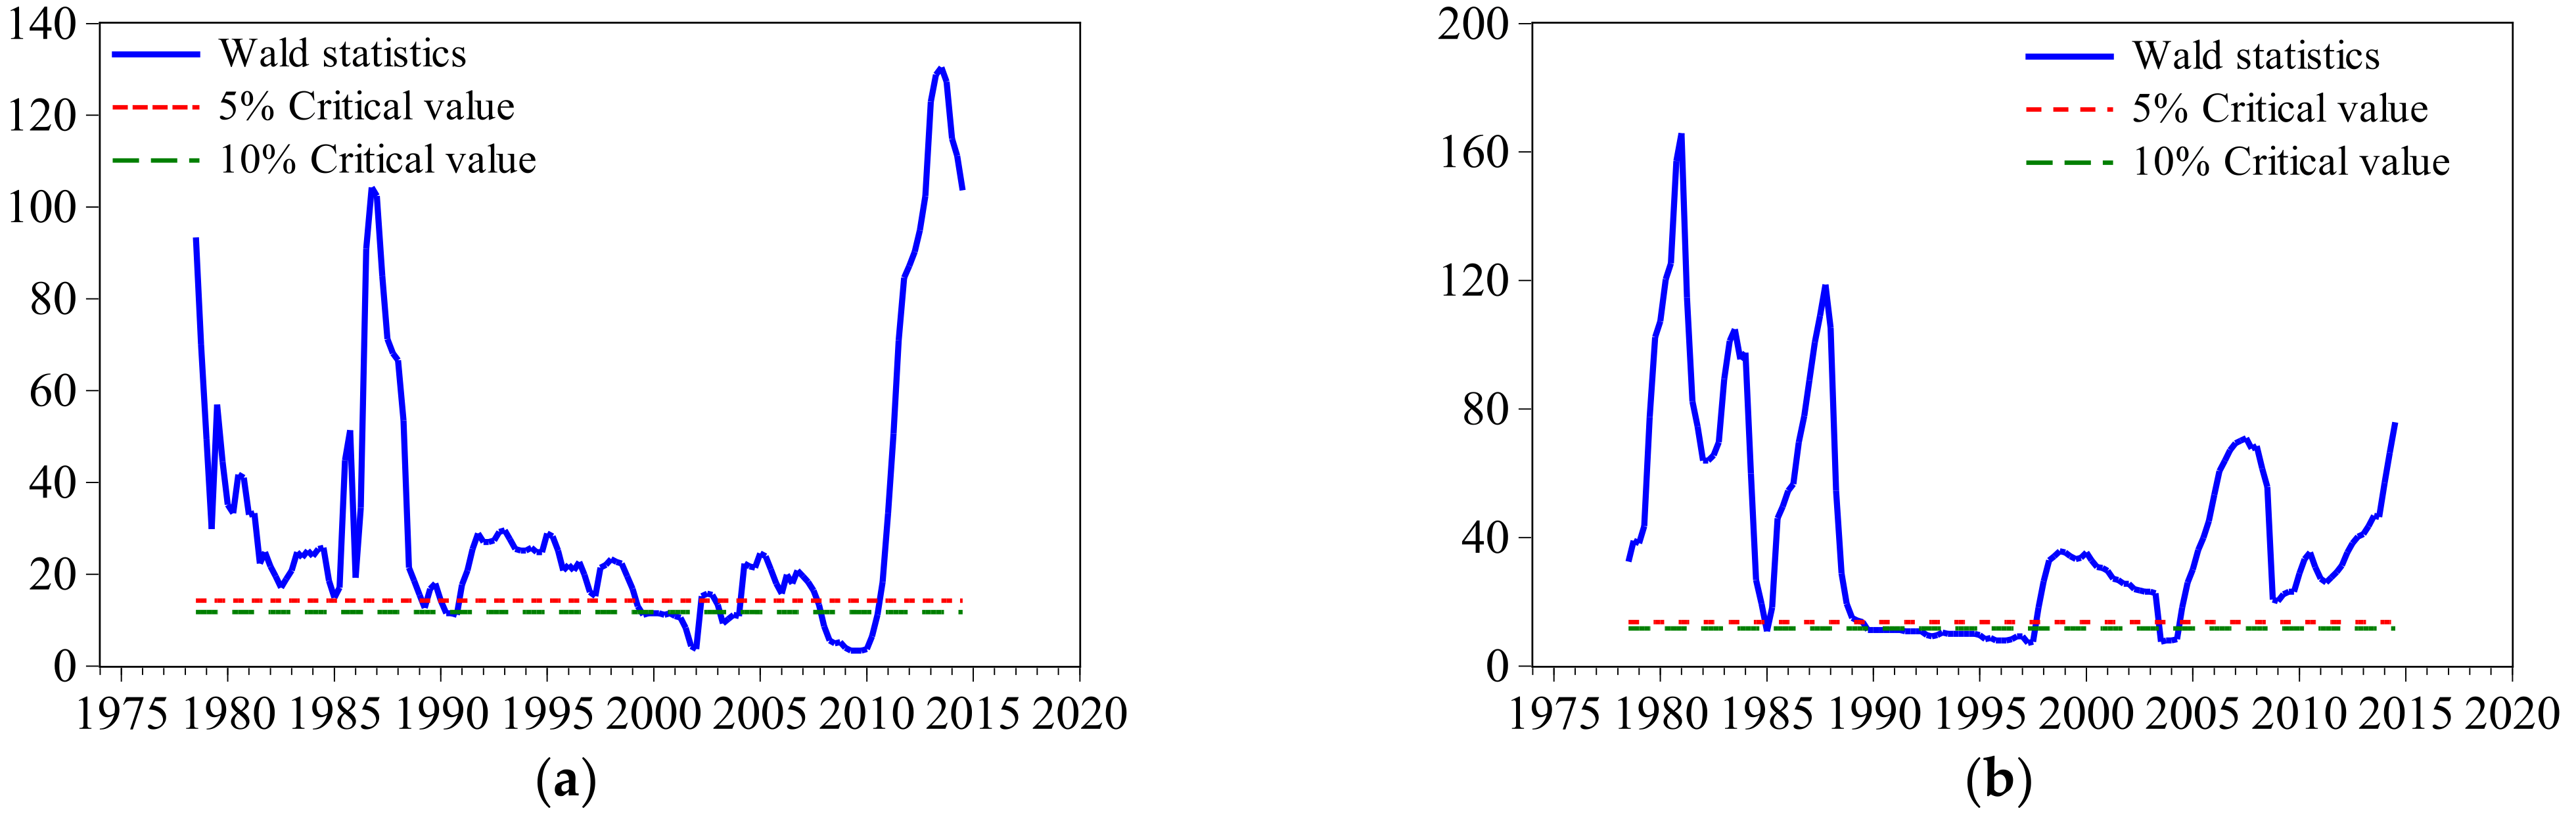
According to the p values of the robust Granger causality test (see Table 5), the four statistics reject the null hypothesis. We further analyzed the changes in the causal relationship over time according to the Wald statistic time series graph, shown in Figure 3a. In general, most of the Wald statistics fluctuate above the 5% and 10% significance levels, which means that EDTGH is valid for most years. However, we can still see that the stability of EDTGH is easily affected by major events. For example, SARS (2003) and the global financial crisis (2008) slowed economic development, resulting in insufficient government investment in tourism to effectively promote tourism development.
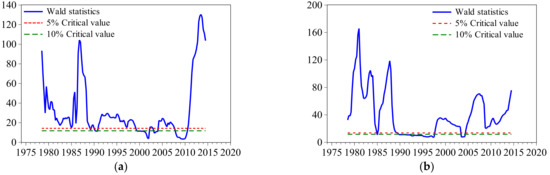
Figure 3.
Wald statistics for testing the causal relationship between VAg and GDPg in the presence of instability; (a) Wald statistics for EDTGH; (b) Wald statistics for TLEGH.
Figure 3a also indicates that the validity of EDTGH changed in the period of major events. However, changes in the causal relationship caused by major events are not lasting and the relationship can quickly return to normal. From this perspective, it shows that major events have a short-term impact on the validity of EDTGH.
- Null hypothesis: VAg does not Granger-cause GDPg.
Table 5 shows the p values of the robust Granger causality test; the ExpW*, MeanW*, and QLR* reject the null hypothesis, whereas Nyblom* accepts the null hypothesis. The robust Granger causality test generated a graph showing the whole sequence of the Wald statistics over time, shown in Figure 3b. It can be observed that the Wald statistic fluctuated above the critical value as a whole and dropped below the critical value in some years.
Figure 3b indicates that TLEGH is vulnerable to major events. For example, the Wald statistics dropped below the critical value from 1989 to 1997. China and Britain disagreed over Hong Kong and, as a result, there was social unrest in Hong Kong. Moreover, during the period after the return of Hong Kong to China, we found significant changes in 1997, 2003, and 2008. The return of Hong Kong to China in 1997 brought new tourism opportunities and economic growth to Hong Kong. From 1997 to 2003, the tourism growth rate (VAg) did Granger-cause the economic growth rate (GDPg). The SARS outbreak (2003) had a significant impact on Hong Kong’s tourism and economic development, and TLEGH became invalid in the short term. The global financial crisis (2008) also caused a cliff-like decline in the Wald statistics, but this situation did not last long. Hence, we believe that EGTGH is valid and stable without being affected by major events.
4.3. Has the Validity of TLEGH and EDTGH Changed during COVID-19?
The trimming parameter is one of the important parameters of the robust Granger test, and trims the beginning and end of the Wald statistic series. To avoid trimming the Wald statistics during the COVID-19 period (2020), we captured the impact of COVID-19 on the relationship between the economy and tourism by using the more recent data from 2016:Q1 to 2021:Q1 for Hong Kong.
Furthermore, to avoid the tail effect of the test on the robust Granger causality test, we chose h = 0 to simplify the VAR model. The ADF test results show that the two variables are stationary (see Table 6). Finally, we chose lag 1 and set the trimming parameter at 0.1 to avoid excessive information loss according to the same parameter selection method.
Table 6.
ADF tests (2016:Q1–2021:Q1).
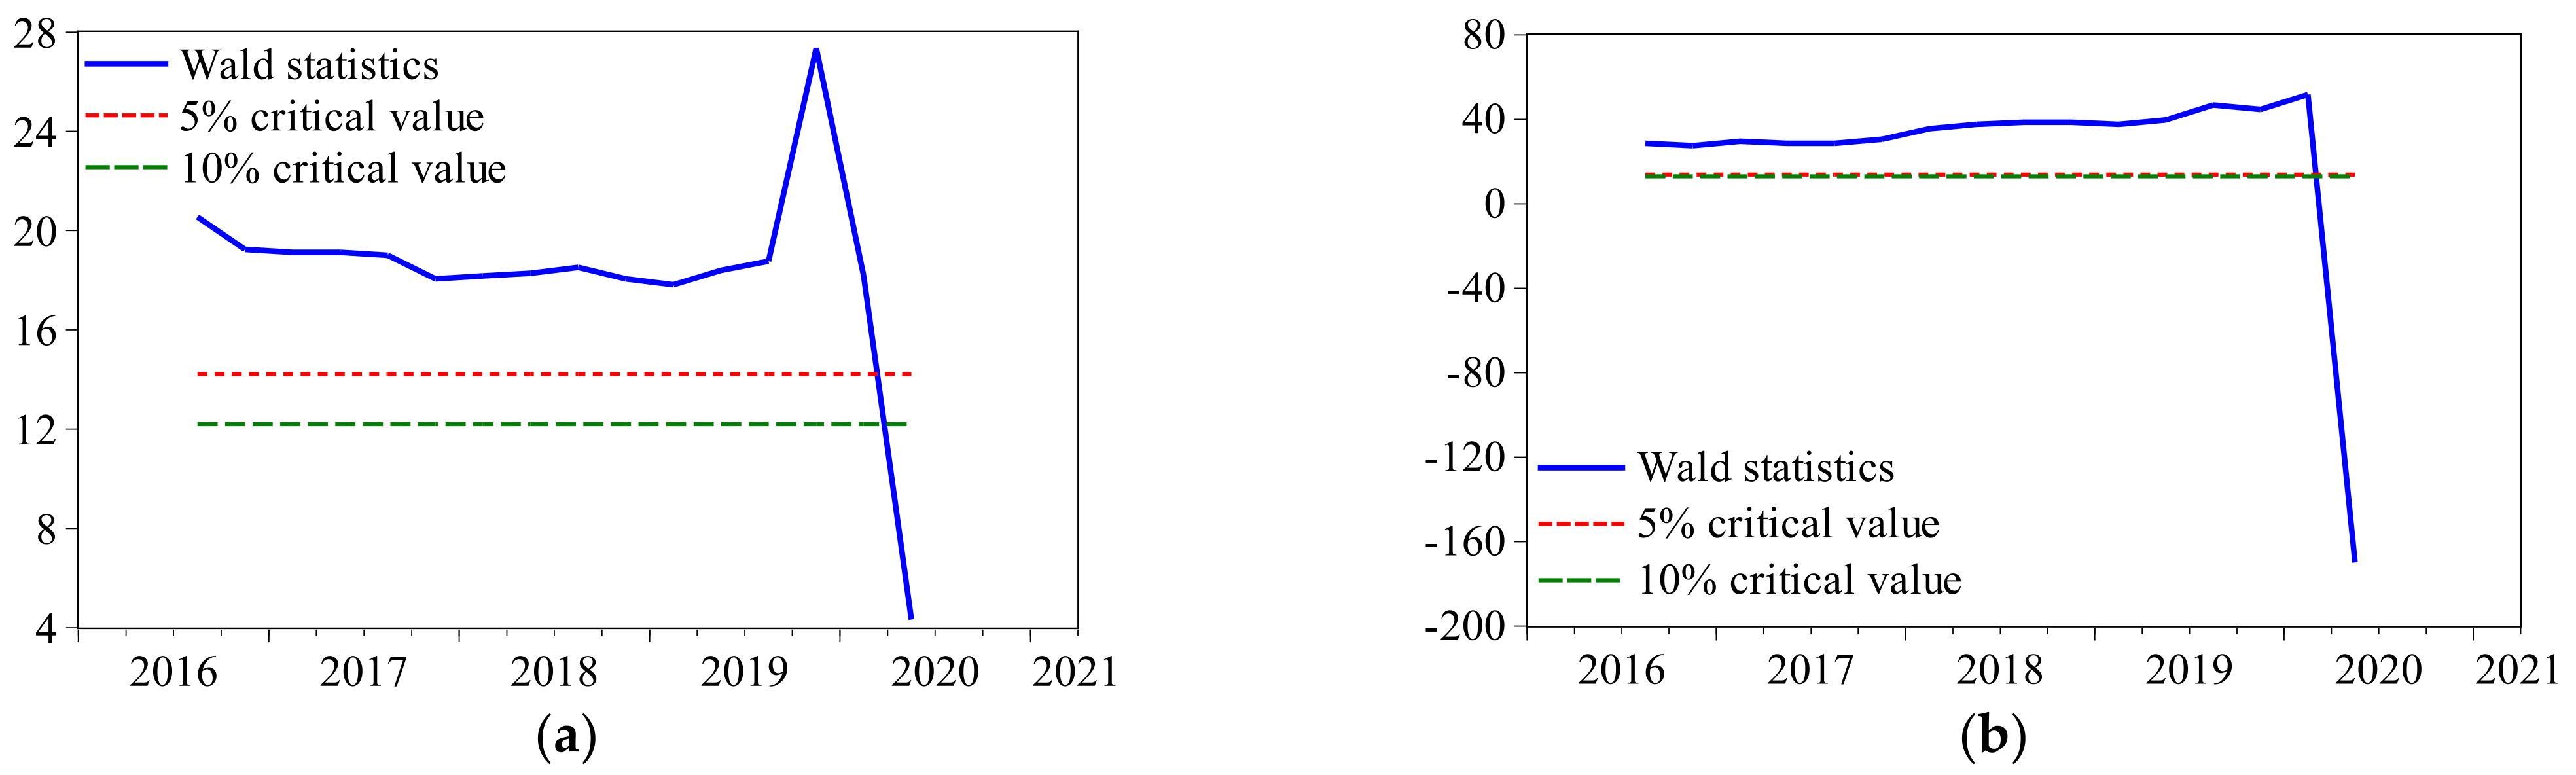
Figure 4a shows that from 2016:Q3 to 2020:Q2 the Wald statistics are more significant than the critical values of the 5% and 10% significance levels, indicating that EDTGH was valid for Hong Kong during this period. The impact of COVID-19 on changes in the relationship between tourism and economic growth mainly occurred in quarters two and three in 2020, which are related to the epidemic trend. The government’s epidemic prevention and control policies have had a huge impact on Hong Kong’s tourism industry; the Wald statistics fluctuated strongly and dropped below the critical level, and EDTGH was no longer valid.
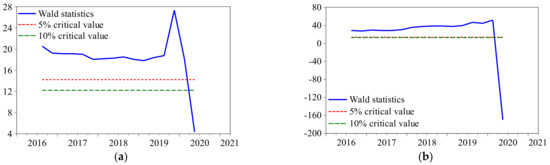
Figure 4.
Wald statistics for EDTGH and TLEGH in the presence of COVID-19; (a) Wald statistics for EDTGH; (b) Wald statistics for TLEGH.
Figure 4b shows that during the period from 2016:Q3 to 2019:Q3, the Wald statistic was stable at about 20 and was significantly higher than the critical values of the 5% and 10% significance levels, indicating that TLEGH was valid during this period. However, during the periods of social unrest in Hong Kong (2019) and COVID-19 (2020), the Wald statistics showed a dramatic change, first rising and then falling. A possible reason for this is that the social unrest in Hong Kong in the second half of 2019 affected the tourism industry and economic growth, although the difference in the degree of influence on the two was not significant. Hence, the negative causality (also the reason for the increase in the Wald statistic) became more important. However, after 2020:Q1, the emergence of COVID-19 broke this causal relationship. Tourism and the economy were not affected by the impact of COVID-19 to the same level. For example, in the first quarter of 2020, GDPg dropped by 9.31 year-on-year, while VAg dropped by 165.36 year-on-year, indicating that the tourism industry’s contribution to economic growth was insufficient. With the global spread of COVID-19, VAg has experienced a cliff-like decline and has been affected by the worldwide epidemic prevention and control policy. This decline is continuous and is also the direct cause of the changes in the validity of TLEGH.
As the global epidemic is not over, it is impossible to obtain data for the post-epidemic period. We considered the reduced-form VAR assuming homoscedastic idiosyncratic shocks. Fortunately, the robust method still captured essential information. Future research should implement the direct multistep VAR-LP forecasting model and assume heteroscedastic and serially correlated idiosyncratic errors on the basis of the data in the post-epidemic period.
5. Conclusions
The occurrence of major events causes the economic development environment to become unstable. Meanwhile, the relationship between tourism and economic growth can be sensitive to major events. As tourism is one of the supporting industries in Hong Kong, it is essential to clarify the relationship between tourism and economic growth in the presence of instability.
In this study, we first examined the stability of the causal relationship between tourism and economic growth using the traditional and recursive Granger causality test. The results indicated that the causal relationship between tourism and economic growth in Hong Kong is unstable. We then applied the robust Granger causality test in the presence of instabilities to reassess the Granger causality between Hong Kong’s tourism and economic growth using quarterly tourism arrival data and quarterly GDP data from 1973:Q1 to 2021:Q1. The robust Granger causality test showed bidirectional causality between tourism and economic growth in general, but this is vulnerable to major sudden incidents. For example, when affected by political events, there is usually a lasting impact on the validity of TLEGH as political incidents can create a psychological burden on tourists travelling to Hong Kong.
The decline in the number of tourists has led to the limited contribution of tourism to economic growth. However, a one-off event or an economic crisis usually has a short-term impact on the validity of TLEGH and EDTGH. Hence, this article provides new evidence on the impact of emergencies on the validity of TLEGH and EDTGH. The impact of public health emergencies on tourism and economic growth is short term. COVID-19 affects the relationship between tourism and economic growth in that it changes the role of the economy in boosting tourism and the contribution of tourism to economic growth. Affected by the epidemic, the flow of global tourists will slow down, and the tourism industry will be sluggish.
Hence, in response to the impact of COVID-19 on Hong Kong’s tourism and economic growth, the Hong Kong government should appropriately increase tourism investment in the short term to support the local tourism industry. Additionally, the government should promote an internal circular development model to deal with the unfavorable situation aggravated by the global epidemic.
This paper has some shortcomings. Firstly, in the empirical analysis of the relationship between tourism and economic growth, it should be considered that the two hypotheses are complicated and affected by other factors, meaning that multiple related variables should be included. In addition, it is necessary to select suitable models and variables to measure the relationship between tourism and economic growth based on the specific conditions and differences in tourism development in different regions. Finally, the causal transmission mechanism between tourism and economic growth influenced by major events may be interesting for future research.
Author Contributions
Conceptualization, Y.W. and C.P.; data curation, L.W.; funding acquisition, Y.W.; methodology, L.W.; resources, Y.W. and C.P.; software, Y.W. and L.W.; writing—original draft, L.W.; writing—review and editing, Y.W. and C.P. All authors have contributed equally to this work. All authors have read and agreed to the published version of the manuscript.
Funding
The authors would like to acknowledge the National Social Science Foundation of China (Grant No. 21BTJ027) for the financial support of the study.
Institutional Review Board Statement
Not applicable.
Informed Consent Statement
Not applicable.
Data Availability Statement
Not applicable.
Conflicts of Interest
The authors declare no conflict of interest.
References
- Blake, A.; Arbache, J.S.; Sinclair, M.T.; Teles, V. Tourism and poverty relief. Ann. Tour. Res. 2008, 35, 107–126. [Google Scholar] [CrossRef]
- Badulescu, A.; Badulescu, D.; Simut, R.; Dzitac, S. Tourism–economic growth nexus. The case of Romania. Technol. Econ. Dev. Econ. 2020, 26, 867–884. [Google Scholar] [CrossRef]
- Sehleanu, M. Analysis of foreign participation in the share capital of companies from the counties of North-West region of Romania. Orad. J. Bus. Econ. 2019, 4, 7–16. [Google Scholar] [CrossRef]
- Khan, H.; Seng, C.F.; Cheong, W.K. Tourism multiplier effects on Singapore. Ann. Tour. Res. 1990, 17, 408–418. [Google Scholar] [CrossRef]
- Liu, H.; Song, H.Y. New evidence of dynamic links between tourism and economic growth based on mixed-frequency Granger causality tests. J. Travel Res. 2017, 57, 899–907. [Google Scholar] [CrossRef]
- Alodadi, A.; Benhin, J. Religious tourism and economic growth in oil-rich countries: Evidence from Saudi Arabia. Tour. Anal. 2015, 20, 645–651. [Google Scholar] [CrossRef]
- Kumar, N.; Kumar, R.R.; Patel, A.; Stauvermann, P.J. Exploring the effect of tourism and economic growth in Fiji: Accounting for capital, labor, and structural breaks. Tour. Anal. 2019, 24, 115–130. [Google Scholar] [CrossRef]
- Leal Filho, W.; Brandli, L.L.; Lange Salvia, A.; Rayman-Bacchus, L.; Platje, J. COVID-19 and the UN sustainable development goals: Threat to solidarity or an opportunity? Sustainability 2020, 12, 5343. [Google Scholar] [CrossRef]
- Drozdowski, G. Economic calculus qua an instrument to support sustainable development under increasing risk. J. Risk Financ. Manag. 2021, 14, 15. [Google Scholar] [CrossRef]
- Song, H.; Wu, D.C. A critique of tourism-led economic growth studies. J. Travel Res. 2021, 00472875211018514. [Google Scholar] [CrossRef]
- Rossi, B.; Wang, Y. Vector autoregressive-based Granger causality test in the presence of instabilities. Stata J. Promot. Commun. Stat. Stata 2019, 19, 883–899. [Google Scholar] [CrossRef]
- Barnett, M.L.; Darnall, N.; Husted, B.W. Sustainability strategy in constrained economic times. Long Range Plan. 2015, 48, 63–68. [Google Scholar] [CrossRef]
- Ghali, M.A. Tourism and economic growth: An empirical study. Econ. Dev. Cult. Chang. 1976, 24, 527–538. [Google Scholar] [CrossRef]
- Pablo-Romero, M.d.P.; Molina, J.A. Tourism and economic growth: A review of empirical literature. Tour. Manag. Perspect. 2013, 8, 28–41. [Google Scholar] [CrossRef]
- Kyophilavong, P.; Gallup, J.L.; Charoenrat, T.; Nozaki, K. Testing tourism-led growth hypothesis in Laos? Tour. Rev. 2018, 73, 242–251. [Google Scholar] [CrossRef]
- Eeckels, B.; Filis, G.; Leon, C. Tourism income and economic growth in Greece: Empirical evidence from their cyclical components. Tour. Econ. 2012, 18, 817–834. [Google Scholar] [CrossRef]
- Bayramoğlu, T.; Arı, I. The relationship between tourism and economic growth in Greece economy: A time series analysis. Comput. Methods Soc. Sci. 2015, 3, 89–93. [Google Scholar]
- Balli, E.; Sigeze, C.; Manga, M.; Birdir, S.; Birdir, K. The relationship between tourism, CO2 emissions and economic growth: A case of Mediterranean countries. Asia Pac. J. Tour. Res. 2018, 24, 219–232. [Google Scholar] [CrossRef]
- Rivera, M.A. The synergies between human development, economic growth, and tourism within a developing country: An empirical model for Ecuador. J. Destin. Mark. Manag. 2017, 6, 221–232. [Google Scholar] [CrossRef]
- Wu, T.P.; Wu, H.C. The influence of international tourism receipts on economic development: Evidence from China’s 31 Major Regions. J. Travel Res. 2017, 57, 871–882. [Google Scholar] [CrossRef]
- Shahbaz, M.; Ferrer, R.; Shahzad, S.J.H.; Haouas, I. Is the tourism–economic growth nexus time-varying? Bootstrap rolling-window causality analysis for the top 10 tourist destinations. Appl. Econ. 2017, 50, 2677–2697. [Google Scholar] [CrossRef]
- Jebli, M.B.; Hadhri, W. The dynamic causal links between CO2 emissions from transport, real GDP, energy use and international tourism. Int. J. Sustain. Dev. World Ecol. 2018, 25, 568–577. [Google Scholar] [CrossRef]
- Enilov, M.; Wang, Y. Tourism and economic growth: Multi-country evidence from mixed-frequency Granger causality tests. Tour. Econ. 2021. [Google Scholar] [CrossRef]
- Ozturk, I.; Acaravci, A. On the causality between tourism growth and economic growth: Empirical evidence from Turkey. Transylv. Rev. Adm. Sci. 2009, 5, 73–81. [Google Scholar]
- Tang, C.-H.H.; Jang, S.S. The tourism–economy causality in the United States: A sub-industry level examination. Tour. Manag. 2009, 30, 553–558. [Google Scholar] [CrossRef]
- Lean, H.H.; Tang, C.F. Is the tourism-led growth hypothesis stable for Malaysia? A note. Int. J. Tour. Res. 2010, 12, 375–378. [Google Scholar] [CrossRef]
- Tang, C.F.; Tan, E.C. How stable is the tourism-led growth hypothesis in Malaysia? Evidence from disaggregated tourism markets. Tour. Manag. 2013, 37, 52–57. [Google Scholar] [CrossRef]
- Stock, J.H.; Watson, M.W. Evidence on structural instability in macroeconomic time series relations. J. Bus. Econ. Stat. 1996, 14, 11–30. [Google Scholar] [CrossRef]
- Clark, T.E.; McCracken, M.W. The predictive content of the output gap for inflation: Resolving in-sample and out-of-sample evidence. J. Money Credit Bank. 2006, 38, 1127–1148. [Google Scholar] [CrossRef] [Green Version]
- Cárdenas-García, P.J.; Sánchez-Rivero, M.; Pulido-Fernández, J.I. Does tourism growth influence economic development? J. Travel Res. 2013, 54, 206–221. [Google Scholar] [CrossRef]
- Saha, S.; Yap, G. The moderation effects of political instability and terrorism on tourism development: A cross-country panel analysis. J. Travel Res. 2014, 53, 509–521. [Google Scholar] [CrossRef]
- Elshaer, I.A.; Saad, S.K. Political instability and tourism in Egypt: Exploring survivors’ attitudes after downsizing. J. Policy Res. Tour. Leis. Events 2017, 9, 3–22. [Google Scholar] [CrossRef]
- Sönmez, S.F. Tourism, terrorism, and political instability. Ann. Tour. Res. 1998, 25, 416–456. [Google Scholar] [CrossRef] [Green Version]
- Dibeh, G.; Fakih, A.; Marrouch, W. Tourism–growth nexus under duress: Lebanon during the Syrian crisis. Tour. Econ. 2019, 26, 353–370. [Google Scholar] [CrossRef]
- Rossi, B. Optimal tests for nested model selection with underlying parameter instability. Econom. Theor. 2005, 21, 962–990. [Google Scholar] [CrossRef] [Green Version]
- Andrews, D.W.K.; Ploberger, W. Optimal tests when a nuisance parameter is present only under the alternative. Econometrica 1994, 62, 1383–1414. [Google Scholar] [CrossRef]
- Nyblom, J. Testing for the constancy of parameters over time. J. Am. Stat. Assoc. 1989, 84, 223–230. [Google Scholar] [CrossRef]
- Andrews, D.W.K. Tests for parameter instability and structural change with unknown change point. Econometrica 1993, 61, 821–856. [Google Scholar] [CrossRef] [Green Version]
- Ghysels, E.; Hill, J.B.; Motegi, K. Testing for Granger causality with mixed frequency data. J. Econom. 2016, 192, 207–230. [Google Scholar] [CrossRef]
- Wu, P.C.; Liu, S.Y.; Hsiao, J.M.; Huang, T.Y. Nonlinear and time-varying growth-tourism causality. Ann. Tour. Res. 2016, 59, 45–59. [Google Scholar] [CrossRef]
Publisher’s Note: MDPI stays neutral with regard to jurisdictional claims in published maps and institutional affiliations. |
© 2022 by the authors. Licensee MDPI, Basel, Switzerland. This article is an open access article distributed under the terms and conditions of the Creative Commons Attribution (CC BY) license (https://creativecommons.org/licenses/by/4.0/).