Article

Techno-Economic Analysis of Hydrogen and Electricity Production by Biomass Calcium Looping Gasification

1
State Key Laboratory of Clean Energy Utilization, Zhejiang University, Hangzhou 310027, China
2
Institute of Energy and Power Engineering, College of Mechanical Engineering, Zhejiang University of Technology, Chaowang Rd. 18, Hangzhou 310014, China
*
Authors to whom correspondence should be addressed.
Sustainability 2022, 14(4), 2189; https://doi.org/10.3390/su14042189
Submission received: 10 January 2022 / Revised: 1 February 2022 / Accepted: 8 February 2022 / Published: 15 February 2022

Abstract

:
Combined cycle, biomass calcium looping gasification is proposed for a hydrogen and electricity production (CLGCC–H) system. The process simulation Aspen Plus is used to conduct techno-economic analysis of the CLGCC–H system. The appropriate detailed models are set up for the proposed system. Furthermore, a dual fluidized bed is optimized for hydrogen production at 700 °C and 12 bar. For comparison, calcium looping gasification with the combined cycle for electricity (CLGCC) is selected with the same parameters. The system exergy and energy efficiency of CLGCC–H reached as high as 60.79% and 64.75%, while the CLGCC system had 51.22% and 54.19%. The IRR and payback period of the CLGCC–H system, based on economic data, are calculated as 17.43% and 7.35 years, respectively. However, the CLGCC system has an IRR of 11.45% and a payback period of 9.99 years, respectively. The results show that the calcium looping gasification-based hydrogen and electricity coproduction system has a promising market prospect in the near future.

1. Introduction

Currently, the production of hydrogen from fossil fuels has experienced increased research attention because of the ecofriendly nature of hydrogen utilization. Hydrogen is widely used in different areas such as ammonia production, oil refining, and production of chemicals, but limited hydrogen utilization constrains its further use. The expected availability of hydrogen can replace gasoline fuel in transportation and thermal power generation, resulting in less emissions [1,2]. Globally, hydrogen production is 70 Mt/year; 23% is contributed by coal gasification and 76% by natural gas reforming through the steam methane reforming process [3]. In contrast, the remaining production comes from different methods such as electrolysis, solar, and biological processes. The amount of coal consumed for hydrogen production is 107 Mt (2% of global coal use), and natural gas accounts for 205 Gm3 (6% of global natural gas), generating 830 Mt CO2 emissions, which are 2% of total global emissions [3]. Hence, an increase in hydrogen demand would lead to additional CO2 emissions; however, without carbon capture and storage (CCS), the existing technology infrastructure cannot meet the 2 °C Paris Agreement goal for climate change [1,2,4].
Biomass gasification can be an alternate technology for hydrogen production, considering hydrogen’s benefits in saving the environment and its economic feasibility [5]. The hydrogen produced from biomass gasification contributes a minor part of CO2 emission, since biomass is a renewable resource that consumes CO2 during its growth and releases CO2 from the gasification process [6]. Many countries realized that the “H2 economy” will be a potential solution to meet global energy demand and reduce fossil fuel use [7]. Market forecast shows that demand for hydrogen will increase in the near future with 5–10% growth per year, from 50 to 82 Mt by 2050. Globally, transportation (especially air and road) accounts for about a quarter of the net of carbon dioxide emissions [8,9,10]. Industrial activities by 2050 will increase the demand for H2, resulting in H2 production projected to rise, especially for steel and ammonia production, by about 2 EJ/a for each activity, while hydrogen-powered vehicles could produce approximately 22 EJ/a [11]. However, renewable resources contribute only 2% for hydrogen production; the main contribution comes from water electrolysis. There is no active use of biomass on an industrial scale [6,12], which creates an opportunity to convert biomass into a valuable source of hydrogen. Research has been carried out to assess the economic pros and cons of prevalent and upcoming technologies in terms of low CO2 emissions resulting from hydrogen production, such as gas switching–reforming [13], membrane-assisted fluidized-bed reactors [14], chemical looping reform (CLR) [15,16,17], autothermal reform (ATR) with CCS [16], steam methane reform (SMR) with chemical looping combustion (CLC) [16], and SMR with amine scrubbing [15], to evaluate the economic performance for low-emission hydrogen production; the average cost of hydrogen was 1.6–3.2 USD/kg. Kathe et al. investigated the thermodynamic limitations and energy consumption of the natural gas CLR hydrogen generation process using an iron-based oxygen carrier (OC) [18]. Adiya et al. investigated using NiO on Al2O3 and NiO on CaO/Al2O3 as catalysts and OC in a packed bed reactor for shale gas chemical looping steam reforming for hydrogen production, which showed a high fuel conversion and yield under operating temperatures of 700 and 750 °C [19,20]. Techno-economics analysis of three hydrogen production processes was investigated by Chisalita and Cormos [21], which concluded that efficient hydrogen production via chemical looping is the most efficient with low maintenance and operating costs. Furthermore, by utilizing iron oxide (OC) and CaO as CO2 adsorbents, a new integration of sorption-enhanced CLR and water splitting for hydrogen generation was proposed by Saithong et al. [22]. Thus, utilizing calcium looping technology for biomass to hydrogen and power production with in situ CO2 capture is projected to improve thermodynamic process efficiency, provide economic advantage, and achieve negative carbon emission. A comprehensive investigation of the calcium looping mechanism is planned.
Hosseini and Wahid [9] reported that supercritical water gasification of biomass is one of the most cost-effective thermochemical processes since wet biomass is fed directly into the gasifier without prior drying. Furthermore, generation at high pressure lowered the cost of hydrogen storage. Udomsirichakorn and Salam [23] studied calcium oxide in chemical looping of biomass gasification for hydrogen generation, and concluded that biomass gasification is a viable, environmentally benign, and long-term option for hydrogen generation, satisfying the environmental requirement. Adams and Barton [24] offered techno-economic studies for several technologies that were used to develop efficient polygeneration systems for processing coal and natural gas. Ahmed et al. [25] proposed an integrated model of coal gasification with SMR to enhance H2 production by utilizing syngas heat and steam from the gasification process. Furthermore, Ahmed et al. [26] conducted a techno-economic analysis of both traditional coal and the integrated coal gasification and SMR process, establishing that the integrated model is more efficient. Moreover, Cormos [27] investigated techno-economic analysis of coal-fired combustion and gasification power plants having post-combustion CO2 capture by utilizing a calcium looping cycle. It was concluded that calcium looping has good application potential in combustion-based power plants with 90% carbon capturing rate, low energy penalties, and high efficiency. Cormos [28] carried out a study on biomass direct chemical looping for cogeneration of hydrogen and power. This process provides high energy efficiencies and a carbon capture rate higher than 99%, which contrasts with various other CO2 capture techniques (e.g., gas–liquid absorption). The economic factors revealed the reduction in CO2 capture cost penalty for proposed technology in contrast to gas–liquid absorption. Jiang et al. [29] analyzed the thermodynamic and economic assessment of two chemical looping cycles schemes with conventional biomass gasification. The study provides a detailed comparison of chemical looping and calcium looping with conventional biomass gasification in terms of capital cost, operating cost, and the levelized cost of energy. Calcium looping and chemical looping proved to be better options for the environment than conventional biomass gasification due to high carbon capturing efficiency.
In the literature, none of the studies have investigated the economic performance of the combined cycle of calcium looping gasification (CLGCC) with duel fluidized bed (DFB) in situ carbon capture or hydrogen and power generation by calcium looping gasification (CLGCC–H), which can offer near-zero or negative CO2 emissions. Furthermore, all previous studies on the integration of chemical looping with IGCC and reforming processes were based on the additional use of steam and CO2 to perform reforming processes. The current study mainly aimed to (1) propose and simulate a novel DFB, CLGCC–H, and CLGCC system with a CaO-based capture system, analyze the impact of different parameters on the system performance by Aspen Plus, and (2) to perform a comprehensive techno-economic data evaluation for both systems and to provide a reference framework for commercial operation.

2. Modeling and Simulation

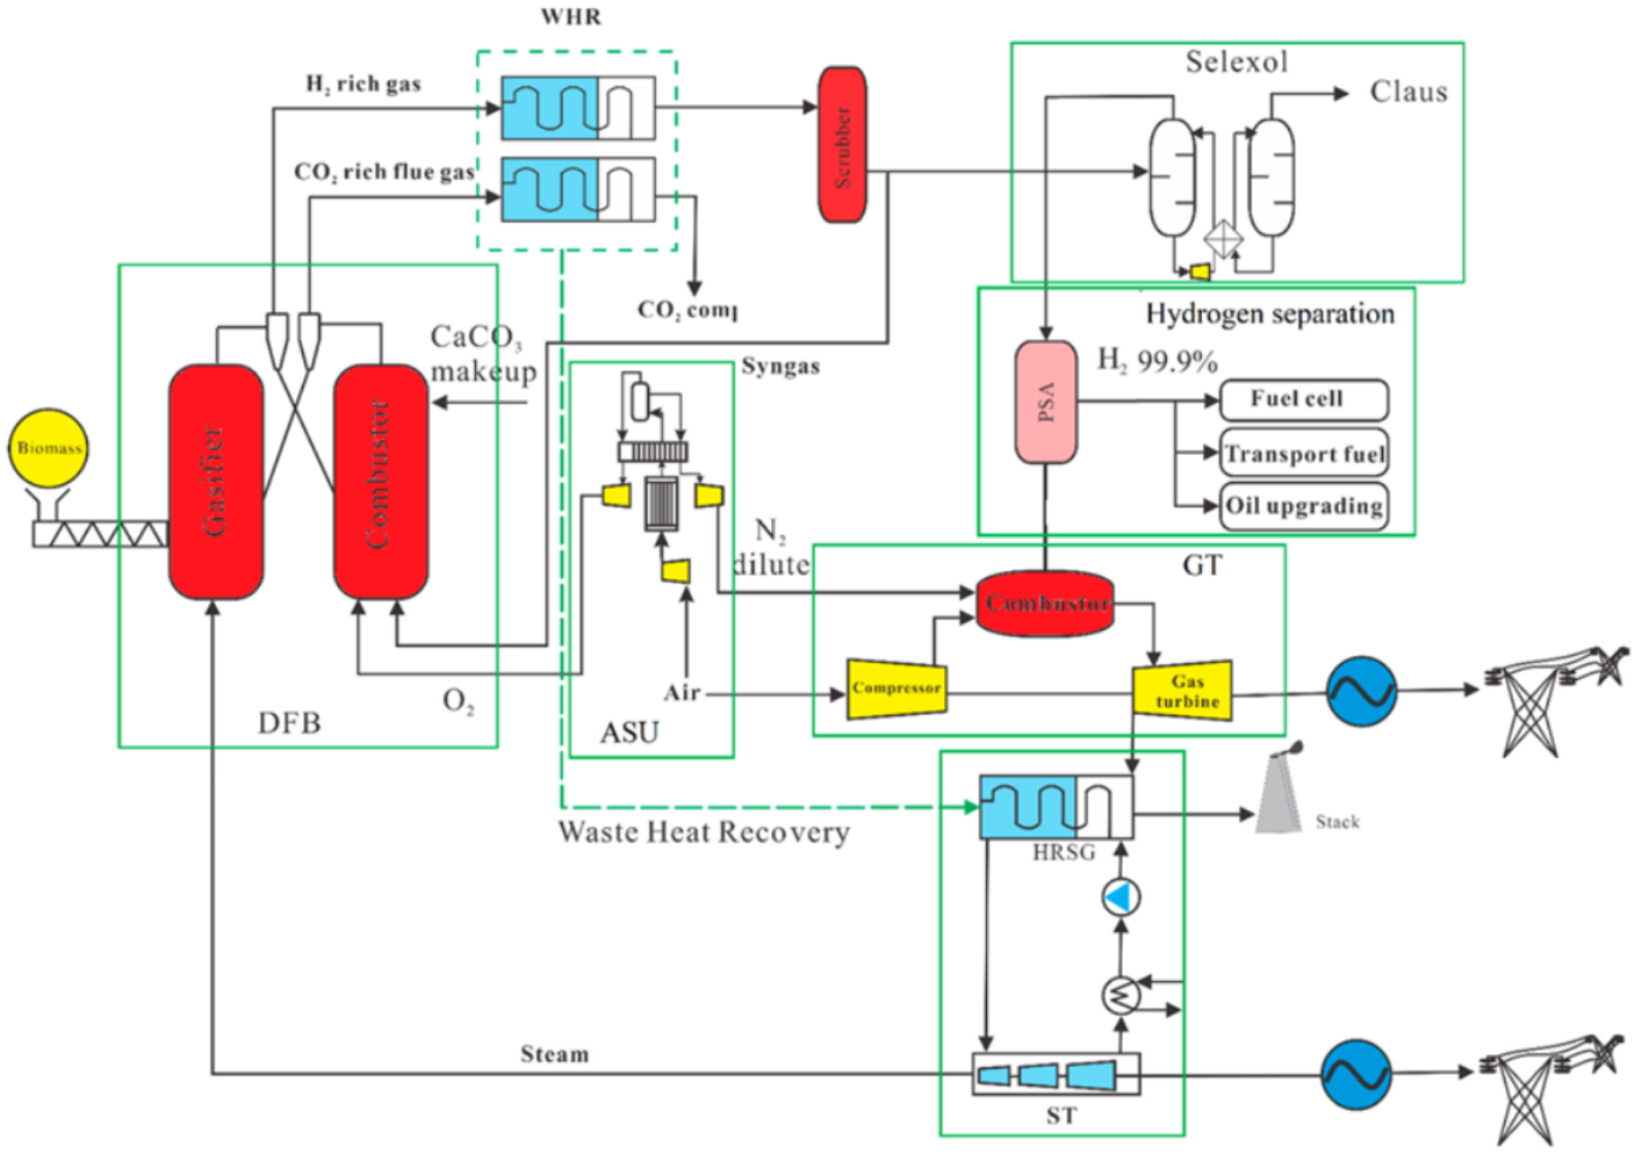
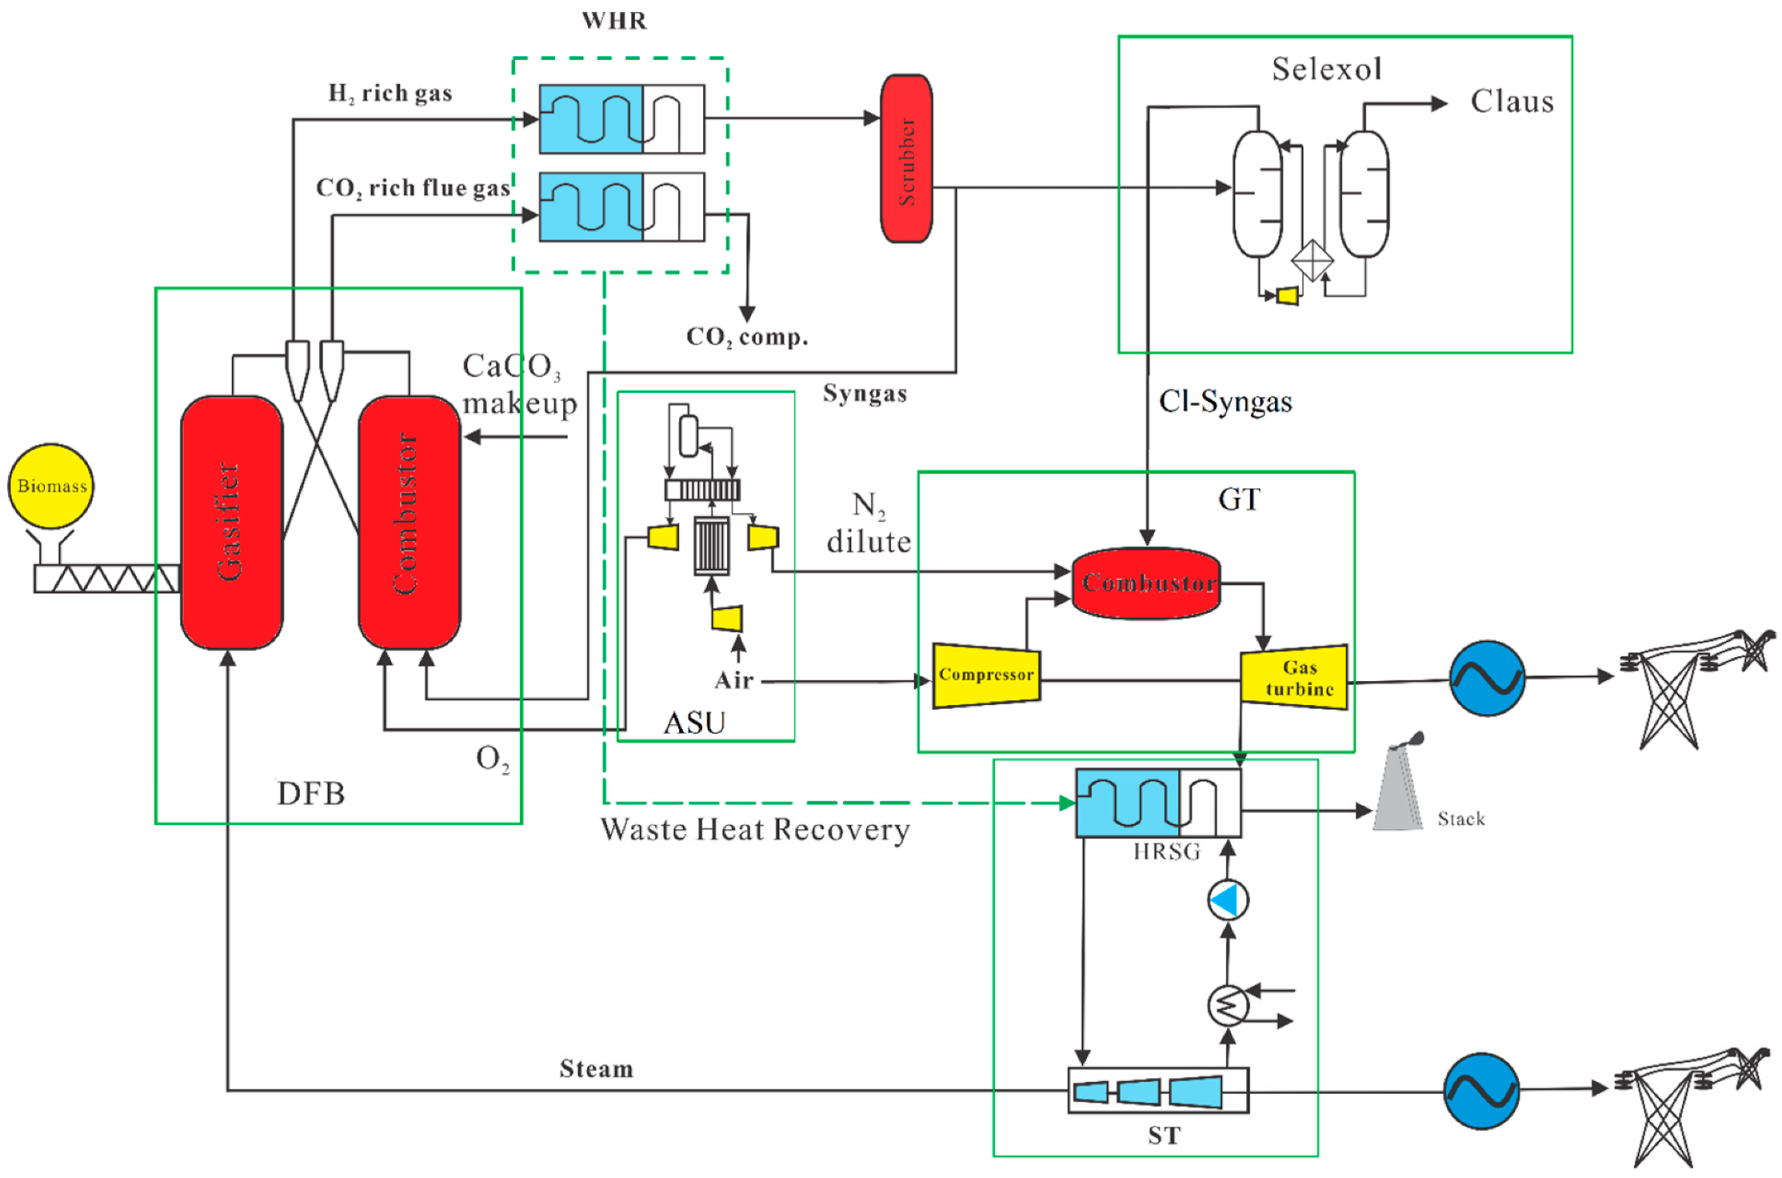
2.1. Hydrogen and Electricity Production by Calcium Looping Gasification Process

The calcium looping gasification with the combined cycle for electricity generation (CLGCC) and calcium looping gasification with the combined cycle for hydrogen and electricity generation (CLGCC–H) schema mainly comprise flowing prime blocks in sequence, i.e., dual fluidized bed (gasifier and combustor), ASU, waste heat recovery (WHR), heat recovery steam generator (HRSG), gas cleaning (scrubber), acid gas removal unit (Selexol), elemental sulfur recovery unit (Claus), gas turbine (GT), and steam turbine (ST). The block diagram of CLGCC and CLGCC–H is shown in Figure 1 and Figure 2. For hydrogen separation, the pressure swing absorption (PSA) is an additional unit after the selexol unit. Table 1 represent a design assumption for the CLGCC and CLGCC–H system.
Pine sawdust is used as fuel in this research; the chemical (ultimate and proximate) analysis results are recorded in Table 2. After preparation, fuel is fed to the gasifier, which reacts with the steam to produce hydrogen-rich syngas. The hydrogen-rich syngas is piped to the waste heat recovery for steam generation. The unburned char from the gasifier and clean syngas after scrubber is combusted in a combustor with O2 coming from ASU, which produces heat for gasifier needs and CaO regeneration, and CO2-rich flue gas produced in the combustor is piped to CO2 storage after cooling. The flowsheet of the CLGCC is shown in Figure 3. After cleaning processes, the H2-rich syngas is routed for hydrogen and electricity through PSA or without PSA for power generation. The hydrogen separated is at 99.9 vol%, and the remaining syngas is combusted in a gas turbine after the GT steam cycle is used for power generation.

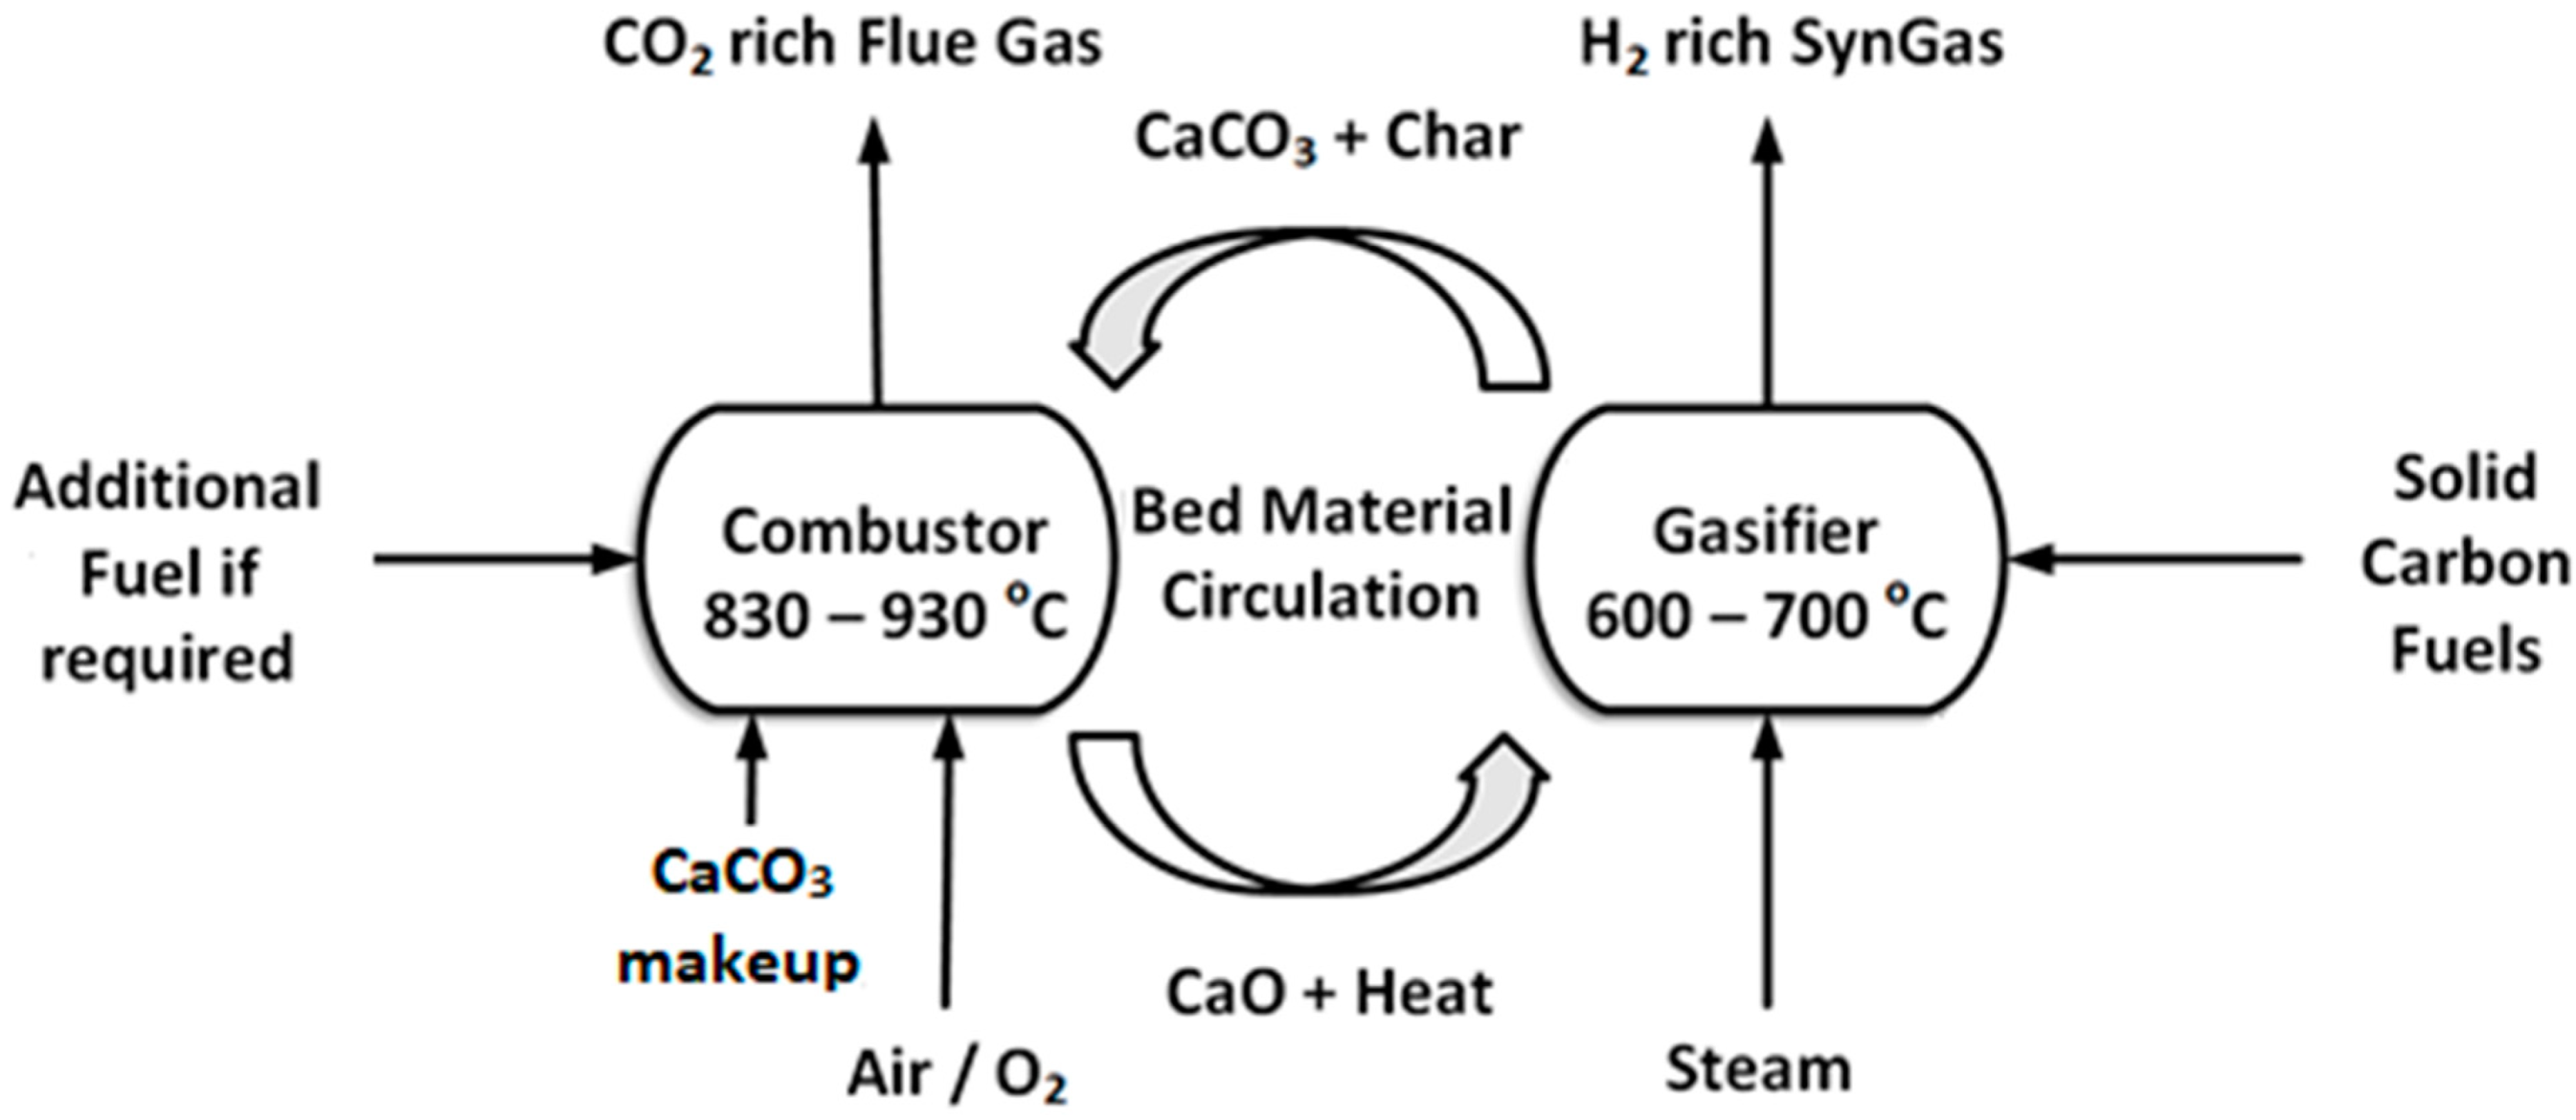
2.1.1. Dual Fluidized Bed Calcium Looping Gasification

Figure 4 depicts the layout of the simplified process for H2 production by DFB biomass steam gasification, consisting of gasification and combustor reactors. The carbonous fuel is fed into a fluidized bed that uses steam for fluidization. The gasification occurred at a temperature of 700 °C, with 10 bar pressure, and recirculated CaO was used as a CO2 absorbent and formed CaCO3. Residual char and CaCO3 from the gasifier after cyclone enter into the combustor, where char and dehydrated syngas from the gasifier (if required) is combusted with oxygen to reform CaO from CaCO3, producing CO2-rich flue gas at a combustion temperature of 1000 °C and 12 bar pressure. Additionally, CO2 is captured in DFB by the calcium looping process, based on Le Chatelier’s Principle. Moreover, enhanced hydrogen production reactions, such as water–gas, water–gas-shift, and steam methane reforming, are all based on the same principle.
The energy required for gasification and the rate at which the bed material circulates influences the temperature differential between the combustion and gasification zones. The quantity of unburnt char that exits the gasifier with the bed material and the gasification temperature are two more factors that have an energy impact. This system is intrinsically auto-stabilizing because the decrease in the gasification temperature results in a higher quantity of residual char and, as an outcome, the combustion reactor has more fuel. Thus, it feeds more energy into the gasification zone, which adjusts the temperature accordingly. The process produces two distinct gas streams, H2-rich syngas from the gasifier reactor and CO2-rich flue gas from the combustor reactor, at high temperatures. The following are the significant reactions that occur in a dual fluidized bed.
Gasifier Reactor (600–700 °C),
Water gas:
C + H 2 O       C O +   H 2 H R 650 / 900 = 136   kJ / mol
Hydro-gasification or methanation:
C   + 2 H 2   CH 4 H R 650 / 900 = 88   kJ / mol
C   +   CO 2   2 CO H R 650 / 900 = 171   kJ / mol
Methane steam reforming:
CH 4 +   H 2 O     CO + 3 H 2 H R 650 / 900 = 224   kJ / mol
Water-gas shift:
CO   +   H 2 O     CO 2 +   H 2 H R 650 / 900 = 36   kJ / mol
Hydro-carbon steam reforming:
C x H y +   xH 2 O     xCO   + ( x + 0.5 ) H 2 > 0   kJ / mol
Hydro-carbon dry reforming:
C x H y + 2 xCO 2     2 xCO   + 0.5 yH 2 > 0   kJ / mol
Carbonation:
CaO   +   CO 2     CaCO 3 H R 650 / 900 = 170   kJ / mol
Combustor Reactor (830–930 °C),
CO oxidation:
CO   + 0.5   O 2     CO 2 H R 650 / 900 = 282   kJ / mol
Partial oxidation of carbon:
C   + 0.5   O 2     CO H R 650 / 900 = 113   kJ / mol
Total oxidation of carbon:
C   +   O 2     CO 2 H R 650 / 900 = 395   kJ / mol
Calcination:
CaCO 3   CaO   +   CO 2 H R 650 / 900 = 166   kJ / mol

2.1.2. Air Separation Unit

The main purpose of the air separation unit (ASU), being a large-scale modern plant, is to feed highly pure O2 to the gasification unit employing combined distillation and cryogenic air separation [30]. In practice, initially, the compressed liquefied air at 5–6 bar, is cooled using an expander to achieve liquefaction. Then, it is fed into the oxygen–nitrogen separation tower, having two parts, i.e., upper and lower. The upper tower’s bottom is used to distill oxygen, the separation of O2 from the N2 and Ar, taking place at the base of the lower tower. The combustor unit employs O2 (94.5 mol%) as an oxidant, while as stripping gas highly pure N2 is utilized and N2 is used for syngas dilution in the selexol unit and gas turbine, respectively. To thermodynamically simulate the ASU model, the Peng–Rob EOS method was opted, whereas to model the separation tower, a RadFrac block was employed.

2.1.3. Heat Recovery and Water Scrubbing

The heavy particles are separated in the cyclone; heat is then recovered in HRSG from hot H2-rich syngas, rich in fine particles. After heat recovery, syngas is fed to water scrubbing to eliminate fine particles. MHeatX and Flash2 models of Aspen Plus software are employed to simulate the heat recovery and fine particle trapping, assuming that the efficiency of fine particle separation is 100%. Then the clean and cool syngas, with a temperature of 45 °C, is fed to the selexol unit, while CO2-rich gas at 100 °C flows to the CO2 compression unit for subsequent storage.

2.1.4. Selexol Unit

Chemical and physical solvents are commonly employed in the desulfurization process on a commercial scale to remove the acid gas, particularly for H2S. Since the physical absorption process is more energy-efficient at a very high concentration of H2S [31], physical solvents, viz., dimethyl ether of polyethylene glycol (Coastal AGR® or DEPG; Selexol™), methanol (Rectisol®), n-methyl-2-pyrrolidone (NMP, Purisol®), and propylene carbonate (Fluor Solvent™) are advantageously preferred over the chemical solvents [32]. Specifically, as the Rectisol® is a complex process, it therefore has a higher operational cost. Further, the Fluor Solvent™ process is preferred due to having little or no H2S in the syngas [32]. In the selexol unit, DEPG is adopted as a solvent to remove H2S.
The complex configurations of H2S absorbers and the stripper that generates DEPG, causing a comparatively slow convergence speed, Sep block model is employed, representing the single-stage Selexol™ process to remove H2S from the water scrubbed clean syngas. The perturbed-chain statistical associating fluid (PC-SAFT) property method is chosen [31,33]. The concentration of H2S-rich gas and the clean gas is employed by Field et al. [32]. Then, to generate elemental sulfur, acid gas-rich H2S is fed to a Claus/SCOT plant [34]. The Claus process allows for a split-flow configuration with a portion of the H2S supply going to the furnace and the rest bypassing it to mix in the first catalytic reactor. In the Claus process, sulfur condensers are used to eliminate sulfur, allowing the Claus equilibrium reaction to occur in the converter reactor. After two stages of condensers and converters, the remaining SO2 is converted back to H2S in the Tail Gas Thermal Unit (TGTU), allowing the tail gas to be recycled back into the selexol unit. Below is a summary of the responses [35,36].

2.1.5. Pressure Swing Adsorption (PSA) Unit

As a modern gas separation technology, comparatively, PSA is extensively utilized to achieve hydrogen purification, employing a physical adsorption technique [37]. It functions at an average temperature and varied pressure levels to remove impurities in hydrogen through an adsorbent. The PSA hydrogen production, an operationally stable process, is accomplished in three stages: high-pressure adsorption, low-pressure desorption, and pressure boosting. It helps to remove various impurities from the mixed gas simultaneously to produce a highly pure product. Firstly, the H2-rich mixed gas is introduced into the adsorbent bed from the bottom at high pressure, making adsorption of impurities, viz., CO, CO2, and CH4 are weakly adsorbed components, resulting in hydrogen separation. Secondly, based on the efficiency of the adsorbed components, the adsorbent is reproduced by either product hydrogen purging or reverse pressure relief method to maintain the quality of the products. Following this, the pressure in the adsorbent bed is readjusted. Commonly, at least two or more adsorbent beds are utilized for sustainable production of the hydrogen cycle. For modeling the PSA, RK-Soave was adopted owing to its thermodynamic nature, whereas adsorption tower was simulated by adopting Sep block.

2.1.6. The Gas Turbine (GT) and Steam Turbine (ST)

Both the gas and steam turbine models are set up by using Aspen Plus. The clean syngas from selexol/PSA is directed to the combustion chamber. The exhaust gas is used in the gas turbine to generate electricity. Compressed air is also introduced to accomplish the combustion process. Additionally, separated nitrogen is mixed with the clean syngas to constrain the temperature at the gas turbine inlet to 1550 °C and to avoid the formation of nitrous oxides. Then, the exhaust from the gas turbine is fed into the heat recovery steam generator (HRSG), with additional heat being recirculated from different parts of the plant for steam production. A steam cycle occurs with the subcritical power generation technology, as the temperature of exhaust gas from the gas turbine is comparatively low (~570 °C). This superheated steam is used to drive the steam turbine, which generates additional electricity for the grid. Table 3 shows the specific parameters of the combined cycle (GT and ST). For the material property analysis, the PR-BM property package is utilized for analysis. In contrast, STEAM-TA is adopted for water and steam accessories including pumps and steam turbines.

3. Techno-Economic Evaluation

The production of hydrogen and electricity from biomass by calcium looping gasification process was realized using Aspen Plus; techno-economic evaluation was carried out using the simulation-based results.

3.1. Thermodynamic Evaluation

The first law of thermodynamics is used to determine the energy efficiency, while exergy efficiency is evaluated by the second law of thermodynamics. Energy and exergy efficiencies are simultaneously applied to investigate the hydrogen and electricity production by calcium looping gasification.
ɳ CLGCC H = E net   product , tot E in , tot × 100 = m Biomass LHV H 2 + E GT + E ST E AUX m Biomass LHV Biomass × 100
Ɛ CLGCC H = Ex net   product , tot Ex in , tot × 100 = Ex H 2 + Ex GT + Ex ST Ex AUX Ex Biomass × 100
ɳ CLGCC = E net   product , tot E in , tot × 100 = E GT + E ST E AUX m Biomass LHV Biomass × 100
Ɛ CLGCC = Ex net   product , tot Ex in , tot × 100 = Ex GT + Ex ST Ex AUX Ex Biomass × 100
For these equations, Ɛ ( % ) and ɳ ( % ) represent the exergy and energy efficiencies, respectively; m i denotes the flow rate of species i , and LHV i is lower heating value of material i . E GT (MW), E ST (MW), and E AUX (MW) represent the energy of net power generation from the gas turbine, steam turbine, and power consumed by auxiliary equipment in the whole plant. Finally,   Ex H 2 (MW), Ex GT (MW), Ex ST (MW), and Ex AUX (MW) represent the exergy of hydrogen, net power generation from the gas turbine, steam turbine, and power consumed by auxiliary equipment in the whole plant. The exergy of biomass is calculated by Szargut’s correlation [38], exergy of hydrogen is determined by Rant’s equation [39].
The CO2 capture efficiency ɳ ccs of CLGCC–H and CLGCC system is defined as:
ɳ ccs = X c   in   CO 2 rich   flue   gas X C   in   biomass   feed × 100   %
where X c   in   CO 2   rich   gas is carbon mole flow in CO2-rich flue gas out from the combustor and X C   in   biomass   feed is carbon mole flow through biomass feed.

3.2. Economic Evaluation

The fixed capital investment (FCI), payback period, and internal rate of return (IRR) are used to evaluate and highlight the economic efficiency of CLG-hydrogen and electricity, considering the cost of associated facilities, input materials, and resulting products. The FCI is determined by the scaling-up method, promoted by Sweny et al. [40].
F C I = a = 0 b [ I a V r , a ( C a C r , a ) S a ]
where I a , C a , and S a represent installation factor, scale, and scale factor of equipment in the calculated scale, respectively. V r , a and C r , a denote the reference cost and scale of equipment respectively, with b as the total number of devices. The price of every piece of equipment is calculated with reference to the cost index as defined by the thermal power engineering limit design [41].
Cost   in   current   year = cos t   in   year   x   × CEPCI current CEPCI year   x
The effect of inflation is reported by employing the chemical engineering plant cost index (CEPCI), as given by Equation (19). The annual CEPCI for 2011, 2014, and 2017 is 585.7, 576.1, and 567.5, respectively, whereas the CEPCI for 2019 (607.5) is considered the current year CEPCI [42].
The feasibility of engineering projects is commonly evaluated based on the IRR, expressed as [43,44]:
t = 0 n C t ( 1 + I R R ) t = 0
where C t denotes the cash flows of the year t, whereas n represents the calculation years.
The net cash flow C t is calculated as per Equation (21) [44].
C t = C P ( ( C R F ( 1 + α ) + O A M ) F C I + C F + C M )
where C P , C F , and C M denotes the annual income of products, fuel cost, and material cost, respectively. OAM represents the annual operation and management cost ratio to FCI, which is 4% of FCI. Further, α symbolizes the interest rate during the construction period, while the CRF denotes the average annual investment ratio [45]. Table 4 summarizes the detailed information about the capital cost of all facilities.
C R F = i 1 ( 1 + i ) n
The payback period is calculated as reported in [46]:
n = 1 P t C t = 0
where P t denotes the payback period and n represents time.

4. Results and Discussion

4.1. System Validation and Optimization

The biomass CLGCC–H and CLGCC models were verified using experimental data from our 10 kW system [53] and compared with other literature [54,55,56]. The model’s conditions were found to be the same in both simulation and experiment. The simulated syngas compositions are acceptable compared with experimental data by the root mean square error (RMSE) method. In principle, the WGS and methane reforming process are kinetically restricted; larger plants have longer residence times of gases and solids within the furnace, contributing to a syngas that is closer to the final equilibrium result. The RMSE for H2, CO, CO2, and CH4 are observed to be 0.025, 0.43, 0.33, and 0.6, respectively. However, simulation results obtained from this current study revealed no major difference from the previous study [53].

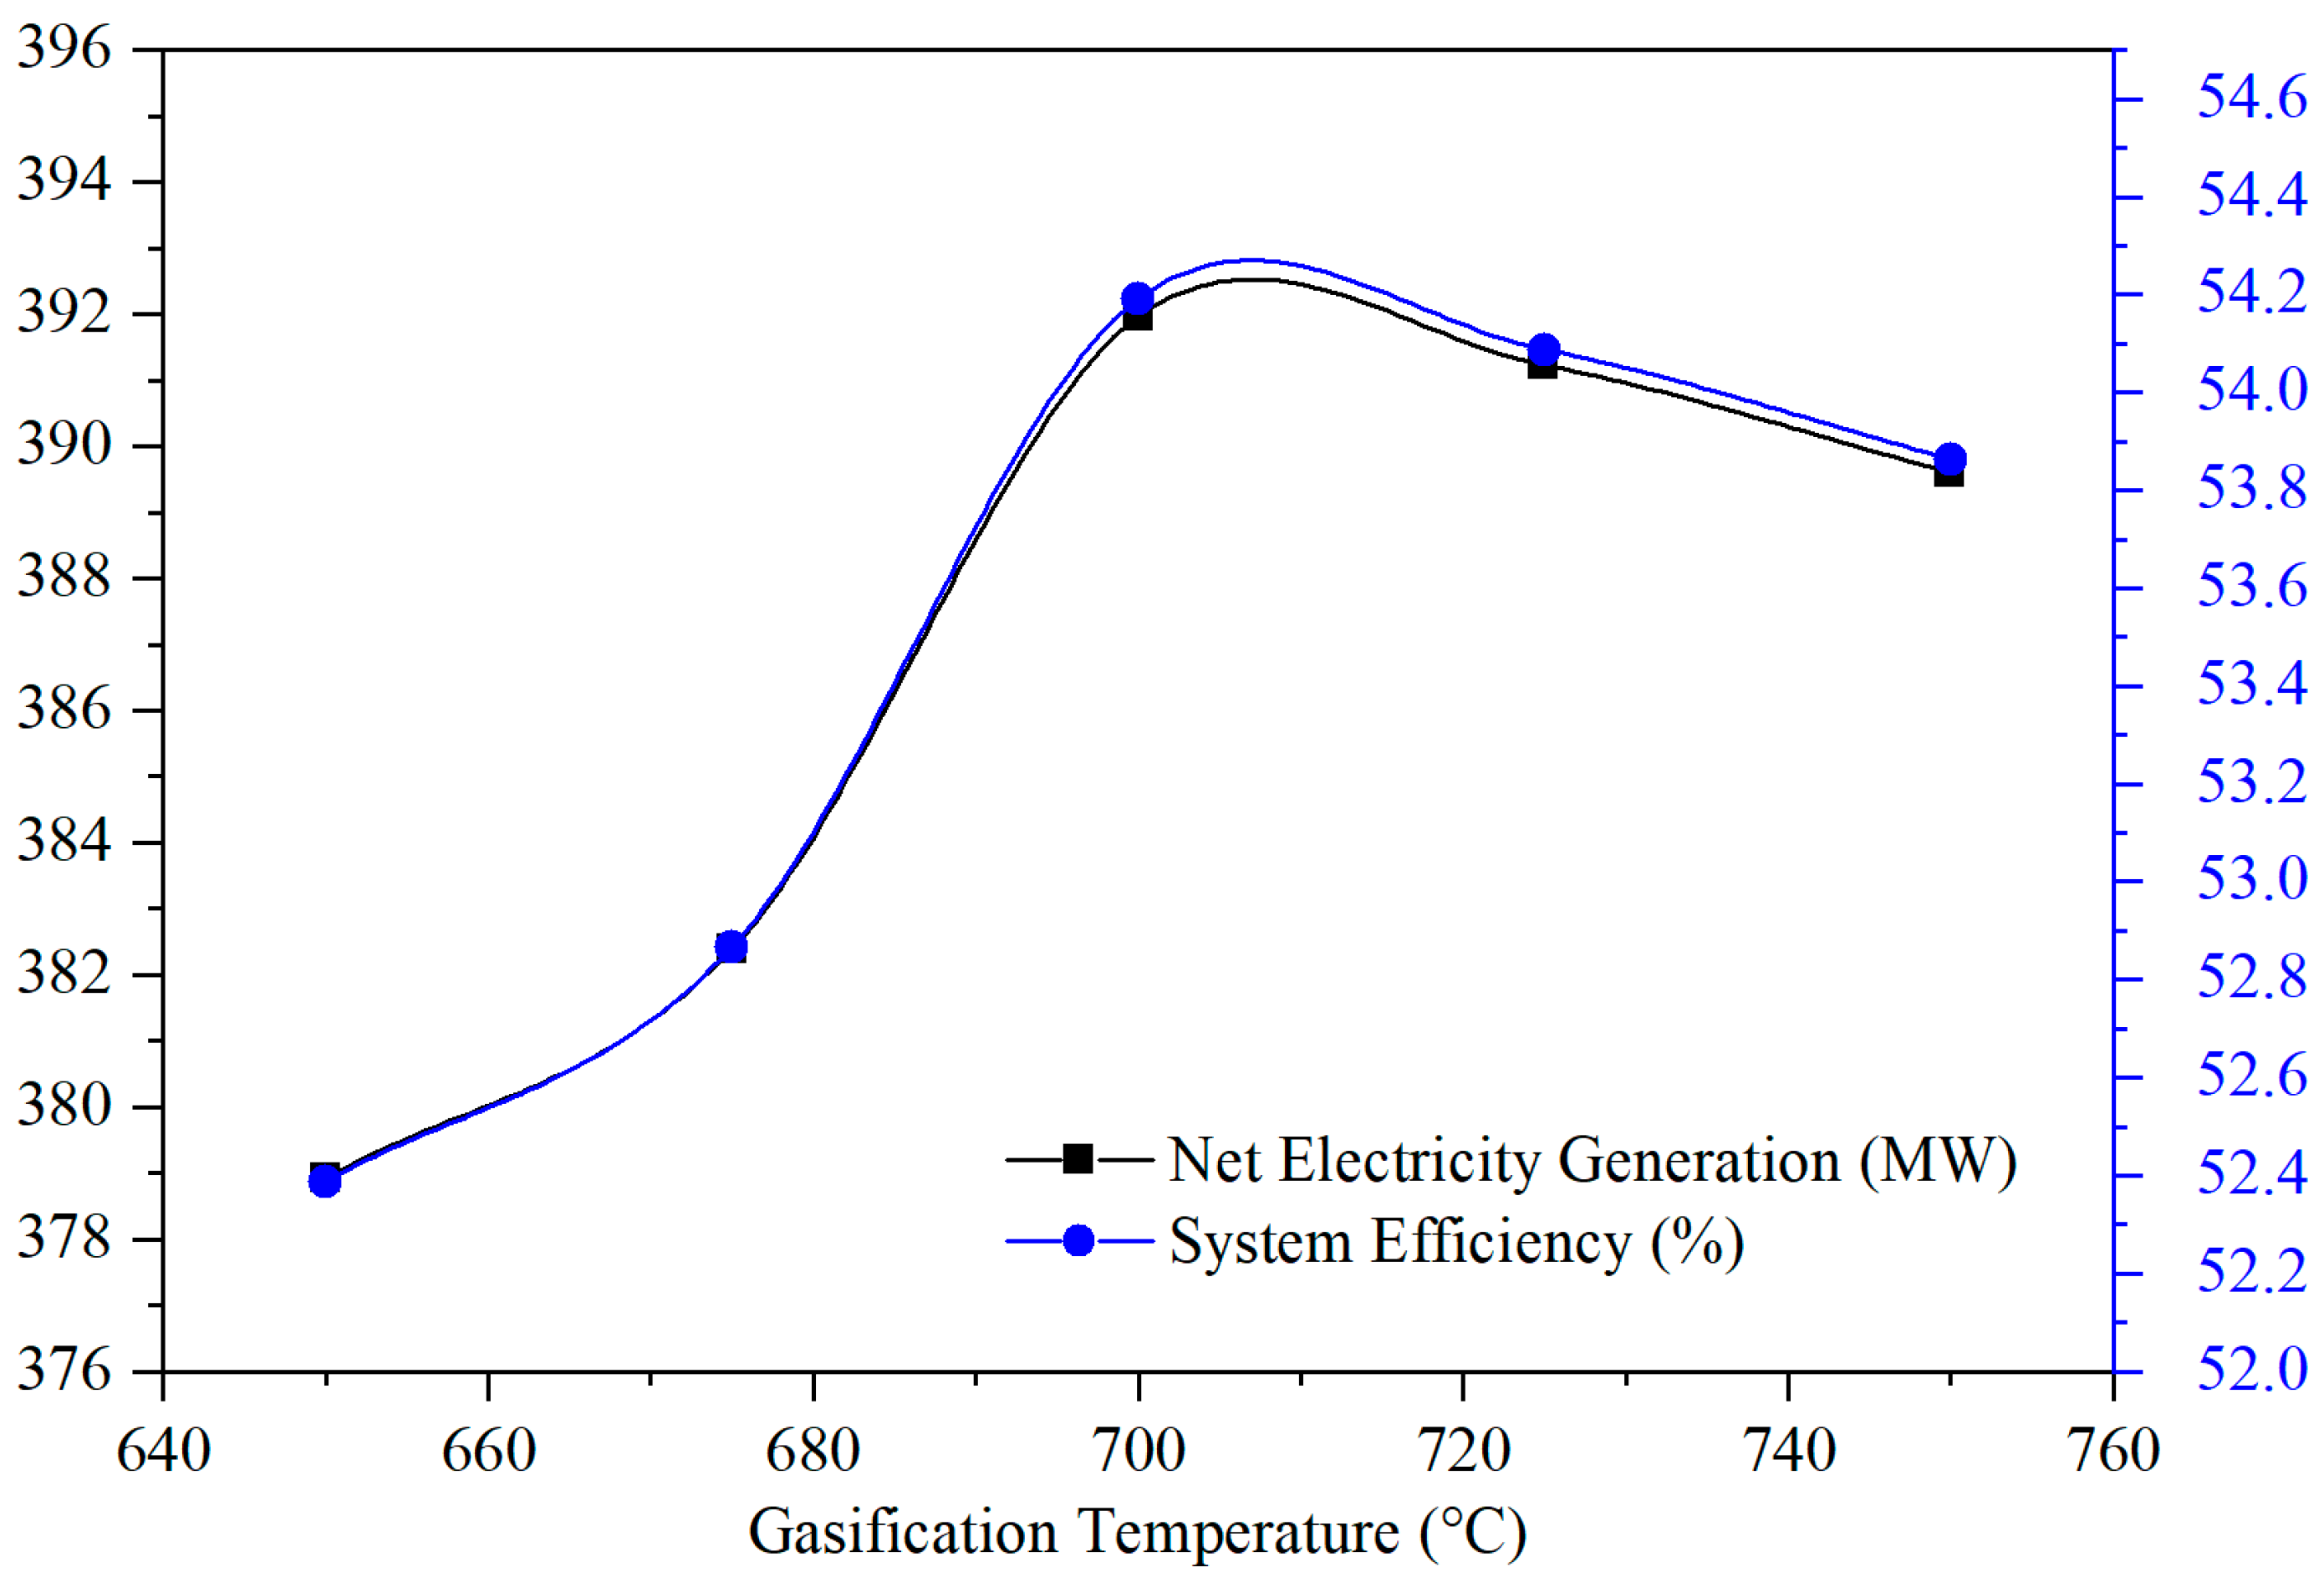
4.2. Effect of Gasifier Temperature on Hydrogen Yield and System Performance

The hydrogen production depends on gasifier temperature; Figure 5 shows that as the temperature rises from 650 to 750 °C, the hydrogen generation increases from 9594.1 to 10,970.6 kg/h, reflecting that the higher temperature is favorable for higher hydrogen yield. The key reason for increment in hydrogen yield is because of hydro-carbon reforming reactions (Equations (6) and (7)), methane reforming reaction (Equation (4)), and WGS reaction (Equation (5)) at elevated temperatures, resulting in a lower fraction of CO and CH4. The result matched the previous findings [57,58]. In addition, the high temperature promotes tar cracking and endothermic reaction, which is advantageous in producing more H2 [58,59]. High temperature also enables CO2 production due to enhancement of biomass pyrolysis and water gas shift reaction. The CaO effectively absorbs the CO2 produced (carbonation process (Equation (8)), which is enhanced by moving equilibrium of CaO carbonation towards forward direction, a function of temperature [53]. The system efficiency is increasing first and then decreasing, but the reduction in efficiency is not considerable. The reason is that with the increase in hydrogen production and separation by PSA, the remaining syngas quality decreases, resulting in decrease in the syngas heat output, which in turns produces less electricity by the combined cycle. The effect of temperature on calcium looping gasification limits hydrogen production; thus, it significantly affects the system efficiency.
Now we turn to the CLGCC system and analyze the effect of gasifier temperature on electricity generation. This situation is depicted in Figure 6, fairly reflecting an analogous behavior to that of the CLGCC–H system. One observes an increase in electricity generation as temperature increases for the temperature range 650–750 °C, reaching its maximum of 391.96 MWe corresponding to 700 °C. Beyond this point, a gradual decrease is witnessed, and eventually settles to 391 MWe at 750 °C. The underlying processes involves an increment in syngas quality with the inclusion of hydrogen content and hence an improved electricity generation vis-a-vis temperature. However, figuratively speaking, the corresponding values for electricity generation and system efficiency turn out to be low compared with the CLGCC–H system.

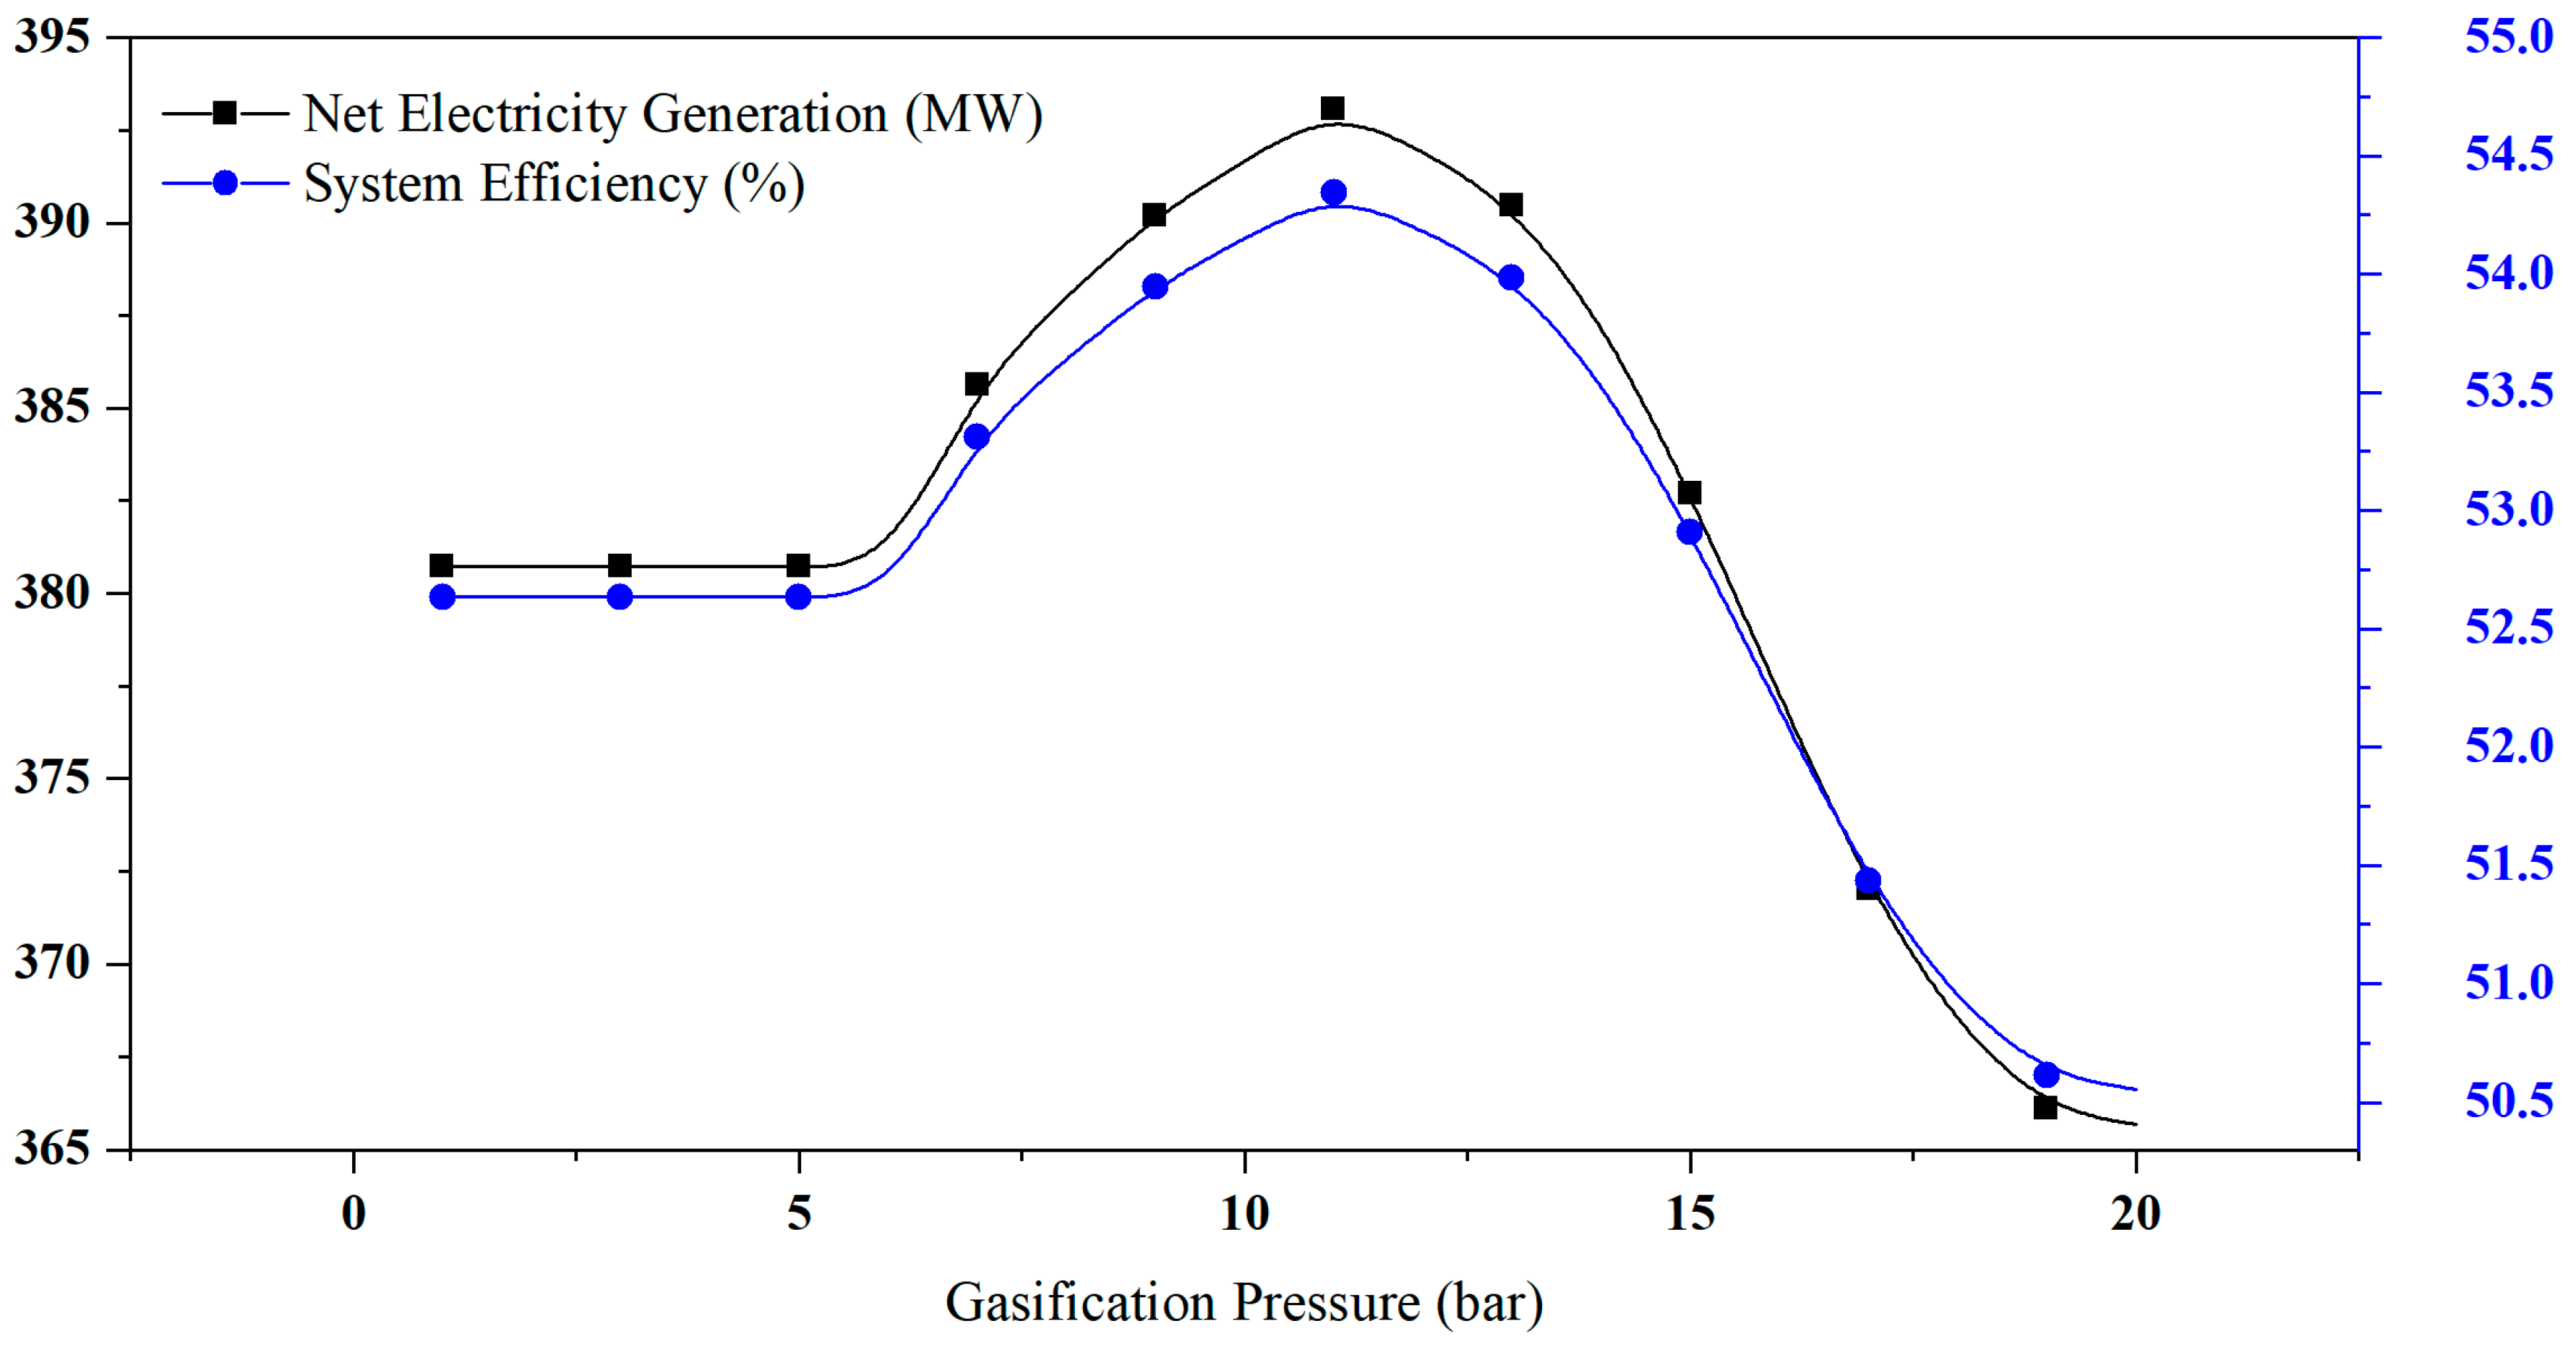
4.3. Effect of Gasifier Pressure on Hydrogen Yield and System Performance

Another critical variable in the CLG process is pressure. Pressurized CLG process has some advantages over traditional atmospheric CLG process, e.g., increase in the rate of char gasification [53,60], the power reduction for compressing syngas to high pressure before using a gas turbine [61], and improvement in heat and mass transfer in fluidized bed [62].
Figure 7 shows that from 1 to 6 bar pressure, the hydrogen yield and other product gases remain constant; however, after 6 bar pressure, the hydrogen yield increases first and then decreases. This trend is because from 1 to 6 bar pressure carbonation reaction (Equation (8)) cannot be realized at calculated temperature (700 °C), after 6 bar pressure, the CO2 absorption started and gradually increases with the increase of pressure. The partial pressure of CO2 decreases due to its adsorption, which promotes water gas shift reaction to convert CO and H2O in the gas phase to produce more H2 accordingly. Further, it is observed from Figure 7 that at approximately 12 bar pressure, the hydrogen yield achieved a maximum value of 11,082.1 kg/h. In addition, at higher pressure (above 12 bar), the steam methane reforming reaction started to work in a reverse direction to produce CH4 and H2O, which in turn caused reduction in hydrogen yield. After 25 bar pressure, the results of the current study cannot be observed, and no study found in the literature reported any results above this pressure. However, at high-pressure, the CH4 mole fraction in the gas phase increases with the favor of reverse steam methane reforming reaction (Equation (4)). Enhanced reverse reaction (Equation (4)) delivers more energy to maintain the gasifier temperature, increases carbon conversion and cold gas efficiency continuously under pressured conditions, and requires less char to be burned. The same aforementioned phenomena are also observed in the CLGCC system. Unlike the temperature case, the impact of gasifier pressure has a radically distinguished character for both electricity generation and system efficiency, depending upon whether one considers the CLGCC or CLGCC–H system. As shown in Figure 8, electricity generation shows an increment for the pressure range 6–12 bar, reaching its peak and eventually decreasing to its minimum of 365 MWe at 20 bar pressure. Compared to the CLGCC–H system, considerable increase is reported due to improved syngas quality. However, concerning system efficiency, one notes no considerable difference in terms of overall behavior, though the numbers differ. We can deduce from the results that gasification with high-pressure operation is a preferable alternative for energy conversion. Still, it may not be a suitable option for hydrogen production without providing costly and sophisticated downstream reformers. After a thorough assessment, it is concluded that the optimum pressure should be set between 12–20 bars.

4.4. System Energy Conversion Efficiency

The dual fluidized bed (CaO–CaCO3 recirculation) is a crucial part of calcium looping gasification for hydrogen and electricity production. For calcination and carbonation, it is necessary to operate the gasifier and combustor at appropriate temperature and pressure to fulfil thermodynamic effectiveness. The gasifier temperature is controlled at 700 °C and the combustor at 1000 °C for 12 bar operating pressure. The experiments set the steam/C ratio and CaO/C ratio as 2 and 1 for optimized hydrogen yield [53,63]. The biomass treatment capacity of the CLGCC–H and the CLGCC power plant is 131.16 t/h. Table 5 compares the thermodynamic performance of the CLGCC–H and CLGCC power plants. In the CLGCC–H system, clean syngas from selexol is fed to PSA for hydrogen separation, which separates 10,284.57 kg/h of hydrogen. After hydrogen separation, the remaining syngas is combusted in GT to produce electrical power. In addition, the waste heat from different parts of the plant and flue gases produced by the GT enters into the HRSG to produce steam for power generation through the Rankine cycle. The CLGCC–H plant can realize the coproduction of hydrogen energy of 342.54 MW and the electricity of 147.55 MWe. The system energy and exergy efficiency of the CLGCC–H system can reach 64.75% and 60.79%, which is 10.56% and 9.57% higher than the CLGCC system. From the perspective of power generation of the CLGCC system, the output of GT is 317.76 MWe, and the ST the total power generation is 95.17 MWe, with a net power output of 391.96 MWe.

4.5. Economic Analyses

This section reports an economic analysis of the CLGCC–H system and compares it against the CLGCC system. Before the economic analysis, the baseline data for each part are presented in Table 4 and Table 6, which present the assumptions for total production cost. In addition, Table 7 shows the baseline economic data, the economic comparison of the CLGCC–H and the CLGCC systems is carried out, as shown in Table 8.
Table 8 shows that the FCI of the CLGCC–H system is approximately USD 689.66 million, and the FCI of the CLGCC is USD 770.99 million, which is about USD 81.32 million higher than that of the CLGCC–H system. This is due to the higher investment in power island and heat recovery during electricity production. Low investment is required for the CLGCC–H system power island, as most of the hydrogen from H2-rich syngas is separated through PSA for the downstream process (i.e., fuel cell, transport fuel, or oil upgradation) and less syngas is available for electricity production. According to the economic calculations, the production cost of H2 is calculated to be 2.37 USD/kg; with this hydrogen price the IRR of the CLGCC–H system with dual products (hydrogen and electricity) reaches 17.43%, while that of the CLGCC system is only 11.45%. The CLGCC–H system payback period is 7.35 years, which is 2.64 years less than the CLGCC system. Owing to high IRR and short payback period, the CLGCC–H system is deemed to be promising.

4.6. Sensitivity Analysis

The IRR is a cost analysis method for determining the profitability of a process. The IRR is a discount rate that makes the H2 processing plant’s net present value (NPV) zero. This might bring the plant’s cash input and outflow into balance: the higher the IRR discount rate, the lower the NPV and longer the payback period. The plant will be more successful if the IRR discount rate is lower, the NPV is larger, and the payback period is shorter [64]. Sensitivity to IRR is an important factor in determining the annual growth rate of plant investment, and it emphasizes the payback period.
Referring to the economic sensitivity analysis of the power plants with CCS [4,47], a sensitivity analysis was performed by varying main economic parameters leads, e.g., biomass price, electricity price, hydrogen price yearly running hours, and capital expenditure (fixed capital cost). The economic parameters are identified by variation from −50% to 50%.
Figure 9 shows the economic sensitivity of the CLGCC–H. It is observed that the IRR increases up to 25.14% corresponding to the 50% increase in hydrogen price. On the other hand, the IRR decreases 8.87% when the hydrogen price decreases by 50%. Similarly, the IRR can increase up to 23.83% when the fixed capital cost decreases to 50%. Apparently, the IRR is sensitive to the variation of hydrogen selling price and fixed capital investment. The other parameters such as biomass price and electricity price have a sensitivity effect on the IRR, but the degree of sensitivity is unlike the hydrogen selling price and fixed capital cost.
Similarly, Figure 10 shows the sensitivity analysis for the CLGCC system. The main product of the CLGCC system is only electricity, so the IRR increases up to 18.98% when the electricity selling price increases by 50%. In contrast, it could be down to 2.29%, while the price of electricity decreases to 50%. Similarly, the IRR can increase up to 19.85%, corresponding to a 50% decrease in fixed capital cost. The hydrogen selling price has no effect at all on the IRR with ±50% variation in hydrogen selling price. The IRR is slightly affected by the variation in biomass price.
From Figure 9 and Figure 10, it can be observed that the yearly running time has a significant effect on the IRR. It could be down to 14.63% and 6.21% for the CLGCC–H and CLGCC, as the yearly running time decreases to 50%. Figure 11 shows sensitivity analysis over the plant life (15 to 30 years). The IRR decreases to 15.49% and 8.54% for the CLGCC–H and CLGCC corresponding to 15 years decrease in the plant life.

4.7. Uncertainty Sources of Sensitivity Analysis

According to Cristóbal et al. [65], the following uncertainty sources must be addressed for sensitivity analysis: method of cost calculation, revenue, utility cost, process variables, feedstock price, and transportation. Among the different causes of uncertainty in sensitivity analysis, the method for low TRL technologies cost estimating shows a ±50% deviation, as a result of failures in inflation projection or cost growth. It is due to a highly complex process’s unexpected events and technology that have yet to be verified. The proposed project’s revenue is primarily determined by the end product’s composition, quality, quantity, and selling price, which are determined by its demand in the global market. The cost of utilities varies depending on the process type. Typically, hydrogen, electricity, and feedstock prices are considered basic factors that might fluctuate due to various circumstances, including environmental safety concerns, unpredictable weather conditions, geopolitical situations, and government taxes. In general, the results of laboratory experiments are utilized to scale up processes to obtain the same efficiency. However, in other circumstances, the process variable costs are dependent on the size of scale-up plants, which has an indirect impact on revenue. The process profitability is also determined by the amount of transportation and feedstock availability.

5. Conclusions

In summary, we proposed and carried out an in-depth techno-economic analysis of a novel energy conversion system that is based on calcium looping gasification of biomass for hydrogen and electricity production. The CLGCC–H system is investigated by employing process simulation using Aspen Plus simulation and compared to that of the CLGCC. A comprehensive comparison of the thermodynamic and economic performance of the CLGCC–H and the CLGCC systems is conducted.
We explicitly demonstrated, based on a thermodynamic and economic analyses, that CLGCC–H’s system energy and exergy efficiency is higher than that of the CLGCC system. Concerning system energy, the CLGCC–H system’s peak system energy stood at 64.75%, which is approximately 10.56% higher than the CLGCC system. Moreover, the exergy efficiency of the CLGCC–H system attains its peak at around 60.79%, which is roughly 9.57% higher than the CLGCC system. For economic analysis of the CLGCC–H system, the IRR was reported at 17.43% with a payback period of 7.35 years, while the same for the CLGCC system are 11.45% and 9.99 years, respectively. Based on these thermodynamic and economic analyses outcomes, we conclude that the CLGCC–H could potentially hold a great market value.

Author Contributions

Conceptualization, Q.W. and A.R.S.; methodology, A.R.S.; software, A.R.S.; validation, A.R.S., Y.F. and Z.L.; formal analysis, Z.S.; investigation, J.C.; resources, Q.W.; data curation, S.K.; writing—original draft preparation, A.R.S.; writing—review and editing, L.H.; visualization, Z.S.; supervision, Q.W.; project administration, Q.W.; funding acquisition, Q.W. All authors have read and agreed to the published version of the manuscript.

Funding

We would like to express our gratitude for the financial assistance provided by China’s National Key R&D Program (2019YFE100100-05).

Institutional Review Board Statement

Not applicable.

Informed Consent Statement

Not applicable.

Conflicts of Interest

The authors declare no conflict of interest.

Abbreviations

CLGCC−HCalcium looping gasification with the combined cycle, for hydrogen
CLGCCCalcium looping gasification with the combined cycle
IGCCIntegrated gasification with combined cycle
DFBDual fluidized bed
IRRInternal rate of return
CCSCarbon capture and storage
CLRChemical looping reform
ATRAutothermal reform
SMRSteam methane reform
CLCChemical looping combustion
OCOxygen carrier
ASUAir separation unit
HRSGHeat recovery steam generator
GT and STGas turbine and steam turbine
PSAPressure swing absorption
FCIFixed capital investment
CEPCIChemical engineering plant cost index
NPVNet present value.

Nomenclature

ɳ and ƐSystem efficiency and exergy
E net Net power generation (MW)
E ST Power generation of steam turbines (MW)
E GT Power generation of gas turbines (MW)
E AUX Power consumption of auxiliary equipment (MW)
LHV biomass Lower calorific value of biomass (MW)
FCIFixed capital investment (106 USD)
SiProduction capacity index
CtCash flows of the year t (106 USD)
CRFAverage annual investment ratio
OAMAnnual operation and management cost ratio
CpAnnual income of products (106 USD)
CMMaterial cost (106 USD)
CFFuel cost (106 USD)

References

  1. Yan, Y.; Manovic, V.; Anthony, E.J.; Clough, P.T. Techno-economic analysis of low-carbon hydrogen production by sorption enhanced steam methane reforming (SE-SMR) processes. Energy Convers. Manag. 2020, 226, 113530. [Google Scholar] [CrossRef]
  2. Yan, Y.; Thanganadar, D.; Clough, P.T.; Mukherjee, S.; Patchigolla, K.; Manovic, V.; Anthony, E.J. Process simulations of blue hydrogen production by upgraded sorption enhanced steam methane reforming (SE-SMR) processes. Energy Convers. Manag. 2020, 222, 113144. [Google Scholar] [CrossRef]
  3. IEA. The Future of Hydrogen, IEA, Paris. 2019. Available online: https://www.iea.org/reports/the-future-of-hydrogen (accessed on 10 July 2021).
  4. Esmaili, E.; Mostafavi, E.; Mahinpey, N. Economic assessment of integrated coal gasification combined cycle with sorbent CO2 capture. Appl. Energy 2016, 169, 341–352. [Google Scholar] [CrossRef]
  5. Sara, H.R.; Enrico, B.; Mauro, V.; Andrea, D.C.; Vincenzo, N. Techno-Economic Analysis of Hydrogen Production Using Biomass Gasification—A Small Scale Power Plant Study. In Energy Procedia; Elsevier Ltd.: Amsterdam, The Netherlands, 2016; pp. 806–813. [Google Scholar] [CrossRef]
  6. Hanley, E.S.; Deane, J.P.; Gallachóir, B.P.Ó. The role of hydrogen in low carbon energy futures—A review of existing perspectives. Renew. Sustain. Energy Rev. 2018, 82, 3027–3045. [Google Scholar] [CrossRef]
  7. Yukesh Kannah, R.; Kavitha, S.; Preethi; Parthiba Karthikeyan, O.; Kumar, G.; Dai-Viet, N.V.; Rajesh Banu, J. Techno-economic assessment of various hydrogen production methods—A review. Bioresour. Technol. 2021, 319, 124175. [Google Scholar] [CrossRef]
  8. Capros, P.; Zazias, G.; Evangelopoulou, S.; Kannavou, M.; Fotiou, T.; Siskos, P.; De Vita, A.; Sakellaris, K. Energy-system modelling of the EU strategy towards climate-neutrality. Energy Policy 2019, 134, 110960. [Google Scholar] [CrossRef]
  9. Hosseini, S.E.; Wahid, M.A. Hydrogen production from renewable and sustainable energy resources: Promising green energy carrier for clean development. Renew. Sustain. Energy Rev. 2016, 57, 850–866. [Google Scholar] [CrossRef]
  10. Li, X.Y.; Tang, B.J. Incorporating the transport sector into carbon emission trading scheme: An overview and outlook. Nat. Hazards 2017, 88, 683–698. [Google Scholar] [CrossRef]
  11. Lepage, T.; Kammoun, M.; Schmetz, Q.; Richel, A. Biomass-to-hydrogen: A review of main routes production, processes evaluation and techno-economical assessment. Biomass Bioenergy 2021, 144, 105920. [Google Scholar] [CrossRef]
  12. Bourne, S. The future of fuel: The future of hydrogen. Fuel Cells Bull. 2012, 2012, 12–15. [Google Scholar] [CrossRef]
  13. Nazir, S.M.; Cloete, J.H.; Cloete, S.; Amini, S. Pathways to low-cost clean hydrogen production with gas switching reforming. Int. J. Hydrog. Energy 2020, 46, 20142–20158. [Google Scholar] [CrossRef]
  14. Spallina, V.; Pandolfo, D.; Battistella, A.; Romano, M.C.; Van Sint Annaland, M.; Gallucci, F. Techno-economic assessment of membrane assisted fluidized bed reactors for pure H2 production with CO2 capture. Energy Convers. Manag. 2016, 120, 257–273. [Google Scholar] [CrossRef]
  15. Spallina, V.; Shams, A.; Battistella, A.; Gallucci, F.; Annaland, M.V.S. Chemical Looping Technologies for H2 Production with CO2 Capture: Thermodynamic Assessment and Economic Comparison. In Energy Procedia; Elsevier Ltd.: Amsterdam, The Netherlands, 2017; pp. 419–428. [Google Scholar] [CrossRef]
  16. Khojasteh Salkuyeh, Y.; Saville, B.A.; MacLean, H.L. Techno-economic analysis and life cycle assessment of hydrogen production from natural gas using current and emerging technologies. Int. J. Hydrog. Energy 2017, 42, 18894–18909. [Google Scholar] [CrossRef]
  17. Hafizi, A.; Rahimpour, M.R.; Hassanajili, S. Hydrogen production via chemical looping steam methane reforming process: Effect of cerium and calcium promoters on the performance of Fe2O3/Al2O3 oxygen carrier. Appl. Energy 2016, 165, 685–694. [Google Scholar] [CrossRef]
  18. Kathe, M.V.; Empfield, A.; Na, J.; Blair, E.; Fan, L.S. Hydrogen production from natural gas using an iron-based chemical looping technology: Thermodynamic simulations and process system analysis. Appl. Energy 2016, 165, 183–201. [Google Scholar] [CrossRef]
  19. Adiya, Z.I.S.G.; Dupont, V.; Mahmud, T. Steam reforming of shale gas in a packed bed reactor with and without chemical looping using nickel based oxygen carrier. Int. J. Hydrog. Energy 2018, 43, 6904–6917. [Google Scholar] [CrossRef]
  20. Adiya, Z.I.S.G.; Dupont, V.; Mahmud, T. Steam reforming of shale gas with nickel and calcium looping. Fuel 2019, 237, 142–151. [Google Scholar] [CrossRef]
  21. Chisalita, D.A.; Cormos, C.C. Techno-economic assessment of hydrogen production processes based on various natural gas chemical looping systems with carbon capture. Energy 2019, 181, 331–344. [Google Scholar] [CrossRef]
  22. Saithong, N.; Authayanun, S.; Patcharavorachot, Y.; Arpornwichanop, A. Thermodynamic analysis of the novel chemical looping process for two-grade hydrogen production with CO2 capture. Energy Convers. Manag. 2019, 180, 325–337. [Google Scholar] [CrossRef]
  23. Udomsirichakorn, J.; Salam, P.A. Review of hydrogen-enriched gas production from steam gasification of biomass: The prospect of CaO-based chemical looping gasification. Renew. Sustain. Energy Rev. 2014, 30, 565–579. [Google Scholar] [CrossRef]
  24. Ii, T.A.A.; Barton, P.I. Combining coal gasification and natural gas reforming for efficient polygeneration. Fuel Process. Technol. 2010, 92, 639–655. [Google Scholar] [CrossRef]
  25. Ahmed, U.; Kim, C.; Zahid, U.; Lee, C.-J.; Han, C. Integration of IGCC and methane reforming process for power generation with CO2 capture. Chem. Eng. Process Process Intensif. 2016, 111, 14–24. [Google Scholar] [CrossRef]
  26. Ahmed, U.; Zahid, U.; Lee, Y. Process simulation and integration of IGCC systems for H2 /syngas/electricity generation with control on CO2 emissions. Int. J. Hydrog. Energy 2019, 44, 7137–7148. [Google Scholar] [CrossRef]
  27. Cormos, C.C. Economic evaluations of coal-based combustion and gasification power plants with post-combustion CO2 capture using calcium looping cycle. Energy 2014, 78, 665–673. [Google Scholar] [CrossRef]
  28. Cormos, C.C. Biomass direct chemical looping for hydrogen and power co-production: Process configuration, simulation, thermal integration and techno-economic assessment. Fuel Process. Technol. 2015, 137, 16–23. [Google Scholar] [CrossRef]
  29. Jiang, P.; Berrouk, A.S.; Dara, S. Biomass Gasification Integrated with Chemical Looping System for Hydrogen and Power. Coproduction Process—Thermodynamic and Techno-Economic Assessment. Chem. Eng. Technol. 2019, 42, 1153–1168. [Google Scholar] [CrossRef]
  30. Aneke, M.; Wang, M. Potential for improving the energy efficiency of cryogenic air separation unit (ASU) using binary heat recovery cycles. Appl. Therm. Eng. 2015, 81, 223–231. [Google Scholar] [CrossRef]
  31. Koytsoumpa, E.I.; Atsonios, K.; Panopoulos, K.D.; Karellas, S.; Kakaras, E.; Karl, J. Modelling and assessment of acid gas removal processes in coal-derived SNG production. Appl. Therm. Eng. 2015, 74, 128–135. [Google Scholar] [CrossRef]
  32. Sun, L.; Smith, R. Rectisol wash process simulation and analysis. J. Clean. Prod. 2012, 39, 321–328. [Google Scholar] [CrossRef]
  33. Li, G.; Liu, Z.; Liu, F.; Weng, Y.; Ma, S.; Zhang, Y. Thermodynamic analysis and techno-economic assessment of synthetic natural gas production via ash agglomerating fluidized bed gasification using coal as fuel. Int. J. Hydrog. Energy 2020, 45, 27359–27368. [Google Scholar] [CrossRef]
  34. Li, K.; Wang, Q.; Fang, M.; Shaikh, A.R.; Xie, G.; Luo, Z. Techno-economic analysis of coal staged conversion polygeneration system for power and chemicals production. Chem. Eng. Technol. 2018, 42, 73–88. [Google Scholar] [CrossRef] [Green Version]
  35. Piéplu, A.; Saur, O.; Lavalley, J.-C.; Legendre, O.; Nédez, C. Claus Catalysis and H2S Selective Oxidation. Catal. Rev. Sci. Eng. 1998, 40, 409–450. [Google Scholar] [CrossRef]
  36. Eow, J.S. Recovery of sulfur from sour acid gas: A review of the technology. Environ. Prog. 2002, 21, 143–162. [Google Scholar] [CrossRef]
  37. Riboldi, L.; Bolland, O. Evaluating Pressure Swing Adsorption as a CO2 separation technique in coal-fired power plants. Int. J. Greenh. Gas Control. 2015, 39, 1–16. [Google Scholar] [CrossRef] [Green Version]
  38. Chen, Z.S.; Wang, L.Q. Energy and exergy analysis of gas production from biomass intermittent gasification. J. Renew. Sustain. Energy 2013, 5, 063141. [Google Scholar] [CrossRef]
  39. Seyitoglu, S.S.; Dincer, I.; Kilicarslan, A. Assessment of an IGCC based trigeneration system for power, hydrogen and synthesis fuel production. Int. J. Hydrog. Energy 2016, 41, 8168–8175. [Google Scholar] [CrossRef]
  40. Sweny, J.W. Synthetic Fuel Gas Purification by the SELEXOL Process. In Proceedings of the 65. Meeting of the American Chemical Society; Dallas, TX, USA, 8 April 1973. Available online: https://www.osti.gov/biblio/7346050 (accessed on 10 July 2021).
  41. Green, D.W.; Perry, R.H. Perry’s Chemical Engineers’ Handbook, 8th ed.; McGraw-Hill Book Company: New York, NY, USA, 2008. [Google Scholar]
  42. CEPCI August 2020. Available online: https://www.scribd.com/document/488333013/CEPCI-august-2020 (accessed on 16 July 2021).
  43. Cormos, A.M.; Cormos, C.C. Techno-economic assessment of combined hydrogen & power co-generation with carbon capture: The case of coal gasification. Appl. Therm. Eng. 2019, 147, 29–39. [Google Scholar] [CrossRef]
  44. Guo, Z.; Wang, Q.; Fang, M.; Luo, Z.; Cen, K. Thermodynamic and economic analysis of polygeneration system integrating atmospheric pressure coal pyrolysis technology with circulating fluidized bed power plant. Appl. Energy 2014, 113, 1301–1314. [Google Scholar] [CrossRef]
  45. Park, C.S. Contemporary Engineering Economics, 6th ed.; Pearson Education: London, UK, 2015. [Google Scholar]
  46. Ye, C.; Wang, Q.; Zheng, Y.; Li, G.; Zhang, Z.; Luo, Z. Techno-economic analysis of methanol and electricity poly-generation system based on coal partial gasification. Energy 2019, 185, 624–632. [Google Scholar] [CrossRef]
  47. Shi, B.; Xu, W.; Wu, W.; Kuo, P.-C. Techno-economic analysis of oxy-fuel IGCC power plants using integrated intermittent chemical looping air separation. Energy Convers. Manag. 2019, 195, 290–301. [Google Scholar] [CrossRef]
  48. Turton, R. Analysis, Synthesis, and Design of Chemical Processes, 4th ed.; Prentice Hall: Hoboken, NJ, USA, 2013. [Google Scholar]
  49. Towler, G.; Sinnott, R.K. Chemical Engineering Design—Principles, Practice and Economics of Plant and Process Design, 2nd ed.; Butterworth-Heinemann: Oxford, UK, 2013. [Google Scholar]
  50. Ulrich, G.D. A Guide to Chemical Engineering Process Design and Economics; John Wiley Sons: Hoboken, NJ, USA, 1984. [Google Scholar]
  51. Fout, T.; Zoelle, A.; Keairns, D.; Turner, M.; Woods, M.; Kuehn, N.; Shah, V.; Chou, V.; Pinkerton, L. Cost and Performance Baseline for Fossil Energy Plants; National Energy Technology Laboratory: Pittsburgh, PA, USA; Morgantown, WV, USA, 2015. [Google Scholar]
  52. Exchange Rates. US Dollar to Chinese Yuan Spot Exchange Rates for 2019. Available online: https://www.exchangerates.org.uk/USD-CNY-spot-exchange-rates-history-2019.html (accessed on 16 July 2021).
  53. Han, L.; Wang, Q.; Luo, Z.; Rong, N.; Deng, G. H2 rich gas production via pressurized fluidized bed gasification of sawdust with in situ CO2 capture. Appl. Energy. 2013, 109, 36–43. [Google Scholar] [CrossRef]
  54. Müller, S.; Fuchs, J.; Schmid, J.C.; Benedikt, F.; Hofbauer, H. Experimental development of sorption enhanced reforming by the use of an advanced gasification test plant. Int. J. Hydrog. Energy 2017, 42, 29694–29707. [Google Scholar] [CrossRef]
  55. Udomsirichakorn, J.; Basu, P.; Abdul Salam, P.; Acharya, B. CaO-based chemical looping gasification of biomass for hydrogen-enriched gas production with in situ CO2 capture and tar reduction. Fuel Process. Technol. 2014, 127, 7–12. [Google Scholar] [CrossRef]
  56. Pfeifer, C.; Puchner, B.; Hofbauer, H. Comparison of dual fluidized bed steam gasification of biomass with and without selective transport of CO2. Chem. Eng. Sci. 2009, 64, 5073–5083. [Google Scholar] [CrossRef]
  57. Hanaoka, T.; Yoshida, T.; Fujimoto, S.; Kamei, K.; Harada, M.; Suzuki, Y.; Hatano, H.; Yokoyama, S.Y.; Minowa, T. Hydrogen production from woody biomass by steam gasification using a CO2 sorbent. Biomass Bioenergy 2005, 28, 63–68. [Google Scholar] [CrossRef]
  58. Han, L.; Wang, Q.; Yang, Y.; Yu, C.; Fang, M.; Luo, Z. Hydrogen production via CaO sorption enhanced anaerobic gasification of sawdust in a bubbling fluidized bed. Int. J. Hydrog. Energy 2011, 36, 4820–4829. [Google Scholar] [CrossRef]
  59. Han, L.; Zhang, Y.; Lin, K.; Jia, X.; Zhang, H.; Zhong, Y.; Wang, Q.; Li, Z. Developing a Novel CaO-Based Sorbent for Promoted CO2 Capture and Tar Reduction. Energy Fuels 2017, 31, 5306–5317. [Google Scholar] [CrossRef]
  60. Matsuoka, K.; Kajiwara, D.; Kuramoto, K.; Sharma, A.; Suzuki, Y. Factors affecting steam gasification rate of low rank coal char in a pressurized fluidized bed. Fuel Process. Technol. 2009, 90, 895–900. [Google Scholar] [CrossRef]
  61. Rauch, R.; Hrbek, J.; Hofbauer, H. Biomass gasification for synthesis gas production and applications of the syngas. Wires Rev. Energy Environ. 2014, 3, 343–362. [Google Scholar] [CrossRef]
  62. Shangyi, Y.; Baosheng, J.; Wenqi, Z.; Yong, L.; Yingjuan, S.; Hao, L. Experimental research of gas-solid flow behaviors in pressurized circulating fluidized bed—I: Solid holdup distribution. J. Southeast Univ. 2012, 42, 308–312. [Google Scholar]
  63. Wang, Q.; Rong, N.; Fan, H.; Meng, Y.; Fang, M.; Cheng, L.; Cen, K. Enhanced hydrogen-rich gas production from steam gasification of coal in a pressurized fluidized bed with CaO as a CO 2 sorbent. Int. J. Hydrog. Energy 2014, 39, 5781–5792. [Google Scholar] [CrossRef]
  64. Han, W.; Fang, J.; Liu, Z.; Tang, J. Techno-economic evaluation of a combined bioprocess for fermentative hydrogen production from food waste. Bioresour. Technol. 2016, 202, 107–112. [Google Scholar] [CrossRef] [PubMed]
  65. Cristóbal, J.; Caldeira, C.; Corrado, S.; Sala, S. Techno-economic and profitability analysis of food waste biorefineries at European level. Bioresour. Technol. 2018, 259, 244–252. [Google Scholar] [CrossRef] [PubMed]
Figure 1. The calcium looping gasification with the combined cycle for hydrogen and electricity generation (CLGCC–H).
Sustainability 14 02189 g001
Figure 2. The calcium looping gasification with the combined cycle for electricity generation (CLGCC).
Sustainability 14 02189 g002
Figure 3. The flowsheet of the calcium looping gasification with the combined cycle for hydrogen and electricity generation (CLGCC–H).
Sustainability 14 02189 g003
Figure 4. Basic concept of calcium looping gasification with CaO as bed material.
Sustainability 14 02189 g004
Figure 5. The effect of gasifier temperature on hydrogen yield, net electricity generation, and system performance for CLGCC–H system.
Sustainability 14 02189 g005
Figure 6. The effect of gasifier temperature on net electricity generation and system performance for CLGCC system.
Sustainability 14 02189 g006
Figure 7. The effect of gasifier pressure on hydrogen yield, net electricity generation, and system performance for CLGCC–H system.
Sustainability 14 02189 g007
Figure 8. The effect of gasifier pressure on net electricity generation, and system performance for CLGCC system.
Sustainability 14 02189 g008
Figure 9. Influence of product price on IRR for the CLGCC–H.
Sustainability 14 02189 g009
Figure 10. Influence of product price on IRR for the CLGCC.
Sustainability 14 02189 g010
Figure 11. Influence of plant life on IRR for CLGCC–H and CLGCC.
Sustainability 14 02189 g011
Table 1. Design assumption for CLGCC and CLGCC–H.
Unit/Component/SystemModeling UnitParameters
Gasification ReactorRYield, RGibbs (Reactor)Biomass flow rate = 131.16 ton/h
Temperature: 700 °C
Pressure: 12 bar
Combustor ReactorRGibbs (Reactor)Temperature: 1000 °C
Pressure: 12 bar
Air Separation Unit (ASU) HeatX, Compr O2 = 94.5% (vol)
Power consumption: 235 kW/t
H2S removal Section RadFrac Selexol solvent
H2S removal ~99.9%
Absorber and regeneration stages: 12 each with thermal regeneration.
PSASep2Hydrogen separation ~99.99%
Power consumption: 5.63 kW/ft3/m
Pump Efficiency Pump85%
Compressor EfficiencyCompr82%
Steam Turbine Eff (Isentropic)Compr87.50%
Gas Turbine Eff (Adiabatic)ComprTIT (Turbine inlet temp) = ~1550 °C
TOT (Turbine outlet temp) = ~570 °C
Adiabatic efficiency = 85%
HRSGHeatX, Compr 124/40/20/0.069 (bars)
ΔTmin = 10 °C
Table 2. Chemical analyses of pine sawdust.
Pine Sawdust
Ultimate analysisC52.53
H6.08
O39.04
N0.09
S0.55
A1.70
Proximate analysisV85.15
FC13.15
A1.70
LHV (kJ/kg)19,853
Moisture2.07
Table 3. Specific parameters for combined cycle (GT and ST).
FacilityParameterUnitValue
Air CompressorOutlet Pressurebar21.2
GTInlet Temperature °C1550
Outlet Temperature°C570
Steam TurbineInlet Temperature of HP°C520
Inlet Pressure of HPbar124
Reheating Temperature °C520
Reheating Pressurebar40
Inlet Temperature of IP °C373.55
Inlet Pressure of IPbar20
Outlet Pressure of LP bar0.069
PumpOutlet Pressurebar124
Table 4. Plant equipment primary capital cost data.
ComponentsBasic Cost (106 USD in 2019) *Basic ScaleScale FactorInstallation FactorReference
Biomass preparation (kg s−1)21.1123.150.71[47]
Gasifier (dual fluidized bed) biomass input (MW)559.271198.030.61[28]
ASU (O2 kg s−1)134.9353.360.61[47]
Selexol (t d−1 sulfur input)46.91810.71[34]
Claus/SCOT (t d−1 sulfur input)32.51810.71[34]
H2 PSA (kmol H2 h−1)17.7916,6160.652.56[44]
Heat exchanger (MWth)13.341380.65[48,49,50]
Power island
Gas turbine (net MW)118.362760.751[44]
Steam turbine and cycle (gross MW)57.542750.672[48,49,50]
CO2 compression unit (m3 h−1)76.76430,850.770.671[51]
* 1 USD = 6.91 RMB on average exchange rate in 2019 [52].
Table 5. Thermodynamic comparisons of CLGCC and CLGCC–H with biomass and coal.
FacilityParameterCLGCC–HCLGCC
Fuel input
Input pulverized biomass (kg/s) 36.4336.43
LHV (MJ/kg)19.8519.85
Thermal input (MW)723.31723.31
Gasifier
Outlet pressure (bar) 12.0012.00
Outlet temperature (°C) 700.00700.00
Steam (kg/s) 26.2526.25
Syngas mass flow (kg/s)23.2123.21
Syngas LHV (MJ/kg)24.2624.26
Thermal output (MW)562.98562.98
Combustor
Outlet pressure (bar) 1212
Outlet temperature (°C) 10001000
Oxygen mass flow (kg/s) 14.9114.91
CO2-rich mass flow (kg/s)53.7953.79
Scrubber column
Pressure syngas (bar) 11.711.7
Outlet temperature syngas (°C)4545
H2S absorber
Outlet temperature syngas (°C) 11.9211.92
Mass flow syngas (kg/s)12.812.8
Syngas LHV (MJ/kg)41.1341.13
PSA
Hydrogen (kg/h)10,284.57-
Hydrogen LHV (MJ/kg)119.90-
Hydrogen energy output (MW)342.54-
Power block
Air compressor discharge (bar)2020
Combustion chamber (bar)19.0219.02
Gas turbine inlet temperature (°C)15021502
Gas turbine pressure ratio18.6518.65
Gas turbine power output (MWe)107.82317.76
Steam cycle power output (MWe)39.7395.17
Power output
Gross power output (MW) 490.09412.93
Auxiliary load (MW)21.7620.97
Net power output (MW) 468.33391.96
Net efficiency (%)64.7554.19
Exergy efficiency (%)60.7951.22
ηCCS (%)83.1283.12
Table 6. Assumptions of the total production cost.
ComponentBasis
(A) Raw materialPine sawdust 65.12 USD/t
(B) UtilitiesWater 0.7 USD/t; electricity 0.07 USD/kWh
(C) Operating and maintenance
(1) Operating labor + welfare200 laborers (45,000 USD/laborer/year) + 10% operating labor
(2) Direct supervisory and clerical labor20% of operating labor
(3) Maintenance and repairs2% of fixed capital investment
(4) Operating supplies0.7% of fixed capital investment
(5) Laboratory charge15% of operating labor
(D) DepreciationSalvage value: 4%, life period: 30 years
(E) Interest and surchargeAccording the landing schedule
(F) Plant overhead cost60% of (1) + (2) + (3)
(G) Administrative cost2% of total production cost
(H) Distribution and selling cost2% of total production cost
(I) Total production cost(A) + (B) + (C) + (D) + (E) + (F) + (G) + (H)
Table 7. The basic economic assumptions.
ItemsValuePriceValue
Discount rate8%Biomass65.12 USD/t
Plant life30 yearsWater0.76 USD/t
Yearly running time 8000 hElectricity0.07 USD/kWh
Establishment period3 yearsSulfur115 USD/t
Tax 25%Limestone19.97 USD/t
Interest7.53%
Table 8. Economic comparison of CLGCC and CLGCC–H with biomass.
ItemsCLGCC–HCLGCC
Fuel and material consumption (106 t/y)
Biomass1.051.05
Water 1.241.24
Limestone (t/y)62996299
Product
Sulfur (t/y)5681.835681.83
Hydrogen (99.99 vol% purity) (kg/y)8.74 × 107-
Electricity (kWh/y)1.18 × 1093.30 × 109
CO2 1.55 × 1061.55 × 106
Capital cost (106)
Fuel preparation2929
DFB (including gasifier, combustor, cyclones, fans, other facilities)413.18413.18
Air separation unit (ASU)73.3273.32
Selexol unit15.7615.76
H2 PSA unit21.14-
Claus/SCOT unit 10.9210.92
Heat exchangers26.0330.38
Power island (GT+ST)89.97188.08
CO2 compression 10.3510.35
Fixed capital cost689.66770.99
Working capital137.93154.20
Total capital investment827.60925.18
Raw material68.4668.46
Utilities15.8715.55
Operating and maintenance30.8633.09
Depreciation23.2926.07
Intrest and surcharges47.2454.08
Plant overhead cost 14.8115.80
Administrative cost 3.263.38
Distribution and selling cost3.263.38
Total production cost207.05219.80
Hydrogen production cost a (USD/kg)2.37-
Revenue b (106 USD]290.56231.74
Profit before tax c (106 USD)83.5111.94
Tax rate25%25%
Profit after tax (106 USD/year)62.638.96
IRR (%)17.4311.45
NPV (106 USD)677.67267.42
Payback Period (y)7.359.99
a Hydrogen production cost = Total production cost/H2 yield. b Revenue = Hydrogen price × Hydrogen yield + Electricity price × Electricity production + Sulfur price × Sulfur yield. c Profit before tax = Revenue − Total production cost.
Publisher’s Note: MDPI stays neutral with regard to jurisdictional claims in published maps and institutional affiliations.

