Abstract
The main objective of the present study was to examine the impact of socioeconomic factors on environmental degradation or preservation using the logarithmic mean disivia index (LMDI). The study used the latest data from thirty Chinese provinces from 2012 to 2020. Pooled mean group (PMG) results were estimated to determine the long-term and short-term impact of the aforementioned compound variables on carbon emissions. The study results revealed that population growth, per capita GDP growth, and fossil fuel-led energy consumption, positively impacted environmental degradation in China at the provincial level. However, clean energy intensity and a transition towards renewable energy in China are helping to reduce carbon emissions. Similarly, clean energy intensity is also helping to lower carbon emissions. The study proposed that at the provincial level, joint efforts were required to control environmental degradation in China. The positive impact of renewable energy intensity on carbon emissions encourages the transition from fossil fuels to clean energy sources for environmentally friendly growth.
1. Introduction
At present, the focus on biodiversity preservation is very high, as human activities have adversely affected nature. The high emission of toxic gases in the atmosphere, due to industrialization and economic development, have worsened the situation and expedited the pace of environmental degradation. Therefore, the only way left to improve the environmental situation is to control the emission of such harmful gases. The majority of the literature is focused on carbon dioxide instead of other greenhouse gases. This is due to the fact that carbon dioxide is the primary reason for globally increasing temperatures, or global warming. According to the study of [], the global temperature rose by approximately 1.27 degrees Celsius during the period 2015 to 2017. Furthermore, according to the United Nations Environment Program (UNEP), since 1880, the years 2016, 2019, and 2020 have been recorded as the warmest years, representing the speed of climate change. Therefore, global warming is considered a primary concern for the scientific community.
Global warming is a global environmental issue that humanity is grappling with. China has made several solemn promises to prevent climate change as it is one of the world’s largest developing countries and one of the greatest carbon emitters. Referring to the work in [], the Paris Climate Change Conference stressed that China would reach its carbon emission peak in 2030 and that it was working to accomplish this goal before then. It was stated that strict limitations should not be put on China’s economic and social development once this objective has been achieved. Instead, it was projected that achieving this target would encourage the economic development of China’s shift to green growth and low-carbon development patterns, thus promoting the transition. As a result, both the timeline and the direction of carbon emission reductions in China have received a lot of attention in recent years. Several relevant studies agreed that tackling CO2 decreases at the regional level was critical for China to meet its policies, scenarios, and city goals. China has actively engaged in top-down management, private and voluntary activities, and NGOs efforts in order to combat climate change using international climate governance at the regional level. The pace of environmental degradation is increasing day by day, and several public and private organizations are working to control carbon emissions [,]. Meanwhile, China has also made various commitments to controlling its carbon emissions and wants to get rid of its title as the world’s largest carbon emitter [,].
GHG (greenhouse gas) emissions, particularly carbon dioxide emissions, and the resulting climate change, are an environmental problem that is strongly linked to social development and economic growth. The structure of China’s economic changes, particularly in newly developed industries, have had a significant impact on the total CO2 emissions of the country. The photovoltaic sector in China, for example, is quickly catching up [,]. The work of [] estimated the dependency on time–frequency between economic growth and CO2 emissions, with the help of the wavelet coherence approach, for China. Based on the results, the study revealed that in the short and medium term, there existed significant vulnerabilities in economic growth and CO2 emissions throughout 2000. Furthermore, co-integration and positive correlation existed between economic growth and CO2 emissions in China.
CO2 emissions in China have been stable since 2012, owing to a slowdown in the country’s economic growth. For China to achieve a significant reduction in emissions, while maintaining steady economic growth, it is critical to promote sustainable development models [,]. A relevant study on the determinants of CO2 [] found that innovation and transportation had a significantly positive role in CO2 emissions in the long run. At the same time, the negative relationship between CO2 emissions and financial development has been observed in China. Similarly, the findings of [] revealed that the most important contributors in CO2 emission mitigation were research and development efficiency and a decline in energy consumption. The rise of urban employment as a proportion of total employment was also an important factor in reducing carbon emissions. However, growth in labor productivity, increases in investment intensity, and urbanization-level improvement work all act as catalysts, concerning carbon emissions [,,].
As a result of the Chinese government’s creation of several low-carbon plans and policies, China’s economic growth has reached a stage known as the new normal. The shifts from fast expansion and development to more inclusive development and high quantity to high quality and sustainable development with structural changes, characterizes this new development stage. Intelligent transportation, service-based businesses, higher per-capita income, buildings with greater energy efficiency, and other benefits will result from the new growth path [,]. A variety of initiatives are now being adopted to change development patterns and encourage long-term growth of the economy at the national and regional levels, leading towards cleaner production and fewer carbon emissions.
A recent study highlighted selected socioeconomic driving factors of carbon emissions in China using curvilinear analysis []. Their findings suggested that the accumulation of an urban population, CO2 intensity, population density, and population all have a nonlinear best-fit curve. However, there was a linear relationship between energy use and production-based emissions, while there was a nonlinear relationship with consumption-based emissions. However, the role of foreign direct investment and renewable energy was nonlinear with consumption and production-based emissions. CO2 emission-reduction research has produced solid findings and made significant progress. Related studies have objectively evaluated past contributions and various effects, and clarified future directions and emission-reduction methods. At a national level, urbanization, population, employment structure, the structure of energy, industrialization, economic development, openness, and technology are all drivers that change the emission rate at the national level, and most studies have looked at the effects of several variables [,]. For example, a driver of CO2 emission decreases has been recognized as the shift in the industry’s structure, i.e., from heavy industries to technology and service sectors. Previous studies have used time series models to examine variables from various perspectives; however, at the national level, most of them have focused on the effect of changes in the structure of the economics of China ignoring variations in CO2 emission increases between regions [,]. It is critical to consider regional emissions when considering how to accomplish carbon reduction goals equitably and at the lowest cost, whether at a local or international level. Specifically, the regional structure, which is defined by the territory’s gross domestic product (GDP) shares, a metric derived from administrative data and geographical criteria, has emerged as a critical driver of China’s CO2 emission reduction in the new normal stage. It will also be essential for enhancing synergistic collaboration and mutual learning among areas in the future.
The main objective of the present study was to examine variations in carbon emissions due to socioeconomic drivers in China. Until now, regional research has mainly concentrated on the transfer of emissions across areas, and has failed to examine the structural changes in the new normal stage across regions. Previous research has calculated CO2 transfers across Chinese regions over time and addressed the responsibility of regions to decrease carbon emissions. Interregional trade and regional emission relationships and interactions are crucial because of structural shifts and growth patterns at the regional level. It motivated us to address the research gap by probing China’s regional CO2 emissions [,].
Presently, direct and indirect impacts are mostly being neglected by the technique of index decomposition analysis (IDA) on emissions in the regional structure, and methods established using structural decomposition analysis (SDA) describe the influence of different variables from a demand perspective alone, despite the interaction across regions. Furthermore, regions are critical for reducing carbon emissions in China since various provinces have vastly diverse populations, economies, and industries due to developmental variations. However, there is little research at the regional level on drivers of this. Thus, to explain how different factors influence carbon emissions at the regional level, the logarithmic mean divisia index was used in this study to address these gaps [].
2. Materials and Methods
Provincial-level data were collected from 2012 to 2020 to determine the impact of socioeconomic factors on carbon emissions in China. The information was taken from world development indicators (WDIs) and the National Bureau of Statistics of China (NBSC). Moreover, the LMDI method was used to develop the model. Hence, the proposed model was based on the work of Li et al., 2021. By following the LMDI method, the impact of socioeconomic factors on carbon emissions in China could be determined as follows. Here, it is important to ensure that the LMDI method used in this study was subject to its objectives.
In Equation (1), environmental pollution was measured by carbon emissions and considered on the right-hand side. At the same time, the impact of the populations in rural and urban areas were measured in aggregate terms that were presented as the total population growth in each province. At the provincial level, economic progress was measured and aggregated by the production of total final goods and services in a year [,]. Two major classifications based on renewable and nonrenewable sources were used to estimate the impact of energy on carbon emissions. Renewable energy, hydropower, geothermal energy, biomass energy, solar power, and wind energy were aggregated, and further details are shown Figure 1.
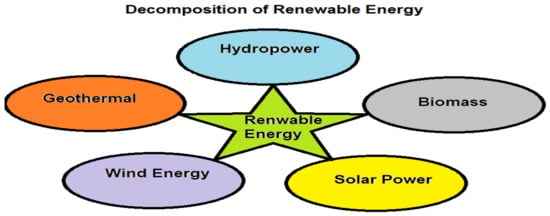
Figure 1.
Decomposition of renewable energy to develop the LMDI.
In the next step, six essential categories of coal energy, six primary types of oil energy, and four varieties of gas were incorporated into three sub-categories. Finally, the three categories were grouped into coal, oil, gas, and added into the LMDI as nonrenewable energy. This is presented in Figure 2.
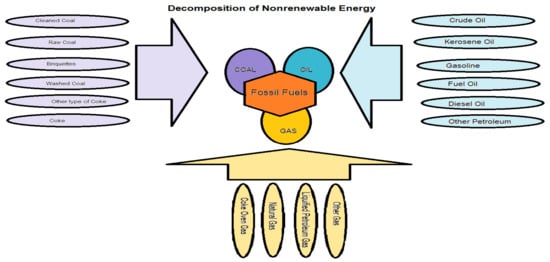
Figure 2.
Decomposition of nonrenewable energy to develop the LMDI.
Hence, in the present study, different energy categories were divided into two main categories. Therefore, following Equation (1), a new equation based on the LMDI can be written as.
In Equation (2), carbon emissions are presented with subscript ‘i’ and ‘p’ that denote emissions due to the ith factor in the province labeled by ‘p’. Similarly, on the right-hand side, the subscript ‘p’ represents population, per capita gross domestic product, clean energy intensity, energy transition, emissions per unit of nonrenewable energy consumption in province or region ‘P’. Equation (2) can be rewritten in the following way.
Equation (3) is further decomposed into the following equations.
Equation (4) shows the contribution of the population-scale effect, Equation (5) shows the contribution of the gross domestic product scale effect, Equation (6) denotes the contribution of the green-energy-intensity effect, and Equation (7) depicts the contribution of the energy-transition effect. Finally, Equation (8) shows the contribution of the nonrenewable-energy effect. More importantly, the positive impact indicated that the factor was stimulating carbon emissions, and the negative sign meant that the factor was helping to reduce carbon emissions.
Regional Emission Ranking Based on the LMDI
There are two major types of methodologies for analyzing CO2 emission drivers. The first is decomposition analysis (DA), which evaluates how different variables help to reduce emissions. The second is econometric techniques that use regional panel data. Instead of decomposing the involvement of each component to emission reductions, as is possible with DA, economic models gauge the elasticity’s coefficient for each element concerning emission reductions. DA techniques have been extensively utilized to measure the contribution of socioeconomic factors to environmental changes. IDA and SDA are the two most common decomposition techniques at the moment. In time series analysis, IDA is often used with section-detailed data; using input–output tables, SDA can distinguish the indirect impacts of changes between intermediate inputs and final demands. The Laspeyres index and the Divisia index are used to classify the IDA. The interpreted variable may be divided into the product of multiple factors, where the factor reflects the increment of each index, as per different weight-determining methods. The relative simplicity of the data and methodology, which may be used at any level of aggregation, is an advantage of IDA [].
The LMDI is preferred among IDA methods as, according to recent research, it can tackle zero values, path independence, and aggregation consistency. For instance, to examine carbon emissions per capita in terms of energy efficiency, energy intensity, and energy consumption, the LMDI and the impacts of different variables on emissions may be used. As a result, LMDI is often utilized in research to offer policy-relevant insights into topics such as energy-consumption determinants and CO2 emission variations. One way to evaluate different indexes and their effect on emission trends over time, is to utilize LMDI analysis, which compares several different indices [].
According to our estimates, carbon dioxide emissions in China increased substantially between 2012 and 2020. The four 4-year stages of CO2 emissions in China from 2012 to 2020 include the new normal (2012–2016) and the standard (2016–2020). The absence of publicly available yearly emissions data for China resulted in significant differences in current emission estimates by academic institutions and researchers, despite the emission factor being employed to modify predicted emissions in this work. The CO2 emissions from several sources, including coal, oil, and natural gas, were estimated. Beijing-Tianjin, Central Coast, Central, North, Northeast, Northwest, South Coast, and Southwest were the eight regions included in this research. The ranking of Chinese provinces based on carbon emissions from 2012 to 2020 is given in Figure 3. In the new normal stage (2012–2016), CO2 emissions were successfully managed using renewable energy rather than fossil fuels. The proportion of emissions generated by coal dropped from 82.8 to 80.7%, while the share of emissions produced by gas rose from 3.3 to 4.4% during that quarter. Using the LMDI, we examined five contributing socioeconomic variables in CO2 emissions in China: total population, economic growth per capita gross domestic product, clean energy intensity, energy transition, emission per unit of nonrenewable energy. As previously stated, the findings for 2012–2020 have been split into four 4-year phases to simplify presentation and discussion.
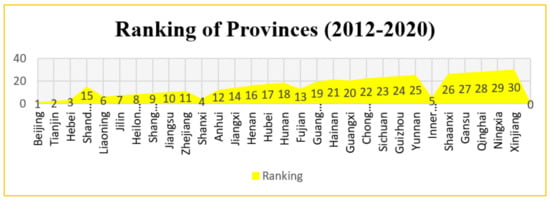
Figure 3.
Ranking of Chinese provinces based on carbon emissions.
Five factors that contributed to China’s CO2 emission increase between 2012 and 2020 were examined as the country’s economic growth slowed. China’s CO2 emissions mainly increased due to fast and consistent economic growth that surpassed CO2 emission increases. However, when the share of this driver dropped in the new normal stage, the increased rate of emissions decreased. With a sluggish pace of growth, the economy of China transitioned from a high-quantity, fast-growth pattern to a high-quality, inclusive long-term growth pattern. As a result, economic restructuring met its original objectives. The impact of the consumption of renewable energy and fossil fuel energy decrease had grown in prominence, with greater emphasis on efficiency and quality. The contribution of Chinese provinces to carbon emissions for 2012 to 2020 is given in Figure 4.
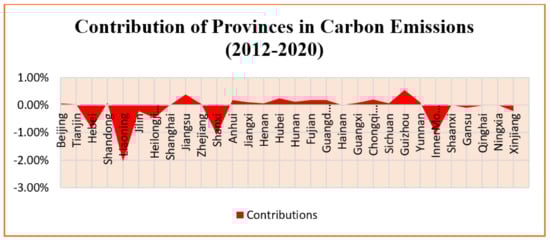
Figure 4.
Contribution of Chinese provinces to carbon emissions.
3. Results and Discussion
The augmented Dickey–Fuller and Phillips–Peron test results are given in Table 1.

Table 1.
Unit root test results.
Table 1 shows results for unit root on variables of analysis using augmented Dickey–Fuller (ADF) and Phillips–Peron (PP) tests. LnCO2, LnPOP, LnPCGDP, LnCEI, and LnET seemed to be stationary at the first difference I (1) at a 1% level of significance. According to the PP test, the variable LnCO_NR was stationary at level I (0) and constant at 1%, but it satisfied both tests by taking the first difference. This meant that all variables were stationary at a mixed level of integration, i.e., I (0) and I (1); therefore, the co-integration test could be applied to check the long-term relationship.
Table 2 shows results for the Kao co-integration test, with a null hypothesis of no co-integration. By estimation their p-value = 0.017 < 0.05. We know that the p-value was less than 5%, so we could reject the null hypothesis, which meant co-integration (long-term relationship) existed in variables.
Table 2.
Kao co-integration test.
Table 3 shows the results of the cross-sectional dependence test, with Ho = there is no cross-sectional dependence. By estimation, the probability of having p-values = 0.0000 < 0.05 for the Breusch–Pagan LM, Pesaran-scaled LM and CD tests is less than 5%, so we rejected the null hypothesis. By estimations, it was found that there was cross-sectional dependence in the panel.
Table 3.
Cross-sectional dependence test.
Table 4 shows the slope heterogeneity test proposed by Pesaran and Yamagata, with a null hypothesis that slope coefficients were homogenous. By estimations, it was found that p-values = 0.0000 < 0.05, which was less than 5%, meant the null hypothesis could be rejected. It meant there was slope heterogeneity in the slopes.
Table 4.
A standard delta test for slope heterogeneity.
Furthermore, a HAC test proposed by Blomquist and Westerlund was also applied to test the slope heterogeneity. The results are given in Table 5.
Table 5.
Slope heterogeneity HAC test.
The results in Table 5 show that the delta statistics rejected the null hypothesis representing heterogeneous slope coefficients. Therefore, the present study applied the pooled mean group (PMG) to produce the best results when slope heterogeneity existed. The results based on the PMG estimation method are given in Table 6.
Table 6.
PMG results for long-term estimates.
Table 6 shows PMG estimates for the long-term relationship. LnPOP (natural log of the population) showed the positive influence on CO2 emissions. A 1% increase in LnPOP caused a 0.41% increase in CO2 emissions that offered an enormous influence of population growth on carbon dioxide emissions; it was significant at a 1% level of significance. Previous studies of Shi 2003 support this outcome; their work in [,,,] found a positive and significant impact of population growth on CO2 emissions. The coefficient of LnPCGDP showed a positive sign and depicted a 1% increase in per capita economic growth, which caused a 0.86% increase in CO2 emissions, when all other factors were considered constant. This further highlighted that economic growth in China was increasing environmental pollution. This was in line with the empirical study conducted in [], which examined the impact of per capita GDP, trade openness, and energy consumption on CO2 emissions. The study results revealed that only per capita GDP and energy consumption were statistically significant with positive signs.
The results showed that clean energy intensity (LnCEI) had a positive impact on CO2 emissions, as a one-unit increase in clean energy intensity caused a 0.77% decrease in CO2 emissions. The results also showed that a one-unit increase in the energy transition from nonrenewable to renewable energy (LnET) caused a 0.92% decrease in CO2 emissions, which was significant at a 5% significance level. The findings also highlighted that fossil fuel consumption (LnCO-NR) showed a positive coefficient as a one unit increase in fossil fuel consumption for energy requirements caused a 0.02% increase in CO2 emissions. This was statistically significant at a 5% level of significance. The results were similar to the recent findings in []. Their results showed that the carbon footprint was positively affected by aggregate energy consumption, fossil fuel consumption, and natural gas consumption in Bangladesh. However, non-fossil fuel consumption and hydroelectricity consumption decreased the carbon footprint level. Another recent study highlighted socioeconomic drivers of carbon emissions in China []. According to the authors’ findings, accumulation of urban population, CO2 intensity, population density, and population all had a nonlinear best-fit curve. However, there was a linear relationship between energy use and production-based emissions, while this was nonlinear with consumption-based emissions. However, the role of foreign direct investment and renewable energy was nonlinear with consumption and production-based emissions.
Table 7 shows results for short-term dynamics. The findings show that the error correction term (ECT) was negated as it was less than one, which was significant at a 5% significance level. This showed that the short-term results were converging towards equilibrium, and in 1 year, approximately 7.9% of the disequilibrium will be normalized. Moreover, it could be observed that population growth and economic growth were contributing to environmental pollution in the short term. More precisely, the short-term results highlighted that a 1% increase in population growth was expected to increase carbon emissions by approximately 0.07% in the Chinese provinces. These findings also showed that a 1% increase in per capita economic growth increased carbon emissions by about 0.08% when all other factors were considered constant.
Table 7.
Short-term results.
Similarly, the work of [,] argued that CO2 emissions were only determined in the short term. It indicated that population growth increased carbon emissions in the short term. Moreover, the study’s results revealed that economic growth was positive and significant, meaning that economic growth increased CO2 emissions. The other factors, such as clean energy intensity, energy transition towards clean energy, and conventional nonrenewable energy sources such as fossil fuel consumption, showed expected signs. Still, their impact on carbon emissions was not statistically significant.
Similarly, the work of [] argued that CO2 emissions were only determined by population growth in the short term. It indicated that population growth increased carbon emissions in the short term. Moreover, the study’s results revealed that economic growth was positive and significant, showing that economic growth increased CO2 emissions. The other factors, such as clean energy intensity, energy transition towards clean energy, and conventional nonrenewable energy sources such as fossil fuel consumption, showed expected signs. Still, their impact on carbon emissions was not statistically significant.
4. Conclusions and Policy Recommendations
The study’s primary purpose was to empirically determine the socioeconomic factors that cause environmental degradation or preservation in China. Data on main variables of concern were taken from 30 provinces in China from 2012 to 2020. To develop an econometric model, the LMDI method was used and statistical analysis was performed through pooled mean group regression. The results showed that population growth, per capita GDP, and nonrenewable energy consumption contributed to carbon emissions in the short- and long-term time frame. The study also depicted that the increase in clean energy intensity in the production of goods and the transition from fossil fuels to clean energy were vital determinants in reducing carbon emissions in the region under consideration. Thus, it could be concluded that an improvement in the utilization of renewable energy and clean energy intensity showed positive and significant impacts on carbon emissions. Based on such findings, it could be suggested that provincial governments should limit the consumption of fossil fuels.
More importantly, energy sources, such as hydel, solar, and wind, should be encouraged to produce goods and preserve the natural environment for sustainable and environmentally friendly economic development. Without taking measures on environmental conservation, sustainable growth is impossible. The government must raise the awareness of the new generation regarding the importance of the natural environment and the alarming situation emerging due to increasing carbon emissions. Moreover, the importance of the utilization of renewable energy and carbon literacy at the micro-level may be helpful for provincial governments to achieve the target of low carbon emissions at the regional level. In short, the present study’s findings shed light on interregional collaboration, demonstrating how regions might benefit from the understanding of places with comparable circumstances, but lower emissions, to enhance their overall growth patterns. The findings of this study uncovered the impact of population growth on carbon emissions, as high population growth stimulated the demand for goods at a domestic level. Usually, increased demand for goods is met by utilizing readily available energy sources, such as fossil fuels. However, the results of the present study highlighted that an improvement in the share of renewable energy to produce a unit of sound may help to increase the level of production at the domestic level and control carbon emissions. Therefore, to promote renewable energy in the production industries, there is a dire need to launch a subsidized program to help production industries transition from fossil fuels to renewable energy infrastructures. Policy implications were examined in this study based on these findings. CO2 emissions differed by geography owing to various factors; as a result, different countermeasures should be implemented for diverse reasons. Moreover, the present study’s findings we re limited to five socioeconomic determinants that were constructed based on the LMDI method. Including father determinants, such as provincial size and institutional quality, may provide further important insights for policymakers and practitioners.
Author Contributions
Conceptualization, F.H.; methodology, W.Y.; software, W.Y. and M.A.; validation, F.H. and S.A.A.; formal analysis, M.A.; investigation, W.Y. and M.S.; resources, I.A.; data curation, M.S.; writing—original draft preparation, W.Y.; review and editing writing—I.A.; visualization and supervision, S.A.A. All authors have read and agreed to the published version of the manuscript.
Funding
This research received no external funding.
Institutional Review Board Statement
Not applicable.
Informed Consent Statement
Not applicable.
Data Availability Statement
The detail regarding data availability is discussed in Section 2.
Conflicts of Interest
The authors of the submitted manuscript have no conflict of interest with any third party. The funders had no role in the design of the study; in the collection, analyses, or interpretation of data; in the writing of the manuscript; or in the decision to publish the results.
References
- Hanif, I. Impact of fossil fuels energy consumption, energy policies, and urban sprawl on carbon emissions in East Asia and the Pacific: A panel investigation. Energy Strateg. Rev. 2018, 21, 16–24. [Google Scholar] [CrossRef]
- Baloch, Z.A.; Tan, Q.; Iqbal, N.; Mohsin, M.; Abbas, Q.; Iqbal, W.; Chaudhry, I.S. Trilemma assessment of energy intensity, efficiency, and environmental index: Evidence from BRICS countries. Environ. Sci. Pollut. Res. 2020, 27, 34337. [Google Scholar] [CrossRef]
- Alharthi, M.; Hanif, I. Impact of blue economy factors on economic growth in the SAARC countries. Marit. Bus. Rev. 2020, 5, 253–258. [Google Scholar] [CrossRef]
- Abbas Scholar, Q.; Sharif Chaudhry, I. Environmental Degradation and Economic Development Nexus in Pakistan: A Time Series Analysis. Pak. J. Soc. Sci. 2017, 37, 102–113. [Google Scholar]
- Alharthi, M.; Hanif, I. The role of energy types and environmental quality on human health in developing Asian countries. Energy Environ. 2021, 32, 1226–1242. [Google Scholar] [CrossRef]
- Abbas, Q.; Khan, A.R.; Bashir, A.; Alemzero, D.A.; Sun, H.; Iram, R.; Iqbal, N. Scaling up renewable energy in Africa: Measuring wind energy through econometric approach. Environ. Sci. Pollut. Res. 2020, 27, 36282–36294. [Google Scholar] [CrossRef] [PubMed]
- Shen, H.; Ali, S.A.; Alharthi, M.; Shah, A.S.; Khan, A.B.; Abbas, Q.; Rahman, S.U. Carbon-free energy and sustainable environment: The role of human capital and technological revolutions in attaining sdgs. Sustainability 2021, 13, 2636. [Google Scholar] [CrossRef]
- Li, W.; Sun, S.; Li, H. Decomposing the decoupling relationship between energy-related CO2 emissions and economic growth in China. Nat. Hazards 2015, 79, 977–997. [Google Scholar] [CrossRef]
- Kirikkaleli, D. New insights into an old issue: Exploring the nexus between economic growth and CO2 emissions in China. Environ. Sci. Pollut. Res. 2020, 27, 40777–40786. [Google Scholar] [CrossRef]
- Wu, S.; Alharthi, M.; Yin, W.; Abbas, Q.; Shah, A.N.; Ur Rahman, S.; Khan, J. The carbon-neutral energy consumption and emission volatility: The causality analysis of asean region. Energies 2021, 14, 2943. [Google Scholar] [CrossRef]
- Jawad Sajid, M. Modelling best fit-curve between China’s production and consumption-based temporal carbon emissions and selective socio-economic driving factors. IOP Conf. Ser. Earth Environ. Sci. 2020, 431, 012061. [Google Scholar] [CrossRef]
- Umar, M.; Ji, X.; Kirikkaleli, D.; Xu, Q. COP21 Roadmap: Do innovation, financial development, and transportation infrastructure matter for environmental sustainability in China? J. Environ. Manag. 2020, 271, 111026. [Google Scholar] [CrossRef] [PubMed]
- Lin, B.; Wang, M. The role of socio-economic factors in China’s CO2 emissions from production activities. Sustain. Prod. Consum. 2021, 27, 217–227. [Google Scholar] [CrossRef]
- Wei, G.; Asghar, N.; Ahmad, I.; Yin, W.; Abbas, Q.; ur Rahman, S.; Farooq, F. Economic growth, fiscal imbalance, and environmental sustainability: What is desirable and undesirable for developing economies? Environ. Sci. Pollut. Res. 2021, 28, 52283–52294. [Google Scholar] [CrossRef] [PubMed]
- Chaudhry, I.S.; Yin, W.; Ali, S.A.; Faheem, M.; Abbas, Q.; Farooq, F.; Ur Rahman, S. Moderating role of institutional quality in validation of pollution haven hypothesis in BRICS: A new evidence by using DCCE approach. Environ. Sci. Pollut. Res. 2021, 29, 9193–9202. [Google Scholar] [CrossRef]
- Hanif, I.; Wallace, S.; Gago-de-Santos, P. Economic Growth by Means of Fiscal Decentralization: An Empirical Study for Federal Developing Countries. SAGE Open 2020, 10, 1–12. [Google Scholar] [CrossRef]
- Hao, W.; Abbas, Q.; Ahmad, I.; Alharthi, M.; Hanif, I.; Taghizadeh-Hesary, F. Institutional efficiency and utility reform performance: An evidence from electricity performance in South & East Asia. Econ. Anal. Policy 2021, 72, 549–561. [Google Scholar] [CrossRef]
- Ullah, S.; Nadeem, M.; Ali, K.; Abbas, Q. Fossil fuel, industrial growth and inward FDI impact on CO2 emissions in Vietnam: Testing the EKC hypothesis. Manag. Environ. Qual. Int. J. 2021. ahead of print. [Google Scholar] [CrossRef]
- Zhao, J.; Patwary, A.K.; Qayyum, A.; Alharthi, M.; Bashir, F.; Mohsin, M.; Hanif, I.; Abbas, Q. The determinants of renewable energy sources for the fueling of green and sustainable economy. Energy 2022, 238, 122029. [Google Scholar] [CrossRef]
- Abbas, Q.; Hanif, I.; Taghizadeh-Hesary, F.; Iqbal, W.; Iqbal, N. Improving the Energy and Environmental Efficiency for Energy Poverty Reduction. In Economics, Law, and Institutions in Asia Pacific; Springer: Berlin/Heidelberg, Germany, 2021. [Google Scholar]
- Murshed, M.; Ahmed, Z.; Alam, M.S.; Mahmood, H.; Rehman, A.; Dagar, V. Reinvigorating the role of clean energy transition for achieving a low-carbon economy: Evidence from Bangladesh. Environ. Sci. Pollut. Res. 2021, 28, 67689–67710. [Google Scholar] [CrossRef]
- Amin, A.; Liu, X.H.; Abbas, Q.; Hanif, I.; Vo, X.V. Globalization, sustainable development, and variation in cost of power plant technologies: A perspective of developing economies. Environ. Sci. Pollut. Res. 2021, 28, 11158–11169. [Google Scholar] [CrossRef] [PubMed]
- Moore, J.C.; Chen, Y.; Cui, X.; Yuan, W.; Dong, W.; Gao, Y.; Shi, P. Will China be the first to initiate climate engineering? Earths Futur. 2016, 4, 588–595. [Google Scholar] [CrossRef]
- Hanif, I.; Faraz Raza, S.M.; Gago-de-Santos, P.; Abbas, Q. Fossil fuels, foreign direct investment, and economic growth have triggered CO2 emissions in emerging Asian economies: Some empirical evidence. Energy 2019, 171, 493–501. [Google Scholar] [CrossRef]
- Qayyum, M.A.; Bashir, F.; Maqbool, M.M.; Ali, A.; Bashir, S.; Abbas, Q. Implications of saline water irrigation for linseed on seed germination, seedling survival and growth potential. Sarhad J. Agric. 2019, 35, 1020–1356. [Google Scholar] [CrossRef]
- Jeong, K.; Kim, S. LMDI decomposition analysis of greenhouse gas emissions in the Korean manufacturing sector. Energy Policy 2013, 62, 1245–1253. [Google Scholar] [CrossRef]
- Guan, D.; Peters, G.P.; Weber, C.L.; Hubacek, K. Journey to world top emitter: An analysis of the driving forces of China’s recent CO2 emissions surge. Geophys. Res. Lett. 2009, 36. [Google Scholar] [CrossRef] [Green Version]
- Li, H.A.O.; Bhatti, Z.; Abbas, Q.; Ahmad, I.; Iqbal, N.; Aziz, B. Measuring Low Carbon Energy, Economic and Environmental Sustainability Performance of Brics. Singap. Econ. Rev. 2020. [Google Scholar] [CrossRef]
- Lei, X.-T.; Xu, Q.-Y.; Jin, C.-Z. Nature of property right and the motives for holding cash: Empirical evidence from Chinese listed companies. Manag. Decis. Econ. 2021, 1–19. [Google Scholar] [CrossRef]
- Quan, Q.; Gao, S.; Shang, Y.; Wang, B. Assessment of the sustainability of Gymnocypris eckloni habitat under river damming in the source region of the Yellow River. Sci. Total Environ. 2021, 778, 146312. [Google Scholar] [CrossRef]
- Dong, K.; Hochman, G.; Zhang, Y.; Sun, R.; Li, H.; Liao, H. CO2 emissions, economic and population growth, and renewable energy: Empirical evidence across regions. Energy Econ. 2018, 75, 180–192. [Google Scholar] [CrossRef]
- Hussain, I.; Rehman, A. Exploring the dynamic interaction of CO2 emission on population growth, foreign investment, and renewable energy by employing ARDL bounds testing approach. Environ. Sci. Pollut. Res. 2021, 28, 39387–39397. [Google Scholar] [CrossRef] [PubMed]
- Chen, X.; Quan, Q.; Zhang, K.; Wei, J. Spatiotemporal characteristics and attribution of dry/wet conditions in the Weihe River Basin within a typical monsoon transition zone of East Asia over the recent 547 years. Environ. Model. Softw. 2021, 143, 105116. [Google Scholar] [CrossRef]
- Zhang, K.; Ali, A.; Antonarakis, A.; Moghaddam, M.; Saatchi, S.; Tabatabaeenejad, A.; Chen, R.; Jaruwatanadilok, S.; Cuenca, R.; Crow, W.T.; et al. The Sensitivity of North American Terrestrial Carbon Fluxes to Spatial and Temporal Variation in Soil Moisture: An Analysis Using Radar-Derived Estimates of Root-Zone Soil Moisture. J. Geophys. Res. Biogeosci. 2019, 124, 3208–3231. [Google Scholar] [CrossRef]
- Zhang, K.; Wang, S.; Bao, H.; Zhao, X. Characteristics and influencing factors of rainfall-induced landslide and debris flow hazards in Shaanxi Province, China. Nat. Hazards Earth Syst. Sci. 2019, 19, 93–105. [Google Scholar] [CrossRef] [Green Version]
- Sulaiman, C.; Abdul-Rahim, A.S. Population Growth and CO2 Emission in Nigeria: A Recursive ARDL Approach. SAGE Open 2018, 8, 2158244018765916. [Google Scholar] [CrossRef] [Green Version]
Publisher’s Note: MDPI stays neutral with regard to jurisdictional claims in published maps and institutional affiliations. |
© 2022 by the authors. Licensee MDPI, Basel, Switzerland. This article is an open access article distributed under the terms and conditions of the Creative Commons Attribution (CC BY) license (https://creativecommons.org/licenses/by/4.0/).