Article

Assessment of Power System Sustainability and Compromises between the Development Goals

1
Guangzhou College of Commerce, 206 Jiulong Avenue, Huangpu District, Guangzhou 511363, China
2
Sino-Russian Institute, Jiangsu Normal University, 101 Shanghai Rd., Tangshan District, Xuzhou 221116, China
3
National Academy of Agrarian Sciences, 9 Omelianovych-Pavlenko Str., 01010 Kyiv, Ukraine
4
Ministry of Education and Science of Ukraine, O.M. Beketov National University of Urban Economy in Kharkiv, 17 Marshal Bazhanov Street, 61002 Kharkiv, Ukraine
5
Research Centre for Industrial Problems of Development, National Academy of Sciences of Ukraine, 1a Inzhenernyi Ln., 61166 Kharkiv, Ukraine
6
Ministry of Education and Science of Ukraine, National University “Odessa Maritime Academy”, Didrichson Street 8, 65029 Odessa, Ukraine
*
Author to whom correspondence should be addressed.
Sustainability 2022, 14(4), 2236; https://doi.org/10.3390/su14042236
Submission received: 28 December 2021 / Revised: 31 January 2022 / Accepted: 8 February 2022 / Published: 16 February 2022

Abstract

:
Ensuring the sustainability of the European power system is one of the key priorities in the implementation of the EU’s ambitious plans to become climate-neutral by 2050. The uniqueness of the power systems of the EU member states necessitates their assessment and comparison. The article offers a composite indicator, namely, the power system sustainability index (PSS index), to assess the current level of the development of the power systems via three dimensions (social, economic, and environmental) and eight local indicators: the household electricity consumption per capita; the commercial electricity consumption per GDP; the external dependency of the power system; the energy efficiency of the generation; the capacity utilization factor; the share of organic fossil fuels; the share of renewable energy resources; and the greenhouse gas (GHG) emissions per unit of primary energy source. The “energy mix” is defined as the key impact factor, which has a contradictory effect on the local power system sustainability (LPSS) indicators, which can be represented as a set of regression models. The data of the regression analysis can be used for performing a multiobjective optimization by the local indicators, and they can determine the vectors of change required to ensure the sustainability of the power system. The research results prove that it is possible to minimize the GHG emissions per unit of primary energy source and maximize the energy efficiency of generation, while reducing the capacity utilization and increasing the external dependency of the power system.

1. Introduction

The generally accepted vector of sustainable development requires a fundamental change in the energy policy and a sustainable energy transition. The United Nations World Commission on Environment and Development (UN WCED) defines sustainable energy as “a safe, environmentally sound, and economically viable energy pathway that will sustain human progress into the distant future” [1]. Junejo, Saeed, and Hameed single out the following main features of sustainable energy [2]: (i) It can be utilized again and again, without putting the source in danger of becoming depleted, expired, or vanished; (ii) It does not harm our environment; and (iii) It is available all around us and is free of cost [2]. It is believed that only renewable energy sources (RESs) refer to sustainable energy [3,4,5], while fossil fuels are unsustainable energy sources [6]. Consequently, the transition to sustainable energy systems means the complete abandonment of the latter. Böhm, Moser, Puschnigg, and Zauner define a sustainable energy system as follows: In the long term, no fossil CO2 is released into the atmosphere, and the energy system is entirely supported by renewable energies [7]. At the same time, the creation of a sustainable energy system is aimed at solving the energy trilemma: energy security, energy equity, and environmental sustainability [8]. Therefore, ensuring energy system sustainability implies searching for a compromise between the economic, social, and environmental aspects as the integral parts of sustainability, without compromising the different aspects of the system complexity [9,10].
The problems of power system sustainability are related to the sustainable development goals (SDGs) that were established by the United Nations [11]. First, electricity is considered to be a priority and a modern energy source for human development that is intended to replace others. Therefore, social problems are associated with SDGs 1, 8, and 12, and their achievement involves ending energy poverty and ensuring economic growth through responsible energy consumption. Second, electricity is a highly standardized, safe, and environmentally friendly source of energy. The economic problems with regard to the functioning of power systems are associated with Goals 12 and 7, and, therefore, solving them is aimed at providing efficient and clean power generation in accordance with consumer needs. Third, electricity generation is responsible for over 40% of the energy-related CO2 emissions [12]. For this reason, the environmental issues are primarily associated with Goal 13 and require reducing the GHG emissions from power generation. According to the International Energy Agency (IEA), the world will shift to an electrified renewable-rich energy system, which will result in an increasing demand for electricity from industry and households, a switch to electricity for mobility, and a move away from fossil-fuel-fired boilers for heating; however, at the same time, it requires the development of all forms of system flexibility, such as the enhancement of electrical grids and digital and battery storage technologies [13]. All of this determines the continued focus of scientists on solving the problems associated with power system sustainability. As we further assumed, the SDGs contradict each other. Progress in solving one of them leads to regress in the other. Therefore, the problem of ensuring power system sustainability implies searching for a compromise solution in each dimension.
The term, “power system sustainability”, has been in scientific use since the early 2000s. However, there are also earlier works that deal with the analysis of the individual aspects of this problem. The first references to the use of this term are contained in the studies of Sannino, Hammons, and McConnach, and Janicek, Simunek, Fecko, Breza, and Hanzel [14,15]. A wide range of academics are investigating different aspects of this problem, which indicates its complexity and multifacetedness. In this regard, the first step of the study, presented in Section 1, involved the search for a generally accepted methodology. For this purpose, we chose 5340 articles dealing with power system sustainability, which were published in the Web of Science database during the period from 1991–2021, which included 1907 papers published in MDPI journals [16]. The bibliographic analysis of the publications through the use of VOSviewer (Appendix A), which was developed by Leiden University’s Centre for Science and Technology Studies [17], reveals that the common methodology for studying the problem of power system sustainability is a lifecycle assessment (LCA) (e.g., [18,19]). Santoyo-Castelazo and Azapagic apply a lifecycle approach to energy systems that integrates three sustainability dimensions in order to enable assessments at both the technology and system levels [19]. The LCA of the power system sustainability is comprised of three stages: Inventory Analysis, Impact Assessment, and Interpretation. Some scientists perform all three [20,21,22], while others focus only on one or two of them [23,24,25].
An analysis of the features of the LCA methodology for assessing power system sustainability is presented below.
In the first stage (Inventory Analysis), the local indicators and the composite indicator of the power system sustainability are calculated. One of the fundamental works dealing with this stage is the study by Liu, which considers the methodological features of the development of a general sustainability indicator while including many basic sustainability indicators, and which offers the methods for the selection, quantification, evaluation, and weighting of the basic indicators, as well as the methods for their aggregation [26]. Today, scientists are developing a lot of variations in the general sustainability indicators and are giving them different names depending on the aspect they want to emphasize in their research. Among such studies, it is worth noting the following publications: Shaaban, Scheffran, Böhner, and Elsobki designed the integrated sustainability index with the consideration of five dimensions, including the technical, economic, environmental, and social aspects, by 13 selected criteria. They evaluated seven technologies and concluded that the technology used in gas power plants was the most sustainable one, which was followed by renewable energy technologies [21]. Cîrstea, Moldovan-Teselios, Cîrstea, Turcu, and Dar-ab constructed a composite index, namely, the renewable energy sustainability index, which is calculated on the basis of 23 indicators divided into four dimensions: economic, environmental, social, and institutional. They found that the renewable impact is continuously growing, which indicates the awareness of the concept of sustainable development and the transition toward renewable energies [24]. Fuentes, Villafafila-Robles, Rull-Duran, and Galceran-Arellano developed the power system security index, which considers 44 indicators divided into five dimensions: availability; infrastructure; economy; environment; governance; and research, development, and innovation. They conclude that the flexibility of power systems can be enhanced because of the existence of international interconnections and the presence of gas-fired power plants [27]. It should be noted that the choice of the local indicators of the power system sustainability comes from the subjective views of the authors on this problem and depends on their research objectives.
The second stage (Impact Assessment) implies the identification of the factors exerting an impact on the power system sustainability. Our literature review shows that the following significant works can serve as a basis for this study: Ma, Chong, Zhang, Liu, Li, Li, and Ni examined the primary energy quantity converted factor and the primary carbon dioxide emission factor, on the basis of Sankey diagrams. According to the authors, these indicators reflect the whole process of energy unitization and the related CO2 emissions, and they allow for the mapping of the energy and the CO2 allocation [28]. Gómez-Camacho and Ruggeri propose an energy sustainability analysis that considers the entire energy trajectory, from the energy sources to the useful energy. They constructed the energy sustainability index in order to take into account the additional relevant energy fluxes, prior to the technological boundary of the energy system, such as the already spent energy and/or the avoided energy that need to be considered for the calculation of the available energy [25]. Roldán-Blay, Miranda, Carvalho, and Roldán-Porta analyzed the demand and generation profiles to reach an effective integration of RESs. They studied the consequences that RES plants could have for transmission networks, as well as their energy losses and the associated emissions [29].
At the third stage (Interpretation), the recommendations for ensuring power system sustainability are developed. Such recommendations can be made using different methods of scenario modeling, namely, fuzzy synthetic evaluation [30,31], Monte Carlo simulation [32,33], multiobjective optimization [34,35,36], or other techniques. Multiobjective optimization is considered to be the most appropriate method to use when making long-term strategic decisions, whereas Monte Carlo simulation is focused on the uncertainties in the development of power systems. Al Shidhani, Ioannou, and Falcone propose conducting multiobjective optimization on the basis of four objective functions: the minimization of the total discounted costs, the carbon emissions, the land use, and the social opposition. They found a lack of tradeoffs between the minimization of CO2 emissions and the social opposition, and between the total cost and the land use objective functions [34]. Using multiobjective optimization, Junne, Cao, Miskiw, Hottenroth, and Naegler ) assessed the tradeoffs between the system costs and the lifecycle GHG emissions of future power systems. They revealed the trend that a deployment of wind onshore, an electricity grid, and a decline in photovoltaic plants and Li-ion storage mitigates GHG emissions, with small increases in the system costs, whereas the deployment of concentrated solar power, offshore wind, and nuclear power helped to achieve further reductions, but resulted in considerably higher costs [35]. Wang, Tan, Tan, Yang, Lin, Ji, Gejirifu, and Song studied the distributed power and found the Pareto optimal solution for a combination of wind and photovoltaic power, with cooperation between the time-of-use price and the battery energy storage system [36].
All the studies conducted are empirical, which reflects the subjective attitudes of the authors to this problem, since it is unlikely that a universal approach will be found that will provide only for the objective representation of this phenomenon. The problem of power system sustainability will persist, since it does not lose its relevance, which necessitates new research in this area.
According to Masanet, Chang, Gopal, Larsen, Morrow III, Shehabi, and Pei Zhai, the application of the LCA of power systems and technologies will continue, and it must move beyond the characterization of power technology footprints towards an assessment of the impacts of power technologies in more dynamic and macroeconomic contexts [37]. In this paper, we made an attempt to move from individual power technologies to the level of entire national power systems, and we applied the LCA in a macroeconomic context. This study proposes a methodological approach to assessing power system sustainability at the national and regional scales, and is based on Sankey diagrams, an input–output analysis of the internal electricity flows, and methodological recommendations for the enhancement of sustainability on the basis of the multiobjective optimization function, by the local sustainability indicators.
The purpose of the paper is to determine the levels of sustainability for European power systems and to identify the factors affecting them. The general hypothesis of the research is defined as, “ensuring that power system sustainability is a compromise solution to social, economic, and environmental problems”.
The rest of the paper is organized as follows: Section 2 presents the materials and methods used. The data on the energy flows and GHG emissions were taken from the Eurostat Database for the period from 2010–2019 [38]. The methodology subsection describes the general design of the LCA of the power system sustainability, as well as the process for evaluating the power system sustainability index, which assesses the impact factors, and specifies the scenarios of the single-objective and multiobjective optimizations; Section 3 focuses on the results obtained from assessing the power system sustainability; and Section 4 presents the discussion and summarizes the main findings of the paper.

2. Materials and Methods

This work rests upon the LCA methodology, which has been proven useful for assessing the sustainability of power systems. On the basis of ISO: 14040:2006 [20], the attributes for assessing the sustainability of national power systems are identified in Table 1.
This study is based on an aggregated model of the electricity lifecycle, according to which the LPSS indicators are determined (Figure 1).
The aggregated model of the electricity lifecycle includes the input–output data on the electricity flows (from the acquisition of the primary energy sources, or their extraction from nature, to the final electricity consumption by the end-consumers). It consists of five stages, which are numbered in Figure 1:
  • Converting the primary energy sources into electricity. The output of this stage is the gross electricity production;
  • Spending electricity for the use of their own power generation units. The output of this stage is the net electricity production;
  • Exporting the electricity surplus and importing electricity in cases of its shortage. The output of this stage is the available electricity;
  • Losing electricity in the power networks. The output of this stage is the final electricity consumption;
  • Emitting air pollutants to the atmosphere from the burning of primary energy sources. One of the outputs of this stage is the GHG emissions.
By investigating the following stages, it is possible to provide a qualitative assessment of the power system sustainability by the local indicators and the composite indexes.
We offer the power system sustainability index (PSS index) to assess the current levels of the development of the national power systems. The PSS index can be defined as a composite indicator of a set of LPSS indicators, which are grouped according to three dimensions: social, economic, and environmental. On the basis of the recommendations of Liu, in order to cut the number of indicators so that they reflect all aspects of sustainability but do not overlap with each other [26], we propose using eight LPSS indicators, which are grouped according to the abovementioned three dimensions of sustainable development.
The social dimension of the PSS index can be represented by two indicators: the household electricity consumption per capita, and the commercial electricity consumption per GDP. For the composite indicator, the household electricity consumption per capita is considered to be a driver for sustainable development, while the commercial electricity consumption per GDP is considered to be a setback for it.
The economic dimension can be determined by five indicators: the ability of a power system to meet consumer needs; the efficiency of the power system operation; the energy efficiency of the generation; the domination of clean energy sources in the power generation; and the ecological dimension.
The ability of a power system to meet consumer needs is assessed through the indicator of its external dependency, which is defined as the ratio of all the available electricity after the transformation minus the volume of its imports to the net electricity generation, minus the volume of its exports. In the case of a completely independent power system, this ratio is 100%; i.e., the external flows of electricity are completely consumed to stabilize its internal operation. The level of dependency is a positive (export dependency) or negative (import dependency) deviation from the reference value. The external dependencies of the power systems are considered to be setbacks for their sustainable development.
The efficiency of the power system operation is determined by the indicator of the capacity utilization in annual terms (calculated as 8760 h/year). High values of the capacity utilization factor indicate the rational use of generation capacity, which defines it as a driver for sustainable development.
The energy efficiency of the generation is determined as the ratio of all the electricity available for consumption, minus the volume of its imports, to the transformation inputs of the primary energy sources for electricity generation, which defines this indicator as a driver for sustainable development. Its values depend on the structure of the employed power generation technologies and their development levels.
The domination of clean energy sources in power generation is manifested in an increase in the share of RESs, and a decrease in the share of OFFs in the total transformation inputs of the primary energy sources for electricity generation, the former being considered to be a driver, and the latter considered to be a setback for sustainable development.
The ecological dimension is determined by one indicator: the GHG emissions per unit of primary energy source. It is assumed that a power system that has low values for this indicator will automatically have low values for other types of air pollutants. This indicator is defined as a setback for sustainable development.
To normalize the local indicators, the weighted min–max method [44,45] can be used, and, to determine the weights of the local indicators and dimensions, the entropy weight coefficient method can be employed [46]. Such an assessment allows for a comparison of the sustainability of the functioning of the power systems, and it is the starting point in determining the vector of their sustainable development.
It was proven that the differentiation in the energy mixes used by power systems leads to instability in the electricity markets in the form of a significant dispersion of the electricity prices [47]. In this article, we argue for the contradictory effects of the energy sources on the power system sustainability. To evaluate the impact of the energy mix on the LPSS indicators, and the interrelations between them, a multistep regression analysis is conducted. The energy mix is represented by eight energy sources: coal (including all solid organic fossil fuels), natural gas, oil products, biofuels (including renewable wastes), hydro, wind, solar, and nuclear, and the external electricity flows were divided into “import” and “export”. The regression analysis of the LPSS indicators was conducted for a sample of 27 EU countries for the period from 2010—2019. The evaluation of the significances of the impacts exerted by the local indicators was conducted on the basis of the criterion: a p-value < 0.05.
The impact assessment of the LPSS indicators is the basis for the interpretation of the current energy policy in achieving power system sustainability and is a forecast of their development. The current and forecast LPSS indicators should be compared with the values of the optimization scenarios in order to provide recommendations for further changes in the energy policy for the sustainable development of power systems.
Because of the time lag in the publication of the statistical data, the assessment of power system sustainability is of a historical nature. For the operational assessment of the European power system sustainability in 2020, we used partially published data on the structure of the electricity generation in 2020, which also allowed us to confirm the reliability of the regression models, while the forecast for 2021 was made on the basis of the compound annual growth rates of the electricity generation from 2010–2020.
Furthermore, in order to confirm the contradictions between the LPSS indicators, the scenarios of the single-objective optimization are applied. Such scenarios provide for the optimization by only one LPSS indicator, and they are considered to be: (i) The minimization of the GHG emissions per unit of primary energy source; (ii) The maximization of the energy efficiency of the generation; (iii) The maximization of the capacity utilization; and (iv) The minimization of the external dependencies of the power systems. The commercial electricity consumption per GDP and the household electricity consumption per capita are considered to be exogenous factors, and, therefore, they are not modeled but act only as influencing factors. They are determined on the basis of the limitation of the maximum utilization of the generation capacity. The study considers three single-objective optimization scenarios: (1) With the utilization of the nuclear power generation capacity at 90%, and the hydropower generation capacity at 50%; (2) With the utilization of the nuclear power generation capacity at 80%, and the hydropower generation capacity at 30%. Each of the scenarios assumes that the current level of the utilization of the intermittent renewable energy generation capacities is optimal, and that it is impossible to increase it without expanding these capacities; (3) By expanding the capacity of the intermittent renewable energy generation at the maximum possible utilization of the nuclear and hydropower generation capacity. It is accepted that the utilization of the rest of the generation capacities can reach 80%.
The availability of a set of LPSS indicators determines the need to solve the problem of the multiobjective optimization of power system sustainability in the search for a compromise between them. Multiobjective optimization scenarios are built using a multiobjective genetic algorithm [42], and they imply the search for a nondominated Pareto optimal distribution of the possible solutions by the target LPSS indicators, without the limitation of the level of the capacity expansion. Such scenarios show the necessary strategic changes and possible consequences of the decisions made. The limitations for the optimization of the LPSS indicators are: the available installed generation capacity and the maximum possible level of its utilization; the energy efficiency of the generation; and the current level of the electricity consumption. The energy efficiency of the generation depends on the level of the technology development and, according to the IEA Energy Technology Systems Analysis Program [48] and the ENTSO-E Mid-term Adequacy Forecast 2020 [49], it is established as follows: coal and biofuel—40%; oil—35%; gas—55%; nuclear—33%; and hydro—95%. The level of the energy efficiency of the solar and wind power generation is determined as 100%.
As a consequence, the expected result of the study is the comparison of the current and desired levels of the sustainability of power systems, which is the basis for developing the recommendations for their further improvement.

3. Results

3.1. Index of Power System Sustainability

Europe aims to be the world’s first climate-neutral continent by 2050, and the EU strives to be the leader in this transition [50], with carbon neutral electricity considered to be the main contributor to the transition [49]. Table 2 and Appendix B present the results of the assessments of the local indicators and the composite PSS indexes for European countries for 2010, 2015, and 2019.
The results of the comparison of the LPSS indicators of the EU member countries are as follows: In 2019, the EU household electricity consumption per capita amounted to 1.58 MWh/capita/year, and, compared to 2010, it decreased by 5%, but, compared to 2015, it increased by 1%. The highest household electricity consumptions per capita were recorded in Sweden, where it amounted to 4.29 MWh/capita/year; in Finland, where it amounted to 4.09 MWh/capita/year; and in France, where it amounted to 2.38 MWh/capita/year. The lowest household electricity consumptions per capita were observed in Romania, Poland, and Latvia, with the values of 0.67 MWh/capita/year, 0.77 MWh/capita/year, and 0.86 MWh/capita/year, respectively. In general, the developed countries demonstrated higher values of household electricity consumption per capita in comparison to the developing ones.
In the same year, the EU commercial electricity consumption per GDP at purchasing power parity (PPP) amounted to 0.15 kWh/EUR. In comparison to 2015, it increased by 12%, and, compared to 2010, it decreased by 5%. The highest values were recorded in Finland, Sweden, and Slovenia, at 0.35, 0.26, and 0.21 kWh/EUR, respectively. The lowest electricity consumptions per GDP at PPP were in Ireland, Lithuania, and Romania, amounting to 0.11 kWh/EUR for each of the countries. It is considered that the variation in this indicator is due to the differences in the economic structures of the countries.
The results of calculating the external dependencies of the power systems in 2019 showed that, in general, the EU can be considered a net exporter of electricity, with the positive value of this indicator at about 8%. The power systems of Poland, with net imports of 0.4%, Slovakia, with net exports of 1.3%, and the Netherlands, which exported 3.6%, can be considered independent, while, for the power systems of Croatia, Lithuania, and Luxembourg, the net imports, which amounted to 35.3, 203.1, and 240.8%, respectively, were the most dependent. The behavior of this indicator in the period from 2010–2019 demonstrates its high volatility: in certain periods, the net imports alternate with the net exports, and vice versa, which determines the unsustainability of the European power systems in terms of achieving external independence.
In 2019, the EU average capacity utilization was 35%, which shows an 8% decline over the period from 2010–2019. As it is assumed and proven further, this fact is a consequence of the accelerated penetration of the intermittent renewable energy generation in the power systems. The highest values of the capacity utilization factor were recorded in the conventional power systems, and, in particular, in the power system of Slovenia, which mainly uses nuclear, coal, and hydro generation, at the level of 48.1%; in the power system of France, which is based on nuclear generation, at 47.8%; and in the power system of the Czech Republic, which uses coal and nuclear generation, at 45.1%. The same year, the lowest values of the capacity utilization factors of the power systems on the basis of the intermittent renewable energy generation were recorded in Luxembourg, at 12.2%; Lithuania, at 13.4%; and Denmark, at 22.2%.
The energy efficiency of the generation in the EU in 2019 was 37.6%, and, compared to 2010, it increased by 3%, which was a consequence of the development of power generation technologies. The highest energy efficiencies of generation were recorded in the power systems using both green and gas generation, such as those of Luxembourg (67.2%), Malta (54.9%), and Ireland (52.3%). The lowest efficiencies were observed in the power systems using primarily conventional nuclear and coal power generation, such as those of the Czech Republic (24.9%), Bulgaria (24.5%), and Estonia (29.1%) (where it is based mainly on oil shale-fired generation).
In 2019, the EU share of RESs in the inputs of the primary energy sources for electricity generation was 19.4%, and, compared to 2010, it increased by 8%. In the same year, the share of OFFs in the inputs of the primary energy sources for electricity generation was 41.7% and, compared to 2010, it decreased by 9.1%. The leaders in the use of clean energy sources in power systems were Lithuania, Austria, and Luxembourg, where the shares of RESs amounted to 61.4, 59.7, and 58.9% of all the sources of electricity, respectively. Cyprus, Malta, and the Czech Republic were outsiders in the use of clean energy sources, the shares of which were 4.5, 5.7, and 7.4% of all the sources of power generation, respectively. The shares of OFFs prevailed in the electricity systems of Cyprus, Malta, and Poland, where they were 95.5, 94.3, and 89.9%, respectively, while the lowest values of this indicator were in Sweden, France, and Finland, where they amounted to 2.0, 7.3, and 22.4%, respectively. As can be seen, higher shares of RESs were observed in import-dependent countries and, by contrast, high shares of OFFs were seen in the export-dependent power systems.
The EU GHG emissions per unit of primary energy source of electricity generation amounted to 1.52 t/toe, and decreased, compared to 2010, by 0.33 t/toe, and, compared to 2015, decreased by 0.22 t/toe. The lowest values of GHG emissions per unit of primary energy source (<1 t GHG/toe) took place in power systems with developed nuclear power generation supported by RESs, namely, in those of Sweden, France, Austria, Slovakia, and Spain. The highest values (>2 t GHG/toe) were recorded in power systems with high shares of electricity generation based on organic fossil fuels, without consideration for the shares of RESs, such as those of Estonia, Poland, Greece, Cyprus, Germany, Bulgaria, Czech Republic, Netherlands, and Romania.
An integral assessment of the dimensions of the sustainabilities of the power systems made it possible to establish that, in 2019:
  • The leaders in terms of the social dimension were Sweden, France, and Ireland, while Slovakia, Poland, and Bulgaria were the outsiders;
  • The leaders in terms of the economic dimension were Austria, Sweden, and Finland, which produced electricity from conventional inorganic sources of energy (nuclear and hydro energy), while Cyprus, Malta, and Greece were the outsiders, the first of them mainly using oil, and the other two mainly using gas generation;
  • The leaders in terms of the environmental dimension were Sweden, France, and Austria, while Estonia, Poland, and Greece were the outsiders.
To determine the composite PSS index, the weight of each indicator and the dimensions were calculated using the entropy method. In 2019, the dimensions showed the following values: a total of 58% for the environmental dimension; 24% for the economic dimension; and 18% for the social dimension.
From 2010–2019, an increase in the importance of the environmental dimension, from 52 to 54% in 2015, and to 58% in 2019, was recorded. Moreover, at the same time, a decrease in the significance of the economic dimension was recorded, from 32% in 2010, to 27% in 2015, and to 24% in 2019. The significances of the social dimension varied from 16 to 19%.
According to the calculations, in 2019, the power systems of Sweden, France, and Austria had the highest PSS indexes, while the power systems of Estonia, Poland, and Greece had the lowest values of the index. Compared to 2010, some countries improved their positions, in particular, Denmark (by 13 points), Luxembourg (by 9 points), Lithuania (by 8 points), Finland (by 2 points), and Romania (by 1 point). The positions of Estonia, Greece, France, Austria, Poland, and Sweden remained unchanged, while the rest of the member states lost their positions, with the worst situations being observed in Portugal (by −5 points), Latvia (by −5 points), and Hungary (by −4 points).

3.2. Impact Assessment of Local Power System Sustainability Indicators

It is assumed that the determining factor in the PSS index differentiation is the differences in the energy mix: the different energy sources affect the LPSS indicators in different ways. This assumption can be confirmed or refuted using a regression analysis, the results of which are shown in Table 3.
The regression analysis yielded the following results: The GHG emissions per unit of primary energy source depends on seven factors. The largest increasing effects on the amounts of emissions are exerted by coal, oil, and gas generation, while solar, wind, nuclear, and hydro generation have decreasing effects. The R2 explains the 90.8% dependency of the model of the GHG emissions per unit of primary energy source on the energy mix. The MAPE is also acceptable, amounting to 11.3%, and the F-test is significant. Biofuel-based generation was excluded from the model, as it did not show significant impacts, with a p-value of 0.899.
The energy efficiency of the generation is also determined by seven factors. The development of gas, hydro, wind, and solar energy sources has a positive effect, while increases in the shares of coal and nuclear generation have the opposite effect. An increase in the capacity utilization also exerts a positive effect. The oil and biofuels, with p-values of 0.661 and 0.465, respectively, were excluded from the model. The R2 explains the 79.8% dependency of the energy efficiency of the generation on the energy mix and the level of the capacity utilization. The MAPE amounts to 5.4%, and the F-test is significant, which confirms the feasibility of this model.
The capacity utilization factor, similar to the previous two models, is determined by seven factors, among which only an increase in the electricity consumption per GDP at PPP has a positive effect, while gas, oil, wind, solar, and biofuels exert negative effects. An increase in the energy efficiency of generation also has a negative impact on this indicator. Consequently, a causal loop is formed: a growth in the capacity utilization increases the efficiency of the generation, which, in turn, reduces the capacity utilization. Coal, hydro, and nuclear sources of generation were excluded from the model as insignificant factors, with p-values of 0.1636, 0.0605, and 0.1938, respectively. The capacity utilization factor of 81.1% was determined by the combination of the studied factors, the MAPE is minimal, and the F-test is significant.
The import dependency of the power systems is determined by six factors. The export dependency and the energy efficiency of the generation have a direct positive impact on this indicator. The development of such sources of generation as hydro and wind energy, as well as an increase in the capacity utilization, lead to a decrease in the import dependency. The other sources of power generation do not significantly affect the values of this indicator. The adequacy of this model is confirmed by a high R2, a relatively low MAPE value, and a significant F-test.
The export dependencies of the power systems change under the influence of four indicators. A decrease in this indicator occurs under the influence of an increase in the generation efficiency, while an increase in the share of the wind generation, the capacity utilization, and the share of imports have direct positive effects on its growth. Consequently, there is a second causal loop: the growth in the import dependency causes export dependency, and vice versa. The adequacy of the model of the export dependencies of the power systems is confirmed by a relatively high R2, a relatively low MAPE value, and a significant F-test.
The following two models show that an increase in the commercial electricity consumption per unit of GDP causes an increase in the specific household electricity consumption per capita, which, in turn, necessitates an increase in the share of hydroelectricity. However, these relationships are considered but not modeled because of the low R2 values and a high MAPE, and they require additional factors to be searched for their explanation.
The revealed causal relationships between the local indicators are visualized in Figure 2.
Thus, the results of the impact assessment of the LPSS indicators show that the energy sources have contradictory effects on the achievement of different sustainable development goals. The most controversial of these are RESs. For example, the development of hydropower exerts a beneficial effect on the energy efficiency, which results in decreases in the GHG emissions and the import dependency simultaneously, which leads to a decrease in the capacity utilization and an increase in the export dependencies of the power systems. The development of wind energy has the same beneficial consequences; however, this type of energy resource does not cause an increase in the export dependency, but instead leads to a decrease in the import dependency. At the same time, the development of solar energy does not yet exert an impact on the external dependency of the power systems. In terms of the biofuels, it can be concluded that these energy sources do not have any significant effects on the changes in the LPSS indicators, except for lowering the level of the capacity utilization.
In terms of the conventional fossil energy sources, the following conclusions can be drawn: Coal has a negative impact on the energy efficiency of generation and causes an increase in the GHG emissions. Gas has a positive effect, which results in an increase in the energy efficiency of the generation, but, at the same time, reduces the capacity utilization and causes a slight increase in the specific GHG emissions. Nuclear energy affects the values of the energy efficiency of the generation negatively, but it also causes a decrease in the specific GHG emissions, whereas oil leads to an increase in the specific GHG emissions, and a decrease in the level of the capacity utilization.

3.3. Optimization of Electricity Lifecycle by Local Power System Sustainability Indicators

Table 4 presents the current and forecast LPSS indicators, as well as the scenarios for the single-objective and multiobjective optimizations of the sustainability of the European power systems.
In 2019, the target indicators of the European power system sustainability (EEG = 37.6%, CUF = 41.7%, and GHGPES = 1.52 t CO2 eq./toe) were achieved because of the electricity generation from the OFFs, which amounted to 41.7%, of which 20.1% were accounted for by coal, 19.4% by gas, and 22.4% by RESs, with the share of the intermittent RESs amounting to 8.1%. In 2020, the EU experienced a decrease in the share of coal generation, by 3.3%, and an increase in the share of RES generation, by 4.3%, with the share of the intermittent RESs accounting for 1.3%. This led to a 0.7% increase in the share of gas, and a 1.6% decrease in the share of nuclear energy. In this regard, the values of the target indicators of the European power system in 2020 could be 42.6 and 41.7%, and 1.31 t CO2 eq./toe, respectively. If the current trends persist in 2021, the European power system will see a further shift from coal generation (its forecast share will decrease by 0.8%) towards the development of RESs (their share will grow by 1.5%, with the share of the intermittent RESs increasing by 1.1%). This will lead to a further increase in the energy efficiency of the generation, to 44%, a decline in the capacity utilization, to 41.5%, a decrease in the GHG emissions per unit of primary energy source, to 1.26 t CO2 eq./toe, and a growth in the external dependency of the power systems to 15.6%.
The scenarios for minimizing the GHG emissions per unit of primary energy source involves their decrease to 0.86 t CO2 eq./toe, which is due to the abandonment of coal generation technologies (the share of which will decrease to 2%) in favor of gas and oil technologies (the shares of which will amount to 26% and 9%, respectively). This will lead to a growth in the energy efficiency of the generation to 47%, and an increase in the capacity utilization to 42%, but it will also cause an increase in the external dependency of the power system to 33%. A decrease in the levels of the utilizations of the nuclear and hydro capacities cause, in comparison with the first scenario, an increase in the share of coal generation to 10%, and the GHG emissions per unit of primary energy, to 1.24 t CO2 eq./toe, as well as a fall in the energy efficiency of the generation to 43%, with a simultaneous decrease in the external dependency of the European power system to 29%. An increase in the capacity of the intermittent renewable energy generation at the high levels of utilization of the nuclear and hydropower generation capacities minimizes the GHG emissions to almost zero, while ensuring an increase in the energy efficiency of the generation to 71%, a decrease in the capacity utilization to 28%, and an increase in the external dependency of the power system to 43%. Thus, the scenario for minimizing GHG emissions per unit of primary energy is possible via the extensive exploitation of conventional inorganic energy sources, with the simultaneous expansion of the capacity of the intermittent RES generation.
The scenarios for maximizing the energy efficiency of the generation imply its increase, to 49%, with the complete abandonment of coal-based power generation technologies, and a simultaneous decrease in the specific weight of the nuclear power generation in favor of gas-fired generation. This achieves the value of the GHG emissions per unit of primary energy source of 1.01 t CO2 eq./toe, a capacity utilization of 41%, and an external dependency of the power system of 38%. A decrease in the possible level of hydroelectric generation will lead to a decrease in the energy efficiency, to 47%, while the GHG emissions per unit of primary energy source and the capacity utilization will remain unchanged, and the external dependency of the power system will fall to 33%. The expansion of the capacity of the intermittent RES generation provides for an increase in the energy efficiency to 81%, and a decrease in the GHG emissions per unit of primary energy source to 0.19 t CO2 eq./toe, with a simultaneous reduction in the capacity utilization to 22%, and a rapid increase in the external dependency of the power system to 103%.
The scenarios for maximizing the capacity utilization envisage the abandonment of intermittent RESs and oil products in favor of conventional energy resources, such as coal, gas, hydropower, and nuclear energy, which will allow for the achievement of a 55% capacity utilization. A reduction in the utilization of the nuclear and hydro generation capacities will lead to a decrease in the capacity utilization by only 1%, which is due to an additional increase in gas-fired generation. In this group of scenarios, the energy efficiency of the generation varies, from 57 to 62%, as do the GHG emissions per unit of primary energy source, from 2.39 t CO2 eq./toe to 2.52 t CO2 eq./toe. The maximization of the capacity utilization leads to the absence of the external dependency of the power system.
The scenarios for minimizing the external dependency of the power system envisage its reduction to 0, which is due to the abandonment of gas-, hydro-, and wind-power generation sources. Similar to the previous group of scenarios, minimizing the external dependency of the power system will cause a sharp growth in the GHG emissions per unit of primary energy source, to 2.27–2.46 t CO2 eq./toe, a decrease in the energy efficiency of generation, to 30%, but will cause an increase in the level of capacity utilization, to 48%.
Subsequently, the function of the minimization of the external dependency was excluded from the multiobjective optimization of the power system sustainability (fitness function failure) because of the impossibility of finding an optimal solution for implementing other optimization functions.
As can be seen, different scenarios lead to different results in terms of the target indicators, which necessitates a search for a compromise between them.
The multiobjective optimization scenarios allow for a set of options for the sustainable development of power systems:
-
From the zero level of the GHG emissions per unit of primary energy source, with the shares of RESs and OFFs in the energy mix at 64 and 20%, respectively, the energy efficiency of generation at 81%, and the capacity utilization at 17%, with the external dependency of the power systems at 95%;
-
To the GHG emissions per unit of primary energy source at 1.56 t CO2 eq./toe; the shares of RESs and OFFs in the energy mix at 44 and 47%, respectively; the energy efficiency of generation at 57%; the utilization of capacities at 32%; with the external dependency of the power systems at 78%.
All scenarios for the multiobjective optimization of the sustainable development of the European power system indicate:
  • The need for a sharp increase in the share of RES generation;
  • The possibility for a significant increase in the energy efficiency of the generation compared to the current level;
  • A reduction in the capacity utilization below the current level;
  • The need to increase the external electricity flows.
Comparing the current values with those of the multiobjective optimization scenarios allows for tracking the changes in the sustainability of the European power system. Thus, in 2019, in terms of the GHG emissions per unit of primary energy source, the sustainability was classified between Development Stages 9 and 10, but, at the same time, it had a significantly lower energy efficiency of generation because of the high share of coal and nuclear generation, and the low share of RES generation. In 2020, there was a shift to Stages 8 and 9, while the energy efficiency of the generation was increasing. According to the forecast, in 2021, Development Stage 8 will be reached, and a further increase in the energy efficiency of the generation, and an increase in the external dependence of the energy systems, will occur. As can be seen, the still low share of RES generation, and the limitations of the external electricity flows, are the main constraining factors in the development of the sustainability of the European power system.
In each case, for an individual power system, the choice of a development scenario will depend on the fleet of operating power units, the natural and climatic conditions of the functioning of the power system, the level and possibilities of its integration, and, of course, the state energy policy for sustainable development. The proposed algorithm can be applied with consideration to the particular limitations, e.g., Scenario 11 demonstrates an option for multiobjective optimization in the absence of the nuclear generation capacity in the power system.

4. Discussion and Conclusions

This study proposes a methodological approach for assessing the power system sustainability, which includes the following stages:
  • An assessment of the composite indicators, namely, the PSS index, in order to compare the national power systems at the regional level, and to track the progress in their sustainable development. The PSS index is comprised of three dimensions and eight LPSS indicators;
  • A regression analysis, in order to determine the impact of the energy mix on the LPSS indicators, and to forecast the changes in them. The causal diagram reveals the contradictions between the LPSS indicators and the energy mix;
  • The single-objective optimization and multiobjective optimization of the LPSS indicators, in order to support the decision making by governments on the future changes in the energy mix.
Inclusive sustainable energy development is one of the key challenges in the transition to a climate-neutral EU economy. However, the power systems of the EU member states are unique. Their differentiations are conditioned by climatic, historical, and political factors, which determine their unequal contributions to ensuring the sustainable functioning of the European power system. As a result, the energy mixes differ significantly across the EU member states. Lithuania has the largest share of RESs, at 61%, of which 35% are biofuels; Austria has 60%, of which 39% is hydropower; Luxembourg has 59%, of which 40% are biofuels; Denmark has 59%, of which 30% are biofuels, and 27% is wind power; and Croatia has 50%, of which 27% is hydropower, and 16% are biofuels. The largest share of OFFs are accounted for by Cyprus, at 96%, of which all are oil products; Malta has 94%, of which 91% is gas; Poland has 90%, of which 89% is coal; Greece has 83%, of which coal and gas amount to 34% each; and the Netherlands has 76%, of which 57% is gas.
The differences in the energy mixes are considered a determining factor in the differentiation of the EU countries by the PSS index and the LPSS indicators. The results of the study allow for the identification of the following features of the functioning of European power systems:
  • High levels of household electricity consumption per capita is observed in developed countries that use mainly inorganic energy sources (both fossil fuels and RESs), while developing countries, which primarily use fossil fuel power generation, have low levels of household electricity consumption per capita;
  • The commercial electricity consumption per GDP is higher in countries that mainly use solid fuel sources (organic and inorganic) for electricity generation, while countries where the power generation is dominated by RESs and/or gas sources demonstrate lower values;
  • The export dependency is a characteristic of power systems that make primary use of fossil fuels (organic and inorganic), while the import dependency is recorded in the power systems with the most RESs;
  • The countries that generate electricity from solid fuels (organic and inorganic) demonstrate higher values of capacity utilization, while, for countries that mainly use RESs and gas, the values of the capacity utilization are significantly lower;
  • The energy efficiency of the generation, on the contrary, is significantly higher for countries using RESs and gas, while, for countries producing electricity from solid fossil fuels, it is low;
  • The countries using inorganic fuels demonstrate the lowest GHG emissions per unit of primary energy source, while the countries where the power generation is dominated by fossil fuels have the highest values of this indicator.
As a result, the countries primarily generating electricity from conventional inorganic sources (nuclear and hydro) have the highest PSS indexes, and they are followed by countries where the power generation is dominated by RESs, while those using mainly fossil fuels, especially solid ones, have the lowest values. Thus, it is possible to confirm the assumptions about the effect of the energy mix on the sustainability of the functioning of the power systems.
To determine the character of the influence of the individual power generation sources on the LPSS indicators, a multistage regression analysis was used, which made it possible to determine the following:
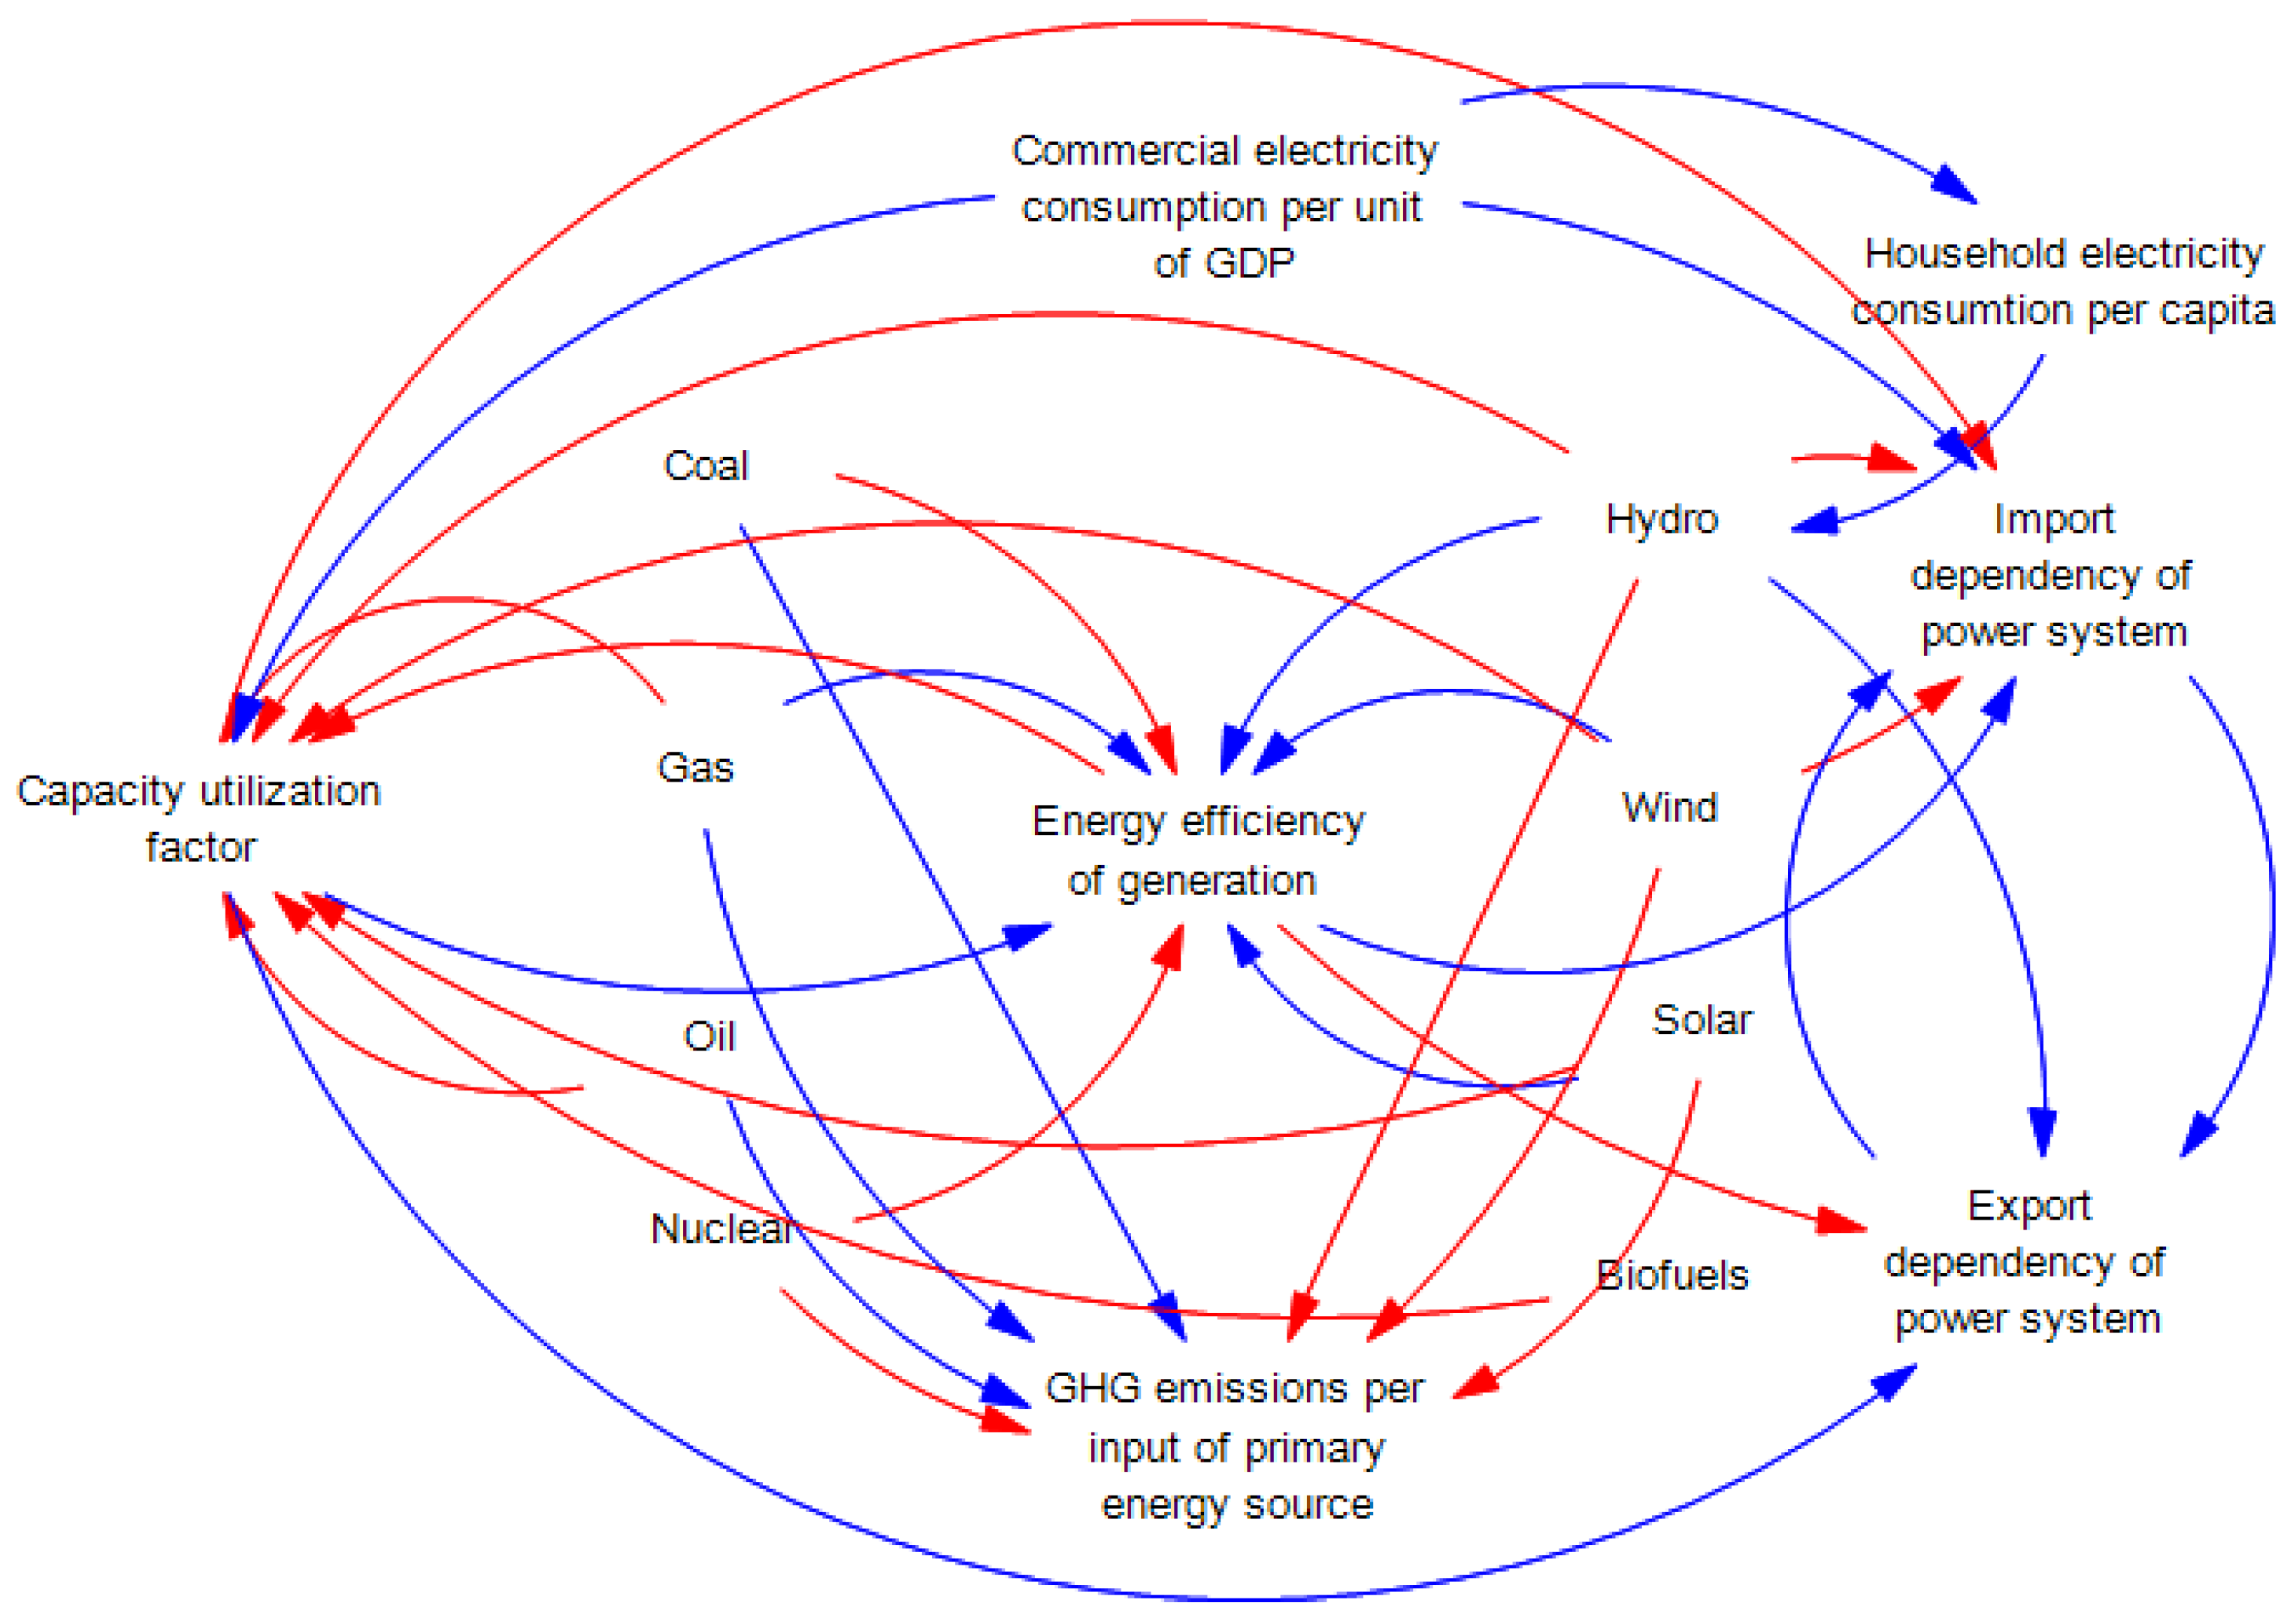
  • Coal has a negative effect on the energy efficiency of generation, and a positive effect on the GHG emissions per unit of primary energy source;
  • Gas has a positive impact on the energy efficiency of generation and GHG emissions per unit of primary energy source, and a negative impact on the capacity utilization;
  • Oil has a positive effect on the GHG emissions per unit of primary energy source, and a negative effect on the capacity utilization;
  • Hydropower has an adverse impact on the GHG emissions per unit of primary energy source, the capacity utilization, and the import dependency, while exerting a positive impact on the energy efficiency of the generation and the export dependency;
  • Wind energy has a negative impact on the GHG emissions per unit of primary energy source, the capacity utilization, and the import dependency, while exerting a positive impact on the energy efficiency of the generation;
  • Solar energy has an adverse impact on the GHG emissions per unit of primary energy source and the capacity utilization, while exerting a positive impact on the energy efficiency of the generation;
  • Biofuels have a negative impact on the capacity utilization;
  • Nuclear energy has a negative impact on the GHG emissions per unit of primary energy source and the energy efficiency of the generation.
Thus, the contradictory influences of the different energy sources on the LPSS indicators have been proven.
The scenarios of the single-objective optimization allow for the determination of the interrelations between the target LPSS indicators:
  • The scenarios for minimizing GHG emissions per unit of primary energy source and maximizing the energy efficiency of the generation are considered complementary, and will lead to a decrease in the capacity utilizations, and to an increase in the external dependency of the power systems;
  • The scenarios for maximizing the capacity utilization and minimizing the external dependency can also be considered complementary because they lead to a decrease in the energy efficiency of the generation, and to an increase in the GHG emissions per unit of primary energy source.
Consequently, there are two groups of scenarios providing opposite results.
The multiobjective optimization scenarios allow for a tradeoff between the three indicators, namely, the GHG emissions per unit of primary energy source, the energy efficiency of the generation, and the capacity utilization. At the same time, it is shown that a compromise between these indicators is possible only with an increase in the external dependency of the power system (an increase in the volume of the external electricity flows). With zero GHG emissions per unit of primary energy source, not only the maximum energy efficiency of the generation, but also the minimum level of the capacity utilization, are achieved. At the same time, the share of RESs in the energy mix should be more than 60%. A decrease in the target values of the LPSS indicators causes an increase in the GHG emissions per unit of primary energy source because of a reduction in the share of RESs, which leads to a gradual decrease in the energy efficiency of the generation, but to a significant increase in the level of the capacity utilization.
Nevertheless, in spite of the significant reduction in the GHG per unit of primary energy source, the current level of the European power system sustainability is considered to be nonoptimal because of the still insufficient levels of RES generation and the low level of the external electricity flows.
Thus, the presented methodological approach for assessing the sustainability of power systems makes it possible to compare the power systems in Europe and can act as a tool for making managerial decisions by policymakers with regard to the directions of the energy policy and its consequences.

Author Contributions

Conceptualization, D.W. and T.S.; methodology, D.W., M.K. and T.S.; validation, M.K. and T.S.; formal analysis, V.K. and T.S.; project administration, I.G. and V.K.; investigation, V.K. and T.S.; data curation, A.B. and T.S.; writing—original draft preparation, V.K., T.S. and O.D.; writing—review and editing, I.G., A.B. and T.S.; visualization, T.S. and O.D.; supervision, M.K. All authors have read and agreed to the published version of the manuscript.

Funding

This research received no external funding.

Institutional Review Board Statement

Not applicable.

Informed Consent Statement

Not applicable.

Data Availability Statement

Publicly available datasets were analyzed in this study. This data can be found here: https://ec.europa.eu/eurostat/data/database (accessed on 1 December 2021).

Conflicts of Interest

The authors declare no conflict of interest.

Appendix A

Figure A1. Visualization landscape of the problem of “power system sustainability”. Source: developed by the authors based on [16] with the use of VOSviewer [17].
Sustainability 14 02236 g0a1

Appendix B

Table A1. Sustainability assessment of European power systems in 2010.
CountryHECcapitaCECGDPSocial DimensionExtDep CUFEEGRESOFFEconomic DimensionGHG PESEnvironmental DimensionPSS Index
MWh/CapitakWh/Eurow.a.c.R%%%%%w.a.c.RtCO2 eq./toew.a.c.Rw.a.c.R
BE1.840.1950.49185.958.233.224.532.50.6261.0380.8330.714
BG1.420.1950.442532.953.120.784.362.60.38212.9590.38230.3922
CZ1.440.1750.472025.848.921.143.565.10.37232.5090.49170.4520
DK1.880.1190.63410.333.030.8920.769.90.45182.5940.47190.4917
DE1.730.1600.54118.044.434.169.060.80.51142.6460.45200.4818
EE1.520.2220.402636.753.819.766.593.50.30264.5820.00270.1627
IE1.880.1120.6427.039.844.137.592.50.47152.6480.45210.4916
GR1.630.1470.5583.542.837.107.892.00.45174.0140.13250.3025
ES1.630.1500.541013.833.843.1318.548.30.5781.2350.7850.685
FR2.500.1580.63313.452.429.685.910.00.6170.3101.0010.822
HR1.550.1400.55712.441.544.3138.661.40.6742.4100.51150.5710
IT1.180.1440.50166.632.342.4213.483.60.47162.0390.60110.5412
CY2.120.1480.6054.338.934.940.699.40.37223.2340.32240.3823
LV0.910.1500.46212.429.637.1730.769.30.54112.1690.56130.5413
LT0.820.1210.501574.418.435.549.590.50.17272.5760.47180.3824
LU1.620.1650.521344.630.647.453.991.40.35242.4300.50160.4619
HU1.120.1380.50144.047.430.647.948.10.53121.8510.6490.589
MT1.420.1360.5598.542.227.120.0100.00.32252.0560.59120.5015
NL1.390.1480.52122.551.039.796.784.20.53132.2790.54140.5314
AT2.110.1570.5968.238.048.3449.945.60.7721.3970.7560.733
PL0.750.1470.45229.853.928.345.194.90.41204.2180.09260.2526
PT1.370.1600.49174.132.651.0733.963.50.6751.5030.7270.676
RO0.560.1140.481917.535.030.1613.464.20.42192.7240.43220.4421
SL1.570.2000.452321.758.825.7513.845.60.54101.9790.61100.5611
SK0.810.1890.38271.440.429.4210.431.80.5591.1020.8140.667
FI4.280.3790.44249.859.239.7021.944.20.7031.6500.6980.658
SE4.920.2810.6917.146.541.1135.07.30.8010.3990.9820.871
Source: calculated by the authors based on Eurostat database [38]. Notes: w.a.c.—weighted average coefficient of a dimension or the composite index; R—rank.
Table A2. Sustainability assessment of European power systems in 2015.
CountryHECcapitaCECGDPSocial DimensionExtDep CUFEEGRESOFFEconomic DimensionGHG PESEnvironmental DimensionPSS Index
MWh/CapitakWh/Eurow.a.c.R%%%%%w.a.c.RtCO2 eq./toew.a.c.Rw.a.c.R
BE1.480.1780.402333.751.521.376.759.40.47172.7590.33230.3823
BG1.360.1490.431823.743.822.436.960.90.44222.2780.46170.4519
CZ1.800.0980.59413.823.640.6743.241.50.5861.8120.58130.588
DK1.590.1320.50913.436.435.2716.460.90.50142.7190.34220.4122
DE1.310.1780.382617.940.619.6411.487.00.37233.7140.08250.2126
EE1.680.0730.6227.033.548.0216.382.60.50132.5490.39210.4617
IE1.620.1530.46139.731.342.8013.985.80.44213.7180.08260.2525
GR1.510.1330.481111.630.039.7221.847.60.53111.4610.6770.607
ES2.370.1360.60319.350.028.516.86.70.6340.1971.0010.822
FR1.470.1240.491043.327.348.4442.757.30.5692.2790.46180.4914
HR1.090.1310.43199.127.643.8223.972.60.49151.7620.59110.5312
IT1.790.1270.5375.029.536.393.996.10.35243.1350.23240.3224
CY0.890.1270.412226.921.634.7739.460.60.46181.6420.6280.5411
LV0.910.1060.4516117.415.751.4733.262.20.34252.0020.53150.4616
LT1.760.1130.555127.515.659.5419.767.40.31262.1400.49160.4518
LU1.100.1280.431735.540.135.948.735.50.52121.7200.60100.5510
HU1.490.1160.51870.622.350.063.496.60.27271.7630.59120.4915
MT1.340.1270.47123.337.139.766.780.80.46192.5440.39200.4221
NL2.010.1360.5562.630.150.1959.934.00.7521.1410.7550.723
AT0.740.1300.38247.850.430.289.290.80.48164.0260.00270.2027
PL1.150.1460.41218.030.543.9030.167.60.54101.8610.57140.5313
PT0.610.0960.422023.531.830.5818.458.70.44202.3350.44190.4420
RO1.550.1950.38259.151.330.5314.838.30.6251.6420.6290.589
SL0.930.1580.36272.439.527.8013.124.90.5780.9490.8030.665
SK3.820.3290.451520.447.144.1730.525.50.7231.1200.7640.694
FI4.410.2260.72119.646.637.4338.12.50.7710.2300.9920.881
SE1.480.1780.402333.751.521.376.759.40.47172.7590.33230.3823
Source: calculated by the authors based on Eurostat database [38]. Notes: w.a.c.—weighted average coefficient of a dimension or the composite index; R—rank.

References

  1. Brundtland, G.; Khalid, M.; Agnelli, S.; Al-Athel, S.; Chidzero, B.; Fadika, L.; Singh, M. Our Common Future; International Institute for Environment and Development: London, UK, 1987. [Google Scholar]
  2. Junejo, F.; Saeed, A.; Hameed, S. Energy Management in Ocean Energy Systems. Compr. Energy Syst. 2018, 5, 778–807. [Google Scholar] [CrossRef]
  3. van Staden, M. The Sustainable Energy Transition Cities and Local Governments in Focus. In Accelerating the Transition to a 100% Renewable Energy Era; Uyar, T., Ed.; Springer: Edinburgh, UK, 2020; Volume 74, pp. 155–168. [Google Scholar] [CrossRef]
  4. Gungor, A.; Akyuz, A.O.; Tuncer, A.D.; Şirin, C.; Zaman, M.; Gungor, C. Modelling and simulation of circulating fluidized bed biomass gasifiers in view of Industry 4.0. Industry 4.0 2019, 4, 150–152. [Google Scholar]
  5. Block, C.; Van Gerven, T.; Vandecasteele, C. Industry and energy sectors in Flanders: Environmental performance and response indicators. Clean Technol. Environ. Policy 2007, 9, 43–51. [Google Scholar] [CrossRef]
  6. Tomas, L.; Evans, N.; Doyle, T.; Skamp, K. Are first year students ready for a flipped classroom? A case for a flipped learning continuum. Int. J. Educ. Technol. High Educ. 2019, 16, 5. [Google Scholar] [CrossRef] [Green Version]
  7. Böhm, H.; Moser, S.; Puschnigg, S.; Zauner, A. Power-to-hydrogen & district heating: Technology-based and infrastructure-oriented analysis of (future) sector coupling potentials. Int. J. Hydrogen Energy 2021, 46, 31938–31951. [Google Scholar] [CrossRef]
  8. World Energy Council. World Energy Trilemma Index 2020; World Energy Council: London, UK, 2020; Volume 52, pp. 21–99. [Google Scholar]
  9. Jovanović, M.; Afgan, N.; Radovanović, P.; Stevanović, V. Sustainable development of the Belgrade energy system. Energy 2009, 34, 532–539. [Google Scholar] [CrossRef]
  10. Afgan, N.H.; Carvalho, M.G.; Hovanov, N.V. Modelling of energy system sustainability index. Therm. Sci. 2005, 9, 3–16. [Google Scholar] [CrossRef]
  11. United Nations. Transforming our World: The 2030 Agenda for Sustainable Development. In Outcome Document for the United Nations Summit to Adopt the Post 2015 Development Agenda; United Nations: New York, NY, USA, 2015. [Google Scholar]
  12. Herzog, H.; Smekens, K. Cost and economic potential. In IPCC Special Report on Carbon Dioxide Capture and Storage; Cambridge University Press: Cambridge, UK, 2005; p. 24. [Google Scholar]
  13. International Energy Agency. World Energy Outlook 2021; International Energy Agency: Paris, France, 2021. [Google Scholar] [CrossRef]
  14. Sannino, A.; Hammons, T.; McConnach, J. Global power systems for sustainable energy development. In Proceedings of the IEEE Power Engineering Society General Meeting, Denver, CO, USA, 6–10 June 2004; pp. 2296–2297. [Google Scholar] [CrossRef]
  15. Janicek, F.; Simunek, P.; Fecko, S.; Breza, J.; Hanzel, A. Electrical power system sustainability through Demand Side Management and technology foresight. In Proceedings of the 19th World Energy Congress, Sydney, Australia, 5–9 September 2004; pp. 3–15. [Google Scholar]
  16. Web of Science Core Collection. Available online: https://www.webofscience.com/wos/woscc/summary/189ec449-a71b-49c5-b8e6-cd97bf2df52e-1acf4c75/relevance/1 (accessed on 5 December 2021).
  17. VOS Viewer (Version 1.6.17). Visualizing Scientific Landscape. Centre for Science and Technology Studies, Leiden University, The Netherlands. 2021. Available online: https://www.vosviewer.com/ (accessed on 10 December 2021).
  18. Kadiyala, A.; Kommalapati, R.; Huque, Z. Quantification of the Lifecycle Greenhouse Gas Emissions from Nuclear Power Generation Systems. Energies 2016, 9, 863. [Google Scholar] [CrossRef]
  19. Santoyo-Castelazo, E.; Azapagic, A. Sustainability assessment of energy systems: Integrating environmental, economic and social aspects. J. Clean. Prod. 2014, 80, 119–138. [Google Scholar] [CrossRef]
  20. ISO 14040:2006 Environmental Management—Life Cycle Assessment—Principles and Framework. International Organization for Standardization. 2006. Available online: https://www.iso.org/standard/37456.html (accessed on 1 December 2021).
  21. Shaaban, M.; Scheffran, J.; Böhner, J.; Elsobki, M.S. Sustainability Assessment of Electricity Generation Technologies in Egypt Using Multi-Criteria Decision Analysis. Energies 2018, 11, 1117. [Google Scholar] [CrossRef] [Green Version]
  22. San Miguel, G.; Cerrato, M. Life Cycle Sustainability Assessment of the Spanish Electricity: Past, Present and Future Projections. Energies 2020, 13, 1896. [Google Scholar] [CrossRef] [Green Version]
  23. Matteson, S. Methods for multi-criteria sustainability and reliability assessments of power systems. Energy 2014, 71, 130–136. [Google Scholar] [CrossRef]
  24. Cîrstea, S.D.; Moldovan-Teselios, C.; Cîrstea, A.; Turcu, A.C.; Darab, C.P. Evaluating Renewable Energy Sustainability by Composite Index. Sustainability 2018, 10, 811. [Google Scholar] [CrossRef] [Green Version]
  25. Gómez-Camacho, C.E.; Ruggeri, B. Energy Sustainability Analysis (ESA) of Energy-Producing Processes: A Case Study on Distributed H2 Production. Sustainability 2019, 11, 4911. [Google Scholar] [CrossRef] [Green Version]
  26. Liu, G. Development of a general sustainability indicator for renewable energy systems: A review. Renew. Sustain. Energy Rev. 2014, 31, 611–621. [Google Scholar] [CrossRef]
  27. Fuentes, S.; Villafafila-Robles, R.; Rull-Duran, J.; Galceran-Arellano, S. Composed Index for the Evaluation of Energy Security in Power Systems within the Frame of Energy Transitions—The Case of Latin America and the Caribbean. Energies 2021, 14, 2467. [Google Scholar] [CrossRef]
  28. Ma, L.; Chong, C.; Zhang, X.; Liu, P.; Li, W.; Li, Z.; Ni, W. LMDI Decomposition of Energy-Related CO2 Emissions Based on Energy and CO2 Allocation Sankey Diagrams: The Method and an Application to China. Sustainability 2018, 10, 344. [Google Scholar] [CrossRef] [Green Version]
  29. Roldán-Blay, C.; Miranda, V.; Carvalho, L.; Roldán-Porta, C. Optimal Generation Scheduling with Dynamic Profiles for the Sustainable Development of Electricity Grids. Sustainability 2019, 11, 7111. [Google Scholar] [CrossRef] [Green Version]
  30. Wu, D.; Yang, Z.; Wang, N.; Li, C.; Yang, Y. An Integrated Multi-Criteria Decision Making Model and AHP Weighting Uncertainty Analysis for Sustainability Assessment of Coal-Fired Power Units. Sustainability 2018, 10, 1700. [Google Scholar] [CrossRef] [Green Version]
  31. Wu, Z.; He, T.; Sun, L.; Li, D.; Xue, Y. The Facilitation of a Sustainable Power System: A Practice from Data-Driven Enhanced Boiler Control. Sustainability 2018, 10, 1112. [Google Scholar] [CrossRef] [Green Version]
  32. Chen, C.; Yu, L.; Zeng, X.; Huang, G.; Li, Y. Planning an Energy–Water–Environment Nexus System in Coal-Dependent Regions under Uncertainties. Energies 2020, 13, 208. [Google Scholar] [CrossRef] [Green Version]
  33. Berna-Escriche, C.; Pérez-Navarro, Á.; Escrivá, A.; Hurtado, E.; Muñoz-Cobo, J.L.; Moros, M.C. Methodology and Application of Statistical Techniques to Evaluate the Reliability of Electrical Systems Based on the Use of High Variability Generation Sources. Sustainability 2021, 13, 10098. [Google Scholar] [CrossRef]
  34. Al Shidhani, T.; Ioannou, A.; Falcone, G. Multi-Objective Optimization for Power System Planning Integrating Sustainability Indicators. Energies 2020, 13, 2199. [Google Scholar] [CrossRef]
  35. Junne, T.; Cao, K.-K.; Miskiw, K.K.; Hottenroth, H.; Naegler, T. Considering Life Cycle Greenhouse Gas Emissions in Power System Expansion Planning for Europe and North Africa Using Multi-Objective Optimization. Energies 2021, 14, 1301. [Google Scholar] [CrossRef]
  36. Wang, G.; Tan, Z.; Tan, Q.; Yang, S.; Lin, H.; Ji, X.; Gejirifu, D.; Song, X. Multi-Objective Robust Scheduling Optimization Model of Wind, Photovoltaic Power, and BESS Based on the Pareto Principle. Sustainability 2019, 11, 305. [Google Scholar] [CrossRef] [Green Version]
  37. Masanet, E.; Chang, Y.; Gopal, A.R.; Larsen, P.; Morrow, W.R., III; Sathre, R.; Shehabi, A.; Zhai, P. Life-Cycle Assessment of Electric Power Systems. Annu. Rev. Environ. Resour. 2013, 38, 107–136. [Google Scholar] [CrossRef]
  38. Eurostat Database. European Commission. Available online: https://ec.europa.eu/eurostat/data/database (accessed on 1 December 2021).
  39. Power Query. Microsoft Corp. Available online: https://powerquery.microsoft.com/en-us/ (accessed on 1 December 2021).
  40. IBM SPSS Software. IBM Corp. Available online: https://www.ibm.com/analytics/spss-statistics-software (accessed on 1 December 2021).
  41. Vensim Software. Ventana Systems, Inc. Available online: https://vensim.com/vensim-software/ (accessed on 1 December 2021).
  42. Global Optimization Toolbox. MathWorks, Inc. Available online: https://au.mathworks.com/products/global-optimization.html (accessed on 1 December 2021).
  43. Soundararajan, K.; Ho, H.K.; Su, B. Sankey diagram framework for energy and exergy flows. Appl. Energy 2014, 136, 1035–1042. [Google Scholar] [CrossRef]
  44. Gryshova, I.; Kyzym, M.; Hubarieva, I.; Khaustova, V.; Livinskyi, A.; Koroshenko, M. Assessment of the EU and Ukraine Economic Security and Its Influence on Their Sustainable Economic Development. Sustainability 2020, 12, 7692. [Google Scholar] [CrossRef]
  45. Arora, J.S. Multi-Objective Optimum Design Concepts and Methods. Introduction to Optimum Design, 4th ed.; Academic Press: Cambridge, MA, USA, 2017; pp. 771–794. [Google Scholar] [CrossRef]
  46. Wang, Q.; Yuan, X.; Zhang, J.; Gao, Y.; Hong, J.; Zuo, J.; Liu, W. Assessment of the Sustainable Development Capacity with the Entropy Weight Coefficient Method. Sustainability 2015, 7, 13542–13563. [Google Scholar] [CrossRef] [Green Version]
  47. Chen, Q.; Balian, A.; Kyzym, M.; Salashenko, T.; Gryshova, I.; Khaustova, V. Electricity Markets Instability: Causes of Price Dispersion. Sustainability 2021, 13, 12343. [Google Scholar] [CrossRef]
  48. Energy Supply Technologies Data. Energy Technology Systems Analysis Program. Technology Collaboration Programme of the International Energy Agency. Available online: https://iea-etsap.org/index.php/energy-technology-data/energy-supply-technologies-data (accessed on 1 December 2021).
  49. Mid-Term Adequacy Forecast 2020. ENTSO-E 2020. Available online: https://www.entsoe.eu/outlooks/midterm/ (accessed on 1 December 2021).
  50. von der Leyen, U. A Union That Strives for More—My Agenda for Europe, European Commission. 2019. Available online: https://ec.europa.eu/commission/sites/beta-political/files/political-guidelines-next-commission_en.pdf (accessed on 1 December 2021).
Figure 1. Aggregated model of electricity lifecycle. Source: developed by the authors using Sankey diagram of energy flows [43]. GHGPES: greenhouse gas emissions per unit of primary energy source; share of OFFs: share of organic fossil fuels in the total primary energy consumed by the power system; RES: share of RESs in the total primary energy consumed by the power system; CUF: capacity utilization factor; ExtDep: external dependency of power system; EEG: energy efficiency of generation; HHECcapita: household electricity consumption per capita; CECGDP: commercial electricity consumption per GDP.
Sustainability 14 02236 g001
Figure 2. Diagram of causal relationships between the LPSS indicators. Source: designed by the authors on the basis of the above research results. The blue arrows indicate positive impacts, and the red arrows indicate negative impacts.
Sustainability 14 02236 g002
Table 1. The general design of the LCA of power system sustainability.
Stage of LCAAttributes
Goal and Scope DefinitionThe general goal: to assess the possibilities for minimizing the environmental consequences of the operation of power systems without hindering socioeconomic development.
The system boundaries: domestic energy flows, from the acquisition of primary energy resources to the final consumption of electricity, and the GHG emissions released into the environment from electricity generation.
The functional unit: 1 MWh of electricity (or 1 toe in cases determining the primary energy flows).
Limitations:
1. The environmental impact factor considers only GHG emissions from electricity generation, while other air pollutants (such as acidifying gases, ozone precursors, particulates) are believed to be closely related to them;
2. Inward energy flows include all purchased energy resources, regardless of their place of origin.
Assumption: The assessment of the sustainability of power systems is based on an aggregated power lifecycle model. Such an assessment does not imply that the adequacy of a power system at every moment of time is ensured, but is a tool for making strategic decisions on the development vectors.
Inventory AnalysisThe procedure of the data collection includes the processing of data on the input and output flows of energy by the stages of the electricity lifecycle, and on the amount of the corresponding GHG emissions released into the atmosphere.
The inventory analysis relies upon the Eurostat database, which includes 27 EU member states, for the period from 2010–2019, and is conducted with the use of the Microsoft Power Query add-in package for Excel (developed by the Microsoft Corp. [39]).
The calculation of the sustainability of the power systems is based on an integral assessment of the set of local sustainability indictors by the stages of the electricity lifecycle.
Impact AssessmentThe impact assessment implies a multistep process of checking the impact of the energy mix on the local power system sustainability (LPSS) indicators, and the interrelations between them.
To determine the significances and vectors of the impacts of the factors, a multiregression analysis by the LPSS indicators is conducted with the use of SPSS Statistics (developed by IBM Corp. [40]).
The impact assessment results are systematized in the form of a causal diagram with the use of Vensim (developed by Ventana Systems Inc. [41]).
InterpretationThe interpretation includes the analysis of the current LPSS indicators and their forecasts for the following period.
To finalize and provide recommendations, a multiobjective optimization by the LPSS indictors is conducted with the use of the MATLAB Global Optimization Toolbox (developed by MathWorks Inc. [42]).
Source: developed by the authors and based on ISO: 14040:2006 [16].
Table 2. Sustainability assessment of European power systems in 2019.
CountryHECcapitaCECGDPSocial DimensionExtDep CUFEEGRESOFFEconomic DimensionGHGPESEnvironmental DimensionPSS Index
MWh/CapitakWh/Eurow.a.c.R%%%%%w.a.c.RT CO2 eq./toew.a.c.Rw.a.c.R
BE1.610.190.46197.444.535.7211.023.50.5970.8640.8230.705
BG1.550.200.422522.945.024.659.749.50.47202.4190.41220.4323
CZ1.430.170.461823.645.123.917.456.20.44232.2990.45210.4522
DK1.760.120.61413.122.242.3058.525.40.6841.1490.7580.714
DE1.520.150.511011.830.039.3123.454.30.50172.4430.41230.4521
EE1.560.190.442225.131.729.1329.268.30.45223.9870.00270.1927
IE1.660.110.6237.031.752.3123.872.00.53141.9190.55180.5517
GR1.620.160.511213.627.145.5816.583.00.41253.4110.15250.2825
ES1.550.150.5297.928.443.8624.641.10.55130.9760.7950.697
FR2.380.150.64218.747.829.838.87.30.6060.2051.0020.842
HR1.520.140.54835.330.949.4349.950.10.6551.7290.60160.6012
IT1.100.140.47176.328.845.5725.770.60.50181.5670.64130.5715
CY2.020.140.6053.732.338.294.595.50.34273.1580.22240.3224
LV0.860.150.422411.625.038.0448.651.40.5881.7760.58170.5518
LT1.040.110.5111203.113.450.2361.430.40.53151.6670.61150.5716
LU1.490.150.5013240.812.267.2058.925.00.56121.3370.70100.6310
HU1.190.130.501629.039.337.6110.134.90.52161.4820.66120.6013
MT1.680.140.56723.731.754.915.794.30.40261.1000.7660.649
NL1.350.140.50143.637.344.0211.875.70.47212.0770.50200.4919
AT2.080.150.5967.132.750.4359.734.80.7611.1800.7490.723
PL0.770.140.42260.443.135.049.389.90.43243.9130.02260.1926
PT1.290.160.46216.528.148.8836.860.30.58101.3990.68110.6211
RO0.670.110.462010.032.635.4119.356.10.48192.0610.51190.4920
SL1.640.210.42239.548.131.5516.337.20.5891.5840.63140.5814
SK1.000.190.36271.342.029.3613.623.20.56110.9130.8140.678
FI4.090.350.501525.644.846.1131.522.40.7131.1250.7570.706
SE4.290.260.71123.144.936.2337.62.00.7420.1931.0010.891
Source: calculated by the authors on the basis of the Eurostat database [38]. w.a.c.: weighted average coefficient of a dimension or the composite index; R: rank, the place of the power system in ascending order by PSS dimensions and PSS index in the European space (1: leaders in terms of power system sustainability; 27: outsiders in terms of power system sustainability).
Table 3. Regression analysis of the impact of LPSS indicators.
LPSS IndicatorModelR2MAPE, %F
GHGPES1.73 + 2.86∙Coal + 0.56∙Gas + 1.06∙Oil − 1.69∙Hydro − 3.30∙Wind − 4.90∙Solar − 1.72∙Nuclear0.90811.3396.84
EEG0.28 − 0.17∙Coal + 0.12∙Gas + 0.38∙Hydro + 0.62∙Wind + 2.01∙Solar − 0.12∙Nuclear +0.17∙CUF0.7985.4159.84
CUF0.45 − 0.15∙Gas − 0.12∙Oil − 0.28∙Wind − 1.25∙Solar − 0.48∙Biofuels + 0.69∙EconI − 0.22∙EEG0.8114.6173.03
ImpDep−0.12 − 0.64∙Hydro − 1.34∙Wind + 1.21∙ExpDep + 0.39∙CECGDP − 0.70∙CUF + 1.18∙EEG0.9198.5537.77
ExpDep0.10 + 0.72∙Wind + 0.64∙Load − 0.36EEG + 0.74∙ImpDep0.8249.1334.56
HECcapita−1.09 + 18.52∙ CECGDP0.58687.6408.21
Hydro0.08 + 0.10∙HECcapita0.54212.4340.15
Source: calculated by the authors on the basis of the Eurostat database [38].
Table 4. Scenarios for the optimization of the sustainability of the European power system.
ScenarioShare of, %EEG, %CUF, %ExtDep, %GHGPES, t CO2 eq./toe
CoalGasOilHydroWindSolarBiofuelsNuclearRESOFF
201920.1(c)19.4(c)2.3(c)5(c)5.8(c)2.3(c)9.3(c)35.9(c)22.4(c)41.7(c)37.6(c)41.7(c)8.4(c)1.52(c)
202016.8(c)20.1(c)2.3(c)5.8(c)6.7(c)2.7(c)11.5(c)34.3(c)26.7(c)39.2(c)42.6(f)41.7(f)11.4(f)1.31(f)
202116.0(f)20.2(f)2.2(f)5.9(f)7.5(f)3.0(f)11.8(f)34.1(f)28.2(f)38.4(f)44.0(f)41.5(f)15.6(f)1.26(f)
Scenarios for minimization of GHG emissions per unit of primary energy source
11.825.78.9105.837.237.72636.447.142.132.70.86
29.925.78.965.837.233.52244.544.742.128.81.24
3021.20108.815.17.237.741.121.270.627.943.20.01
Scenarios for maximization of energy efficiency of generation
1035.68.9105.837.229.52644.549.440.637.51.01
2035.68.965.837.233.52244.547.440.6331.01
3027.38.9102115.17.210.553.336.281.322.4103.10.19
Scenarios for maximization of capacity utilization
147.29.301000033.51056.530.454.702.39
247.2150600031.8662.329.653.802.52
347.29.301000033.51056.530.454.702.39
Scenarios for minimization of external dependency of the power system
143.308.9002.97.237.710.152.230.447.902.27
247.20.48.9002.87.233.51056.5304802.46
343.308.9002.97.237.710.152.230.447.902.27
Scenarios for the multiobjective optimization of the sustainability of the European power system *
19.16.73.97.424.417.414.612.363.819.780.617.095.20.00
211.3118.6714.220.112.914.154.23180.617.6108.70.38
310.6912.81512.217.76.513.951.432.47823.399.20.42
414.61210.612.51317.43.91646.737.377.325.697.30.56
59.41011.612.96.917.318.513.555.53173.520.6104.30.66
69.217.613.714.911.111.311.510.348.840.567.628.684.70.88
716.910.512.47.418.211.710.911.948.239.867.627.980.50.90
814.711.819128.69.712.711.342.945.560.331.279.61.26
96.625.913.216.86.05.719.63.748.045.755.831.174.81.34
1022.47.217.411.47.19.316.210.243.94757.231.977.81.56
11 **13.421.919.69.922.033.06.00.070.854.9121.511.4149.00.38
Source: calculated by the authors on the basis of the above research results: (c) current value; (f) forecast value; * the first 10 scenarios with respect to the current level of GHG emissions per unit of primary energy source are presented; ** in the absence of nuclear generation capacity.
Publisher’s Note: MDPI stays neutral with regard to jurisdictional claims in published maps and institutional affiliations.

