Article

Provincial Allocation of Energy Consumption, Air Pollutant and CO2 Emission Quotas in China: Based on a Weighted Environment ZSG-DEA Model

School of Economics and Management, China University of Petroleum, Qingdao 266580, China
*
Authors to whom correspondence should be addressed.
Sustainability 2022, 14(4), 2243; https://doi.org/10.3390/su14042243
Submission received: 18 January 2022 / Revised: 13 February 2022 / Accepted: 15 February 2022 / Published: 16 February 2022
(This article belongs to the Special Issue Environment, Energy, and Air Quality Policy Integration)

Abstract

:
Air pollutants and CO2 emissions have a common important source, namely energy consumption. Considering fairness and efficiency, the provincial coordinated allocation of energy consumption, air pollutant emission, and carbon emission (EAC) quotas is of great significance to promote provincial development and achieve national energy conservation and emission reduction targets. A weighted environment zero-sum-gains data envelopment analysis (ZSG-DEA) model is constructed to optimize the efficiency of the initial provincial quotas under the fairness principle, so as to realize the fairness and efficiency of allocation. The empirical analysis in 2020 shows that the optimal allocation scheme proposed in this study is better than the national planning scheme in terms of fairness and efficiency, and the optimal scheme based on the initial allocation of priority order of “capacity to pay egalitarianism > historical egalitarianism > population egalitarianism” is the fairest. The optimal allocation scheme in 2025 can achieve absolute fairness. In this scheme, the pressures of energy conservation and emission reduction undertaken by different provinces vary greatly. The implementation of regional coordinated development strategies can narrow this gap and improve the enforceability of this scheme. Combined with the analysis of energy conservation and emission reduction in seven categories and three major national strategic regions, we put forward corresponding measures to provide decision support for China’s energy conservation and emission reduction.

1. Introduction

Economic development needs to consume a large amount of energy, and the consumption of energy is accompanied by the emissions of CO2 and air pollutants such as NOX, SO2, and inhalable particles. CO2 is an important component of air, which does not directly cause air pollution, but its large increase affects climate change, and then damages the ecological environment. As the largest developing country, China’s economy has developed rapidly in recent years, but it has also brought great energy consumption, CO2 emissions, and atmospheric environmental pollution. According to BP Statistical Review of World Energy, in 2020, China’s energy consumption and CO2 emissions accounted for 26.1% and 30.7% of the world, respectively. According to China Ecological Environment Bulletin, 40.1% of China’s 337 prefecture level and above cities still exceeded air quality standards in 2020. The Chinese government attaches great importance to the control of energy consumption, air pollutants, and CO2 emissions and has put forward a series of measures such as total quantity control, provincial quota allocation, and emissions trading. In 2016, Chinese State Council issued the Work Plan for Controlling Greenhouse Gas Emissions (WPGE) and Comprehensive Work Plan for Energy Conservation and Emission Reduction (WPEE) during the 13th Five-Year Plan period. The former determines the provincial CO2 emission intensity reduction targets through classification, while the latter proposes the “dual control” targets of energy consumption and intensity and the total emission control targets of major pollutants for each province. In the 14th Five-Year Plan (2021–2025), the Chinese government proposed to significantly improve energy efficiency, strengthen the collaborative control of multiple pollutants, and continuously reduce CO2 emissions. It clearly stated that by 2025, China’s energy consumption intensity and CO2 emission intensity will be reduced by 13.5% and 18% compared with 2020, respectively, and PM2.5 concentration in prefecture level and above cities will be reduced by 10%. In 2021, the China Development and Reform Commission issued the Plan for improving the dual control of energy consumption intensity and total amount, which proposed to reasonably set the total energy consumption target and carry out provincial allocation.
There is a close correlation between environment and energy. Energy consumption is an important source of air pollutants and CO2 emissions [1,2,3]. By improving energy efficiency to reduce total energy consumption or reducing the proportion of high carbon energy to optimize the energy consumption structure, air pollutants and CO2 emissions can be reduced simultaneously [4,5,6,7]. CO2 emission reduction and air pollutant reduction also have synergistic effects and reducing either of them usually brings co-benefits [8,9]. Therefore, it is necessary to comprehensively consider the relationship between energy consumption, air pollutant emissions, and CO2 emissions, and scientifically set energy conservation and emission reduction targets. In addition, under the provincial responsibility system for energy conservation and emission reduction targets, the provincial coordinated allocation of EAC quotas is conducive to improving the feasibility of achieving the national targets based on the current situation of economic development, energy consumption, and atmospheric environmental emissions in each province. The research objective is to discuss how to set provincial EAC quotas scientifically, so as to guarantee the fairness of provincial development and promote the efficient realization of the national targets.
When the total control amount of national energy consumption, air pollutants emissions, or CO2 emissions is determined, the provincial quota allocation can be viewed as zero-sum game, that is, the more quota one province gets, the less quotas other provinces get. Based on this characteristic, scholars have proposed a variety of models for quota allocation of energy consumption, air pollutants emissions, or CO2 emissions. Different from these studies, we make the following contributions. Firstly, we construct a weighted environmental ZSG-DEA model to realize the coordinated allocation of multiple elements and optimize the comprehensive allocation efficiency. Secondly, by comparing the Gini coefficients of optimal allocation results under different initial schemes, we select the fairest initial allocation principle for atmospheric environmental emission quotas. Thirdly, in combination with the 14th Five-Year Plan of China and all provinces, we explore the provincial EAC quota allocation scheme in 2025 and put forward corresponding policy implications according to the provincial pressures on energy conservation and emission reduction.
The rest of this paper is organized as follows. Section 2 reviews the literature on EAC quota allocation and analyzes the deficiencies of existing studies. Section 3 proposes research methodology and explains data sources. Section 4 presents the results of China’s EAC allocation in 2020 and 2025 and discusses the results in detail. Section 5 summarizes the research of this paper and puts forward the policy implications.

2. Literature Review

Dales [10] first proposed the concept of emission trade. The National Environmental Protection Agency of the US then issued the rules of total amount and trade. Since entering the 21st century, Cap and Trade mode has been a widely used control mode in the field of environment, and a growing number of scholars have paid attention to the allocation of air pollutants and CO2 emissions quotas [11,12,13]. Meng et al. [14], Dong et al. [15], and Zhou et al. [16] analyzed that there were differences in energy efficiency or carbon emission efficiency among provinces in China, which should be considered in the provincial quota allocation. According to the allocation ideas and methods, the existing allocation models of energy consumption and atmospheric emissions under the Cap mode can be divided into the following three categories:
(1) Indicators-based allocation models. Zhang and Xu [17] weighted historical energy consumption, GDP, and population, and allocated provincial energy consumption quotas based on cluster analysis and weighted voting model. Rose et al. [18] put forward nine standards of equity between countries and proposed corresponding rules applicable to the allocation of tradable emission rights at the regional level. Zhang et al. [4] established a provincial allocation model of VOCs by weighting four indicators such as per capita GDP. Aasmi and Leo [19] selected egalitarian equity, horizontal equity, and proportional equity as three criteria for global CO2 allocation, and evaluated the allocation scheme based on per capita emission and emission intensity standards. Pan et al. [20,21] proposed an allocation scheme of global carbon emission rights based on cumulative per capita emissions quotas, and then compared 20 key allocation schemes under different rules. Presno [22] analyzed the stochastic convergence of per capita CO2 emissions in 28 OECD countries and proposed that per capita GDP was not the sole determinant of emission allocation. Yi et al. [23], Zhou et al. [24], and Fang et al. [25] constructed composite indicators based on different single indicators for allocating provincial CO2 emission quotas of China. Han et al. [26] constructed a comprehensive index through the index weighting method to allocate carbon quota in the Beijing-Tianjin-Hebei region. Wu et al. [27] conducted preliminary allocation of provincial carbon emissions based on the principles of Grandfather, population egalitarianism, and pays ability egalitarian. Zhou et al. [28] considered fairness, efficiency, and sustainability principles simultaneously when conducting the CO2 emission quotas allocation. Li et al. [29] constructed a multi-attribute decision-making model to allocate provincial carbon emission rights. Kong et al. [30] and He and Zhang [31] used the same method, but they took the efficiency measured by DEA as one of their attributes.
(2) Nonlinear optimization-based allocation models. Aiming at minimizing economic and external costs, Yang et al. [32] established a nonlinear programming model for optimizing the allocation of natural gas and other energy sources. Xue et al. [33] allocated SO2 emission quotas in Beijing-Tianjin-Hebei region with the goal of minimizing the pollution control cost. Xie et al. [34,35] constructed a Gini coefficient minimization model to allocate the control targets for PM2.5 concentration in Beijing-Tianjin-Hebei district, in which the constraints include overall reduction rate, Gini coefficient, reduction rate, and ranking of each city. Zheng [36] defined the equitable interval and two equity indices and set up a fairness–efficiency trade-off model for the CO2 emission reduction responsibility allocation with the goal of minimizing the fair distance index. An et al. [37] proposed a cost-minimization carbon emission permit allocation model in combination with the DEA efficiency measurement model. Fang et al. [38] constructed an optimization model of carbon emission rights allocation based on energy justice, which takes the minimum sum of different Gini coefficients as the objective function under the constraints of population, ecological production land, fossil energy resources, and GDP.
(3) DEA-based allocation models. DEA is an ideal element allocation model, which can consider all input-output elements and achieve the optimal efficiency of the allocated object [39,40,41,42,43]. The proposed DEA-based allocation models mainly include ZSG-DEA, fixed cost allocation model (FCAM), and centralized DEA (CDEA). Sun et al. [44] and Miao et al. [45] constructed environmental ZSG-DEA models to allocate China’s energy conservation quotas and air pollutants (SO2 and NOX) emission rights. Wu et al. [46] allocated PM2.5 emission rights based on the ZSG-DEA model. Gomes and Lins [47] used the ZSG-DEA model to redistribute the initial carbon emissions rights for different countries within the framework of Kyoto protocol. Pang et al. [48] analyzed that based on the ZSG-DEA model, different countries could obtain reasonable CO2 emission quotas and realized global Pareto optimization. Chiu et al. [49] used the ZSG-DEA model to discuss the redistribution of emission quotas in 24 EU Member States. Cucchiella et al. [50] reallocated the energy consumption and CO2 emission among 28 European countries by using the ZSG-DEA model. Li et al. [51] applied ZSG-DEA models to allocate the CO2 allowances of the Jiangsu-Zhejiang-Shanghai region. Cai and Ye [52] and Yu et al. [53] used the ZSG-DEA model to allocate the carbon emission allowance in China. Li et al. [54] put forward a two-step allocation method of CO2 emission quotas, in which the ZSG-DEA model is used to optimize the initial quotas obtained through the multi-index weighting allocation model. Yang et al. [55] constructed a ZSG-DEA model to optimize China’s carbon emission reduction scheme in 2020 and 2030. Wang et al. [56] constructed a weighted ZSG-DEA model to allocate the energy consumption, CO2 emissions, and non-fossil fuel consumption, in which all three weights were set to be 1/3. Based on the ZSG-DEA model, Wang et al. [57] constructed a DEA-based resource allocation model that joints the input and output orientation to allocate provincial GDP and quotas of energy consumption, coal consumption, and carbon emission in 2020. Wang and Li [58] constructed FCAM to allocate carbon emissions in terms of the principle of population proportion convergence. Pan and Pan [59] constructed FCAM in terms of historical emission proportion convergence. Kong and Hou [60] constructed FCAM based on per capita convergence. Dong et al. [61] constructed a modified FCAM based on population proportion convergence with the results under other convergence principles as constraints. Zhou et al. [62] and Sun et al. [63] proposed CDEA models for CO2 emission quota allocation, which can achieve the maximum GDP of China under the constraint of meeting the total amount of carbon emission control. Song et al. [64] constructed a CDEA model to allocate provincial EAC quotas in 2025.
Literature review shows that that there are many studies on the allocation of provincial energy consumption, air pollutant, and CO2 emission quotas, but few studies have attempted to focus on the coordinated allocation of the three elements. From the perspective of allocation principles and methods, most studies consider fairness and efficiency. DEA-based allocation models can associate the inputs of economic activities with expected and unexpected outputs, and do not need to estimate the value of indicators such as emission reduction cost in advance. Therefore, it is more objective than the allocation models based on indicators and nonlinear optimization, and the relevant research is more abundant. The existing FCAM has two main shortcomings: first, it is difficult to reflect the weak disposability of undesirable output (the reduction of undesired output is at the cost of the reduction of expected output) and null-jointness between desirable output and undesirable output (undesirable output must be produced when desired output is produced); and second, its goal only reflects the convergence of a certain fairness principle, and cannot cover many fairness principles. Although the CDEA model can reflect the energy endowment of each province and maximize the total expected output, the economic growth target of some provinces in the allocation scheme is too high, which is infeasible under the realistic background of immature regional coordinated development. The environmental ZSG-DEA model can overcome the shortcomings of the FCAM and CDEA models. Based on the initial fair allocation scheme, it can consider the weak disposability and null-jointness of undesirable outputs to further optimize the allocation efficiency, so as to realize the integration of fairness and efficiency. Therefore, we select the environmental ZSG-DEA model to allocate EAC quotas. Different from the ZSG-DEA model for single element proposed by scholars, we construct a weighted comprehensive environmental ZSG-DEA model to reflect the differences in the importance of different elements. In addition, considering the diversity of fairness principles, we propose different initial fair allocation schemes for atmospheric emission quotas and explore the impact of different principles on the final allocation results based on the Gini coefficient.

3. Methodology

3.1. Methodology

3.1.1. Allocation Methods Based on Fairness

The fairness principle of allocation mainly includes historical egalitarian, population egalitarian, and pays ability egalitarian [18]. Taking atmospheric emissions as an example, historical egalitarian means that the total emission quotas are equidistantly allocated based on the proportion of provincial emissions to national emissions in the base period, which is conducive to ensuring the consistency of economic developments in all provinces. The allocation equation based on historical egalitarian is described as follows:
R k = R × r k k = 1 n r k
where Rk (k = 1, 2, …, n) is the quota obtained by the kth province, R is the total quotas to be allocated, and rk is the emissions of the kth province in the base period.
The base of population egalitarian is the proportion of population of each province to national population in the base period, and the allocation equation is described as follows:
R k = R × p k k = 1 n p k
where pk is population of the kth province in the base period.
The pays ability egalitarian reflects the fairness of emission reduction responsibility. Provinces with a large population and low per capita GDP can get more emission quotas. The allocation equation based on pays ability egalitarian is described as follows:
R k = R × p k g k / p k α k = 1 K p k g k / p k α
where gk is GDP of the kth province in the base period, and α is the modified variable. α is smaller than one, indicating that the increasing (or decreasing) amplitude of quotas is smaller than the decreasing (or increasing) amplitude of per capita GDP. This assumption guarantees that the quotas of one province will not fall drastically as its per capita GDP grows. Referring to the study of Dong et al. [61], we define the value of α as 0.5.

3.1.2. Allocation Methods Based on Efficiency

DEA is an effective method to evaluate the relative efficiency of a decision-making unit (DMU) with multiple inputs and multiple outputs. Traditional DEA models usually assume that the input (or output) variables of each DMU do not affect each other. However, such independence does not exist under the total amount control mode, and there is zero-sum-gains game relationship among all DMUs. When the total amount of one input (or output) remains constant, the inefficient DMU needs to reduce its input (or increase its output) to achieve effectiveness, while the other DMUs need to increase their input (or reduce their output) accordingly. Lins et al. [65] proposed the ZSG-DEA model for measuring the efficiency of each DMU, and iteratively adjusted the allocation results of the inefficient DMUs to make all DMUs at the efficiency frontier. Considering the weak disposability and null-jointness of undesired output, Färe et al. [66] proposed the concept of environmental production technology (EPT). Zhou et al. [67] constructed the environmental DEA model based on EPT. Miao et al. [68] further proposed the environmental ZSG-DEA model. Referring to the environmental ZSG-DEA model and considering the importance of different elements, we construct a weighted environmental ZSG-DEA model as follows:
min η = α φ l + j = 1 s   β j θ j l
s . t . k = 1 n δ k I i k I i l ,   i = 1 , 2 , , m k = 1 n δ k Y k Y l k = 1 n δ k E k 1 + E l 1 φ l k l E k φ l E l k = 1 n δ k U j k 1 + U j l 1 θ j l k l U j k = θ j l U j l ,   j = 1 , 2 , , s δ k 0 ,   k = 1 , 2 , , n
where φl and θjl (j = 1, 2, …, s) are energy efficiency and the jth unexpected output efficiency of the lth province, respectively; α and βj are the corresponding weights of them, and they satisfy the condition α + j = 1 s   β j = 1 ; Yl and Iil represent desirable output and the ith unallocated input of the lth province, respectively; El and Ujl are energy consumption quota and the jth undesired output quota of the lth province, respectively; and δk (k = 1, 2, …, n) is the decision variable. Inequality constraints in the model imply the strong disposability of inputs and desirable output, while equality constraint implies the weak disposability and null-jointness of undesirable outputs.
According to the ZSG-DEA model, inefficient DMUs need to reduce their quotas to improve efficiency. In order to keep the total quotas constant, when the inefficient lth province reduce the quotas of El(1 − φl) and Ujl(1 − θjl), the other n − 1 provinces need to increase their quotas according to the proportion of quotas last obtained, that is, the increased quotas of kth province are E k k l E k E l 1 φ l and U j k k l U j k U j l 1 θ j l , kl. Each province increases or reduces its quotas according to the above proportional reduction method. After all provincial quotas are adjusted, the new provincial energy consumption and undesired output quotas are shown in Equations (5) and (6), respectively.
E k = E k + l k E k E l k l E k 1 φ l E k 1 φ k ,   k = 1 , 2 , , n
U j k = U j k + l k U j k U j l k l U j k 1 θ j l U j k 1 θ j k , j = 1 , 2 , , s ; k = 1 , 2 , , s
The adjusted quotas are substituted into model (4) to calculate the weighted efficiency again. Similarly, the quotas of each province are adjusted in a new round according to the proportional reduction method. When the weighted efficiency of each province is equal to one, the adjustment ends. The adjustment result is the optimal EAC allocation scheme.

3.2. Materials

Referring to the input-output indicators of previous studies, we select population, capital stock, and energy consumption as input variables, GDP as desirable output variable, and SO2, NOX, and CO2 emissions as undesirable output variables. It should be noted that although the Chinese government has proposed the target of reducing PM2.5 concentration by 10% in prefecture level and above cities and the expectation of curbing the cities’ growth trend of O3 concentration in the 14th Five-Year Plan, considering the availability of historical data at provincial level and the important impacts of SO2 and NOX on the PM2.5 formulation and NOX on the O3 formulation, we still choose SO2 and NOX emissions as the representatives of air pollutants in this paper. Due to the lack of data for Tibet, Taiwan, Hong Kong, and Macao, we allocate EAC quotas to the other 30 provinces in China. The data sources are as follows:
(1)
The population of each province from 2011 to 2020 comes from China Statistics Yearbook (2012–2021). The population of each province in 2025 is forecasted based on its average population growth rate from 2016 to 2020.
(2)
The capital stock of each province from 2011 to 2017 is calculated by perpetual inventory method [69] and converted into the value under the price level of 2015. Regression analysis shows that there is a good linear relationship between capital stock and time in each province. We use regression equations to forecast provincial capital stocks in 2020 and 2025.
(3)
The GDP of each province from 2011 to 2020 comes from China Statistical Yearbook (2012–2021), and is converted into the value under the price level of 2015. The GDP of each province in 2025 is forecasted according to its GDP in 2020 and annual GDP growth target in the 14th Five-Year Plan. The total GDP of 30 provinces in 2025 will be 129,989.88 billion yuan.
(4)
The energy consumption of each province from 2011 to 2019 comes from China Energy Statistics Yearbook (2012–2020). According to the 15% reduction target of energy intensity in WPEE, we calculate the total energy consumption in 2020 should be limited to 5.11 billion tce, which is greater than the total energy consumption control target of 5 billion tons. Therefore, we set the total energy consumption limit in 2020 as 5 billion tce. According to the 13.5% reduction target of energy intensity in the 14th Five-Year Plan and the total GDP of 30 provinces in 2025, the total energy consumption limit in 2025 is 5.76 billion tce.
(5)
The SO2 emissions and NOX emissions of each province from 2011 to 2019 come from China Statistical Yearbook (2012–2020). According to WPEE, the reduction target of both SO2 emissions and NOX emissions is 15%, then the limits of SO2 and NOX emissions in 2020 are 15.80 million tons and 15.69 million tons, respectively.
(6)
The CO2 emissions of all provinces from 2011 to 2019 are calculated by IPCC emission coefficient method. According to the 18% reduction target of CO2 emission intensity in WPGE, the CO2 emission limit in 2020 is 13.78 billion tons. According to the 18% reduction target of CO2 emission intensity in the 14th Five-Year Plan, CO2 emission intensity will be reduced by 3.9% annually from 2020 to 2025. Assuming that CO2 emission intensity decreases by 3.9% from 2019 to 2020, based on the CO2 emission intensity of 1.48 tons per 10,000 yuan in 2019, the CO2 emission intensity in 2025 is 1.17 tons per 10,000 yuan, and the CO2 emission limit in 2025 is 15.40 billion tons.
(7)
According to the synergistic effect equations of energy conservation and emission reduction [64] and the energy consumption intensity of 0.5156 tons per 10,000 yuan in 2020, we calculate that the emission intensities of SO2, NOX, and CO2 in 2020 are 9.24 × 10⁻⁴, 1.518 × 10⁻³, and 1.4825 tons per 10,000 yuan respectively, and the SO2, NOX, and CO2 emissions are 9.01 million tons, 14.70 million tons, and 13.78 billion tons, respectively. The SO2 and NOX emissions from the synergistic effect are less than those from WPEE, and the CO2 emissions from the synergistic effect is greater than that from WPGE. Therefore, we take the SO2 and NOX emissions from the synergistic effect and the CO2 emissions from WPGE as the limits of them in 2020.
Based on the energy consumption intensity and GDP in 2025, the limits of SO2, NOX, and CO2 emissions from the synergistic effect in 2025 will be 1.21 million tons, 9.99 million tons, and 16.79 billion tons, respectively. Because the CO2 emission limit from 14th Five-Year Plan is less than that from the synergy effect, we set the CO2 emission limit as 15.40 billion tons.

4. Results and Discussion

4.1. The Analysis of Allocation Results in 2020

4.1.1. Initial Allocation Result in 2020 Based on Equity

Since energy is an important input resource for regional economic development, maintaining the continuity of energy consumption is very important for stable economic development. Limited by energy endowment, transportation, and other objective conditions, regional energy supply is difficult to change rapidly in the short term. In view of the above reasons, we choose 2011–2019 as the base period and apply the principle of historical egalitarian for the initial allocation of total energy consumption quota. Table 1 shows the initial allocation results of energy consumption quota in 2020.
Atmospheric emissions can be controlled in a coordinated way between provinces, and advanced technological means can be used to strengthen emission reduction within provinces. Therefore, we apply the principles of historical egalitarian, population egalitarian, and pays ability egalitarian to initially allocate the provincial quotas of SO2, NOX, and CO2 emissions. By consulting the experts in the field of emission right allocation, we conclude that there is no significant difference between historical egalitarian and pays ability egalitarian in the near future, and they are more feasible than population egalitarian. Therefore, we establish three order relations to reflect the differences of different principles, namely, a. historical egalitarian = pays ability egalitarian > population egalitarian; b. historical egalitarian > pays ability egalitarian > population egalitarian; and c. pays ability egalitarian > historical egalitarian > population egalitarian. Accordingly, we establish three weight vector scenarios about historical egalitarian, population egalitarian, and pays ability egalitarian, namely: A1 (3/7, 1/7, 3/7), A2 (4/7, 1/7, 2/7), and A3 (2/7, 1/7, 4/7). Table 2 shows the initial allocation results of SO2, NOX, and CO2 emission quotas in 2020 under three scenarios.

4.1.2. Optimal Allocation Result in 2020 Based on Weighted Environmental ZSG-DEA Model

It is assumed that decision-makers consider energy conservation, air pollutant emission reduction, and CO2 emission reduction to be equally important, that is, α, β1, β2, and β3 in model (4) are all 0.25. By substituting the initial provincial energy consumption and SO2, NOX, and CO2 emission quotas under scenario A1 into model (4), we calculate the energy consumption efficiency (φ), SO2 emission efficiency (θ1), NOX emission efficiency (θ2), CO2 emission efficiency (θ3), and the weighted comprehensive efficiency (η), which can be seen in Figure 1. Beijing and Shanghai are at the efficiency frontier, indicating that they have achieved effective allocation and need to accept the excess quotas from other provinces in the subsequent adjustment process. The efficiency of the other 28 provinces has not yet reached the frontier, and the quotas of them will be reduced in the subsequent adjustment process.
According to Equations (5) and (6), we make iterative adjustments. As can be seen from Figure 2, the comprehensive efficiency of the initial allocation result is the lowest. After 16 iterations, the comprehensive efficiency of each province is 1. The final adjustment result is the optimal EAC allocation result, as shown in Table 3.
Similarly, we calculate the optimal EAC allocation results based on the weighted environmental ZSG-DEA model under scenarios A2 and A3 (see Table A1 and Table A2 in Appendix A). In order to analyze the influence of different weights on the allocation results, we conduct sensitivity analysis on the values of α, β1, β2, and β3. Under the conditions that α > 0, β1 > 0, β2 > 0, β3 > 0 and α + β1 + β2 + β3 = 1, we traverse all possible values of them under three scenarios, and find that the optimal result does not change in any scenario. This means that the optimal allocation result has nothing to do with the weight distribution of all elements, but only with their initial allocation quotas.

4.1.3. Comparison with National Planning Targets

According to the two national plans of WPEE and WPGE, we calculate the provincial SO2, NOX, and CO2 emission quotas. In order to compare the fairness of the national planning scheme with the optimal allocation scheme, we calculate their Gini coefficients. The Gini coefficient method has the advantages of being immune to outliers, making full use of all samples and having relatively clear criteria. Its calculation formula is as follows:
G = 1 i = 1 30 X i X i 1 Y i + Y i 1
where i is the serial number of each province reordered from small to large according to the per capita or intensity index on energy or environment; Xi and Yi are the proportions of population (or GDP) and energy consumption (or atmospheric emissions) accumulated to the ith province, respectively. The greater the Gini coefficient, the more unfair the provincial quota allocation. Generally, a Gini coefficient less than 0.2 is absolute fair, between 0.2 and 0.3 is fair, between 0.3 and 0.4 is relatively reasonable, between 0.4 and 0.5 is a relatively large gap, and greater than 0.5 is a large gap. The calculation results are shown in Table 4.
The intensity Gini coefficients of three optimal allocation schemes are all less than 0.2, indicating that they achieve absolute fairness. Other than the per capita Gini coefficient of SO2 emissions under scenario A3 achieving absolute fairness, other per capita Gini coefficients are all less than 0.3, indicating that they achieve interpersonal fairness. Aside from the Gini coefficient of per capita energy consumption in the national planning scheme being less than that in the optimal allocation scheme, all the other Gini coefficients in the national planning scheme are greater than those in the optimal allocation scheme. This shows that the optimal allocation scheme based on weighted environmental ZSG-DEA model is generally fairer than the national planning scheme. By comparing the optimal allocation schemes under three initial allocation scenarios, it can be seen that the Gini coefficient of each index in the scenario A3 is the smallest. Therefore, the initial allocation under scenario A3 can improve the fairness of final EAC quota allocation.
By substituting the quotas in the national planning scheme into model (4), we calculate the allocation efficiency of each province, as shown in Figure 3. Except Beijing and Tianjin, the other 28 provinces are not at the frontier of efficiency. Therefore, from the perspective of efficiency, the optimal allocation scheme is better than the national planning scheme.

4.2. The Analysis of Allocation Results in 2025

4.2.1. Allocation Results in 2025

According to the allocation results in 2020, the optimal allocation scheme under scenario A3 can not only achieve the efficiency optimization, but also achieve the best fairness. Therefore, we select scenario A3 for the initial allocation of atmospheric emission quotas in 2025, and the result is shown in Table 5.
Assuming that α, β1, β2, and β3 are all 0.25, we substitute the above initial allocation result into model (4) to calculate the weighted comprehensive efficiency. After 14 iteration adjustments, the comprehensive efficiency of each province is 1. In order to reflect the influence of different weight distribution on the allocation results, we still traverse all possible values of α, β1, β2, and β3 for sensitivity analysis. The results show that the optimal allocation result in 2025 is still insensitive to the weights of different elements, which is consistent with the conclusion in 2020. The final allocation result is shown in Table 6.
Table 7 presents the per capita and intensity Gini coefficients of the optimal allocation scheme. All the Gini coefficients are less than 0.2, indicating that the optimal allocation scheme achieves provincial absolute fairness in terms of per capita and intensity.

4.2.2. Measurement of Energy Conservation and Emission Reduction Pressures

It is assumed that the provincial population, GDP, and other planning targets and the forecasted capital stocks in 2025 are achievable, and each province has the same pressure of energy conservation and emission reduction under the initial fair allocation scheme. In order to measure the pressure of optimal allocation scheme, we define the pressure index as follows:
P i j = X i j 0 X i j X i j 0 × 100 %
where Pij is the pressure index of the jth allocation element of the ith province, and Xij0 and Xij are the initial and optimal allocation results, respectively. If Pij > 0, it means that the pressure of energy conservation or emission reduction increases compared with the initial pressure. If Pij ≤ 0, it means that there is no increased pressure and even an excess of quota space.
Due to the homology and synchronization between air pollutants and CO2 emissions, SO2, NOX, and CO2 emissions can be synergistically reduced through some technical or management measures. We synthesize the pressure index of them by equal weight 1/3 to calculate the pressure index of emission reduction. Table 8 shows the pressure index values of energy conservation and emission reduction under the optimal allocation scheme.
By calculating the average value of pressure index greater than 0, the average energy conservation pressure index and average emission reduction pressure index are 33.38% and 31.78%, respectively. We define the case where the pressure index value is greater than or equal to the average value as high pressure, the case where the pressure index value is greater than 0 and less than the average value as low pressure, and the case where the pressure index value is less than or equal to 0 as no pressure. It can be seen from Table 8 that different provinces will undertake different energy conservation and emission reduction pressures. In terms of energy conservation pressure index, 16 provinces, namely Beijing, Tianjin, Jilin, Shanghai, Jiangsu, Zhejiang, Anhui, Fujian, Jiangxi, Henan, Hubei, Hunan, Guangdong, Guangxi, Hainan, and Chongqing, have no pressure; 7 provinces, namely Liaoning, Heilongjiang, Shandong, Sichuan, Guizhou, Yunnan, and Shaanxi, undertake low pressure; and 7 provinces, namely Hebei, Shanxi, Inner Mongolia, Gansu, Qinghai, Ningxia, and Xinjiang, undertake high pressure. In terms of emission reduction index, 11 provinces, Beijing, Tianjin, Shanghai, Jiangsu, Zhejiang, Fujian, Shandong, Hubei, Guangdong, Hainan, and Chongqing, have no pressure; 9 provinces, namely Inner Mongolia, Liaoning, Jilin, Anhui, Jiangxi, Henan, Hunan, Sichuan, and Shaanxi, undertake low pressure; and 10 provinces, namely Hebei, Shanxi, Heilongjiang, Guangxi, Guizhou, Yunnan, Gansu, Qinghai, Ningxia, and Xinjiang, undertake high pressure.
From the two dimensions of energy conservation pressure and emission reduction pressure, 30 provinces can be divided into 7 categories, as shown in Figure 4. Category I includes 10 provinces, i.e., Beijing, Tianjin, Shanghai, Jiangsu, Zhejiang, Fujian, Hubei, Guangdong, Hainan, and Chongqing, which have no energy conservation and emissions reduction pressures. Category II includes 6 provinces, i.e., Anhui, Jiangxi, Hunan, Guangxi, Jilin, and Henan, which have no energy conservation pressure, but have certain emission reduction pressure. Category III only includes Shandong province, which has certain energy conservation pressure but no emission reduction pressure. Category IV includes Liaoning, Sichuan, and Shaanxi provinces, which have certain energy conservation and emission reduction pressures. Category V includes Heilongjiang, Guizhou, and Yunnan provinces, which have certain energy conservation pressure and high emission reduction pressure. Category VI includes 6 provinces, i.e., Hebei, Shanxi, Gansu, Ningxia, Qinghai, and Xinjiang, which have high energy conservation and emission reduction pressures. Category VII only includes Inner Mongolia, which has high energy conservation pressure and certain emission reduction pressure.
It can be seen from Table 8 that the pressures of energy conservation and emission reduction vary greatly among provinces. Provinces with a relatively backward economy such as Xinjiang, Ningxia, and Qinghai undertake huge pressures, while economically developed provinces such as Beijing, Tianjin, and Shanghai have sufficient quotas. Undoubtedly, the huge pressures of energy conservation and emission reduction will make the relatively backward provinces bear greater economic costs, which may lead to the further expansion of provincial economic gap. Therefore, in order to improve the enforceability of the optimal quota allocation scheme, China should accelerate the implementation of the regional coordinated development strategy and promote regional integration cooperation among provinces.
China has clearly proposed three major regional development strategies, namely “the Belt and Road”, Beijing-Tianjin-Hebei Collaborative Development, and Yangtze River Economic Belt. We calculate the energy conservation and emission reduction pressure indexes for the major regions involved in the national strategies, and the results are shown in Table 9. It can be seen that relying on the Yangtze River golden waterway, the Yangtze River Economic Belt connecting 11 provinces (Shanghai, Jiangsu, Zhejiang, Anhui, Jiangxi, Hubei, Hunan, Chongqing, Sichuan, Yunnan, Guizhou) in the eastern, central, and western regions has no energy conservation and emission reduction pressures, and there are 23.13% energy conservation surplus and 12.90% emission reduction surplus. Relying on coastal cities and ports, 21st Century Maritime Silk Road connecting 11 provinces (Liaoning, Hebei, Tianjin, Shandong, Shanghai, Jiangsu, Zhejiang, Fujian, Guangdong, Guangxi, Hainan) in the north and south regions also has no pressure, and there are 13.87% energy conservation surplus and 31.82% emission reduction surplus. The energy conservation pressure index of Beijing-Tianjin-Hebei is 10.19%, and there is 4.22% emission reduction surplus. The New Eurasian Continental Bridge Economic Corridor covering Jiangsu, Anhui, Henan, Shaanxi, Gansu, Qinghai, and Xinjiang will bear the energy conservation pressure index of 0.82% and the emission reduction pressure index of 7.69%. The China-Mongolia-Russia Economic Corridor covering Beijing, Tianjin, Hebei, Inner Mongolia, Liaoning, Jilin, and Heilongjiang will bear the energy conservation pressure index of 24.14% and the emission reduction pressure index of 13.79%.

5. Conclusions and Policy Implications

From the perspective of improving the fairness and efficiency of allocation, we construct a weighted ZSG-DEA model to adjust and optimize the initial allocation scheme of EAC quotas, and conduct a detailed analysis of provincial EAC quotas allocation in 2020 and 2025. The main conclusions are as follows:
(1)
The proposed weighted environmental ZSG-DEA model has the following advantages: first, it considers the strong disposability of energy, population, fixed assets, and other input factors and expected output GDP, as well as the weak disposability and null-jointness of unexpected outputs such as air pollutants and CO2 emissions, which is more in line with the reality of economic production. Second, the weights of energy efficiency and unexcepted output efficiency can reflect the decision-makers’ attention to different allocation elements, which makes the allocation model interactive. Third, the model is a general model applicable to the allocation of various elements, which can be extended to meet the allocation requirements of other environmental factors aside from those mentioned in this paper.
(2)
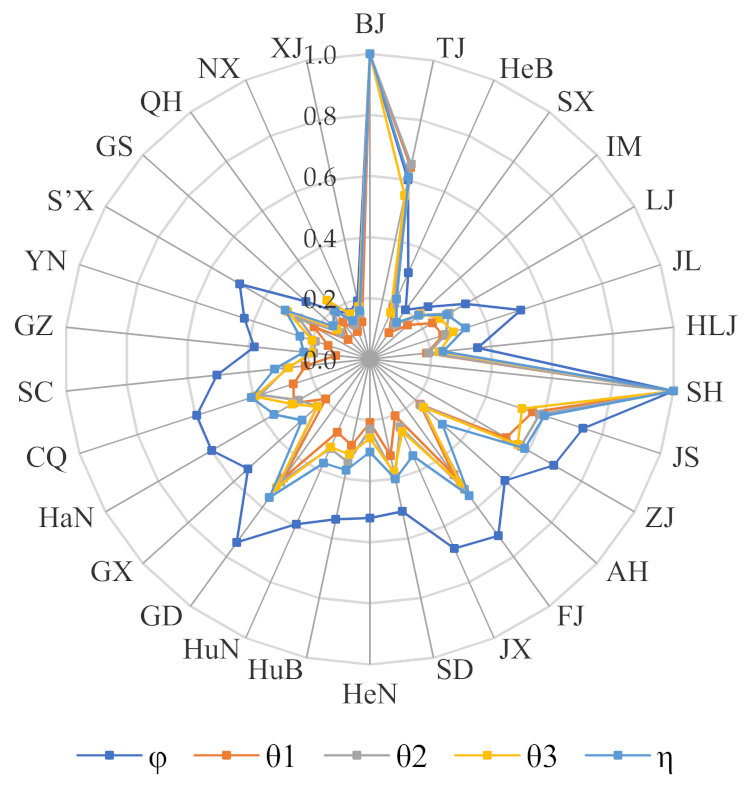
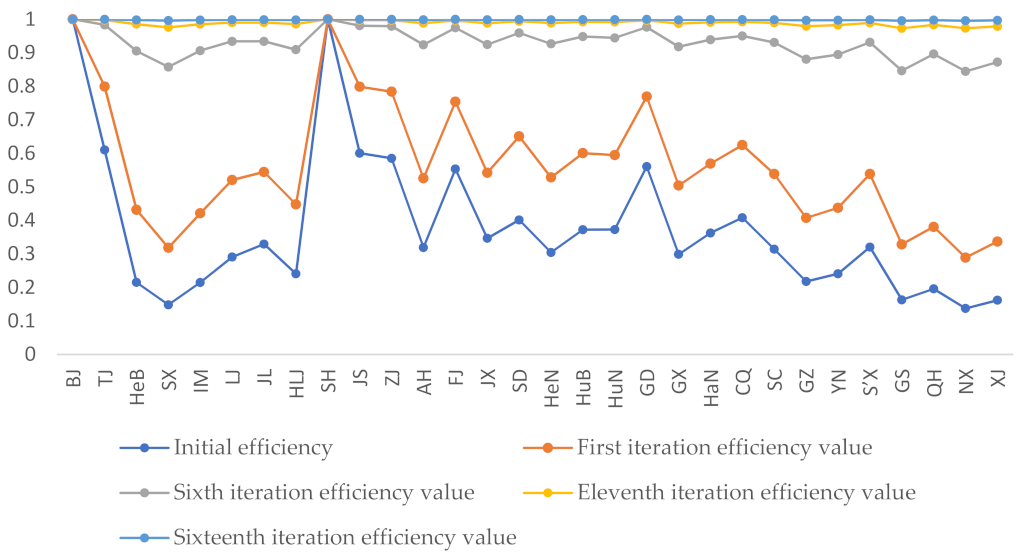
The efficiency of the initial allocation scheme in 2020 based on the fairness principle is low, and there are significant differences in efficiency values between provinces. After applying the weighted environment ZSG-DEA model to optimize the initial scheme, the efficiency of EAC quota allocation is significantly improved, and the efficiency value of each province is 1, realizing the effective allocation of input and output. The optimal allocation result in 2020 shows that the fairness and efficiency of optimal allocation scheme are better than the national planning scheme. In addition, the sensitivity analysis of EAC element weights shows that the optimal allocation results are independent of the weight distribution of elements, but only related to their initial allocation quotas. The optimal allocation scheme based on the initial priority order of “pays ability egalitarian > historical egalitarian > population egalitarian” has the best fairness.
(3)
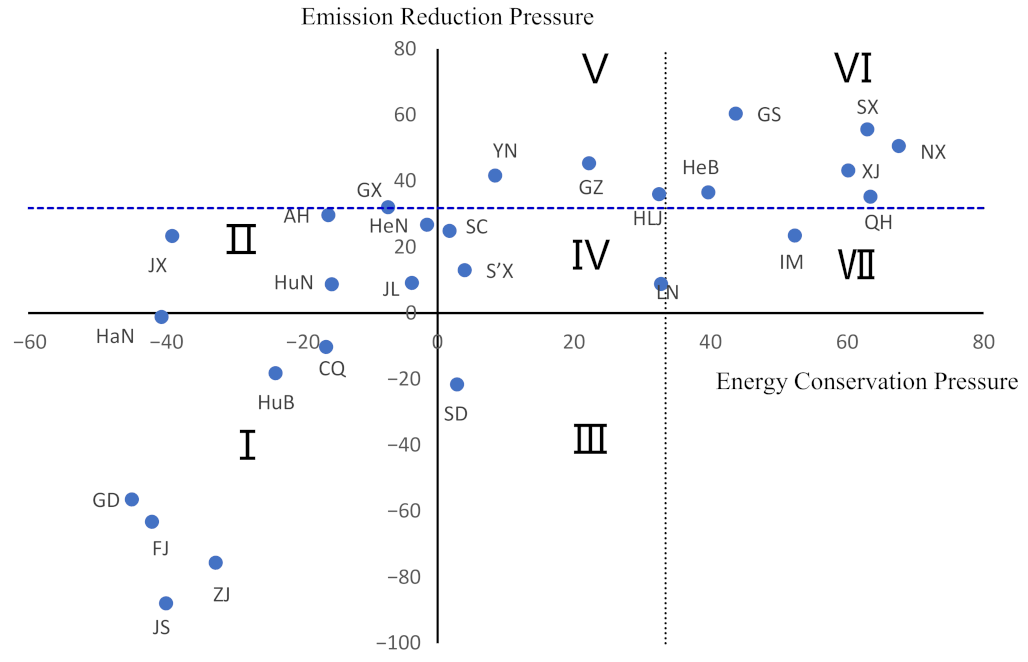
The optimal allocation scheme in 2025 is not only effective, but also realizes absolute fairness. However, different provinces will undertake different energy conservation and emission reduction pressures. By implementing regional development strategy and promoting the coordinated energy conservation and emission reduction among provinces, the enforceability of allocation scheme can be improved.
Combined with energy conservation and emission reduction pressures of 7 categories, we put forward the following policy implications for each category. (a) The 10 provinces in Category I have no energy conservation and emissions reduction pressures, and they can continue to implement the existing policies and measures, or sell excess quotas in the market through emission trading. (b) The 6 provinces in Category II only have certain emission reduction pressure, and they can reduce air pollutants and CO2 emissions by optimizing the energy structure, adopting desulfurization and denitrification technology, and installing waste gas treatment equipment. (c) Shandong Province in Category III only has certain energy conservation pressure, and it can adopt energy-saving technology, eliminate backward production capacity and accelerate the transformation of old and new kinetic energy. Due to the synergistic effect of energy conservation and emission reduction, Shandong province may reduce its air pollutants and CO2 emissions while saving energy. Therefore, it can sell excess emission quotas through the market. (d) The three provinces in Category IV have certain energy conservation and emission reduction pressure, and they can promote energy-saving technologies and reduce underdeveloped production capacity to achieve energy conservation and the coordinated air pollutants and CO2 emission reduction. (e) The three provinces in Category V have certain energy conservation pressure and high emission reduction pressure. On the one hand, they should adopt desulfurization and denitrification technologies and install waste gas treatment facilities to reduce emissions. On the other hand, they can take energy-saving measures such as promoting energy-saving technologies and accelerating the elimination of backward production capacity to jointly reduce air pollutants and CO2 emissions. (f) The 6 provinces in Category VI have high dual pressures on energy conservation and emission reduction. The energy consumption of these provinces is mainly dominated by traditional energy such as coal. They should make great efforts to improve the energy structure, use clean and efficient energy, and avoid excessive use of coal and other fossil fuels. In addition, they should take environmental protection measures such as desulfurization and denitrification technology and installation of industrial waste gas treatment equipment for industrial emission sources. (g) Inner Mongolia in Category VII has high energy conservation pressure and certain emission reduction pressure. It should strengthen the popularization and application of energy-saving technologies, eliminate backward production capacity, and improve the energy structure.
In accelerating the implementation of regional development strategy, China should build efficient transportation networks, improve logistics and transportation systems, weaken the barriers of factor flow between regions, and establish the benefit compensation mechanism between the source and destination of energy and atmospheric emissions. According to the energy conservation and emission reduction pressures in the major regions involved in the three major regional development strategies, we put forward the following policy suggestions: (a) Yangtze River Economic Belt and 21st Century Maritime Silk Road have surplus of energy conservation and emission reduction, and they can continue to implement the current regional energy conservation and emission reduction policies. (b) Beijing-Tianjin-Hebei has achieved remarkable result in the coordinated control of air pollutants. In the future, it should strengthen the construction of integrated energy system, coordinate energy cooperation, and reduce energy consumption. (c) The New Eurasian Continental Bridge Economic Corridor can make full use of the superimposed advantages of Jiangsu and Anhui in the two regional development strategies to drive the integration of provinces in this region with the Yangtze River economic belt. In addition, the region should give full play to its role as a bridge linking central and eastern European countries, strengthen regional cooperation in energy, technology, and other fields, and realize high-quality development of regional energy and environment. (d) The China-Mongolia-Russia Economic Corridor can make full use of the regional cooperation advantages, increase regional cooperation in investment, trade, and energy, and optimize the industrial structure and energy consumption structure, so as to promote the efficient completion of regional energy conservation and emission reduction targets.
To sum up, we believe that China should continue to implement the responsibility system for energy conservation and emission reduction targets and vigorously promote regional development strategy. First, differentiated EAC quota targets should be allocated to all provinces to ensure their sustainable economic development and high efficiency in energy conservation and emission reduction. Second, a more extensive and in-depth regional integration strategy should be promoted, so as to promote the flow and exchange of elements in different regions, and promote the realization of provincial energy conservation and emission reduction targets. Third, each province should develop new energy, increase the use of clean energy, optimize industrial structure, and speed up industrial upgrading.
There are some defects in this study. First, due to the availability of data, only SO2 and NOx are selected as atmospheric pollutants. With the abundance of PM2.5, O3, and other data in China, the allocation of multiple pollutants could be included in further studies. Second, FCAM can also achieve efficiency optimization based on fair initial allocation. Constructing the environmental FCAM based on EPT and comparing it with the environmental ZSG-DEA model in this paper will enrich the research of EAC quotas allocation.

Author Contributions

Conceptualization, J.S.; methodology, J.S.; writing—original draft preparation, R.C.; writing—review and editing, J.S., X.M. and R.C. All authors have read and agreed to the published version of the manuscript.

Funding

This research was funded by Fundamental Research Funds for the Central Universities, grant number 20CX04003B.

Institutional Review Board Statement

This paper does not contain any studies with human or animal participants performed by the authors.

Informed Consent Statement

This paper does not contain any studies with human or animal participants performed by the authors.

Data Availability Statement

The data used to support the findings of this study are available from the corresponding author upon request.

Acknowledgments

The authors are grateful to anonymous reviewers and editors for their comments and suggestions on this paper.

Conflicts of Interest

The authors declare no conflict of interest.

Appendix A

Table A1. The optimal allocation results in 2020 under scenario A2.
ProvinceEnergy Consumption
(104 tce)
SO2 Emissions
(104 tons)
NOX Emissions
(104 tons)
CO2 Emissions
(104 tons)
BJ15,242.5927.4244.7741,688.04
TJ10,459.8818.8330.7328,612.06
HeB20,381.9136.9159.9255,793.00
SX8517.1315.4825.0523,319.70
IM11,204.5720.3032.9430,666.82
LN16,591.2030.0348.7745,406.96
JL8859.4916.0426.0524,245.92
HLJ9527.2417.2628.0126,075.70
SH24,340.0641.9371.8776,971.89
JS48,301.2787.01141.90132,126.62
ZJ29,932.2253.8987.9381,872.54
AH15,896.7328.6746.7243,493.67
FJ18,607.9733.5154.6750,898.99
JX12,271.7822.1436.0633,574.12
SD42,992.6377.68126.35117,634.59
HeN25,535.4946.2475.0769,883.82
HuB19,249.6434.6956.5652,661.13
HuN20,609.8137.1560.5656,381.19
GD49,574.8689.33145.65135,609.45
GX11,510.7120.8433.8431,502.28
HaN2505.514.517.366854.42
CQ11,304.9020.4633.2330,933.83
SC21,430.4138.8063.0058,647.60
GZ8018.1814.5723.5821,947.31
YN10,077.4018.2829.6327,582.42
S’X12,476.3622.5936.6834,141.76
GS4508.208.2013.2612,342.23
QH1645.022.974.844500.98
NX2039.963.706.005583.63
XJ6386.9311.6018.7917,484.98
Table A2. The optimal allocation results in 2020 under scenario A3.
ProvinceEnergy Consumption
(104 tce)
SO2 Emissions
(104 tons)
NOX Emissions
(104 tons)
CO2 Emissions
(104 tons)
BJ15,242.3527.5945.0442,105.44
TJ10,459.7918.9530.9228,905.21
HeB20,382.3737.2460.4956,551.65
SX8517.5215.6225.3223,653.66
IM11,204.7520.3733.1831,006.84
LN16,591.2530.1349.1045,902.38
JL8859.5916.1726.2824,557.04
HLJ9527.4417.4228.2926,427.31
SH24,339.6738.8461.0861,828.50
JS48,300.8387.59142.84133,530.58
ZJ29,931.8954.2488.5082,723.46
AH15,896.6028.9147.0944,010.70
FJ18,607.7633.7355.0251,435.10
JX12,271.6522.3236.3533,968.67
SD42,992.3677.99127.17118,871.30
HeN25,535.7346.6475.7770,793.65
HuB19,249.5234.9556.9653,250.31
HuN20,609.9637.6161.1257,116.59
GD49,574.2589.86146.60137,026.84
GX11,510.8321.0534.1731,931.24
HaN2505.494.557.426934.13
CQ11,304.9920.6333.5131,318.37
SC21,430.6339.1463.5859,415.47
GZ8018.2014.6423.7722,214.99
YN10,077.5618.4629.9427,971.12
S’X12,476.5222.7937.0134,578.65
GS4508.268.2513.3912,507.62
QH1645.073.004.874554.25
NX2040.033.726.055652.20
XJ6387.1211.6518.9417,694.40

References

  1. Bastola, U.; Sapkota, P. Relationships among energy consumption, pollution emission, and economic growth in Nepal. Energy 2015, 80, 254–262. [Google Scholar] [CrossRef]
  2. Irfan, M.; Shaw, K. Modeling the effects of energy consumption and urbanization on environmental pollution in South Asian countries: A nonparametric panel approach. Qual. Quant. 2017, 51, 65–78. [Google Scholar] [CrossRef]
  3. Li, G.; Sun, W.; Huang, G.H.; Lv, Y.; Liu., Z.; An, C. Planning of integrated energy-environment systems under dual interval uncertainties. Int. J. Electr. Power. 2018, 100, 287–298. [Google Scholar] [CrossRef]
  4. Zhang, S.; Worrell, E.; Crijns-Graus, W. Evaluating co-benefits of energy efficiency and air pollution abatement in China’s cement industry. Appl. Energy 2015, 147, 192–213. [Google Scholar] [CrossRef]
  5. Yuan, X.L.; Mu, R.; Zuo, J.; Wang, Q.S. Economic Development, Energy Consumption, and Air Pollution: A Critical Assessment in China. Hum. Ecol. Risk Assess. 2015, 21, 781–798. [Google Scholar] [CrossRef]
  6. Yu, Y.; Kong, Q. Analysis on the influencing factors of carbon emissions from energy consumption in China based on LMDI method. Nat. Hazards 2017, 88, 1691–1707. [Google Scholar] [CrossRef]
  7. Wang, K.F.; Zhao, X.K.; Peng, B.Y.; Zeng, Y.M. Can energy efficiency progress reduce PM2.5 concentration in China’s cities? Evidence from 105 key environmental protection cities in China, 2004–2015. J. Clean. Prod. 2021, 288, 125684. [Google Scholar] [CrossRef]
  8. IPCC. Climate Change 2007: Mitigation: Contribution of Working Group III to the Fourth Assessment Report of the Intergovernmental Panel on Climate Chang; Cambridge University Press: Cambridge, UK, 2007. [Google Scholar]
  9. Song, J.K.; Jiang, L.N.; Zhao, Z.H.; Zhang, Y.M.; Lv, T.G. Cointegration Test of the Relationship among Energy Consumption, Air Pollutant Emission and Carbon Emission Intensity in China—Based on the Data from 2000 to 2017. Environ. Prot. Sci. 2020, 5, 1–7. [Google Scholar]
  10. Dales, J.H. Pollution, Property & Prices: An Essay in Policy-Making and Economics; Edward Elgar Publishing: Cheltenham, UK, 2002. [Google Scholar]
  11. MacKenzie, I.A.; Hanley, N.; Kornienko, T. Using contests to allocate pollution rights. Energy Policy 2009, 37, 2798–2806. [Google Scholar] [CrossRef] [Green Version]
  12. Groenenberg, H.; Phylipsen, D.; Blok, K. Differentiating Commitments Worldwide: Global Differentiation of GHG Emissions Reductions Based on the Triptych Approach—A Preliminary Assessment. Energy Policy 2001, 29, 1007–1030. [Google Scholar] [CrossRef]
  13. Ringius, L.; Torvanger, A.; Underdal, A. Burden sharing and fairness principles in international climate policy. Int. Environ. Agreem. 2002, 2, 1–22. [Google Scholar] [CrossRef]
  14. Meng, F.; Su, B.; Thomson, E.; Zhou, D.; Zhou, P. Measuring China’s regional energy and carbon emission efficiency with DEA models: A survey. Appl. Energy 2016, 183, 1–21. [Google Scholar] [CrossRef]
  15. Dong, F.; Li, X.; Long, R.; Liu, X. Regional carbon emission performance in China according to a stochastic frontier model. Renew. Sustain. Energy Rev. 2013, 28, 525–530. [Google Scholar] [CrossRef]
  16. Zhou, D.; Zheng, C.; Hua, S.; Huang, Y. The potentialities and paths of China’s carbon emission reduction based on the coordination of fairness and efficiency. J. Nat. Resour. 2019, 34, 80–91. [Google Scholar] [CrossRef]
  17. Zhang, Z.; Xu, X. A study of the allocation of energy consumption permits among the regions of China based on clustering analysis and cuckoo search. Environ. Sci. Pollut. Res. 2021, 28, 37244–37261. [Google Scholar] [CrossRef] [PubMed]
  18. Rose, A.; Stevens, B.; Edmonds, J.; Wise, M. International Equity and Differentiation in Global Warming Policy. Environ. Resour. Econ. 1998, 12, 25–51. [Google Scholar] [CrossRef]
  19. Miketa, A.; Schrattenhozer, L. Equity implications of two burden-sharing rules for stabilizing greenhouse-gas concentrations. Energy Policy 2006, 34, 877–891. [Google Scholar] [CrossRef]
  20. Pan, X.; Teng, F.; Wang, G. Sharing emission space at an equitable basis: Allocation scheme based on the equal cumulative emission per capita principle. Appl. Energy 2014, 113, 1810–1818. [Google Scholar] [CrossRef]
  21. Pan, X.; Teng, F.; Ha, Y.; Wang, G. Equitable Access to Sustainable Development: Based on the comparative study of carbon emission rights allocation schemes. Appl. Energy 2014, 130, 632–640. [Google Scholar] [CrossRef]
  22. Presno, M.J.; Landajo, M.; Fernandez Gonzalez, P. Stochastic convergence in per capita CO2 emissions. An approach from nonlinear stationarity analysis. Energy Econ. 2018, 70, 563–581. [Google Scholar] [CrossRef]
  23. Yi, W.J.; Zou, L.L.; Guo, J.; Wang, K.; Wei, Y.M. How can China reach its CO2 intensity reduction targets by 2020? A regional allocation based on equity and development. Energy Policy 2011, 39, 2407–2415. [Google Scholar] [CrossRef]
  24. Zhou, X.; Guan, X.; Zhang, M.; Zhou, Y.; Zhou, M. Allocating and simulation study of carbon emission quotas among China’s provinces in 2020. Environ. Sci. Pollut. Res. 2017, 24, 7088–7113. [Google Scholar] [CrossRef] [PubMed]
  25. Fang, K.; Zhang, Q.; Ye, R.; Zhou, Y. Allocating China’s carbon emission allowance to the provincial quotas in the context of the Paris Agreement. Acta Sci. Circumstantiae 2018, 38, 1224–1234. [Google Scholar]
  26. Han, R.; Tang, B.J.; Fan, J.L.; Liu, L.C.; Wei, Y.M. Integrated weighting approach to carbon emission quotas: An application case of Beijing-Tianjin-Hebei region. J. Clean. Prod. 2016, 131, 448–459. [Google Scholar] [CrossRef]
  27. Wu, J.; Ma, X.; Wang, Z. Provincial emission permits quota allocations in China. Quat. Sci. 2010, 30, 481–488. [Google Scholar]
  28. Zhou, H.; Ping, W.; Wang, Y.; Wang, Y.; Liu, K. China’s initial allocation of interprovincial carbon emission rights considering historical carbon transfers: Program design and efficiency evaluation. Ecol. Indicat. 2021, 121, 106918. [Google Scholar] [CrossRef]
  29. Li, F.; Wu, F.P.; Chen, L.X. Harmonious allocation of carbon emission permits based on dynamic multi-attribute decision-making method. J. Clean. Prod. 2020, 248, 119184. [Google Scholar] [CrossRef]
  30. Kong, Y.C.; Zhao, T.; Yuan, R.; Chen, C. Allocation of carbon emission quotas in Chinese provinces based on equality and efficiency principles. J. Clean. Prod. 2019, 211, 222–232. [Google Scholar] [CrossRef]
  31. He, W.J.; Zhang, B. A comparative analysis of Chinese provincial carbon dioxide emissions allowances allocation schemes in 2030: An egalitarian perspective. Sci. Total Environ. 2021, 765, 142705. [Google Scholar] [CrossRef]
  32. Yang, X.; Li, H.; Wallin, F.; Wang, Z. Impacts of emission reduction target and external costs on provincial natural gas distribution in China. Energy Procedia 2017, 105, 3326–3331. [Google Scholar] [CrossRef]
  33. Xue, J.; Zhao, L.; Fan, L.; Qian, Y. An interprovincial cooperative game model for air pollution control in China. J. Air Waste Manag. Assoc. 2015, 65, 818–827. [Google Scholar] [CrossRef] [PubMed]
  34. Xie, Z.X.; Li, Y.; Qin, Y.C.; Zheng, Z.C. Optimal Allocation of Control Targets for PM2.5 Pollution in China’s Beijing-Tianjin-Hebei Regions. Pol. J. Environ. Stud. 2019, 28, 3941–3949. [Google Scholar] [CrossRef]
  35. Xie, Z.X.; Li, Y.; Qin, Y.C. Allocation of control targets for PM2.5 concentration: An empirical study from cities of atmospheric pollution transmission channel in the Beijing-Tianjin-Hebei district. J. Clean. Prod. 2020, 270, 122545. [Google Scholar] [CrossRef]
  36. Zheng, L.Q. Responsibility sharing of carbon emission reduction among provinces and regions in China-A study based on the trade-off model of fairness and efficiency. J. Arid Land Resour. Environ. 2013, 27, 1–6. [Google Scholar]
  37. An, Q.; Wen, Y.; Xiong, B.; Yang, M.; Chen, X. Allocation of carbon dioxide emission permits with the minimum cost for Chinese provinces in big data environment. J. Clean. Prod. 2017, 142, 886–893. [Google Scholar] [CrossRef]
  38. Fang, G.C.; Liu, M.H.; Tian, L.X.; Fu, M.; Zhang, Y. Optimization analysis of carbon emission rights allocation based on energy justice—The case of China. J. Clean. Prod. 2018, 202, 748–758. [Google Scholar] [CrossRef]
  39. Cook, W.D.; Kress, M. Characterizing an equitable allocation of shared costs: A DEA approach. Eur. J. Oper. Res. 1999, 119, 652–661. [Google Scholar] [CrossRef]
  40. Beasley, J.E. Allocating fixed costs and resources via data envelopment analysis. Eur. J. Oper. Res. 2003, 147, 198–216. [Google Scholar] [CrossRef]
  41. Jahanshahloo, G.R.; Lotfi, F.H.; Shoja, N.; Sanei, M. An alternative approach for equitable allocation of shared costs by using DEA. Appl. Math. Comput. 2004, 153, 267–274. [Google Scholar] [CrossRef]
  42. Li, Y.; Yang, M.; Chen, Y.; Dai, Q.; Liang, L. Allocating a fixed cost based on data envelopment analysis and satisfaction degree. Omega 2013, 41, 55–60. [Google Scholar] [CrossRef]
  43. Du, J.; Cook, W.D.; Liang, L.; Zhu, J. Fixed cost and resource allocation based on DEA cross-efficiency. Eur. J. Oper. Res. 2014, 235, 206–214. [Google Scholar] [CrossRef]
  44. Sun, Z.R.; Zhou, D.Q.; Zhou, P. Quota allocation of China’s energy conservation based on environmental ZSG-DEA. Syst. Eng. 2012, 30, 84–90. [Google Scholar]
  45. Miao, Z.; Zhou, P.; Wang, Y.; Sun, Z. Energy saving, emission reduction and air pollutants emission rights allocation research. China Ind. Econ. 2013, 6, 31–43. [Google Scholar]
  46. Wu, X.; Tan, L.; Guo, J.; Wang, Y.; Liu, H.; Zhu, W. A study of allocative efficiency of PM2.5 emission rights based on a zero-sum gains data envelopment model. J. Clean. Prod. 2016, 113, 1024–1031. [Google Scholar] [CrossRef]
  47. Gomes, E.G.; Lins, M.P.E. Modelling undesirable outputs with zero sum gains data envelopment analysis models. J. Oper. Res. Soc. 2008, 59, 616–623. [Google Scholar] [CrossRef]
  48. Pang, R.Z.; Deng, Z.Q.; Chiu, Y.H. Pareto improvement through a reallocation of carbon emission quotas. Renew. Sustain. Energy Rev. 2015, 50, 419–430. [Google Scholar] [CrossRef]
  49. Chiu, Y.H.; Lin, J.C.; Su, W.N.; Liu, J.K. An efficiency evaluation of the EU’s allocation of carbon emission allowances. Energy Sources Part B Econ. Plan. Policy 2015, 10, 192–200. [Google Scholar] [CrossRef]
  50. Cucchiella, F.; D’Adamo, I.; Gastaldi, M.; Miliacca, M. Efficiency and allocation of emission allowances and energy consumption over more sustainable European economies. J. Clean. Prod. 2018, 182, 805–817. [Google Scholar] [CrossRef]
  51. Li, J.B.; Huang, X.J.; Chuai, X.W.; Sun, S.C. Study on carbon emission quota allocation based on total carbon emission and carbon intensity constraints. J. Arid Land Resour. Environ. 2020, 34, 72–77. [Google Scholar]
  52. Cai, W.; Ye, P. A more scientific allocation scheme of carbon dioxide emissions allowances: The case from China. J. Clean. Prod. 2019, 215, 903–912. [Google Scholar] [CrossRef]
  53. Yu, A.; Lin, X.; Zhang, Y.; Jiang, X.; Peng, L. Analysis of driving factors and allocation of carbon emission allowance in China. Sci. Total Environ. 2019, 673, 74–82. [Google Scholar] [CrossRef]
  54. Li, Z.Y.; Zhao, T.; Wang, J.; Cui, X.Y. Two-step allocation of CO2 emission quotas in China based on multi-principles: Going regional to provincial. J. Clean. Prod. 2021, 305, 127173. [Google Scholar] [CrossRef]
  55. Yang, M.; Hou, Y.; Ji, Q.; Zhang, D. Assessment and optimization of provincial CO2 emission reduction scheme in China: An improved ZSG-DEA approach. Energy Econ. 2020, 91, 104931. [Google Scholar] [CrossRef]
  56. Wang, K.; Zhang, X.; Wei, Y.M.; Yu, S. Regional allocation of CO2 emissions allowance over provinces in China by 2020. Energy Policy 2013, 54, 214–229. [Google Scholar] [CrossRef]
  57. Wang, B.; Zhao, J.; Wu, F.; Zhu, C.; He, Y.; Wei, Y. Allocating on coal consumption and CO2 emission from fair and efficient perspective: Empirical analysis on provincial panel data of China. Environ. Sci. Pollut. Res. 2019, 26, 17950–17964. [Google Scholar] [CrossRef] [PubMed]
  58. Wang, K.; Li, M.J. DEA modeling and application of carbon emission quota allocation. J. Beijing Univ. Technol. (Soc. Sci. Ed.) 2013, 15, 7–13. [Google Scholar]
  59. Pan, W.; Pan, W. Research on quota allocation of provincial CO2 emission rights in China based on energy efficiency. Soft Sci. 2018, 32, 45–48. [Google Scholar]
  60. Kong, X.Y.; Hou, M. Empirical analysis of carbon emission allocation efficiency based on DEA-CEA method. Stat. Decis. 2019, 8, 98–100. [Google Scholar]
  61. Dong, F.; Long, R.; Yu, B.; Wang, Y.; Wang, Y.; Li, J.; Dai, Y.; Yang, Q.; Chen, H. How can China allocate CO2 reduction targets at the provincial level considering both equity and efficiency? evidence from its Copenhagen Accord pledge. Resour. Conserv. Recyl. 2018, 130, 31–43. [Google Scholar] [CrossRef]
  62. Zhou, P.; Sun, Z.R.; Zhou, D.Q. Optimal path for controlling CO2 Emissions in China: A perspective of efficiency analysis. Energy Econ. 2014, 45, 99–110. [Google Scholar] [CrossRef]
  63. Sun, Z.; Luo, R.; Zhou, D. Optimal Path for Controlling Sectoral CO2 Emissions among China’s Regions: A Centralized DEA Approach. Sustainability 2016, 8, 28. [Google Scholar] [CrossRef] [Green Version]
  64. Song, J.; Chen, R.; Ma, X. Collaborative allocation of energy consumption, air pollutants and CO2 emissions in China. Sustainability 2021, 13, 9443. [Google Scholar] [CrossRef]
  65. Lins, M.P.E.; Gomes, E.G.; Soares de Mello, J.C.C.B.; Soares de Mello, A.J.R. Olympic ranking based on a zero-sum gains DEA model. Eur. J. Oper. Res. 2003, 148, 312–322. [Google Scholar] [CrossRef] [Green Version]
  66. Färe, R.; Grosskopf, S.; Lovell, C.A.K.; Pasurka, C. Multilateral productivity comparisons when some outputs are undesirable: A nonparametric approach. Rev. Econ. Stat. 1989, 71, 90–98. [Google Scholar] [CrossRef]
  67. Zhou, P.; Ang, B.W.; Poh, K.L. Measuring environmental performance under different environmental DEA technology. Energy Econ. 2008, 30, 1–14. [Google Scholar] [CrossRef]
  68. Miao, Z.; Zhou, P.; Li, X. China’s carbon intensity constraint efficiency allocation research during “12·5” period. Econ. Manag. 2012, 34, 25–36. [Google Scholar]
  69. Zhang, J.; Wu, G.Y.; Zhang, J.P. The Estimation of China’s provincial capital stock: 1952–2000. Econ. Res. J. 2004, 10, 35–44. [Google Scholar]
Figure 1. Efficiency measurement results of initial allocation scheme in 2020 under scenario A1.
Sustainability 14 02243 g001
Figure 2. The weighted comprehensive efficiency of the initial allocation scheme and its iterations.
Sustainability 14 02243 g002
Figure 3. Efficiency measurement results of national planning scheme in 2020.
Sustainability 14 02243 g003
Figure 4. Provincial classification based on energy conservation and emission reduction pressures. Note: Because the pressure index values of Beijing, Tianjin, and Shanghai are much smaller than those of other provinces, the three provinces are not shown in the figure.
Sustainability 14 02243 g004
Table 1. The initial allocation result of energy consumption quota in 2020.
ProvinceEnergy
Consumption
ProvinceEnergy
Consumption
ProvinceEnergy
Consumption
Beijing (BJ)7806.71Zhejiang (ZJ)22,042.53Hainan (HaN)2145.47
Tianjin (TJ)8932.65Anhui (AH)13,691.59Chongqing (CQ)9710.83
Hebei (HeB)33,743.98Fujian (FJ)13,326.19Sichuan (SC)21,796.54
Shanxi (SX)21,896.95Jiangxi (JX)9253.89Guizhou (GZ)10,789.58
Inner Mongolia (IM)22,398.46Shandong (SD)43,187.03Yunnan (YN)11,934.19
Liaoning (LN)23,501.95Henan (HeN)25,125.24Shaanxi (S’X)12,981.76
Jilin (JL)8734.19Hubei (HuB)18,384.77Gansu (GS)8187.11
Heilongjiang (HLJ)13,760.45Hunan (HuN)17,828.75Qinghai (QH)4386.41
Shanghai (SH)12,466.10Guangdong (GD)34,214.30Ningxia (NX)6283.11
Jiangsu (JS)33,722.06Guangxi (GX)10,978.09Xinjiang (XJ)16,789.12
Table 2. The initial allocation results of SO2, NOX, and CO2 emission quotas in 2020 under different scenarios (units: 104 tons).
ProvinceA1A2A3
SO2NOXCO2SO2NOXCO2SO2NOXCO2
BJ7.5014.4413,635.506.6813.8113,085.298.3315.0614,185.71
TJ8.0315.2017,095.268.3216.3919,152.497.7314.0215,038.04
HeB54.1197.11109,093.6054.60100.86118,608.4253.6293.3799,578.78
SX39.3657.5851,774.2643.2861.7754,959.3035.4453.3948,589.21
IM33.1649.4445,065.8439.5058.2352,878.0726.8240.6537,253.61
LN34.5352.4755,896.4937.4755.9861,418.7431.5948.9650,374.24
JL17.3832.2327,612.4117.3533.4627,896.6917.4231.0027,328.14
HLJ25.1246.6837,411.0324.4447.4736,025.6625.8045.9038,796.41
SH10.5121.3022,495.5010.2122.1724,160.4010.8220.4220,830.59
JS42.4578.3082,485.8743.0282.2589,211.3641.8874.3575,760.37
ZJ28.6249.6447,903.5028.0949.7748,473.7529.1449.5147,333.25
AH35.5066.8360,206.6532.0864.2256,937.8938.9269.4463,475.40
FJ19.5733.4133,143.4018.8232.6833,057.8420.3334.1533,228.97
JX29.7947.6242,135.2428.5545.2639,080.2331.0449.9845,190.25
SD65.49103.59101,431.0868.14106.85105,911.9162.83100.3396,950.24
HeN60.52105.0888,188.0458.00103.0982,866.5963.04107.0793,509.50
HuB32.8452.8253,972.4231.2349.9552,755.0234.4555.7055,189.82
HuN38.6860.8958,408.0036.0155.8154,071.7241.3565.9862,744.28
GD50.6594.4985,113.5846.5991.8381,449.4954.7097.1588,777.67
GX29.1547.2144,291.4926.7543.1840,521.7631.5551.2348,061.23
HaN4.288.807616.683.568.226858.405.019.388374.95
CQ21.1528.3625,572.5721.8027.3724,310.7020.4929.3426,834.45
SC49.7074.3771,586.4346.1466.3364,661.1553.2582.4178,511.71
GZ35.1041.1237,101.1737.3439.4034,999.6132.8642.8439,202.73
YN34.5950.7645,264.0333.2346.6640,638.9635.9554.8649,889.09
S’X29.1944.0835,937.9530.5545.1235,104.9827.8443.0536,770.93
GS23.2333.0227,877.6723.4431.7525,661.8823.0134.2830,093.45
QH5.417.676162.305.837.976100.534.997.376224.06
NX10.1515.7711,316.7712.0118.5412,754.648.2913.009878.89
XJ25.2839.5132,642.9328.0243.4034,824.1922.5435.6130,461.67
Table 3. The optimal allocation result in 2020 under scenario A1.
ProvinceEnergy Consumption
(104 tce)
SO2 Emissions
(104 tons)
NOX Emissions
(104 tons)
CO2 Emissions
(104 tons)
BJ15,242.5627.5444.9341,917.77
TJ10,459.8718.9130.8428,775.56
HeB20,381.9637.0360.1956,161.99
SX8517.1915.5625.1823,479.96
IM11,204.6220.3833.0830,859.01
LN16,591.2330.1048.9645,679.69
JL8859.4916.0726.1524,390.3
HLJ9527.2617.3128.1426,238.52
SH24,340.0138.5866.2869,154.84
JS48,301.2187.35142.42132,879.9
ZJ29,932.1954.1488.2682,342.48
AH15,896.7228.8546.9343,776.01
FJ18,607.9533.6754.8751,194.64
JX12,271.7722.2936.2333,788.92
SD42,992.6277.87126.81118,309
HeN25,535.4846.3575.3870,305.31
HuB19,249.6434.8956.7952,985.05
HuN20,609.8037.3760.8156,729.5
GD49,574.8089.68146.19136,384.1
GX11,510.7120.9133.9831,699.57
HaN2505.514.547.406897.615
CQ11,304.8920.5033.3531,109.66
SC21,430.4038.9063.2559,001.26
GZ8018.1914.6423.6822,089.94
YN10,077.4018.3529.7627,760.81
S’X12,476.3622.6536.8234,343.35
GS4508.218.2513.3312,429.62
QH1645.033.004.864530.291
NX2039.963.736.035622.854
XJ6386.9711.6518.8817,600.13
Table 4. Gini coefficients of the national planning scheme and three optimal allocation schemes in 2020.
IndexSchemeEnergy ConsumptionSO2 EmissionsNOX EmissionsCO2 Emissions
Per capita
Gini coefficient
National planning0.18140.28860.23320.2530
Scenario A10.20870.20280.20550.2097
Scenario A20.20870.20590.20880.2145
Scenario A30.20870.19980.20220.2049
Intensity
Gini coefficient
National planning0.20670.38590.31270.2907
Scenario A10.01470.00770.01140.0164
Scenario A20.01470.01400.01510.0220
Scenario A30.01470.00760.00840.0116
Table 5. The initial allocation result in 2025 under scenario A3.
ProvinceEnergy Consumption
(104 tce)
SO2 Emissions
(104 tons)
NOX Emissions
(104 tons)
CO2 Emissions
(104 tons)
BJ8997.421.1210.2415,848.86
TJ10,295.091.049.5316,801.11
HeB38,890.747.2063.47111,253.52
SX25,236.754.7636.3054,285.87
IM25,814.763.6027.6341,621.27
LN27,086.554.2433.2856,280.18
JL10,066.352.3421.0730,532.12
HLJ15,859.243.4631.2043,344.94
SH14,367.481.4513.8823,272.80
JS38,865.475.6250.5484,642.61
ZJ25,404.543.9133.6652,882.66
AH15,779.885.2247.2070,917.33
FJ15,358.752.7323.2137,124.77
JX10,665.334.1733.9850,488.41
SD49,774.078.4368.21108,316.80
HeN28,957.448.4672.79104,472.66
HuB21,188.884.6237.8661,660.34
HuN20,548.055.5544.8570,100.49
GD39,432.797.3466.0499,186.07
GX12,652.504.2334.8353,695.99
HaN2472.700.676.389356.84
CQ11,191.962.7519.9429,980.55
SC25,121.037.1556.0287,716.52
GZ12,435.254.4129.1243,798.90
YN13,754.444.8237.2955,738.14
S’X14,961.783.7429.2741,081.99
GS9435.843.0923.3033,621.65
QH5055.440.675.016953.78
NX7241.431.118.8411,037.10
XJ19,349.863.0224.2134,033.03
Table 6. The optimal allocation result in 2025.
ProvinceEnergy Consumption
(104 tce)
SO2 Emissions
(104 tons)
NOX Emissions
(104 tons)
CO2 Emissions
(104 tons)
BJ16,738.713.5329.2044,859.18
TJ12,044.062.5421.0132,283.19
HeB23,468.964.9841.0163,014.28
SX9353.2521.9916.3625,130.58
IM12,304.472.6121.5033,022.17
LN18,219.823.8631.8348,899.96
JL10,444.172.2118.2328,010.92
HLJ10,713.942.2718.7328,768.25
SH26,729.124.5939.5965,872.15
JS54,317.2611.4994.77145,617.80
ZJ33,660.327.1158.7390,229.29
AH18,304.353.8731.9749,107.18
FJ21,782.284.6038.0058,392.39
JX14,809.603.1325.8639,725.46
SD48,347.5910.2484.42129,700.55
HeN29,403.126.2351.3778,916.35
HuB26,214.125.5445.7570,289.11
HuN23,731.325.0341.4663,695.65
GD57,083.1412.0699.61153,041.00
GX13,569.662.8823.7236,434.96
HaN3471.980.736.069311.07
CQ13,017.112.7622.7434,929.96
SC24,676.145.2242.0866,192.69
GZ9676.412.0616.9225,987.02
YN12,593.712.6722.0233,820.21
S’X14,366.013.0525.1038,557.61
GS5314.601.139.2914,271.76
QH1849.930.393.234963.08
NX2348.930.504.116304.08
XJ7707.851.6413.4820,699.41
Table 7. Gini coefficients of the optimal EAC quota allocation scheme in 2025.
Energy ConsumptionSO2 EmissionsNOX EmissionsCO2 Emissions
Per capita Gini coefficient0.19900.19130.19310.1958
Intensity Gini coefficient0.01400.00650.00760.0107
Table 8. The pressure index values of energy conservation and emission reduction.
ProvinceEnergy ConservationEmission ReductionProvinceEnergy ConservationEmission Reduction
BJ−86.04%−194.77%HeN−1.54%26.73%
TJ−16.99%−119.27%HuB−23.72%−18.23%
HeB39.65%36.53%HuN−15.49%8.67%
SX62.94%55.60%GD−44.76%−56.49%
IM52.34%23.47%GX−7.25%32.01%
LN32.73%8.80%HaN−40.41%−1.23%
JL−3.75%9.08%CQ−16.31%−10.28%
HLJ32.44%35.98%SC1.77%24.85%
SH−86.04%−194.77%GZ22.19%45.31%
JS−39.76%−87.93%YN8.44%41.61%
ZJ−32.50%−75.64%S’X3.98%12.94%
AH−16.00%29.63%GS43.68%60.38%
FJ−41.82%−63.24%QH63.41%35.19%
JX−38.86%23.32%NX67.56%50.56%
SD2.87%−21.64%XJ60.17%43.13%
Table 9. Energy conservation and emission reduction pressure indexes in three national strategic regions.
National Strategic RegionEnergy ConservationEmission Reduction
Beijing-Tianjin-Hebei10.19%−4.22%
Yangtze River Economic Belt−23.13%−12.90%
21st Century Maritime Silk Road−13.87%−31.82%
New Eurasian Continental Bridge Economic Corridor0.82%7.69%
China-Mongolia-Russia Economic Corridor24.14%13.79%
Publisher’s Note: MDPI stays neutral with regard to jurisdictional claims in published maps and institutional affiliations.

