Abstract
China is the largest tea producer in the world; however, tea quality and safety issues have caught broad attention due to pesticide overuse in the growing stage. In order to control the quality and safety of their raw inputs, tea-processing firms in China are expanding their own plantations. Does this backward integration (BI) improve the food safety performance of the tea firms in China? Based on the transaction cost theory, we empirically investigate the effect of tea firms’ BI on their food safety performances, using data from 246 tea firms collected via an online survey in 2021. Controlling the basic background situation and firms’ characteristics, the empirical regression results, when controlling for the self-selection bias, support the hypothesis that BI can improve the food safety performance of the tea industry when it reaches the effective integration level, specifically, 80% or higher. Other factors include that the private brand and asset share of the plantation would also help reduce the firms’ food safety problems. Therefore, the government may consider supporting firms’ BI in the development of tea plantations through one-time subsidies and/or land and labor coordination, so as to improve the food safety situation and industry efficiency.
1. Introduction
The intensified relationship between agriculture and the environment has induced the transformation of industrial organization (IO) in the food supply chain, which in turn has contributed to both food safety and sustainable development [1]. Since the issue of food safety is gaining public attention around the world [2,3], the agri-food industry responds by including sustainability in their organization and governance strategy, especially for processing firms to pursue backward integration (BI) by acquiring direct control of raw food inputs [4,5,6,7]. It reflects the requirement of enhanced coordination along the modern agri-food supply chain as well as the transparency of food quality and safety information in sustainable development [8,9].
BI is the common choice of agri-food firms to ameliorate the situation of food safety and environmental damage in both developed and developing countries [10,11], caused by the segmented upstream small holders’ abuse of pesticides, fungicides and herbicides, and/or the excessive use of hormones, antibiotics and vaccines [12]. For instance, it was one of the major strategies for the British beef industry to rebuild the public confidence on food safety after the Mad Cow disease outbreak [13]. The Peruvian asparagus export industry also implemented BI in response to the newly imposed stringent food safety private standards and environmental requirements [14]. However, processing firms may also purchase part of raw food inputs from the spot market to fill their extra processing capacities, especially in developing countries when agricultural production is mostly carried out by small holders. These multi-organization forms, called plural forms in the literature (also called “partial BI”, “concurrent sourcing” or “tapered integration”), including vertical integration, vertical coordination with contracts and the open market, prevent firms from fully controlling the quality and safety of raw inputs [6,8,10,15]. As a result, food safety crises have kept emerging, threatening the sustainable development of agriculture [16,17].
Improved food safety standards were issued in China recently and a food safety supervision and management system has been established [18]. In response to the increasingly strict domestic and international standards, or the requirements such as the International Food Standard and Protected Geographical Indications (PGI) [19,20], Chinese food processing firms are starting to pay close attention to food safety and environment issues, striving to establish planting and cultivation bases of their own [4]. BI has grown in the dairy, meat and tea industries [21,22,23]. However, food safety scandals such as clenbuterol in pork, melamine in milk and pesticides in tea still appear from time to time [24,25,26], all of which reveal the weakest link of Chinese agri-food supply chain: the low quality and safety of the farm production or raw food inputs in China [21,27].
The unprecedented COVD-19 pandemic has greatly impacted the food consumption of people in the world including China [28,29]. Especially, people tend to care more about food safety and their health, and tea is one of the food/drink reported with an increased consumption in China [30,31] as well as other countries [32]. As the largest tea producer in the world, China has maintained rapid growth in tea production in recent decades, and its harvested area has exceeded the sum of all other countries since 2011 (Figure 1). In 2019, the production of tea in China was more than 2.79 million tons, valued at nearly RMB 24 billion, accounting for approximately 2% of the total gross annual value of agriculture in China [33,34]. The BI of the tea industry keeps rising. The tea plantation area owned by the top 100 tea manufactures in 2016 was over 287 thousand hectares in total, accounting for 10% of total plantations area in China, with annual growth rate of about 15% [34,35]. As the world’s three major healthy drinks, however, Chinese tea still causes food-borne disease outbreaks occasionally. According to the food inspection results of the Ministry of Agriculture in 2017, the tea industry has a safety qualification rate of 98.9% with problems mainly caused by the abuse of pesticides and herbicides in the planting stage, worse than that of the poultry and meat industry whose qualification rate is 99.5% [18]. In view of those facts, the research question of this paper is whether, or how, BI can improve the food safety performance of the tea firms in China.
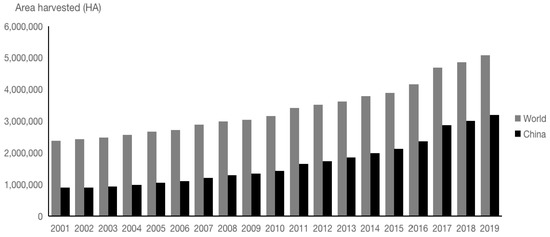
Figure 1.
Harvested tea plantation area, from 2001 to 2019. Source: Food and Agriculture Organization (FAO), from 2001 to 2019. (https://www.fao.org/faostat/en/#data/QCL, accessed on 1 December 2021).
BI plays an essential role in IO such as in eliminating paying markups, avoiding competition in the upstream market and pushing up production costs for downstream rivals [36,37,38]. In the agri-food research, studies mainly focus on how BI is related to industry efficiency, economic development, food security and the environment. For example, Pritchard et al. [39] and Yang et al. [40] investigated the impact of BI on reallocating agricultural resources. Chigozie, et al. [5] and Olanrewaju [41] studied the effect of BI on sustaining the raw input accessibility from the supply chain and on the competitive potentials of domestic agricultural sector, as well as on the environment. Macchiavello et al. [11] explored BI’s impact on the risk sharing of different parties involved when facing market uncertainty and found improved market allocation efficiency. BI’s impact on food safety is not in the mainstream of BI studies and is still low in attention and research efforts. Our study will add more empirical effort in this area.
Studies focusing on the role of BI in improving food quality and safety do exist, although their conclusions are ambiguous. Based on the transaction cost theory (TCT), Raynaud et al. [20] showed that BI would be more effective than spot markets in controlling the food supply chain that affects the final product quality. Kilmer et al. [9] confirmed the positive effect of BI on reducing pesticide residues in particular. Studies have shown that BI emerged to meet high private food safety standards for export and to control farmers’ opportunism when facing food safety uncertainty [14,42], and resulted in higher quality output [43]. On the other hand, there exist arguments stating that BI is unnecessary or unhelpful to ensure food quality and safety performance. Henson et al. [44,45] found that small holders can meet high safety and quality standards without being integrated by downstream supermarkets, and companies can upgrade food safety standards without BI. Li et al. [21] demonstrated that BI might not prevent firms from violating food safety rules effectively, although BI will improve their upper potential of quality control. One reason causing such conflicting results is that firms’ plural form of BI is not considered in these studies, and firms appear to be BI may not really gain the advantages of quality control. This study will emphasize on the plural form and quantify the BI level.
The critical gap in the literature is that most existing IO studies, including those aforementioned, focus only on one single organizational arrangement to study food quality and safety, such as in Chen et al. [42] and Olmos [46]. In reality, firms, especially agribusiness firms, often have the plural form. Parmigiani [47] took the proportion of raw materials produced independently as a measure of the level of BI in plural forms, pointing out that concurrent sourcing is a distinctly different choice existing along a make/buy continuum. However, few studies discuss the role of the plural form on food quality and safety performance of the firms. They, thus, fail to explore the optimal level of BI or measure the effect of BI levels on food safety performances. In this paper, we will discuss the impact of plural forms in the BI process on food safety performance and identify the effective level of BI.
In this paper, we explore the effect of the level of BI on the food safety performance of tea firms in China, using survey data from 246 Chinese tea firms. The samples were randomly selected from the tea processors in Guizhou, one of the largest planting areas of tea in China. The Probit and two-step models controlling the self-selection bias are applied to analyze the effective level of BI. Results of this research show that there is an effective level of BI to curb the food safety violations of the tea industry. The result would contribute to understand how the governance structure of the firms reconciles the food safety requirements of the government to achieve a sustainable goal. The rest of the paper is organized as follows: Section 2 demonstrates the theoretical framework, proposes the hypothesis and explains the data used; Section 3 reports empirical test results of the hypothesis; Section 4 discusses the meanings and policy implications of our results; and Section 5 summarizes the conclusions.
2. Materials and Methods
2.1. Theory and Hypotheses
Most of the food safety violations of the tea industry in China occur at the stage of crop growing, and asymmetric information is the key to causing market failure. Following Antle [48], we assume that producers know the quality and safety level of their products, while the buyers, processors and manufacturers who buy fresh tea leaves, in this case, do not know given imperfect testing. Farmers’ opportunistic behavior makes it costly for processors to detect safety problems [49], as even the incentive instruments entailed in contracts [50] are undermined by moral hazard behaviors under information asymmetry [51]. BI can internalize the information of the application of chemical inputs and food safety control technologies for tea growing, and we will test its effects on improving the efficiency of food safety management. However, the existence of plural form organization of the processors and manufacturers makes it difficult for the single governance structure to fully reveal its advantages. Although it is a continuous arrangement from open spot market to full integration [52], plural form is a different governance strategy from the perspective of production cost, transaction cost and firm capacity [47]. Processing firms can reduce the opportunistic behavior by threatening the actors of transaction of adopting a complete BI [53]. Therefore, there may exist an effective level of BI for firms to control the opportunistic behavior caused by asymmetric information in food safety, the effective plural form with a certain intensity of external purchase combined with some BI to achieve food safety under given resource constraints. On the base of the mechanism, we proposed Hypothesis 1 (H1).
Hypothesis 1 (H1).
Raising the Level of BI Would Have a Positive Impact on Food Safety Performance.
Food safety performance may be determined in the production decision of the firms depending on their capability and intangible resources, the external environment and corporate culture [15]. Whether firms can adopt BI may depend on these same factors [54,55]. Directly examining the BI’s contribution to firms’ food safety performance suffers the self-selection bias problem. It is necessary to identify and incorporate the aforementioned variables with regards to the firm governance structure in econometric analysis to avoid this problem. Several methods are applied to address the issue in business performance, such as Shaver [56] and Olmos [46] adopting Heckman’s [57] two-step selection model, and Cainelli et al. [58] using TCT. TCT suggests many factors can be discussed as far as the BI with a large amount of hardly reversible investment is concerned [44,59,60], but the tenet of TCT is “discrimination alignment”, i.e., when the governance structure matches the attributes of the transaction, the efficiency will be improved. On the other hand, when the transactions become complex and there is an investment of specialized assets, the governance structure would induce opportunistic behavior and lead to the misalignment, which would result in inefficiency.
To measure the level of misalignment and identify which kind of governance structure is efficient, TCT suggests that attributes of transactions determined by asset specificity, uncertainty and transaction frequency need to be considered [61]. With regard to the tea industry, the assets specifically related to food safety are embodied in the application of pest control technologies and equipment. Since the heavy use of these chemicals happens in the seasons of summer and autumn, with the serious spread of pests and diseases [62], the tea harvested in those seasons has greater food safety risks. Therefore, tea growers need to invest more specific assets to control the safety risk, such as special pesticides that is safer as well as biological, physical and/or chemical pest control facilities, etc. Precipitation is a major uncertainty that affects the safety of both fresh tea leaves and tea products [9]. For transaction attributes, differentiation and reputation are two of the influencing factors [46]. Compared with the high-end tea of famous brands, firms producing bulk wholesale tea characterized by large quantity and low product differentiation have to rely on the market to acquire a certain amount of raw tea to maintain low cost [63], while it is difficult for the high-end tea to do the same, while securing high quality and safety. Spatial agglomeration of tea firms will also reduce the difficulty of supervision and the uncertainty of all transacting entities [58]. In view of that, the second hypothesis is proposed as follows:
Hypothesis 2 (H2).
Considering the Self-Selection Bias, the Misalignment of Governance Will Reduce the BI Effect on Food Safety Performance.
2.2. Data
Samples were randomly selected from the tea processors in Guizhou, one of the provinces with the largest planting area of tea in China at the beginning of 2021. The tea planting area of Guizhou was about 7 million mu (or 470 thousand hectares) [62]. Guizhou is also the only province that has been issued the Protected Geographical Indication, “Guizhou Green Tea”, in China and is vigorously promoted as “ecological tea” and “safe tea” nationally [62]. However, the food safety risk of the tea in Guizhou exists and has led to the deterioration of the reputation of its “safe tea” brand. Local governments have been strengthening the control of the tea safety and quality in recent years [64]. There is a trend of BI in the tea industry in Guizhou. According to the statistics, the proportion of the tea plantation owned by the firms in Guizhou is up to 49% in 2019 [62]. Guizhou is representative for analyzing the effect of BI on the food safety performance of China’s tea industry.
Data used in this paper are collected by the Guizhou Food and Drug Administration (GFDA) and the Ministry of Agriculture (MOA) via an online survey on the platform operated by a national marketing company, Wenjuanxing. Several rounds of pilot surveys were carried out offline to collect the feedback from the managers of the tea firms to improve the questionnaire. A total of 294 tea firms have participated in our survey, and a total of 246 valid questionnaires have been collected, covering different firm sizes in different regions of Guizhou province.
The descriptive statistics of basic background and characteristics of the firms are presented in Table 1. Data show all surveyed firms are engaged in tea processing, 34 of which are cooperatives. The scale of the tea firms is measured by the fixed assets, those having between RMB 5 million and RMB 20 million are defined as medium-sized, and those above RMB 20 million are defined as large-sized. Specifically, 34.55% of the firms are medium-sized, 26.42% are large-sized, and the rest are small-sized with under RMB 5 million in fixed assets. Due to the zero-tolerance rules in food safety and quality [65], we use whether a tea firm has a food safety violation as the indicator variable of its food safety performance. By this measurement, a firm can only be categorized as being safe or unsafe, not how unsafe. According to the national food safety standard for tea products [66], 33 firms had self-reported food safety violations in 2020. The average operation of sample firms is 10 years. About 64% of total respondents have developed private brand, 9% have registered with the HACCP system, 39% have obtained organic registration and certification and 55% have implemented the national product standards.

Table 1.
Variables and descriptive statistics.
In terms of the level of BI, we use the percentage of the fresh leaves harvested in the own tea plantation in 2019 as the proxy [47]. Seven options have been provided to ensure the accuracy of the level of BI and reduce the distortion of the answer [67]. 219 manufactures have their own tea plantation, and the median size is 800 mu. It sheds light on that most tea firms would choose certain level of BI. More than half of them choose to build own tea plantation combined with outsourcing fresh tea leaves in a plural form (Figure 2).
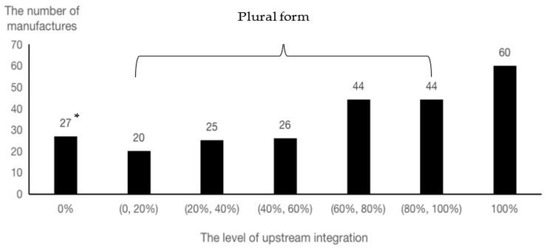
Figure 2.
Number of firms with the different level of BI. (Source: survey data, 2020). Note: * the number of the firms in each category of BI levels.
BI level of the tea firms is measured in seven categories from no integration (BI [0], i.e., buy at the market or sign contract) to full integration (BI [100%], i.e., plant by self). The trend of BI of the samples is obvious: 89% of the samples have developed their own tea plantation, and 65% have chosen plural forms (from BI (0, 20%) to BI [80%, 100%), or tapered integration or concurrent souring) to acquire the fresh leaves of raw tea. After initial comparison of the level of BI and the food safety violations of the firms, we find that there is an apparent negative relationship between the BI level and the frequency of the food safety violations of the tea firms. For all level of BI, the food safety violations of the tea firms will decrease obviously, of which the lowest level is achieved at 80% of the BI level (Figure 3). The mechanism behind the results needs to be further discussed in the following empirical analysis.
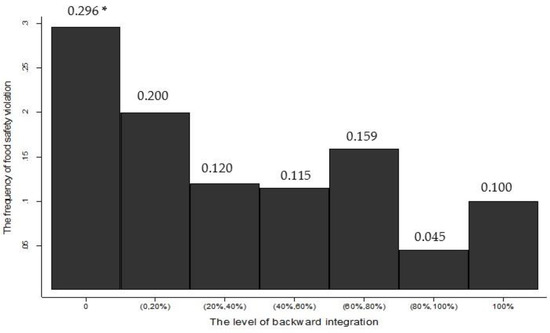
Figure 3.
The level of BI and the frequency of food safety violations (Source: survey data, 2020). Note: * the average frequency of food safety violations in each category of BI levels.
2.3. Empirical Models
Following [27], we try to find factors affecting the likelihood of a firm being placed into the unsafe category, that is, the firm is caught for violating of having food safety regulation. The Probit model is applied to estimate the likelihood of a food safety violation by a tea firm specified as,
where is the indicator for firm i to be caught with a food safety violation or not, . We record “” when there were violations in 2020 and “” otherwise, based on the government inspection results in 2020. is the variable of the level of BI. Firms without own tea plantations are treated as the reference group in the regressions of model (1). is a vector of control variables including firms’ risk control measurements, such as application of the HACCP [68], the frequency of national food testing, whether national standards are implemented [27]; the firms’ characteristics including the size based on total assets, production experiences measured by actual years in business, organizational forms (cooperatives or not) and main types of tea sold related to safety attributes (summer-autumn tea or spring tea); and a variable reflecting corporate reputations, i.e., having a famous brand or not. The proportion of tea plantation assets to total fixed assets is a key variable representing BI. and represent parameters to be estimated, and is the error term. is the cumulative distribution function of the standard normal distribution.
As explained earlier, the self-selection bias is an issue to estimate (1) directly and using the coefficient of BI, to explain the effect of BI on safety performance is inappropriate. From the perspective of transaction attributes, TCT provides a prediction of the choice of organization structure. Based on the prediction, the two-step estimation method developed for studying the impact of organizational arrangement on performance [47,69] is used here to estimate the food-safety-violation function. Technically, the Probit model is used to estimate the selection process of the governance structure of the tea firms,
where if BI level is effective to decrease the food safety violations that have been identified by model (1), and otherwise. According to the regression results of model (1), if the BI level significantly affects the food safety violations of the tea firms, we can identify it as the effective level of BI*. is a vector of variables influencing the governance structure of the organization, including the physical assets specificity, dedicated assets, differentiation, precipitation uncertainty, behavior uncertainty and the production experience. is the error term and would be attributable to unobservable characteristics that affect the decision of the effective level of BI. in model (1) and in model (2) could be correlated if there are same unobservable characteristics captured in both of them, which would result in selection bias. The inverse-mills index () is applied to correct the self-selection bias [56], which is defined as:
in which is the probability density function and is the cumulative distribution function of the standard normal distribution in model (2).
As discussed above, the governance misalignment could influence the judgement of the effect of the governance structure on the food safety performance if the structure does not meet the TCT prediction. The misalignment variable measures the difference between the observed and the predicted values as the loglikelihoods in the following way [58,59]:
It is used to capture the possibility of excessive governance when selecting the effective level of BI, or the possibility of too little governance when outsourcing. Thus, both of the variables of (measuring the self-selection bias) and Misalign (measuring the governance misalignment) are brought into the Probit model of the food safety violations for the firms choosing the effective level of BI in model (3) and not doing so in model (4), which are specified as:
where is the measurement of the food safety violations of firms for effective BI, while is the measurement for ineffective BI.
3. Results
Regression results from models (1) to (4) are reported in Table 2. Based on the regression results of model (2), (the inverse mills index) and (governance misalignment) are calculated and included in the safety violation regression to produce results of the model (3) for firms achieving the effective BI level and model (4) for firms not. The coefficients for the inverse Mill’s ratio and the Misalign variable are both significant in model (4), which confirms the existence of the selection bias and support the necessary model using the two-stage regression of (3) and (4). However, they are both insignificant in model (3), indicating that for firms that BI shows effective impacts on food safety, the estimation results from model (1) suffer little selection bias, and, thus, model (1) results still can give us some references.
Table 2.
Regression results of the Probit models of food safety violations and governance structure selection.
Several variables are consistently significant in models (1), (3) and (4). They are national test frequency, test plantation assets and physical asset specificity, although their magnitudes are different in general, as models (3) and (4) are the bias corrected version of (1) for firms under effective BI and not separately. A column of marginal effects is added for models (1) and (4), since the coefficients of Profit models do not give the marginal effect of each explanatory variable on the probability of recording food safety violations, which we are interested in. The selection model (2) also identifies variables that influence whether a firm can achieve effective BI or not.
4. Discussion
According to the coefficients of models (1), (3) and (4), BI can improve food safety performance of tea industry under the condition that it reaches the effective level. This is firstly supported by the combined facts that 80% and higher BI categorical coefficients in model (1) are significantly negative and model (3) shows no selection bias. To be specific, if there is 80% or more but less than 100% of the fresh tea leaves come from the firms’ own tea plantations, the likelihood of food safety violations of the tea firms will decrease by 24% point from the no integration situation at the significance level of 5%; if firms are completely integrated, BI = 100%, the likelihood will decrease by 13% from the no integration situation at the significance level of 10%. It shows the existence of effective levels of BI for tea firms’ food safety performance. This result supports H1 in general because Table 1 shows about 60% of tea firms are under 80% level of BI, and furthermore increasing BI will help improve food safety. Compared with firms without tea plantation, 80% or more of BI is the effective level.
Results further confirm that the plural form is not significantly different from market transaction in terms of food safety performance, which is different from other studies on the manufacture industries that detect the inverted “U” relationship between the level of BI and the performance [70]. The empirical results support that it is appropriate to treat the plural form as the continuous structure between the market and hierarchy system in improving food safety performance.
Model (1) also shows that firms’ heterogeneous characteristics may affect their food safety performances. Firms with private brands will reduce the safety violation likelihood by 8%. This is in line with the discussion of Ménard et al. [71], that the incentive effect of reputation mechanism will be higher if the firms have private brands. The frequency of national testing has a negative impact on food safety performance by increasing the probability of violation with each additional test increasing the chance of a food safety violation being caught by 1%. This is quite reasonable because the violations are mostly caught during testing, except very severe ones causing short-term recognizable health damages to the public. More frequent testing will yield higher possibility of being caught. As expected, if there is physical asset specificity (the proportion of summer-autumn tea as the proxy), the likelihood of violation will increase at the significance level of 5%.
The higher the proportion of the tea plantation assets in the fixed assets, the lower the likelihood of a food safety violation, which is significant at the 5% level. This is also reasonable because firms with more of their own plantations, which usually means higher BI levels, can control their tea-growing safety. Firm size does not significantly affect the food safety performance in this case. The dummy variables representing medium size with total assets between RMB 5 to 20 million and large size of RMB 20 million or above are not significantly different from small size in safety performance. This is in line with inconsistent results in the literature, such as some found the relationship between firm size and food safety level can be U-shaped [72], while others found no correlation in the agricultural sector [73]. We do not find a significant difference between the cooperative status and the food safety, either.
The regression results of model (2) show that the proportion of the physical asset specificity (the proportion of summer-autumn tea) and the dedicated asset (obtaining organic registration and certification) of the firms will increase the likelihood of achieving the effective BI, at the significance level of 1% and 10%, respectively; while the differentiation effect (outsourcing raw tea) would reduce the probability at the significance level of 1%. No significant impact of uncertainty on the effective BI was found.
The regression results detect the selection bias and the governance misalignment only in model (4) but not in model (3). In model (4), the self-selection bias is positive at the significance level of 5% for the tea firms, which have not achieved the effective level of BI. The governance misalignment is positive at the significance level of 5%. It indicates that under the condition of high contract risk of food safety, the firms that have not achieved the effective level of BI are more likely to have a safety violation. Controlling the self-selection bias, the likelihood of a food safety violation will decrease if the firms have chosen an effective level of BI. The marginal effects show that the likelihood of a food safety violation will decrease by 33%; if the misalignment level decreases by 1%, supporting the relation that effective organization structure can improve food safety levels. This result supports H2, that considering self-selection bias, a misalignment damages food safety effect is brought by BI. The significant coefficients in model (4) provide different sizes to those in model (1) after the correction of the selection bias. This means the impacts of national test frequency (0.07 vs. 0.01), tea plantation asset (−1.10 vs. −0.86) and physical asset specificity (0.21 vs. 0.12) are larger for those firms without effective BI levels.
5. Conclusions
Based on the transaction cost theory, this study empirically examines the effect of the level of BI on the food safety performance of the tea industry in China, using the survey data of 246 tea firms randomly collected through the online survey in 2021. The results show that there is an effective level of BI to curb the food safety violations of the tea industry. It indicates that although promoting the level of BI would decrease the likelihood of food safety violations, only the levels of 80% or above demonstrate a statistically significant effect. The conclusion implies that promoting BI to the effective level can improve firms’ efficiency of risk management through internalizing sourcing and turning previous independent farmers into employees. The threat of eliminating the spot purchase and contracting purchase also provides farmers incentives by reducing the opportunistic behavior in the market and moral hazard in sourcing contracts. In view of that, the government should encourage and promote the vertical integration of the tea industry for firms to expand their plantation to improve food safety performance. Concrete measurements include that the government can offer subsidies at the beginning of the BI for firms to acquire plantations and provide them the labor subsidies or better social service of agricultural machinery to decrease the labor cost, as it is a very labor intensive-industry. The strengthening of the integration of government, industry and research institutes can also reduce the development cost of tea plantation and promote the BI of the firm.
Our empirical results indicate that the private brand will stimulate the firms to enhance the loyalty of the customer and promote the market competitiveness of their products by improving the food safety performance. However, the government pays more attention on the public branding system such as PGI (Protected Geographical Indications) but not the famous private brands in the tea industry. As the results indicate, private brands would significantly decrease the likelihood of a food safety violation, so the government should encourage firms to create and promote their own private brands, instead of sparing no effort to promote public brands, which would improve food safety performance through the reputation effect. Other factors such as the proportion of tea plantation assets would also decrease the likelihood of food safety violations significantly. It implies that the efficiency of the food safety management of the firm depends on the relative value of the tea plantation assets to the whole firm assets. Therefore, the government should encourage them to strengthen the in-depth integration with other correlative industries, such as the development of deep-processing, for improving product-added value and tea-culture tourism, for increasing the landscape value of tea plantations.
The findings also support the hypothesis that the self-selection bias and the misalignment of the governance strategy will reduce the food safety performance of the tea firms, especially for those with the (backward) level of below 80%. Under-investment on the tea plantation would make those firms pay less attention to planting and resource management, which possibly leads to the low actual efforts on the quality and safety control of raw inputs and ends up in low food safety performance [21]. The existence of governance misalignment proves that if the firms promote the level of BI to 80% or above, their food safety performance would be improved. For this reason, it is the promotion of the BI of the firms with limited tea plantation rather than the enforcement of food safety regulation or emphasizing the R&D investment should be the priority to the government. To effectively control the risk of food quality and safety, three major attributes of the firms should be given adequate attention: the proportion of summer-autumn tea, application for organic certification, and the procurement of the primary tea leaves in the market. The attributes of environment and agglomeration of tea industry should be considered as well. As verified, transaction cost may affect food safety performance of the firms, so the government needs to accelerate the improvement of food safety supervision and the management system of the supply chain, especially upstream, to reduce the defects in the quality and safety controls of raw materials in tea plantations and sourcing.
There are some limitations that need to be further discussed in the future. First of all, the dynamic relationship between the level of BI and the food safety performance should be further discussed. With the improvement of the market mechanism, the quality and safety information of raw materials would be more transparent, which would decrease the transaction cost. Under such circumstance, the level of BI of the tea industry would continue to decline. Panel data or wide range of data involving more areas at different stage of development would be conductive to testing the hypothesis. In addition, the paper considers only the level of BI according to “make or buy”, without distinguishing the influence of other organizational arrangements, such as the role of interfirm agreements and franchising. How to bring it into effect for improving the food safety performance of firms also deserves further attention in the future.
Author Contributions
Conceptualization, H.W.; methodology, Z.L.; writing—original draft preparation, H.W. and Z.L.; writing—review and editing, H.H.W. All authors have read and agreed to the published version of the manuscript.
Funding
This research was funded by National Natural Science Foundation of China, grant number 71963006.
Institutional Review Board Statement
Ethical permission was not applied for because no ethical issues were involved in this paper.
Informed Consent Statement
Ethical review and approval were waived for this study because non-routine procedures were not used in this paper.
Data Availability Statement
The data presented in this study are available on request from the corresponding author. The data are not publicly available due to copyright.
Acknowledgments
Tian Xia from Kansas State University, Manhattan, Kansas, USA, is sincerely recognized for their constructive comments and suggestions, which have greatly contributed to this paper.
Conflicts of Interest
The authors declare no conflict of interest.
References
- Malorgio, G.; Marangon, F. Agricultural business economics: The challenge of sustainability. Agric. Food Econ. 2021, 9, 1–14. [Google Scholar] [CrossRef]
- Blasi, E.; Ruini, L.; Manotti, C. Technologies and new business models to increase sustainability in agro-food value chain Promote quality and reduce environmental footprint in durum wheat cultivation processes. Agro Food Ind. Hi Tech. 2017, 28, 52–55. [Google Scholar]
- Zanello, G.; Poole, N.; Kydd, J. Buy or make? Agricultural production diversity, markets and dietary diversity in Afghanistan. Food Policy 2019, 87, 101731–101746. [Google Scholar] [CrossRef]
- Gale, H.F.; Hu, D.H. Food safety pressures push integration in China’s agricultural sector. Am. J. Agric. Econ. 2012, 94, 483–488. [Google Scholar] [CrossRef]
- Chigozie, N.; Chinasa, O.E. Upstream business integration strategy and profitability of food manufacturing industries in Nigeria. Eur. J. Bus. Manag. 2016, 8, 113–116. [Google Scholar]
- Ménard, C. Organization and governance in the agrifood sector: How can we capture their variety? Agribusiness 2018, 34, 142–160. [Google Scholar] [CrossRef]
- Anh, N.H.; Bokelmann, W.; Thuan, N.T.; Nga, D.T.; Van Minh, N. Smallholders’ preferences for different contract farming models: Empirical evidence from sustainable certified coffee production in Vietnam. Sustainability 2019, 11, 1–26. [Google Scholar]
- Ciliberti, S.; Sarto, S.D.; Frascarelli, A.; Pastorelli, G.; Martino, G. Contracts to govern the transition towards sustainable production: Evidence from a discrete choice analysis in the durum wheat sector in Italy. Sustainability 2020, 12, 9441. [Google Scholar] [CrossRef]
- Kilmer, R.L.; Andre, A.M.; Stevens, T.J. Pesticide residues and vertical integration in Florida strawberries and tomatoes. Agribusiness 2001, 17, 213–226. [Google Scholar] [CrossRef]
- Ménard, C.; Klein, P.G. Organizational issues in the agrifood sector: Toward a comparative approach. Am. J. Agric. Econ. 2004, 86, 750–755. [Google Scholar] [CrossRef]
- Macchiavello, R.; Miquel-Florensa, J. Vertical Integration and Relational Contracts: Evidence from the Costa Rica Coffee Chain. CEPR Discuss. Pap. 2017, 11874. [Google Scholar]
- Gremmen, B.; Blok, V.; Bovenkerk, B. Responsible innovation for life: Five challenges agriculture offers for responsible innovation in agriculture and food, and the necessity of an ethics of innovation. J. Agric. Environ. Ethic-J. 2019, 32, 673–679. [Google Scholar] [CrossRef]
- Hornibrook, S.A.; Fearne, A. Demand driven supply chains: Contractual relationships and the management of perceived risk. Pharm. J. Hum. Pharm. Drug Ther. 2005, 17, 857–860. [Google Scholar]
- Schuster, M.; Maertens, M. Do private standards create exclusive supply chains? New evidence from the Peruvian asparagus export sector. Food Policy 2013, 43, 291–305. [Google Scholar] [CrossRef]
- Martino, G.; Polinori, P. Food safety, hybrid structures and preferences for contractual rules: Theory and evidence from the Italian poultry sector. In Proceedings of the XIII Isnie Conference, Berkeley, CA, USA, 18–20 June 2009; Available online: https://papers.ssrn.com/sol3/papers.cfm?abstract_id=1420143 (accessed on 15 June 2009).
- Mayett-Moreno, Y.; López, O.J. Beyond food security: Challenges in food safety policies and governance along a heterogeneous agri-Food chain and its effects on health measures and sustainable development in Mexico. Sustainability 2018, 10, 4755. [Google Scholar] [CrossRef]
- Shao, Y.T.; Wang, Y.P.; Yuan, Y. W Food safety and government regulation in rural China. J. Agric. Food Res. 2021, 5, 100170. [Google Scholar] [CrossRef]
- Wu, L.H.; Yin, S.J. China Development Report on Food Safety in 2018; Peking University Press: Beijing, China, 2018. [Google Scholar]
- Hammoudi, A.; Hoffmann, R.; Surry, Y. Food safety standards and agri-food supply chains: An introductory overview. Eur. Rev. Agric. Econ. 2009, 4, 469–478. [Google Scholar] [CrossRef]
- Raynaud, E.; Sauvee, L.; Valceschini, E. Alignment between quality enforcement devices and governance structures in the agro-food vertical chains. J. Manag. Gov. 2005, 9, 47–77. [Google Scholar] [CrossRef]
- Li, X.; Huang, A.N.; Li, X.W. An economic explanation for “unworthy of the name” and “worthy of the name”: Taking the food safety problem as an example. J. Financ. Econ. 2018, 44, 109–122. [Google Scholar]
- Zhou, Y.H.; Gen, X.H. Cultivating the industrial organization is critical to improve the competitiveness on animal husbandry of China. Ind. Econ. Res. 2003, 01, 64–70. [Google Scholar]
- Cao, L.Q. Analysis on the organizational form of the primary production of tea. J. Tea Commun. 2001, 4, 34–37. [Google Scholar]
- Greenpeace. Pesticides: Hidden Ingredients in Chinese Tea; Greenpeace China: 2012. Available online: https://issuu.com/greenpeace_eastasia/docs/pesticide_hidden_ingredient_report_final (accessed on 4 November 2012).
- Ortega, D.L.; Wang, H.H.; Olynk, N.J.; Wu, L.; Bai, J. Chinese consumers' demand for food safety attributes: A push for government and industry regulations. Am. J. Agric. Econ. 2012, 94, 489–495. [Google Scholar] [CrossRef]
- Ortega, D.L.; Wang, H.H.; Wu, L.; Olynk, N.J. Modeling heterogeneity in consumer preferences for select food safety attributes in China. Food Policy 2011, 36, 318–324. [Google Scholar] [CrossRef]
- Wang, H.S.; Xia, T.; Guan, Z.F. Market power and food safety in the China pork industry. Agribusiness 2019, 35, 97–113. [Google Scholar] [CrossRef]
- Yue, W.; Liu, N.; Zheng, Q.; Wang, H.H. Does the covid-19 pandemic change consumers’ food consumption and willingness-to-pay? the case of China. Foods 2021, 10, 2156. [Google Scholar] [CrossRef]
- Hao, N.; Wang, H.H. Food consumption and stigmatization under COVID-19: Evidence from Chinese consumers’ aversion to Wuhan hot instant noodles. Agribusiness 2021, 37, 82–90. [Google Scholar] [CrossRef]
- Luo, Y.; Chen, L.; Xu, F.; Gao, X.; Han, D.; Na, L. Investigation on knowledge, attitudes and practices about food safety and nutrition in the China during the epidemic of corona virus disease 2019. Public Health Nutr. 2021, 24, 267–274. [Google Scholar] [CrossRef] [PubMed]
- Jia, P.; Liu, L.; Xie, X.; Yuan, C.; Chen, H.; Guo, B.; Zhou, J.; Yang, S. Changes in dietary patterns among youths in China during COVID-19 epidemic: The COVID-19 impact on lifestyle change survey (COINLICS). Appetite 2021, 158, 105015. [Google Scholar] [CrossRef]
- AlTarrah, D.; AlShami, E.; AlHamad, N.; AlBesher, F.; Devarajan, S. The impact of coronavirus covid-19 pandemic on food purchasing, eating behavior, and perception of food safety in Kuwait. Sustainability 2021, 13, 8987. [Google Scholar] [CrossRef]
- National Bureau of Statistics of China (NBS). China Statistical Yearbook 2017; China Statistics Press: Beijing, China, 2017.
- China Tea Marketing Association. Annual Reports on China’s Tea Industry in 2017; China Light Industry Press: Beijing, China, 2017. [Google Scholar]
- Wang, Z.C. Thematic Interpretation of the 14th Five-Year Development Plan of China Tea Industry-Construction of Tea Industry Entities; China Tea Marketing Association: Beijing, China, 2021; Available online: https://www.sohu.com/a/473336896_307138 (accessed on 21 June 2021).
- Bresnahan, T.; Levin, J. Vertical Integration and Market Structure. NBER Working Paper No. 17889, Cambridge, MA, USA, 2012. Available online: http://www.nber.org/papers/w17889 (accessed on 27 March 2012).
- Loertscher, S.; Riordan, M.H. Make and buy: Outsourcing, vertical integration, and cost reduction. Am. Econ. J. Microecon. 2019, 11, 105–123. [Google Scholar] [CrossRef]
- González, R.H.; Kujal, P. Vertical integration, market foreclosure and quality investment. Port. Econ. J. 2012, 11, 1–20. [Google Scholar] [CrossRef][Green Version]
- Pritchard, B.; Connell, J. Contract farming and the remaking of agrarian landscapes: Insights from South India’s chilli belt. Singap. J. Trop. Geogr. 2011, 32, 236–252. [Google Scholar] [CrossRef]
- Yang, X.; Paulson, N.D.; Khanna, M. Optimal mix of vertical integration and contracting for energy crops: Effect of risk preferences and land quality. Appl. Econ. Pers. Policy 2016, 4, 632–654. [Google Scholar] [CrossRef]
- Olanrewaju, R.A. BI: A Panacea for Rural Development in Nigeria. Acad. J. Econ. Stud. 2016, 2, 38–56. [Google Scholar]
- Chen, M.; Mao, N. Uncertainty, quality and safety and the choice of governance structure for strategic raw material investment of edible agricultural products -- based on the investigation of Chinese dairy manufactures. Manag. World 2015, 6, 125–140. [Google Scholar]
- Hansman, C.; Hjort, J.; León, G.; Teachout, M. Vertical integration, supplier behavior, and quality upgrading among exporters. J. Political Econ. 2020, 128, 3570–3625. [Google Scholar] [CrossRef]
- Henson, S.; Jaffee, S.; Masakure, O. The participation of smallholder farmers in high-value export markets governed by standards: The role of exporter procurement practices. Front. Econ. Glob. 2013, 12, 261–290. [Google Scholar]
- Henson, S.; Masakure, O.; Boselie, D. Private food safety and quality standards for fresh produce exporters: The case of Hortico Agrisystems, Zimbabwe. Food Policy 2005, 30, 371–384. [Google Scholar] [CrossRef]
- Olmos, M.F. The performance implications of “grow or buy” decisions in the wine industry. Food Policy 2010, 35, 256–264. [Google Scholar] [CrossRef]
- Parmigiani, A. Why do firms both make and buy? An investigation of concurrent sourcing. Strateg. Manag. J. 2007, 28, 185–311. [Google Scholar] [CrossRef]
- Antle, J.M. Chapter 19. Economic analysis of food safety. Handb. Agric. Econ. 2001, 1, 1083–1136. [Google Scholar]
- Hennessy, D.A. Information asymmetry as a reason for food industry vertical integration. Am. J. Agric. Econ. 1996, 78, 1034–1043. [Google Scholar] [CrossRef]
- Frascarelli, A.; Ciliberti, S.; Oliveira, G.M.D.; Chiodini, G.; Martino, G. Production contracts and food quality: A transaction cost analysis for the Italian durum wheat sector. Sustainability 2021, 13, 2921. [Google Scholar] [CrossRef]
- Vetter, H.; Karantininis, K. Moral hazard, vertical integration, and public monitoring in credence goods. Eur. Rev. Agric. Econ. 2002, 29, 271–279. [Google Scholar] [CrossRef]
- Schnaider, P.; Ménard, C.; Saes, M. Heterogeneity of plural forms: A revised transaction cost approach. Manag. Decis. Econ. 2018, 39, 652–663. [Google Scholar] [CrossRef]
- Puranam, P.; Gulati, R.; Bhattacharya, S. How much to make and how much to buy? An analysis of effective plural sourcing strategies. Strateg. Manag. J. 2013, 34, 1145–1161. [Google Scholar] [CrossRef]
- Mayer, K.J.; Salomon, R.M. Capabilities, contractual hazards, and governance: Integrating resource-based and transaction cost perspectives. Acad. Manag. J. 2006, 49, 942–959. [Google Scholar] [CrossRef]
- Sarkar, M.B.; Echambadi, R.; Cavusgil, S.T.; Aulakh, P.S. The influence of complementarity, compatibility, and relationship capital on alliance performance. J. Acad. Mark. Sci. 2001, 29, 358–373. [Google Scholar] [CrossRef]
- Shaver, J.M. Accounting for endogeneity when assessing strategy performance: Does entry mode choice affect FDI survival? Manag. Sci. 1998, 44, 571–585. [Google Scholar] [CrossRef]
- Heckman, J. Sample Selection Bias as a Specification Error. Econometrica 1979, 47, 153–161. [Google Scholar] [CrossRef]
- Cainelli, G.; Iacobucci, D. Vertical integration, organizational governance, and firm performance: Evidence from Italian business groups. Manag. Decis. Econ. 2015, 36, 517–527. [Google Scholar] [CrossRef]
- Leiblein, M.J.; Reuer, J.J.; Dalsace, F. Do make or buy decisions matter? The influence of organizational governance on technological performance. Strateg. Manag. J. 2002, 23, 817–833. [Google Scholar] [CrossRef]
- Brouthers, K.; Brouthers, L.E.; Werner, S. Transaction cost-enhanced entry mode choices and firm performance. Strateg. Manag. J. 2003, 24, 1239–1248. [Google Scholar] [CrossRef]
- Williamson, O.E. The economic institutions of capitalism; Free Press: New York, NY, USA, 1985. [Google Scholar]
- Xu, T.C.; Hu, J.C. Annual Report on Tea Industry in Guizhou 2019; Guizhou Science and Technology Publishing House: Guizhou, China, 2020. [Google Scholar]
- Xu, Y.M. Investigation and Analysis on export cost of Zhejiang green tea. Issue Agric. Econ. 2009, 30, 90–94. [Google Scholar]
- Jin, Z.X. The growth and prosperity of “safe tea” in Guizhou guarded by green prevention and control. Farmers’ Daily, 31 July 2020. Available online: http://www.chinacoop.gov.cn/news.html?aid=1596858 (accessed on 31 July 2020).
- Wilson, N.L.W.; Worosz, M.R. Zero tolerance rules in food safety and quality. Food Policy 2014, 45, 112–115. [Google Scholar] [CrossRef]
- Jiang, Y.W.; Cheng, Q.K. China Tea Yearbook (2013–2016); China Agriculture Press: Beijing, China, 2016. [Google Scholar]
- Fowler, F.J. Improving survey questions: Design and evaluation; Sage: Thousand Oaks, CA, USA, 1995. [Google Scholar]
- Ropkins, K.; Beck, A.J. Evaluation of worldwide approaches to the use of HACCP to control food safety. Trends Food Sci. Technol. 2000, 11, 10–21. [Google Scholar] [CrossRef]
- Handley, S.M. How governance misalignment and outsourcing capability impact performance. Prod. Oper. Manag. 2017, 26, 134–155. [Google Scholar] [CrossRef]
- Kaiser, F.; Obermaier, R. Vertical (dis-)integration and firm performance: A management paradigm revisited. Schmalenbach Bus. Rev. 2020, 72, 1–37. [Google Scholar] [CrossRef]
- Ménard, C.; Valceschini, C. New institutions for governing the agri-food industry. Eur. Rev. Agric. Econ. 2005, 3, 421–440. [Google Scholar] [CrossRef]
- Rouvière, E. Small is beautiful: Firm size, prevention, and food safety. Food Policy 2016, 63, 12–22. [Google Scholar] [CrossRef]
- Fulton, M.E.; Fulton, J.R.; Clark, J.S.; Parliament, C. Cooperative growth: Is it constrained? Agribusiness 1995, 11, 245–261. [Google Scholar] [CrossRef]


Publisher’s Note: MDPI stays neutral with regard to jurisdictional claims in published maps and institutional affiliations. |
© 2022 by the authors. Licensee MDPI, Basel, Switzerland. This article is an open access article distributed under the terms and conditions of the Creative Commons Attribution (CC BY) license (https://creativecommons.org/licenses/by/4.0/).