Article

Archeological Sites and Relict Landscapes as Refuge for Biodiversity: Case Study of Alexandria City, Egypt

1
Department of Botany & Microbiology, Faculty of Science, Alexandria University, Alexandria 21511, Egypt
2
Department of Botany, Faculty of Science, Kafrelsheikh University, Kafr El-Sheikh 33516, Egypt
3
Department of Environmental Sciences, Faculty of Science, Alexandria University, Alexandria 21511, Egypt
4
Biology Department, College of Science, King Khalid University, Abha 61321, Saudi Arabia
5
Biology Department, College of Science, Tabuk University, Tabuk 47512, Saudi Arabia
*
Author to whom correspondence should be addressed.
Sustainability 2022, 14(4), 2416; https://doi.org/10.3390/su14042416
Submission received: 24 December 2021 / Revised: 4 February 2022 / Accepted: 17 February 2022 / Published: 20 February 2022

Abstract

:
The role of heritage sites as a shelter for biodiversity is overlooked. Eight archeological sites representing different landscapes in Alexandria City were surveyed, from which 59 stands were sampled between April 2019 and March 2021. The archeological sites and the relictual landscapes are geographically dispersed and are arranged here from west to east, representing the full range of environmental variation within the study area. The selection of stands in each site was based on the area and the variability within the habitats, the physiography, and the levels of disturbance. A composite soil sample was collected from each site. Two-way indicator species analysis (TWINSPAN) and detrended correspondence analysis (DECORANA) were carried out to identify the plant communities in the study area. The recorded taxa, their national geographical distribution, life forms, habitats, chorological types, and vegetation groups are listed. A total of 221 specific taxa, 172 native and 49 alien non-native species (representing some 10.3% of the whole range of Egyptian flora), belonging to 150 genera and 44 families, are reported in the present study. Only two endemic species were recorded in the studied urban habitats. The phytosociological analysis of the sites showed differences among vegetation types found in the archeological sites as a function of the varying degrees of enthronization. A significant effect of archeological site and relictual landscape on species diversity was observed as indicated using the richness, Shannon’s and Simpson’s indices. Flat plains are substantially more diverse than any of the other habitats in the present study, followed by the habitat of rocky ridge slope. The present study found evidence of an ecological legacy that persists today within the semi-arid climatic ecosystem of Alexandria City. The study highlights the urgent need for measures to maintain cultural landscapes while considering the conservation of biodiversity within the archeological sites. It is hoped that the outcomes of the current study can provide guidance on the potential integration of biodiversity conservation in planning the management of archeological sites.

1. Introduction

Archeological sites can provide refuge and shelter for biodiversity, protecting species from human impact and the associated stresses of urban development [1,2]. The biodiversity management of archeological sites is a persistent problem when considering the conservation of historic structures and biodiversity. There is an urgent need for measures to maintain cultural landscapes while considering the conservation of biodiversity within archeological sites [3]. Human activities, such as pastoralism and agriculture, have strongly modified natural ecosystems within the Mediterranean basin over millennia [4]; these interactions have led to the creation of unique cultural landscapes [5], which provide habitat heterogeneity of great importance for the relationship between natural biodiversity and cultural heritage [6]. Several plant species can inhabit archeological sites, including rocky walls [3,7]. The colonization of historic monuments by plant species is controlled by various factors, including the availability of shelter, the substrate, disturbance, the variability of microclimate, and the availability of water [8].
Protected cultural heritage sites, such as monuments, fortresses, tombs and sacred sites, can play a key role in biodiversity conservation at the global scale [9,10], especially when they are situated in environments that have been significantly altered by humans, such as agricultural landscapes and urban environments [11]. In metropolises, archeological sites are even more crucial, because these sites represent a web of green patches that can provide various ecological services and play a key role in the conservation of urban biodiversity inside cities and road boundaries [12,13,14,15].
The specific ecological conditions of archeological sites permit the establishment of different species, which excludes the majority of species that get to these sites [16]. Understanding the factors that control which plant species inhabit historical monuments and relictual landscapes can guide the proper management of these monuments and help in combining the conservation of biodiversity and the preservation of cultural heritage. In the current study, we investigate how local factors at archeological sites and historical relictual landscapes affect the distribution and diversity of plant species within these sites. We focus on a city that was the capital of Egypt from 322 B.C. to 642 A.D., which is famous for its wealth of significant historic sites and monuments that combine pharaonic heritage with that of Hellenistic and the Greco-Roman era. Archeological sites occupy a significant part of Alexandria City. These sites are characterized by rich flora and vegetation due to both the high habitat heterogeneity (forts, castles, walls, relictual landscapes, amphitheaters, rubble, trampled places, tombs, etc.) and the different management activities, which allow the recruitment of plant species with different ecological tolerances and requirements. One of the main challenges in managing and conserving the heritage of historical and archeological sites is integrating biodiversity conservation measures with the efforts towards the preservation of cultural heritage. The conventional approach to the management of vegetation and plant diversity in archeological sites is overlooked and usually defined by visual considerations [17].
The current study attempts to assess the plant diversity within, and evaluate the botanical value of, the archeological sites in Alexandria City, with the potential for using such information for the integration of biodiversity conservation into planning the management of the investigated sites. Specifically, the study aims to: (1) investigate the species composition (native vs. alien taxa) and the main plant communities prevalent in the archeological sites and detect the major factors shaping their distribution; (2) identify key flora components of these sites that are worthy of conservation actions, and their spatial distribution. The evaluation of natural components for cultural heritage conservation can assist in taking appropriate measures, which could then be used in other similar contexts to sustain the conservation of biodiversity along with the preservation of cultural heritage. One of the pillars of the sustainability of natural resources is the promotion of conservation of biodiversity through adoption of mechanisms that integrate biodiversity conservation and cultural diversity preservation.

2. Materials and Methods
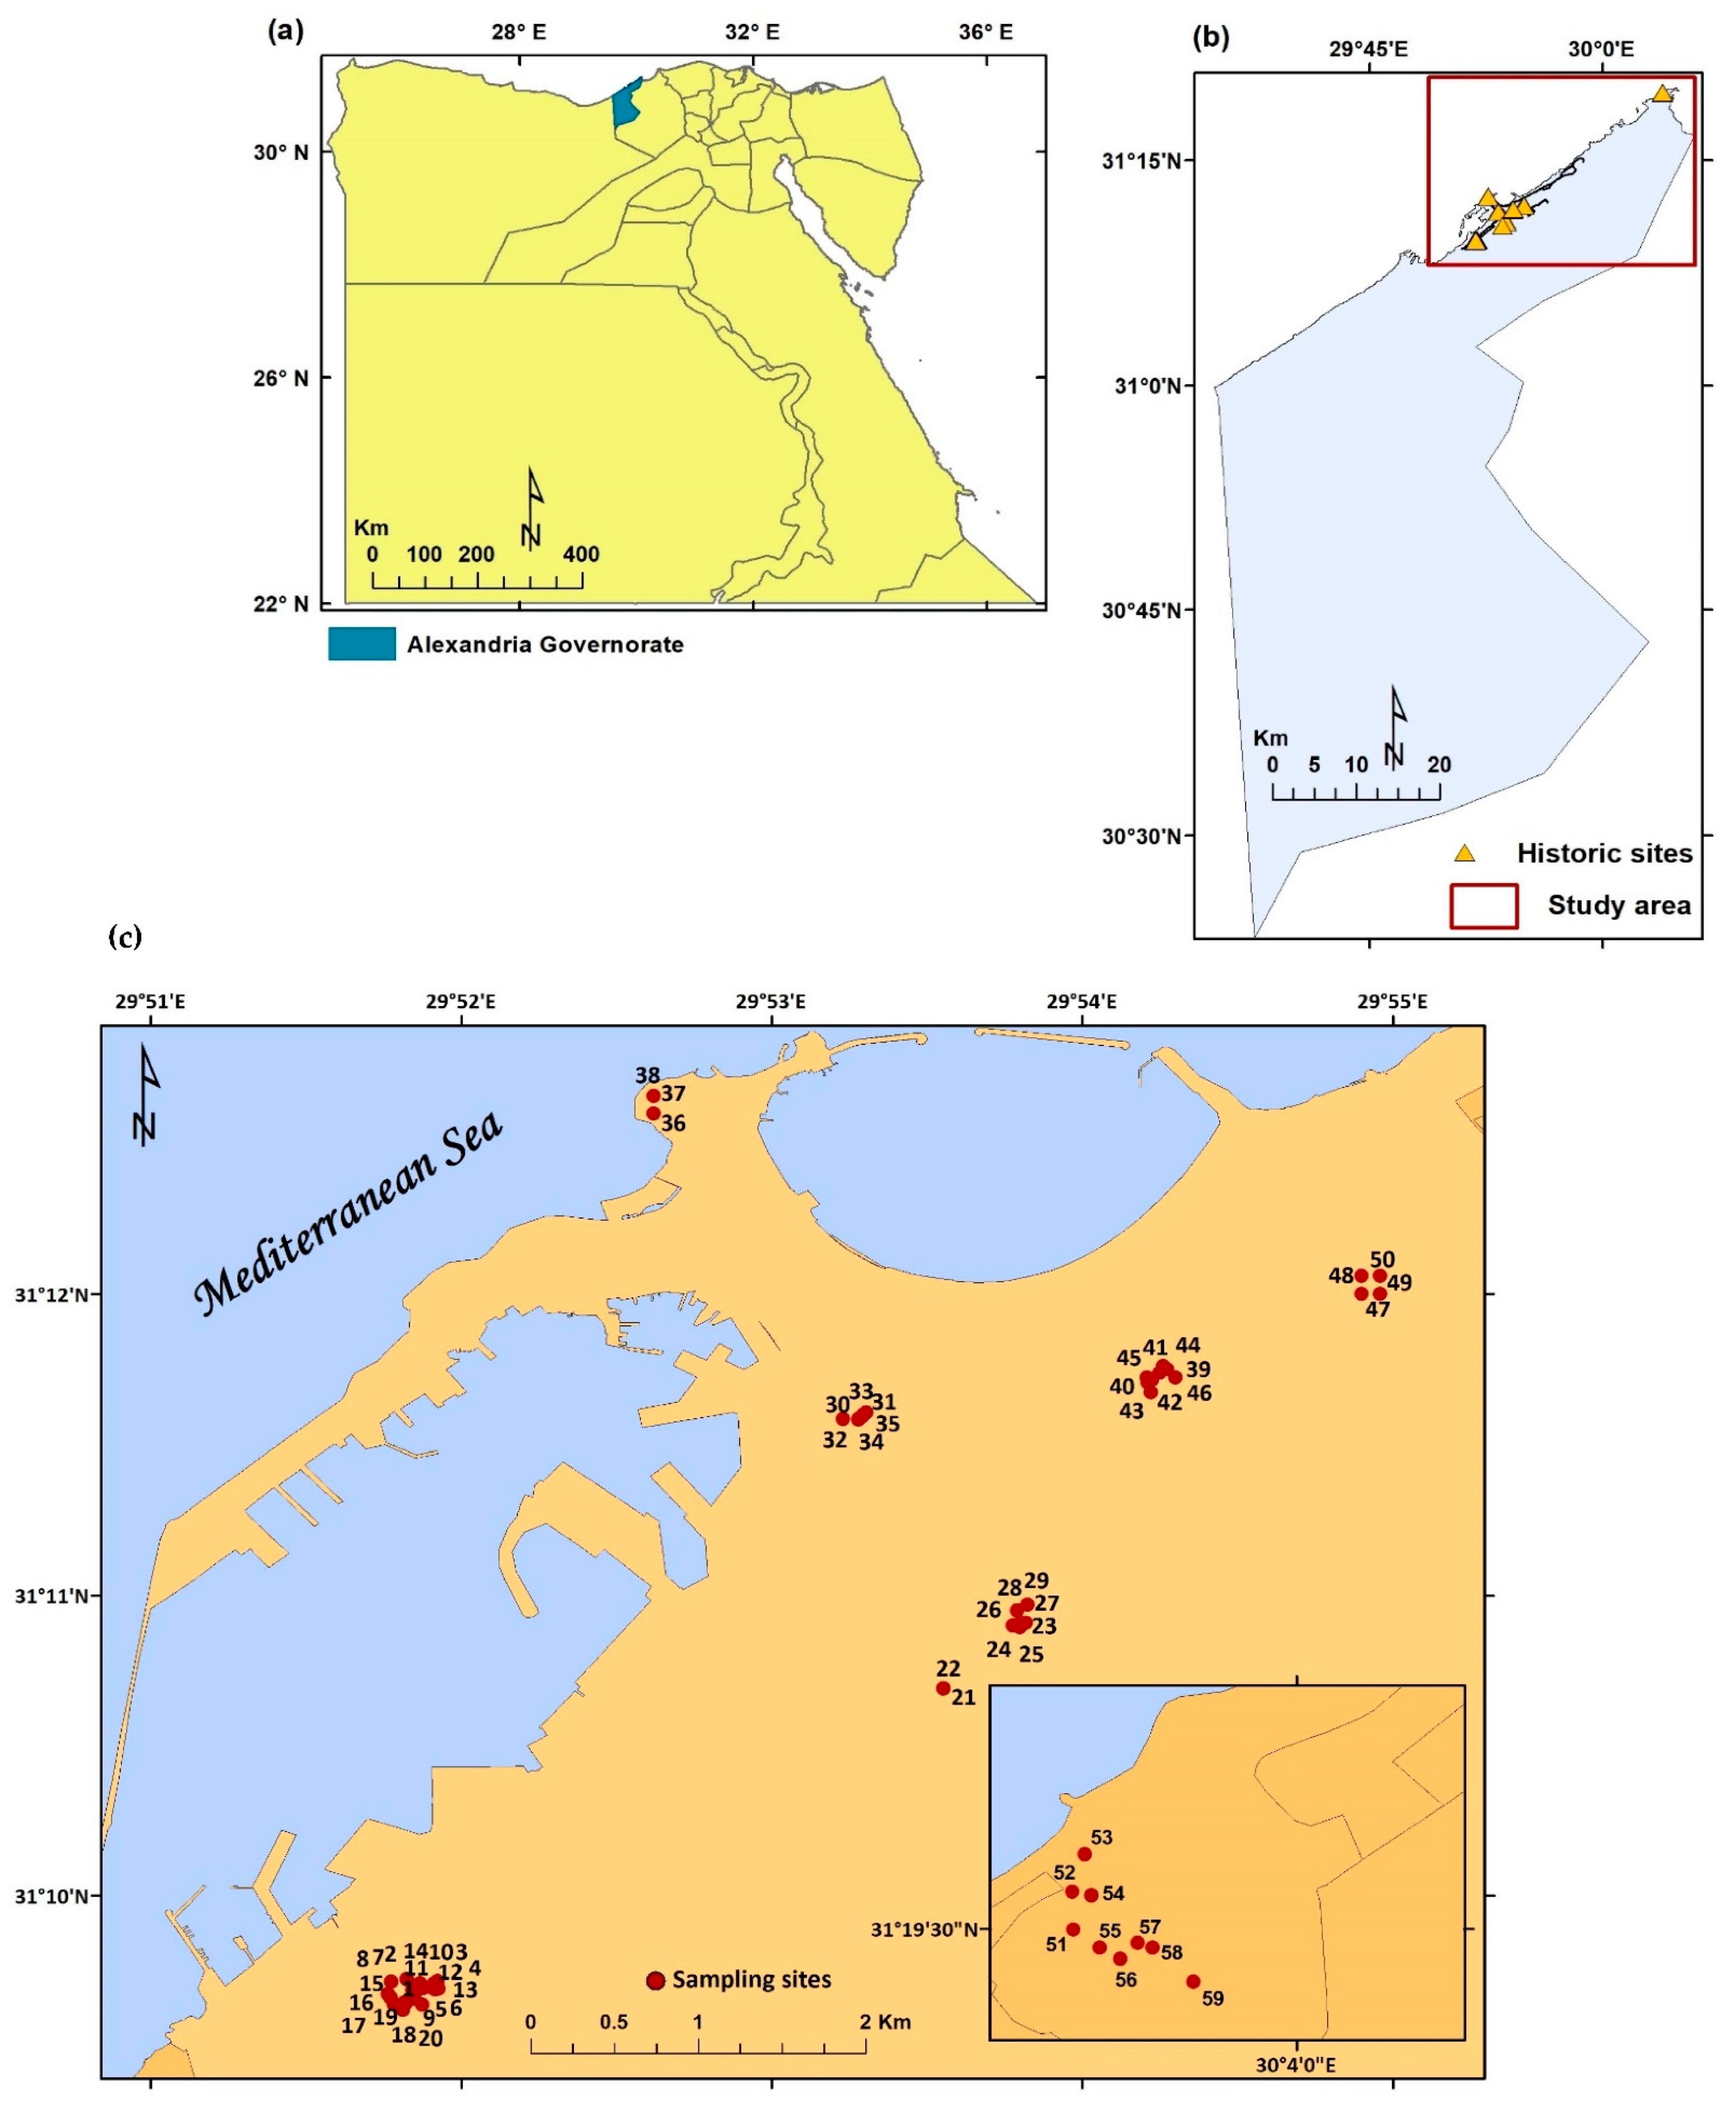
2.1. Study Area

The city of Alexandria is located to the west of the Rosetta branch of the Nile River. It is the largest city on the Mediterranean Sea, also known as the “Bride of the Mediterranean”, and the second largest city in Egypt (Figure 1). Historic records reveal that the Rhakotis settlement, which was a relatively large city comprising twelve villages, predates (>2300 years B.P.) the establishment of the famous Mediterranean port city of Alexandria in B.C. 332 by Alexander the Great [18]. Alexandria City has rich historic and cultural layers that extend below sea level. Alexandria was referred to by the Greeks as the Fort of Alexander on the Ionian Sea. Throughout Alexandria, there is art that resembles some of the oldest architectural styles of the Hellenic city, and its ancient architects [19]. However, Alexandria City is also characterized by the presence of many historic buildings and monuments that can be dated back to 331 B.C.—the time of the establishment of the city [20]. Out of the numerous archeological sites and monuments existing in Alexandria City, eight sites representing different landscapes (Figure 1, Table 1 and Table S1) were investigated in this study.

2.2. Field Survey and Data Collection

Eight archeological sites representing different landscapes in Alexandria City (Table 1) were surveyed, from which 59 stands were sampled to represent the main habitats in the study sites between April 2019 and March 2021. The archeological sites and relictual landscape are geographically dispersed and are arranged from west to east, representing the full range of environmental variation within the study area (Figure 1). The selection of the stands in each site was based on random stratification that considered the area, the variability in habitats, the physiographic variations, and the levels of disturbance. The size of the stands varied depending on the habitat type and extension of plant cover. For each stand, the following data were collected: (a) location in latitude/longitude coordinates using handheld Garmin GPSMAP® 64s, (b) list of natural and cultivated trees and weed species, (c) the most dominant species, (d) a visual estimate of the total cover (%) and the cover of each species according to the Braun–Blanquet scale, and (e) the type of disturbance. Specimens of the recorded vascular plants were collected for the preparation of herbarium specimens, which were deposited in the Herbarium of The Botanic Garden of Alexandria University (Heneidy et al. Collection). The identification and nomenclature have been derived from Boulos [21,22,23,24].

2.3. Vegetation Measurements

The life forms of the species were identified following the Raunkiaer scheme [25]. The global geographical distribution of the recorded taxa was recorded by Zohary [26,27] and Feinbrun-Dothan [28,29], and the national geographical distribution by Täckholm [30] and Boulos [21,22,23,24,31].

2.4. Soil Analysis

A three composite soil sample (about 2 kg each) was collected from each stand by excavating representative 0–20 cm profiles. Samples were placed in plastic bags, transferred to the laboratory within 24 h, spread over paper sheets, and regularly flipped until completely air-dried. Air-dried samples were ground with a wooden grinder to disseminate soil aggregates, then sieved through a 2 mm mesh and stored for analyses. Soil samples from each stand were analyzed for soil texture and particle size distribution using the Bouyoucos hydrometer method [32]. Saturation percentage (SP) was determined for soil samples [32]. Organic matter (OM) was determined by the Walkly–Black method [32].
The concentration of soil soluble cations (Ca2+, Mg2+, K+, Na+) and anions (SO42−, HCO3, Cl) in meq/l and available micro and macronutrients (Fe, Cu, Mn, Zn, N, and P) in ppm were measured in the composite soil samples collected from each sampling site in the present study. Sodium adsorption ratio (SAR) was calculated as SAR = Na 1 / 2 ( Ca + Mg ) . Soluble ions, pH, total dissolved solids (TDS) and electrical conductivity (EC) were determined in soil extract according to the method of Allen et al. [32]. Soil salinity (EC) (dS/m) and TDS (ppm) were assessed using a conductivity meter, and soil reaction (pH) using a pH meter (Jenway 3020, Cole-Parmer, Staffordshire, UK), while Ca2+, Mg2+, HCO3, and Cl were determined by titration. Na+ and K+ were measured using a flame photometer (Corning 410 BWB, Sherwood Scientific Ltd., Cambridge, UK). SO42− was measured using a spectrophotometer (UNICO 2000, UNICO, Fairfield, NJ, USA). Fe, Zn, Mn, and Cu concentrations were determined using atomic absorption (GBC 932 AA, GBC Scientific Equipment Ltd., Dandenong, Australia). Available P concentration was measured using a flame photometer (Corning 410 BWB, Sherwood Scientific Ltd., Cambridge, UK). The determination of CaCO3 was carried out using Bernard’s calcimeter [32]. Nitrogen concentration was determined using the Kjeldahl method (VELP UDK 130, VELP Scientifica Srl, Usmate Velate, Italy), according to Allen et al. [32].

2.5. Diversity Indices

Alpha diversity is a function of species richness and the evenness of individual distribution amongst the species [33]. Seven of the more popular indices of alpha diversity were applied according to the method of Magurran [34], as follows: (1) richness = number of species recorded in each site; (2) Shannon’s diversity index (H′) =−∑ pi ln pi, where pi is the proportional abundance of the ith species; (3) Simpson’s index of dominance (D) = ∑ pi2; (4) Hill’s number 1(N1) = exponential Shannon’s index = eH′; (5) Hill’s number 2 (N2) = reciprocal of Simpson’s index = 1/D; (6) Shannon’s evenness index (E1) = H′/Hmax = H′/ln S, where S is the number of species; (7) Modified Hill’s ratio (E5) = [(1/D) − 1]/[eH′ − 1] = [N2 − 1]/[N1 − 1].

2.6. Data Analysis

Both two-way indicator species analysis (TWINSPAN) and detrended correspondence analysis (DECORANA) were carried out for estimations of the 222 species recorded in the sampled 59 stands, in order to identify the plant communities in the study area [35,36,37,38]. Significant differences in the soil characteristics and community (diversity indices) among the locations and identified vegetation groups were evaluated using a one-way analysis of variance (ANOVA) [39]. To analyze the relation between environmental variables and ecological groups from direct gradient changes, canonical correspondence analysis or CCA ordination was applied [40]. The CCA ordination approach examines the relation between species and environmental factors as a linear compound [35].

3. Results

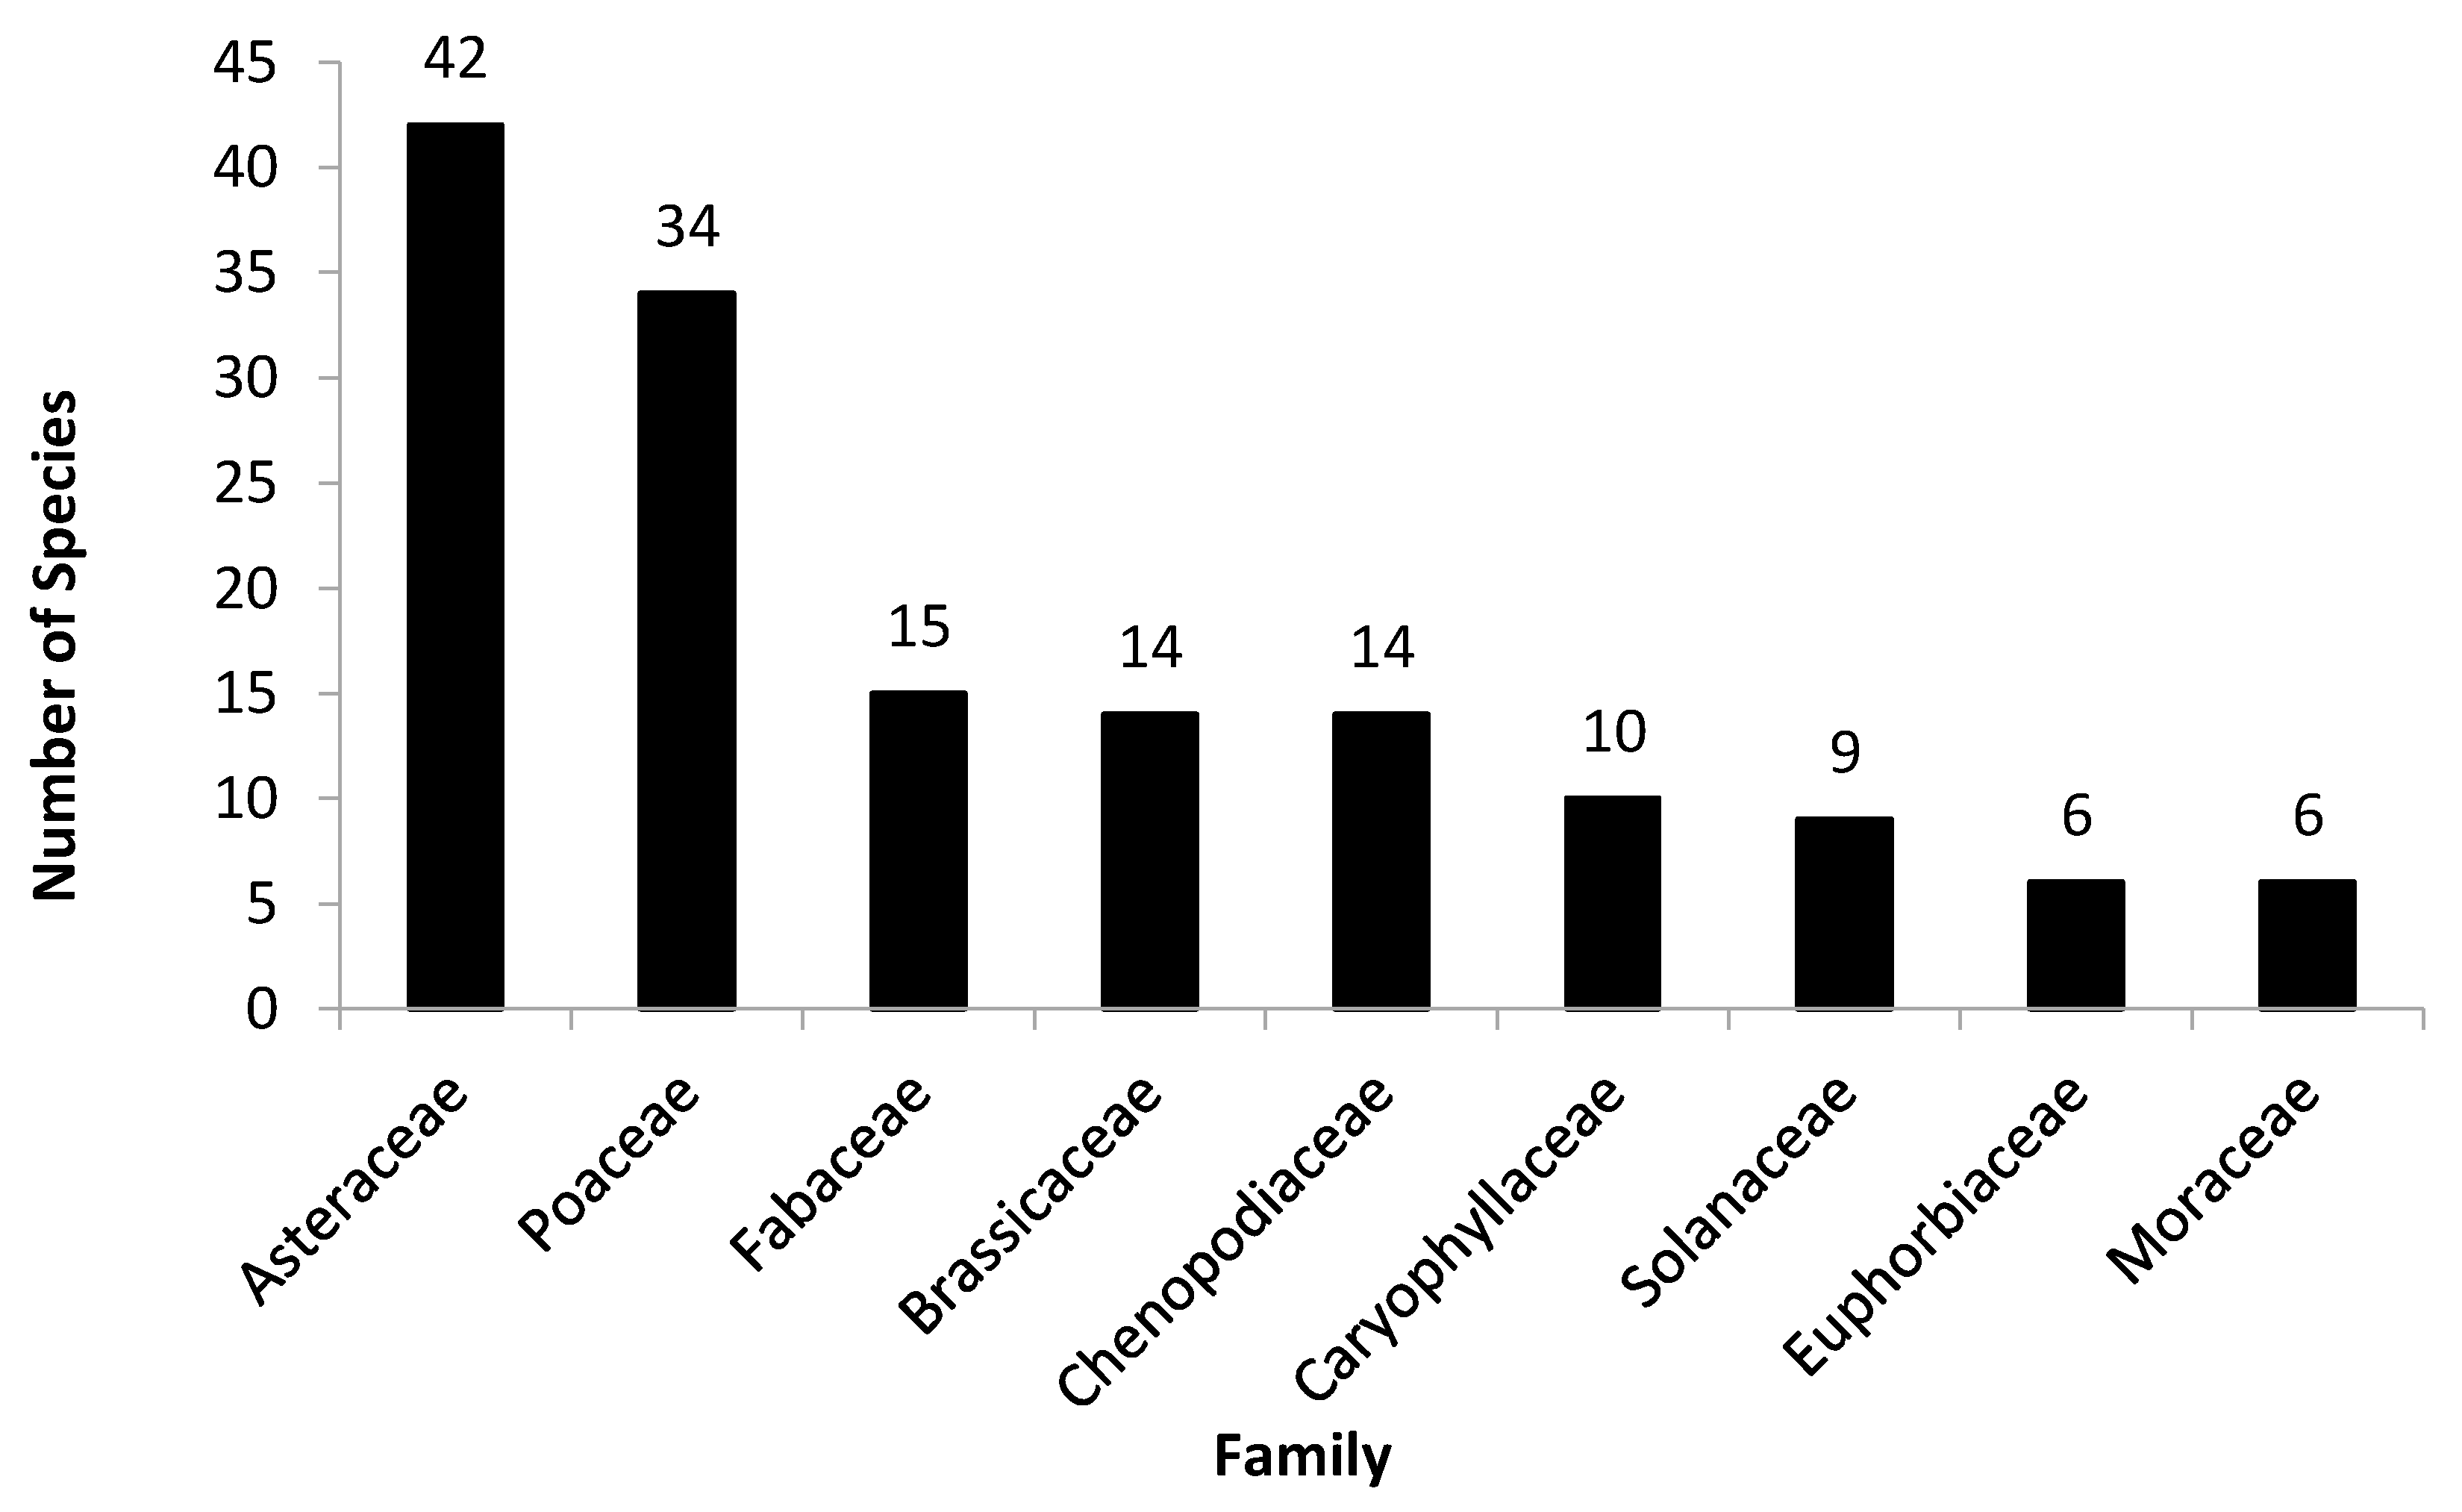
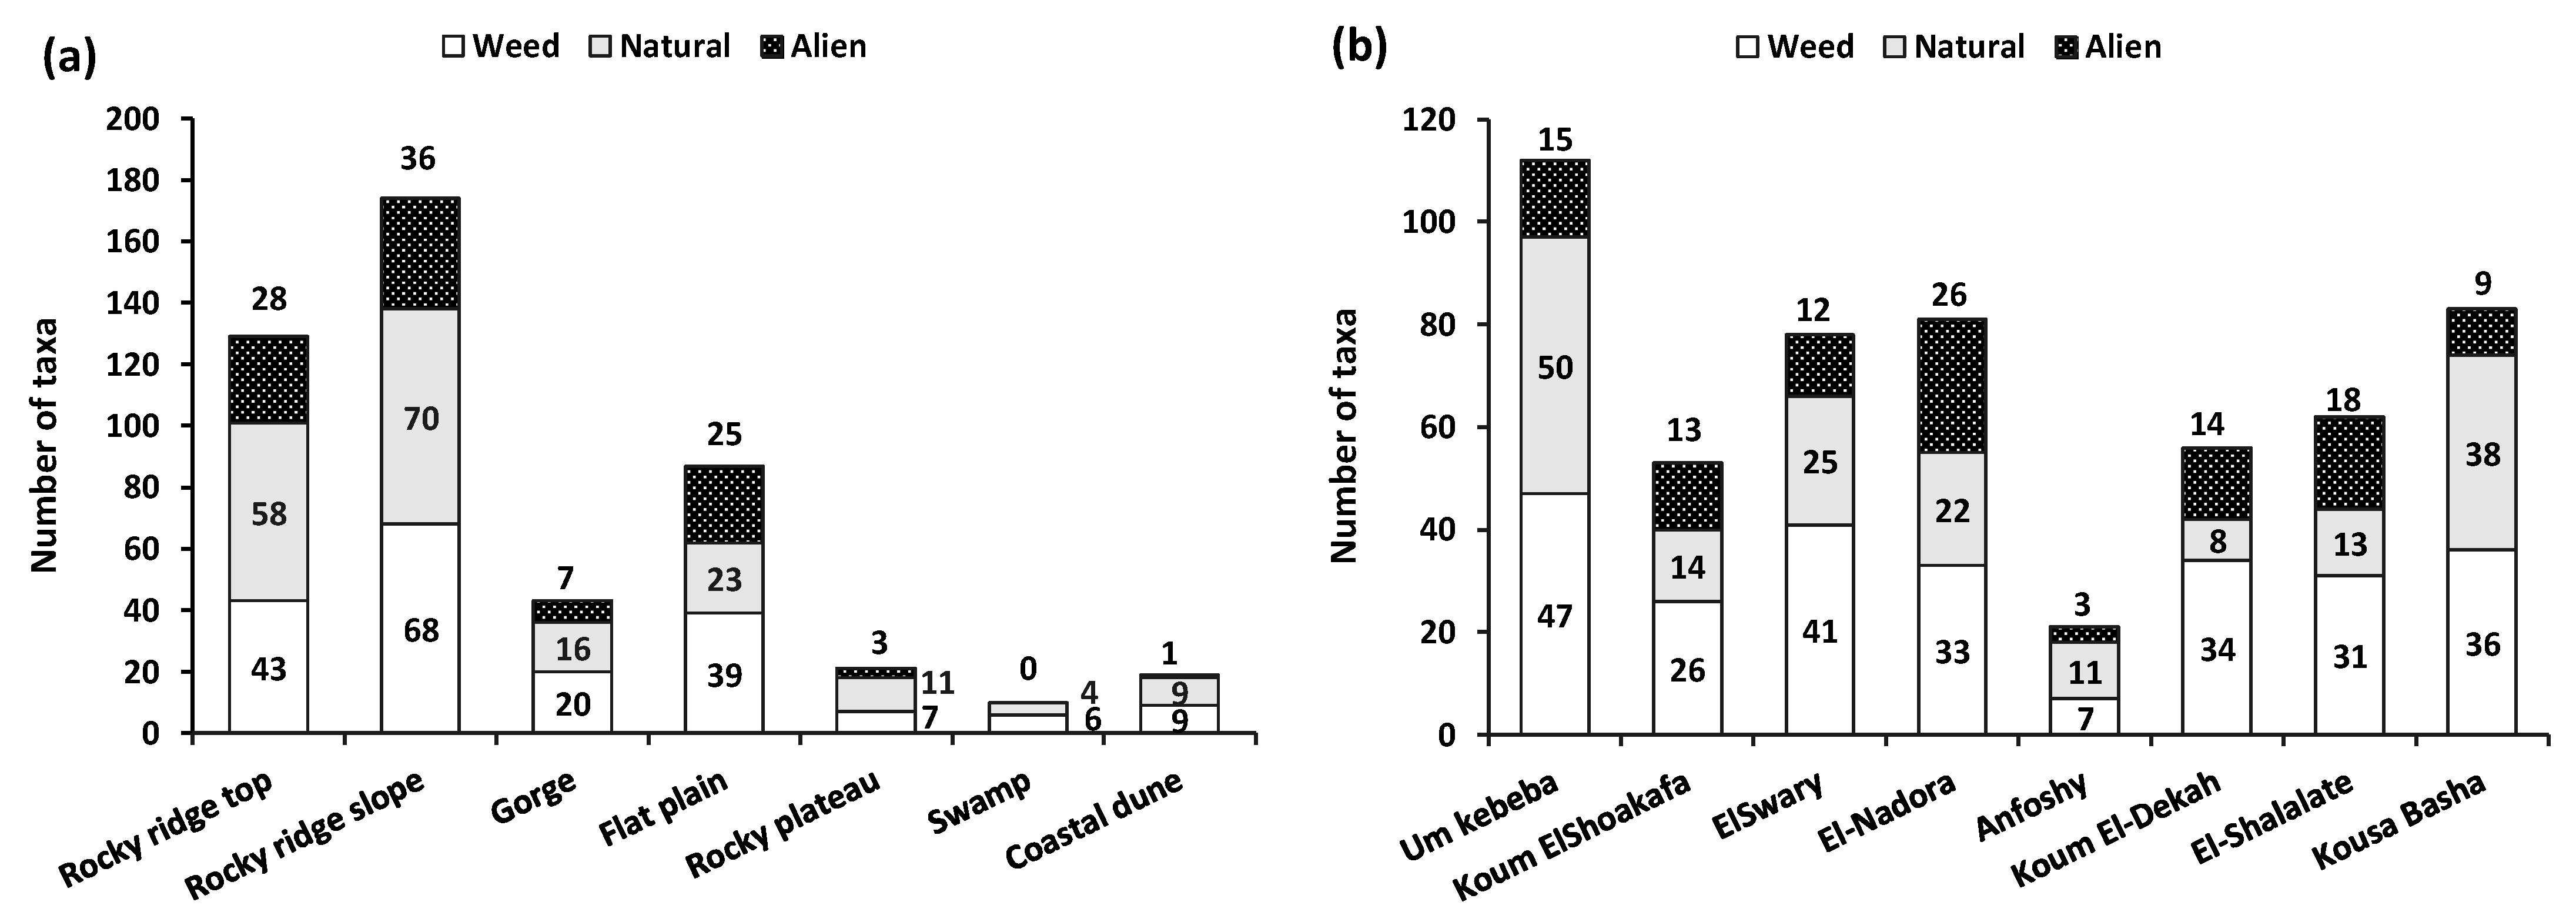
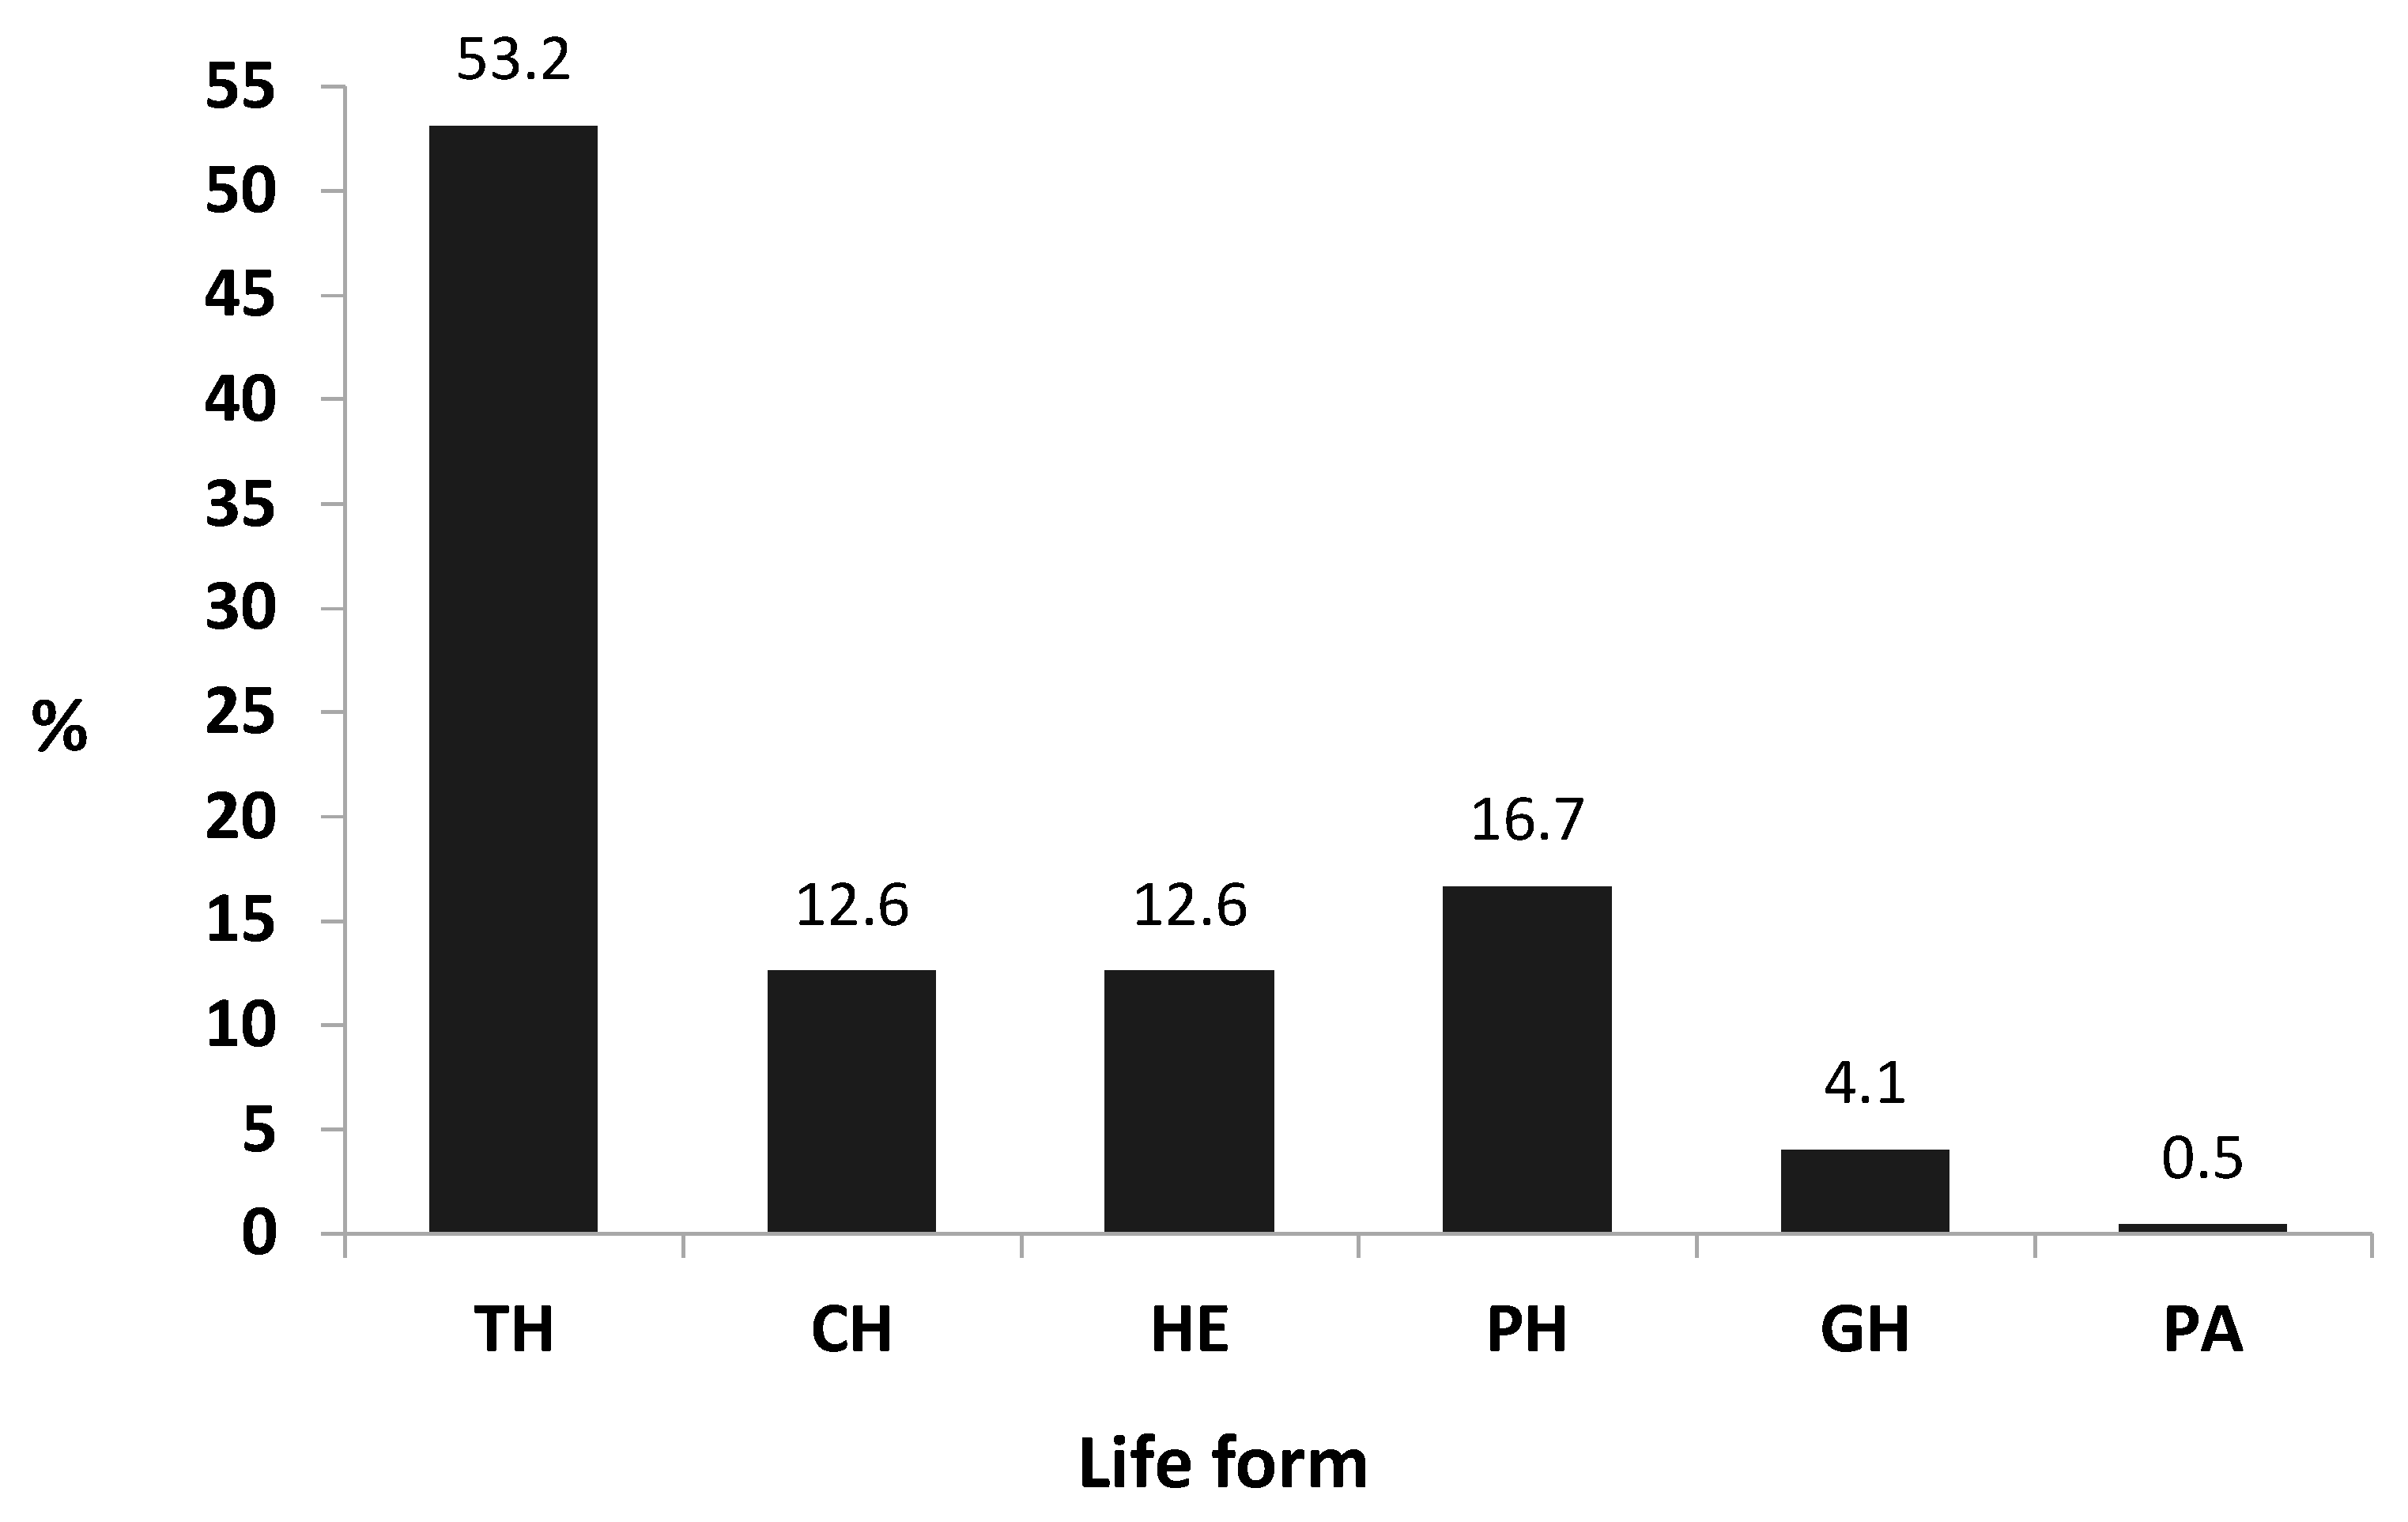
3.1. Floristic Analyses

The recorded taxa in the study area, as well as their national geographical distribution, life forms, habitats, chorological types, and vegetation groups are listed in Table S1 (see in Supplementary Materials). The total number of recorded taxa was 221, belonging to 150 genera and 44 families. About 46.6% of the recorded taxa (104 species) were perennials, while 53.4% (118 species) were annual plants. In total, 173 species (71 perennials and 102 therophytes) were native flora, of which 82 species were recorded as weeds (22 perennials and 60 therophytes), and 49 species (22.1%) were assessed as alien (29 casual, 18 naturalized and 2 invasive alien species: Bassia indica and Prosopis juliflora). The five most species rich families contributed 53.6% (119 species) of the total number of species (Figure 2).
In particular, 10 species were common, and recorded in ≥ 50% of the sampled stands: Reichardia tingitana (79.7%), Emex spinosa (76.3%), Malva parviflora (74.6%), Glebionis coronaria (71.2%), Chenopodium murale (66.1%), Hordeum leporinum (62.7%), Urospermum picroides (57.6%), Senecio desfontainei (55.9%), Cynodon dactylon (52.2%) and Mesembryanthemum nodiflorum (50.8%). The rocky ridge slope habitat contained the highest number of species (174 species = 78.4% of the total recorded taxa, 40.2% natural species), followed by the rocky ridge top habitat (129 species = 58.1%, 45.0% native species) and flat plains (87 species = 39.2%, 26.4% native species), while swamps contained the lowest number of species (10 species = 4.5%, 40% native species) (Figure 3a). Regarding locations, Tabieh Um Kebeba had the highest number of species (112 species = 50.5% of the total recorded taxa, 44.6% native species), followed by Tabieh Kousa Basha (83 species = 37.4%, 45.8% native species) and El-Nadora (81 species = 36.5%, 27.2% native species), while Anfoshy (Atta Fortress) had the lowest number of species (21 species = 9.5%, 52.4% native species) (Figure 3b).
Regarding the life form spectra of the recorded flora, therophytes made the highest contribution (53.4% of the total species), followed by phanerophytes (16.7%), hemicryptophytes and chamaephytes (12.6% each), and geophytes (4.1%) (Figure 4). In the local geographical distribution, 65.8% of the recorded taxa were on the Mediterranean coast, followed by the Nile region (55.0%), Egyptian deserts (52.3%), Sinai (46.8%), and Oasis (36.5%) (Table S2).
Regarding the global phytogeographical distribution, the mono-regional elements were the most prevalent, at 95 species (42.8%), followed by bi-regionals, 71 species (32.0%), pluri-regionals, 39 species (17.6%), and cosmopolitan, 15 species (6.7%), (Figure 5a). Only two endemic species were recorded in the studied urban habitat, namely, Anthemis microsperma and Sonchus macrocarpus. On the other hand, 124 species belonged to Mediterranean areas, and of these 39 species were mono-regionals: 78 species were Irano-Turanian, of which only one was mono-regional; 60 species were Saharo-Arabian, of which 14 were mono-regionals, and 33 species were of European origin (Figure 5b).

3.2. Plant Communities and Diversity Indices

The application of TWINSPAN to the cover estimates of 222 species recorded in 56 stands led to the recognition of 20 groups at the sixth level of classification, and 4 vegetation groups (communities) at the third level (Figure 6a). The application of DECORANA on the same set of data indicates reasonable segregation among these groups along the ordination axes 1 and 2 (Figure 6b). The vegetation groups are named after the species with the highest presence percentage (first dominant species), as follows (Table 2): I—Chenopodium murale community from the flat plain habitat in El-Nadora with 83 species. The most dominant species are Chenopodium murale, Cynodon dactylon, Emex spinosa, Glebionis coronaria, Hordeum leporinum, Malva parviflora and Melilotus indicus; II—Glebionis coronaria community from the rocky ridge slopes in different locations with 79 species. The most dominant species are Glebionis coronaria, Chenopodium murale, Hordeum leporinum, Malva parviflora, Emex spinosa, Reichardia tingitana, Senecio desfontainei and Urtica urens; III—Reichardia tingitana community from different habitats in Tabieh Kousa Basha with 88 species. The most dominant species are Reichardia tingitana, Mesembryanthemum crystallinum, Senecio desfontainei, Malva parviflora, Emex spinosa, Mesembryanthemum nodiflorum and Centaurea glomerata; IV—Emex spinosa community from different habitats of Tabieh Um Kebeba with 92 species. The most dominant species are Emex spinosa, Glebionis coronaria, Reichardia tingitana, Malva parviflora, Urospermum picroides, Hordeum leporinum, Centaurea glomerata and Schismus barbatus (Table S1).
Seven of the more popular indices of alpha diversity were applied to the studied sites. The effect of habitat type and archeological site on species diversity (richness, dominance, diversity and evenness) was considered and evaluated. The species diversity of different classified vegetation groups was also estimated (Table 3). Variations in the results of species diversity presented in Table 3 indicate the highly significant effects of habitat type on species diversity. This observation is borne out by indices that incorporate information on the proportional abundances of species, such as Shannon’s and Simpson’s (F = 4.89 and 6.04, respectively, p ≤ 0.001). Richness (mean number of species per stand), equally common species (N1) and most frequent species (N2) are also significantly affected by habitat types (F = 3.59, 3.37 and 3.22, respectively, p ≤ 0.01). A significant effect of archeological sites and relictual landscapes on species diversity was also noticed. This is reflected by the richness, Shannon’s and Simpson’s indices (F = 2.23, 2.60 and 2.58, respectively, p ≤ 0.05). The results also reveal slight, insignificant differences between different vegetation groups in the study area. The applied indices indicate that the flat plain habitat is substantially more diverse than any of the other habitats in the present study, followed by the habitat of rocky ridge slope (H′ = 3.14 ± 0.29 and 3.05 ± 0.28, respectively), with the highest mean of species richness per stand (28 ± 7 and 26 ± 7, respectively), where the dominance is consequently lower (D = 0.05 ± 0.02 and 0.06 ± 0.02, respectively). It is also notable that the numbers of most frequent species (N2 = 20.66 ± 5.76 and 19.42 ± 5.45, respectively) and of equally common species (N1 = 24.00 ± 6.54 and 21.99 ± 6.25, respectively) are larger in both habitats (Table 3).
Inspection of the data also shows considerably high species diversity at two sites: ElSwary (Pompey’s Pillar) and El-Nadora (H′ = 3.16 ± 0.34 and 3.17 ± 0.16, respectively). The richness is also greater at both these sites than at the other sites, with 29 ± 11 species at the Pompey’s Pillar site and 28 ± 4 species at El-Nadora. The lower dominance of the two sites is reflected by a Simpson index of D = 0.05 ± 0.02 for the Pompey’s Pillar site and 0.05 ± 0.01 for El-Nadora. The Atta Fortress (Anfoshy) is the least diverse, as confirmed by the applied diversity indices (Shannon’s index 2.31 ± 0.47 and richness 12 ± 7), which coincides with the highest dominance, as estimated by Simpson’s index (0.12 ± 0.04). Despite the insignificant differences between vegetation groups in the study area, the highest number of species (28 ± 7) was recorded in vegetation group I, dominated by Chenopodium murale, while the lowest number of species (21 ± 7) was recorded in vegetation group III, dominated by Reichardia tingitana. This coincides with the highest species diversity (H′ = 3.13 ± 0.28) in the Chenopodium murale group, and the lowest species diversity (H′ = 2.84 ± 0.38) in the Reichardia tingitana group.
The correlation between different soil factors and the most important diversity indices was estimated using the simple linear correlation coefficient (Table 4). Significant correlations were recorded between diversity (expressed by Shannon’s and richness indices) and Mn and P. The correlation is positive with P (r = 0.281 and 0.290, p ≤ 0.05, for Shannon’s index and richness, respectively), and negative with Mn (r = −0.360, p ≤ 0.01 and r = −0.327, p ≤ 0.05 for Shannon’s index and richness, respectively). That is, as the P content in soil increases, species diversity increases. In contrast, greater levels of Mn in soil negatively affect species diversity. The results also reveal that there is a significant negative correlation of Mn with equally common species r = −0.319, p ≤ 0.05 and most frequent species r = −0.308, p ≤ 0.05. Consequently, dominance is positively correlated with Mn (r = 0.345, p ≤ 0.01) and negatively correlated with P (r = −0.263, p ≤ 0.05). It is also notable that dominance decreases with increasing altitude (r = −0.291, p ≤ 0.05). In general, the results of soils analysis in the studied sites cannot adequately explain the diversity of plant species.

3.3. Edaphic Factors and Vegetation Communities

The soil–sites relationship, derived from the application of canonical correspondence analysis (CCA) (Figure 7), reveals that the gravel and clay percentages, and the K+, Mn, N, Fe, and Zn concentrations, were the most influential variables. Most of the soil characteristics are significantly different between the studied locations (Table 5). Gravel, sand, silt, clay percentage, saturation percentage, and OM, N, P, Fe, Mn and Cu concentrations showed high significance at p ≤ 0.001. pH, K+, HCO3, and Zn concentration showed significant correlations at p ≤ 0.05 and p ≤ 0.01. On the other hand, EC, SAR, TDS, CaCO3, Ca2+, Mg2+, Na+, Cl, and SO42− concentrations indicated no significance.
Moreover, the correlation between the identified vegetation groups and the environmental factors (soil characteristics) is illustrated by the ordination diagram produced by canonical correspondence analysis (CCA) (Figure 7). It is clear that the Reichardia tingitana group (III) represents different habitats in Tabieh Kousa Basha with high contents of Mn, while the Emex spinosa group (VI) represents Tabieh Um Kebeba with high contents of Fe, Zn, K+ and N. The Chenopodium murale group (I) represents the flat plain habitat in El-Nadora with medium to high concentration of cations, anions, and loam soil texture.
The soil analysis indicates that the sand, clay, OM, N, P, and Fe showed highly significance variations in relation to sites and vegetation groups (p < 0.001), while gravel, SP, K+, Zn, Mn, and Cu showed highly significant variations in relation to sites only (p < 0.001) (Table 5). Only Mn had high significance in relation to habitats (p < 0.001). This reveals that gravel, sand and clay percentage, and K+, Mn, N, Fe, and Zn concentrations were the most influential variables. pH, HCO3, and Zn concentrations showed a significant correlation at p ≤ 0.05 and p ≤ 0.01. On the other hand, EC, SAR, TDS, CaCO3, Ca2+, Mg2+, Na+, Cl, and SO42− concentrations indicated no significance.

4. Discussion

4.1. Floristic Composition

Many cities across the world contain cultural heritage sites, which have been mostly preserved from urban development for their historic, artistic or religious value, and have thus become valuable elements of the urban green space [41]. As the expansion and spread of urban areas and cities continues, these sites are becoming more valuable for their rich biodiversity and ecological significance. Of particular importance are bigger cultural sites, which, due to their size, heterogeneity and endurance of human-induced disturbance, can provide important habitats for a wide variety of species, and often support a high species diversity that in some cases surpasses that of natural habitats [42]. The inaccessibility of portions of these sites (e.g., the tops and walls of high monuments) offers refuge for relict populations of rare species with high conservation importance, which have disappeared in the wild and in adjoining rural habitats [43,44]. Thus, these sites can play an important role in nature conservation, particularly in human-modified urban environments [2]. Smaller archeological sites can similarly be considered an important element in urban green spaces, and boost biodiversity through forming a network of green within the urban space, which can also improve habitat continuity and connectivity [45]. The use of native vegetation can also be effective in protecting and maintaining archeological and historical sites. Despite their significance, archeological sites are often susceptible to many human-induced and natural disturbances and stresses, including soil erosion, which acts on both the above-ground features and below-ground structures [14]. Sometimes, these environmental features can have negative consequences for the monuments; certain species can cause direct and indirect damage to materials and elements of construction. Managing such growth requires consideration of various factors and an assessment of risk that balances actual and potential damage against ecological and aesthetic benefits [1,2,7]. The effects of climate change need also to be considered in the longer term, particularly in relation to environmental conditions (such as increased relative humidity), plant growth patterns, soil moisture content, and the performance of existing rainwater disposal systems [46].
The significance of the roles these sites can play in urban habitats has inspired the current study, carried out to assess the role archeological sites in metropolitan Alexandria City might be playing as refuge areas for wild species, offering protection from the pressures of urbanization. The flora recorded in the present study (221 species) represent some 10.3% of the whole range of Egyptian flora, with 19.8% of the genera and 34.1% of the families represented in Egypt [31]. Despite the small area of the studied sites collectively (0.27% of Egypt), the study revealed the high species richness harbored by the sites relative to other areas considered of significance for conservation of plant diversity. However, this area is in the northwestern coastal region of Egypt, which belongs to the Mediterranean phytogeographic region, considered the richest area in the nation for its floristic composition, a result of its relatively high precipitation. This region harbors ca. 45% of the total flora, 57% of the genera, and 75.2% of the total families in Egypt [21,22,23,24]. Several factors influence plant diversity in the Mediterranean region, including topographic variability, seed banks, secondary succession, and temporal variations in climate. In total, 140 species (63.1% of the total recorded species) were present in the urban habitats (train railways and tram tracks) in the same area [47].
The order of contribution of the five main families in the study area (Asteraceae, Poaceae, Fabaceae, Brassicaceae, Chenopodiaceae) is different from that recorded for the entire range of Egyptian flora (Poaceae, Fabaceae, Asteraceae, Brassicaceae, Caryophyllaceae), according to Boulos [31], and from that reported in the same urban habitats (train and tram railways) (Poaceae, Asteraceae, Brassicaceae, Chenopodiaceae, Fabaceae) by Heneidy et al. [47]. Regarding the life form spectra of the recorded flora, therophytes made the highest contribution, followed by phanerophytes, hemicryptophytes, chamaephytes, and geophytes. This trend is the same in all urban habitats in the area [47]. The dominance of annuals can be attributed to factors such as the warm and dry climate, the topographic variability, and biotic interactions [48]. The short life cycles of annual weeds, in addition to the harsh climate and insufficient moisture, favor the presence of annuals during favorable seasons. On the other hand, the presence of the rarest species had previously been reported by Täckholm [30]. The investigated archeological sites have rich and diverse vascular wild flora overall, despite their relatively small area, compared to other natural habitats and areas used as parks and gardens in urban habitats.
The occurrence of phanerophytes may be due to the cultivation of ornamental species in the gardens and hedges within archeological sites. Phanerophtyes play an essential role in the balance of the aridity and semi-aridity of a region. This role becomes more important as the dry season increases [49,50]. The present study has revealed that the study’s regions were rich in vegetation; the woody species were the most abundant life form, and they are considered the backbone of the arid ecosystem [51]. Heneidy and Bidak [52] reported that refuge can help plants avoid harsh conditions, particularly for weaker species (herbaceous species), enabling them to live longer and prolong their sexual productivity. Phanerophytes may provide good protection and suitable habitats for herbaceous species. At the same time, the abundance of phanerophytes may explain the high diversity in some locations.
Human beings have deliberately and accidentally impacted their surroundings; however, recognizing the lasting ecological impacts of previous communities is challenging [3,53]. The present study found evidence of an ecological legacy that persists today within the semi-arid climate ecosystem of Alexandria City. The high richness in plant species is strongly associated with archeological complexity and ecological diversity at historical sites in a region in western Alexandria. As regards the local geographical distribution, at least 65.8% of the recorded taxa were present on the Mediterranean coast, followed by the Nile region (55.0%), Egyptian deserts (52.3%), Sinai (46.8%), and Oasis (36.5%). Our results reveal the vibrant ecological legacy of historical human conduct; it seems that propagules of 49 alien species were transported and cultivated, intentionally or not, thus establishing populations that persist today. Our approach has important implications for resource management planning, especially in areas that will experience greater visitation and its associated impacts.
The investigated archeological sites provide suitable habitats for 221 plant species, 91 of which are native plant species, and 82 are weeds. There is no doubt that some weed species are native to Egypt and arise as elements of natural vegetation. In contrary, only two invasive species (Bassia indica and Prosopis juliflora) were recorded at the study sites. The continuous modification of the study areas has been manifested in the rapid establishment of residential buildings and green spaces in their surroundings. This, in turn, have led to the replacement of the specialist native species by the weed (generalist) species. Anthropogenic environments have different thermal ranges and moisture regimes from the surrounding natural regions; therefore, the selection of specific species with particular dispersal, physiological and morphological characteristics intends to fill in the existing niches [54]. Archeological sites are often characterized by modified landscaping, constructed terraces and heterogeneous topographies, which would provide good refuge for species. This coheres with our result, where the highest number of species was found on rocky ridge slopes and sites with heterogeneous topography. Local resource abundance is important for determining where in a given landscape humans decide to live. The availability of water, soil, and plants offers the conditions and resources for both grazing and farming [55,56]. In addition, human beings alter their environment to boost the abundance and enhance the diversity of local varieties [57,58]. Therefore, the current diversity in ecological settings might indicate previous land use changes, which can be uncovered by combined ecological and archeological research. The phytosociological analysis of the sites has shown differences among the vegetation types found on the archeological sites as a function of the varying degrees of enthronization (ElSwary, 28.5% and El-Nadora, 28.3% of the recorded taxa). Less plant colonization was detected in Atta Fortress (Anfoshy), an open-landscape site the structures of which may be damaged by plants. Swamp habitats also revealed lower biodiversity richness; this may be attributed to the wet land and hydrophytic vegetation. The most common situation would be a mixture of species and communities with relatively minor differences within a microsite [59].

4.2. Plant Communities and Diversity Indices

Although the major causal factors of plant biodiversity are mostly related to climate and topography, it is important to consider what is going on at the microhabitat level [60]. The present study has shown the highly significant (p ≤ 0.001) effects of habitat type on species diversity. This observation is borne out by indices that incorporate information on the proportional abundances of species, such as Shannon’s and Simpson’s indices. The mean number of species per stand is also significantly (p ≤ 0.01) correlated with habitat type. A significant (p ≤ 0.05) effect of archeological sites and relictual landscapes on species diversity is also noticed, which is reflected in the richness, Shannon’s and Simpson’s indices. The slight differences between different vegetation groups classified in the study area were insignificant.
In the analysis of species diversity and diversity patterns, one cannot look for a single explanation with only one causal factor [61]. There are a multitude of ways in which the mechanisms can interact, and have interacted throughout evolution, to give the assemblages we are seeing today. In the present study, soil factors were considered. The relationships between species richness and nutrient availability have been revealed in many studies (e.g., Martin and Thomas [60] and Huston [62]). The present study shows the significant positive correlation (p ≤ 0.05) between P and both the richness and Shannon’s indices. Consequently, a significant negative correlation between Simpson’s index and dominance is detected at p ≤ 0.05. This coincides with the results of Martin and Thomas [60], in which herb structural richness was positively correlated with soil fertility index and P concentration. Their study also indicated an inverse correlation between soil P concentration and tree species richness. This means that P concentration in the soil is positively related to herb structural diversity, and this also seems to be the case in our study, wherein herbaceous species constituted the majority (53%) of the vegetation recorded in the studied archeological sites. It was revealed that high soil P concentration can enhance the growth of fast-colonizing, competitive species, while suppressing vascular plants’ richness [63]. The same results were also achieved by Hrivnák et al. [64], who found that P-rich sites in alder forests were dominated mainly by highly productive clonal species, and most often by Urtica dioica. On the other hand, the results in the present study show an opposite trend to Janssens et al. [65], who observed that species diversity expressed by Shannon’s index was reduced with increasing P concentration in soil. Our results show a significant positive correlation between the Shannon’s index of species diversity and P concentration in the soil, at p ≤ 0.05. The present study also reveals significant negative correlations between species diversity (expressed by richness and Shannon’s index) and Mn, at p ≤ 0.05 and p ≤ 0.01, respectively (greater Mn content in the soil negatively affects species diversity). Our findings agree with the results obtained by Martin and Thomas [60], who suggested that increases in soil Mn and Fe may be linked to reductions in dicot forbs, which contribute to most of the total richness in grasslands. It is worth mentioning that Mn does not significantly affect soil fertility compared to other soil elements, such as P, K+, Ca2+, and N [66]. The results of the present study also reveal that Simpson’ index dominance significantly decreases with increasing altitude, at p ≤ 0.05.

4.3. Relationship between Edaphic Factors and Vegetation Communities

Soil has played an essential role in plant existence and distribution. Soil characteristics often play an essential role in determining plant community distributions [67]. To assess the relevance of soil to species distribution, physical, chemical, and mineralogical analyses have been employed to determine soil criteria. Vegetation differences are strongly associated with differences in the bedrock [67,68]. These vegetation differences can often make the geologic discontinuities of an area clear, even to the casual observer. The remarkable differences often observed in plant cover for different soil types in adjacent areas have naturally led to attempts to explain these phenomena in terms of the physical or chemical properties of the soil, or the physiological characteristics of the plants [69]. The soil analysis manifested a wide range in most of the values recorded between the study sites; for example, Mg2+ in El-Nadora was about 10 times higher than in Tabieh Kousa Basha, while pH, Cu, P, Fe, CaCO3, and SP revealed a narrow range of variation. As such, only 4.5% of species were common and were recorded in 50% of the sampled stands. Each study site hosted a unique array of species, due to the unique characteristics of soil nutrient composition at each. The diversity of soil properties resulted in the diversity of soil use and soil ecological functions [70,71]. Differences between species’ ability to solubilize mineral nutrients could affect the ability or inability of plants to grow in particular soils. In calcareous soils, species suffer lime-chlorosis as a result of Fe deficiency, and their growth is affected by their ability to solubilize the native phosphate [72]. In general, EC values, soil Na+ concentration and secondarily the Mn concentration are the main factors affecting the number of species.
Soil fertility is difficult to quantify, because it is dependent not only on the status of N and P, but also on their availability [73]. El-Nadora recorded a high number of species due to the high nutrient content of its soil, as it recorded the highest mean value of EC, silt, clay, Ca2+, Na+, Cl, SO42−, TDS, SP, P, OM, N, Mg2+, and Fe. Tabieh Um Kebeba and Tabieh Kousa Basha recorded the lowest mean values of EC, Mg2+, Ca2+ and TDS, and the highest mean value of CaCO3, but the former recorded plenty of species, as it had the highest values of Fe, Zn, Cu, Silt, SAR, OM, SP, and N. On the other hand, Atta Fortress (Anfoshy) recorded the lowest number of species because it had the highest Mn, SAR, EC, Na+, Cl, and TDS levels, and the lowest CaCO3, HCO3, SP, P and Fe levels. Among the different study sites, patches of edaphic uniqueness are common, and these act as refuges for native species in highly colonized ecosystems [74], as the native species can use them to escape competition and disturbance [75]. However, the scarcity of studies on the role of soil in determining the prevalence of rare and endemic plants obstructs the efforts of public and private organizations to preserve such specialized microhabitats.
Population sizes are often not reported as they are rarely considered significant, but many regions show a unique assemblage of species, a higher level of species richness, or a high level of other associated species, which could help to protect the ecosystem in question [73]. Vegetation analysis studies assessing the relationships between physiognomic variation and environment have indicated that edaphic factors are more important than climatic factors in differentiating formations [76]. Thus, edaphic discontinuities determine size and population distribution, and should be considered when proposing conservation areas.

5. Conclusions and Recommendations

The plant cover—both natural and cultivated—of the archeological site contributes to its characterization and provides points of interest for visitors far beyond just ornamental value, landscaping, or the possibility of having shade; it represents an important natural heritage that enriches the value of the archeological site, and in some cases offers insight into human actions. Our results show differences among the vegetation types found in archeological sites as a function of the varying degrees of anthropization of the recorded taxa. Lower plant colonization, which may cause damage to floristic structures, was detected in less controlled, more open landscape sites. The problem of invasive alien species should not be underestimated; it is likely to become a serious threat to archeological sites as a whole and, therefore, the control of invasive species must be continuous and prolonged. In fact, vascular plants can inflict severe damage on buildings and structures— especially trees, largely due to their roots, which induce both chemical and mechanical forms of deterioration that could cause damage, so we recommend to reduce the cultivation of ornamental or shelter trees inside the archaeological sites.
The outcomes highlight the role the cultural landscapes could have in conservation of biodiversity. The study highlights an overlooked topic that crosses multiple disciplines integrating plant diversity conservation and the cultural heritage preservation. It emphasizes that conservation of biodiversity should be combined into cultural heritage protection initiatives, to protect the most biodiverse cultural sites in Alexandria City and in other significant historic cities worldwide. The study highlights the urgent need for measures to sustain and maintain cultural landscapes while considering the conservation of biodiversity within the archeological sites. It is hoped that the outcomes of the current study can provide guidance on the potential integration of biodiversity conservation in planning the management of archeological sites.

Supplementary Materials

The following supporting information can be downloaded at: https://www.mdpi.com/article/10.3390/su14042416/s1. Table S1. Recorded plant species in the present study; Table S2. Mean ± standard deviation of the soil variables in relation to habitats and 4 vegetation groups, derived after application of TWINSPAN; Figure S1. Human impact and land use; Figure S2. Habitat types of the selected sites; Figure S3. Landscape of some selected sites.

Author Contributions

Conceptualization, S.Z.H. and L.M.B.; methodology, S.Z.H., M.W.A.H., S.M.T., Y.M.A.-S., S.K.H., A.M.F. and L.M.B.; software, M.W.A.H. and Y.M.A.-S.; validation, Y.M.A.-S. and L.M.B.; formal analysis, Y.M.A.-S.; investigation, S.Z.H., M.W.A.H., S.M.T., Y.M.A.-S., S.K.H., A.M.F. and L.M.B.; resources, E.M.E.; data curation, M.W.A.H., S.M.T., Y.M.A.-S. and A.M.F.; writing—original draft preparation, S.M.T., Y.M.A.-S. and S.K.H.; writing—review and editing, S.Z.H., M.W.A.H., A.M.F., L.M.B., S.A.A., D.A.A.-B. and E.M.E.; visualization, S.Z.H. and L.M.B.; supervision, S.Z.H. and Y.M.A.-S. All authors have read and agreed to the published version of the manuscript.

Funding

This research received no external funding.

Institutional Review Board Statement

Not applicable.

Informed Consent Statement

Not applicable.

Data Availability Statement

The data presented in this study are available on request from the corresponding author.

Acknowledgments

The authors would like to express sincere gratitude to the administration of the Faculty of Science, Alexandria University, for their continuous support, providing logistical support and facilitating the field work. We are particularly grateful to the Governor of Alexandria for logistical support and granting permission to visit the studied sites.

Conflicts of Interest

The authors declare no conflict of interest.

References

  1. Caneva, G.; Benelli, F.; Bartoli, F.; Cicinelli, E. Safeguarding natural and cultural heritage on Etruscan tombs (La Banditaccia, Cerveteri, Italy). Rend. Lincei 2018, 29, 891–907. [Google Scholar] [CrossRef]
  2. Celesti-Grapow, L.; Ricotta, C. Plant invasion as an emerging challenge for the conservation of heritage sites: The spread of ornamental trees on ancient monuments in Rome, Italy. Biol. Invasions 2021, 23, 1191–1206. [Google Scholar] [CrossRef]
  3. Cicinelli, E.; Salerno, G.; Caneva, G. An assessment methodology to combine the preservation of biodiversity and cultural heritage: The San Vincenzo al Volturno historical site (Molise, Italy). Biodivers. Conserv. 2018, 27, 1073–1093. [Google Scholar] [CrossRef]
  4. Mercuri, A.M.; Sadori, L. Mediterranean Culture and Climatic Change: Past Patterns and Future Trends. In The Mediterranean Sea Its History and Present Challenges; Goffredo, S., Dubinsky, Z., Eds.; Springer: London, UK, 2014; pp. 507–527. ISBN 978-94-007-6703-4. [Google Scholar]
  5. Baiamonte, G.; Domina, G.; Raimondo, F.M.; Bazan, G. Agricultural landscapes and biodiversity conservation: A case study in Sicily (Italy). Biodivers. Conserv. 2015, 24, 3201–3216. [Google Scholar] [CrossRef]
  6. Antrop, M. Why landscapes of the past are important for the future. Landsc. Urban Plan. 2005, 70, 21–34. [Google Scholar] [CrossRef]
  7. Bartoli, F.; Romiti, F.; Caneva, G. Aggressiveness of Hedera helix L. growing on monuments: Evaluation in Roman archaeological sites and guidelines for a general methodological approach. Plant Biosyst. 2017, 151, 866–877. [Google Scholar] [CrossRef]
  8. Ceschin, S.; Bartoli, F.; Salerno, G.; Zuccarello, V.; Caneva, G. Natural habitats of typical plants growing on ruins of Roman archaeological sites (Rome, Italy). Plant Biosyst. 2016, 150, 866–875. [Google Scholar] [CrossRef]
  9. Gao, H.; Ouyang, Z.; Chen, S.; van Koppen, C.S.A. Role of culturally protected forests in biodiversity conservation in Southeast China. Biodivers. Conserv. 2013, 22, 531–544. [Google Scholar] [CrossRef]
  10. Woods, C.L.; Cardelús, C.L.; Scull, P.; Wassie, A.; Baez, M.; Klepeis, P. Stone walls and sacred forest conservation in Ethiopia. Biodivers. Conserv. 2017, 26, 209–221. [Google Scholar] [CrossRef]
  11. Frosch, B.; Deil, U. Forest vegetation on sacred sites of the Tangier Peninsula (NW Morocco)–discussed in a SW-Mediterranean context. Phytocoenologia 2011, 41, 153–181. [Google Scholar] [CrossRef]
  12. Nielsen, A.B.; van den Bosch, M.; Maruthaveeran, S.; van den Bosch, C.K. Species richness in urban parks and its drivers: A review of empirical evidence. Urban Ecosyst. 2014, 17, 305–327. [Google Scholar] [CrossRef]
  13. Säumel, I.; Weber, F.; Kowarik, I. Toward livable and healthy urban streets: Roadside vegetation provides ecosystem services where people live and move. Environ. Sci. Policy 2016, 62, 24–33. [Google Scholar] [CrossRef]
  14. Jackson, W.; Ormsby, A. Urban sacred natural sites–a call for research. Urban Ecosyst. 2017, 20, 675–681. [Google Scholar] [CrossRef]
  15. Planchuelo, G.; von Der Lippe, M.; Kowarik, I. Untangling the role of urban ecosystems as habitats for endangered plant species. Landsc. Urban Plan. 2019, 189, 320–334. [Google Scholar] [CrossRef]
  16. Motti, R.; Bonanomi, G. Vascular plant colonisation of four castles in southern Italy: Effects of substrate bioreceptivity, local environment factors and current management. Int. Biodeterior. Biodegrad. 2018, 133, 26–33. [Google Scholar] [CrossRef]
  17. Caneva, G. A botanical approach to the planning of archaeological, parks in Italy. Conserv. Manag. Archaeol. Sites 1997, 3, 127–134. [Google Scholar] [CrossRef]
  18. Stanley, J.D.; Carslon, R.W.; Van Beek, G.; Jorstad, T.F.; Landau, E.A. Alexandria, Egypt, before Alexander the Great: A multidisciplinary approach yields rich discoveries. GSA Today 2007, 17, 4–10. [Google Scholar] [CrossRef]
  19. Véron, A.; Goiran, J.P.; Morhange, C.; Marriner, N.; Empereur, J.Y. Pollutant lead reveals the pre-Hellenistic occupation and ancient growth of Alexandria, Egypt. Geophys. Res. Lett. 2006, 33, L06409. [Google Scholar] [CrossRef] [Green Version]
  20. Mark, J.J. Alexandria, Egypt-World History Encyclopedia. Available online: https://www.worldhistory.org/alexandria/ (accessed on 10 November 2021).
  21. Boulos, L. Flora of Egypt, Volume 1; Al Hadara Publishing: Cairo, Egypt, 1999; ISBN 9789775429148. [Google Scholar]
  22. Boulos, L. Flora of Egypt, Volume 2; Al Hadara Publishing: Cairo, Egypt, 2000; ISBN 9789775429223. [Google Scholar]
  23. Boulos, L. Flora of Egypt, Volume 3; Al Hadara Publishing: Cairo, Egypt, 2002; ISBN 9789775429254. [Google Scholar]
  24. Boulos, L. Flora of Egypt, Volume 4; Al Hadara Publishing: Cairo, Egypt, 2005; ISBN 9789775429414. [Google Scholar]
  25. Raunkiær, C. Plant Life Forms; Clarendon Press: Oxford, UK, 1937. [Google Scholar]
  26. Zohary, M. Flora Palestina. Part 2: Text Platanaceae to Umbelliferae; Israel Academy of Sciences and Humanities: Jerusalem, Palestine, 1972. [Google Scholar]
  27. Zohary, M. Flora Palaestina. Part 1: Text Equisetaceae to Moringaceae, 2nd ed.; Israel Academy of Sciences and Humanities: Jerusalem, Palestine, 1966; ISBN 9789652080004. [Google Scholar]
  28. Feinbrun-Dothan, N. Flora Palaestina Part 4: Alismataceae to Orchidaceae; Israel Academy of Sciences and Humanities: Jerusalem, Palestine, 1978. [Google Scholar]
  29. Feinbrun-Dothan, N. Flora Palaestina, Part 3: Ericaceae to Compositae; Israel Academy of Sciences and Humanities: Jerusalem, Palestine, 1977. [Google Scholar]
  30. Täckholm, V. Students’ Flora of Egypt, 2nd ed.; Cairo University: Cairo, Egypt, 1974. [Google Scholar]
  31. Boulos, L. Flora of Egypt Checklist, Revised Annotated Edition, 2nd ed.; Al Hadara Publishing: Cairo, Egypt, 2009; ISBN 9789774760020. [Google Scholar]
  32. Allen, S.E.; Grimshaw, H.M.; Parkinson, J.A.; Quarmby, C.; Roberts, J.D. Chemical analysis. In Methods in Plant Ecology; Moore, P.D., Chapman, S.B., Eds.; Blackwell Scientific Publications: Oxford, UK, 1986; pp. 285–344. [Google Scholar]
  33. Stirling, G.; Wilsey, B. Empirical Relationships between Species Richness, Evenness, and Proportional Diversity. Am. Nat. 2001, 158, 286–299. [Google Scholar] [CrossRef]
  34. Magurran, A. Measuring Biologcial Diversity; Wiley-Blackwell: Hoboken, NJ, USA, 2004; ISBN 978-0-632-05633-0. [Google Scholar]
  35. Palmer, M.W. Putting Things in Even Better Order: The Advantages of Canonical Correspondence Analysis. Ecology 1993, 74, 2215–2230. [Google Scholar] [CrossRef]
  36. Hill, M.O. A Fortran Program for Detrended Correspondence Analysis and Reciprocal Averaging; Cornell University, Section of Ecology and Systematics: Ithaca, NY, USA, 1979. [Google Scholar]
  37. Hill, M.O. Twinspan: A Fortran Program for Arranging Multivariate Data in an Ordered Two-Way Table by Classification of the Individuals and Attributes; Cornell University Section of Ecology and Systematics: Ithaca NY, USA, 1979. [Google Scholar]
  38. Gauch, H.G.; Whittaker, R.H. Hierarchical Classification of Community Data. J. Ecol. 1981, 69, 537–557. [Google Scholar] [CrossRef]
  39. IBM. SPSS Statistics for Windows; IBM Crop: Armonk, NY, USA, 2012. [Google Scholar]
  40. Braak, C.J.F.T.; Looman, C.W.N. Regression. In Data Analysis in Community and Landscape Ecology; Jongman, R.H.G., Tongeren, O.F.R., TerBraak, C.J.F., van Tongeren, O.F.R., Eds.; Cambridge University Press: Wageningen, The Netherlands, 1987; pp. 29–77. [Google Scholar]
  41. Gopal, D.; von der Lippe, M.; Kowarik, I. Sacred sites, biodiversity and urbanization in an Indian megacity. Urban Ecosyst. 2019, 22, 161–172. [Google Scholar] [CrossRef]
  42. Kowarik, I.; Buchholz, S.; von der Lippe, M.; Seitz, B. Biodiversity functions of urban cemeteries: Evidence from one of the largest Jewish cemeteries in Europe. Urban For. Urban Green. 2016, 19, 68–78. [Google Scholar] [CrossRef]
  43. Ives, C.D.; Lentini, P.E.; Threlfall, C.G.; Ikin, K.; Shanahan, D.F.; Garrard, G.E.; Bekessy, S.A.; Fuller, R.A.; Mumaw, L.; Rayner, L.; et al. Cities are hotspots for threatened species. Soil Process. Curr. Trends Qual. Assess. 2016, 25, 117–126. [Google Scholar] [CrossRef]
  44. Shwartz, A.; Turbé, A.; Simon, L.; Julliard, R. Enhancing urban biodiversity and its influence on city-dwellers: An experiment. Biol. Conserv. 2014, 171, 82–90. [Google Scholar] [CrossRef]
  45. Shwartz, A.; Muratet, A.; Simon, L.; Julliard, R. Local and management variables outweigh landscape effects in enhancing the diversity of different taxa in a bigmetropolis. Biol. Conserv. 2013, 157, 285–292. [Google Scholar] [CrossRef]
  46. Caneva, G.; Nugari, M.P.; Salvadori, O. Plant Biology for Cultural Heritage: Biodeterioration and Conservation; Getty Publications: Los Angeles, CA, USA, 2009. [Google Scholar]
  47. Heneidy, S.Z.; Halmy, M.W.A.; Toto, S.M.; Hamouda, S.K.; Fakhry, A.M.; Bidak, L.M.; Eid, E.M.; Al-Sodany, Y.M. Pattern of Urban Flora in Intra-City Railway Habitats (Alexandria, Egypt): A Conservation Perspective. Biology 2021, 10, 698. [Google Scholar] [CrossRef] [PubMed]
  48. Heneidy, S.Z.; Bidak, L.M. Multipurpose plant species in Bisha, Asir region, southwestern Saudi Arabia. J.-King Saud Univ. Sci. 2001, 13, 11–26. [Google Scholar]
  49. Le Houéou, H.N. The role of Browse in the management of natural grazing lands. In Browse in Africa; Le Houéou, H.N., Ed.; International Livestock Centre for Africa: Addis Ababa, Ethiopia, 1980; pp. 320–338. [Google Scholar]
  50. Heneidy, S.Z. Browsing and nutritive value of the most common range species in Matruh area, a coastal Mediterranean region, Egypt. Ecol. Mediterr. 2002, 28, 39–49. [Google Scholar] [CrossRef]
  51. Heneidy, S.Z. Diversity of Ecosystems. In Diversity of Ecosystems; Ali, M., Ed.; InTech: Rijeka, Croatia, 2012; pp. 127–166. ISBN 978-953-51-0572-5. [Google Scholar]
  52. Heneidy, S.Z.; Bidak, L.M. physical defenses and a version factor of some forage plant species in the western Mediterranean costal region of Egypt. J. Union Arab Biol. Cairo 1999, 9, 15–30. [Google Scholar]
  53. Minissale, P.; Sciandrello, S. The wild vascular flora of the Archaeological Park of Neapolis in Syracuse and surrounding areas (Sicily, Italy). Biodivers. J. 2017, 8, 87–104. [Google Scholar]
  54. Lausi, D.; Nimis, P.L. Roadside vegetation in boreal South Yukon and adjacent Alaska. Phytocoenologia 1985, 13, 103–138. [Google Scholar] [CrossRef]
  55. Adams, K.D.; Goebel, T.; Graf, K.; Smith, G.M.; Camp, A.J.; Briggs, R.W.; Rhode, D. Late Pleistocene and Early Holocene lake-level fluctuations in the Lahontan Basin, Nevada: Implications for the distribution of archaeological sites. Geoarchaeology 2008, 23, 608–643. [Google Scholar] [CrossRef]
  56. Vernon, K.B.; Yaworsky, P.M.; Spangler, J.; Brewer, S.; Codding, B.F. Decomposing Habitat Suitability Across the Forager to Farmer Transition. Environ. Archeol. 2020, 1–14. [Google Scholar] [CrossRef]
  57. Anderson, M.K. Tending the Wild: Native American Knowledge and the Management of California’s Natural Resources, 1st ed.; University of California Press: Berkeley, CA, USA, 2013; ISBN 9780520280434. [Google Scholar]
  58. Trauernicht, C.; Brook, B.W.; Murphy, B.P.; Williamson, G.J.; Bowman, D.M.J.S. Local and global pyrogeographic evidence that indigenous fire management creates pyrodiversity. Ecol. Evol. 2015, 5, 1908–1918. [Google Scholar] [CrossRef] [PubMed] [Green Version]
  59. Burton, T.M. Swamps: Wooded wetlands. In Encyclopedia of Inland Waters; Likens, G.E., Ed.; Elsevier: Amsterdam, The Netherlands; Boston, MA, USA, 2009; pp. 549–557. [Google Scholar]
  60. Nadeau, M.B.; Sullivan, T.P. Relationships between Plant Biodiversity and Soil Fertility in a Mature Tropical Forest, Costa Rica. Int. J. For. Res. 2015, 2015, 732946. [Google Scholar] [CrossRef]
  61. Ayyad, M.A.; Fakhry, A.M. Plant biodiversity in the western Mediterranean desert of Egypt. Verh. Ges. Für Okol. 1996, 25, 65–76. [Google Scholar]
  62. Huston, M. Soil nutrients and tree species richness in Costa Rican forests. J. Biogeogr. 1980, 7, 147–157. [Google Scholar] [CrossRef]
  63. Hofmeister, J.; Hošek, J.; Modrý, M.; Roleček, J. The influence of light and nutrient availability on herb layer species richness in oak-dominated forests in central Bohemia. Plant Ecol. 2009, 205, 57–75. [Google Scholar] [CrossRef]
  64. Hrivnák, R.; Slezák, M.; Jarcuška, B.; Jarolímek, I.; Kochjarová, J. Native and Alien Plant Species Richness Response to Soil Nitrogen and Phosphorus in Temperate Floodplain and Swamp Forests. Forests 2015, 6, 3501–3513. [Google Scholar] [CrossRef] [Green Version]
  65. Janssens, F.; Peeters, A.; Tallowin, J.R.B.; Bakker, J.P.; Bekker, R.M.; Fillat, F.; Oomes, M.J.M. Relationship between soil chemical factors and grassland diversity. Plant Soil 1998, 202, 69–78. [Google Scholar] [CrossRef]
  66. Lindgren, P.M.F.; Sullivan, T.P. Influence of alternative vegetation management treatments on conifer plantation attributes: Abundance, species diversity, and structural diversity. For. Ecol. Manag. 2001, 142, 163–182. [Google Scholar] [CrossRef]
  67. Guo, Y.; Gong, P.; Amundson, R. Pedodiversity in the United States of America. Geoderma 2003, 117, 99–115. [Google Scholar] [CrossRef] [Green Version]
  68. Méndez-Mendoza, C.; Reyes-Agüero, J.A.; Aguirre-Rivera, J.R.; Peña-Valdivia, C.B. Distribución Geográfica y Ecológica de Ephedra L. en el altipla-no potosino. Rev. Chapingo Ser. Hortic. 2000, VI, 131–138. [Google Scholar] [CrossRef]
  69. Proctor, J.; Woodell, S.R.J. The Ecology of Serpentine Soils. In Advances in Ecological Research; Academic Press: Cambridge, MA, USA, 1975; Volume 9, pp. 255–366. [Google Scholar]
  70. Krasilnikov, P.; García-Calderón, N.E.; Elizabeth, F.-R. Pedogenesis and slope processes in subtropical mountain areas, Sierra Sur de Oaxaca, Mexico. Rev. Mex. Cienc. Geológicas 2007, 24, 469–486. [Google Scholar]
  71. Krasilnikov, P.; García-Calderón, N.E.; Galicia Palacios, M. del S. Soils Developed on different parent materials. TERRA Latinoam. 2007, 25, 335–344. [Google Scholar]
  72. Ström, L.; Olsson, T.; Tyler, G. Differences between calcifuge and acidifuge plants in root exudation of low-molecular organic acids. Plant Soil 1994, 167, 239–245. [Google Scholar] [CrossRef]
  73. Bárcenas-Argüello, M.L.; del Carmen Gutiérrez-Castorena, M.; Terrazas, T. The Role of Soil Properties in Plant Endemism—A Revision of Conservation Strategies. In Soil Processes and Current Trends in Quality Assessment; Hernandez Soriano, M.C., Ed.; InTech: Rijeka, Croatia, 2013; pp. 381–398. [Google Scholar]
  74. Veblen, K.E.; Young, T.P. A California Grasslands Alkali Specialist, Hemizonia pungens ssp. pungens, Prefers Non-Alkali Soil. J. Veg. Sci. 2009, 20, 170–176. [Google Scholar] [CrossRef]
  75. Ecker, A.J.E. Influence of Substrate Type and Microsite Availability on the Persistence of Foxtail Pine (Pinus balfouriana, Pinaceae) in the Klamath Mountains, California. Am. J. Bot. 2006, 93, 1615–1624. [Google Scholar] [CrossRef]
  76. Kirkpatrick, J.B.; Bridle, K.L. Environmental relationships of floristic variation in the alpine vegetation of southeast Australia. J. Veg. Sci. 1998, 9, 251–260. [Google Scholar] [CrossRef]
Figure 1. Location of the study area: (a) map of Egypt’s administrative boundaries; (b) Alexandria Governorate with location of the study area and distribution of the studied historic sites; and (c) enlarged part of the study area in Alexandria City illustrating locations of the sampled sites in the studied historic places.
Sustainability 14 02416 g001
Figure 2. The most species rich families in the present study. Values above the bars are the number of species in each family.
Sustainability 14 02416 g002
Figure 3. The number of native, weed and alien species in relation to habitats (a) and locations (b).
Sustainability 14 02416 g003
Figure 4. Life form spectrum of the recorded taxa in the study area. TH: therophytes; CH: chamaephytes; HE: hemicryptophytes; PH: phanerophytes; GH: geophytes-helophytes; PA: parasites.
Sustainability 14 02416 g004
Figure 5. The global phytogeographical distribution of the species. (a) Chorological types of the recorded taxa in the study area. (b) ME: Mediterranean; IT: Irano-Turanian; SA: Saharo-Arabian; EU: European; PAN: Pantropic; SZ: Sudano-Zambezian; TR: tropical; PAL: paleotropical.
Sustainability 14 02416 g005
Figure 6. Dendrogram of the 4 vegetation groups derived after application of TWINSPAN classification technique (a). Cluster segregation of the 4 vegetation groups along axes 1 and 2 using DECORANA (b). The 4 groups are named after characteristic species, as follows: I, Chenopodium murale community; II, Glebionis coronaria community; III, Reichardia tingitana community and IV, Emex spinosa community. The numbers besides the black dots represent the IDs of the sampled plots.
Sustainability 14 02416 g006
Figure 7. Canonical correspondence analysis (CCA) bi-plot ordination of the sampled stands with soil variables. The numbers besides the white circles represent the IDs of the sampled plots. The 4 groups are named after characteristic species, as follows: I, Chenopodium murale community; II, Glebionis coronaria community; III, Reichardia tingitana community and IV, Emex spinosa community.
Sustainability 14 02416 g007
Table 1. Historical and archeological sites investigated, from west to east.
Site No. of StandsEstablishment Date [20]StatusArea (m2)LocationDescription [20]
Um Kebeba Fortress/Tabieh Um Kebeba20
(Stand 1–20)
19th
century
Not protected, no constraint preventing common activities in the area such as grazing, fire, waste disposal 62,156West of AlexandriaAn archeological place, “Tabieh”, which the residents call a “cave”, and which was built to repel the attacks of invaders. It has two doors and four rooms, and is abandoned, which allowed the fishermen to take it as a place to gather and store some of their tools.
Catacombs of Koum ElShoakafa3
(Stand 21–23)
2nd centuryProtected, archeological sites restrictions15,144Short distance southwest of Pompey’s PillarThe site comprises a multi-level labyrinth, with a big spiral staircase, in addition to lots of chambers ornamented with carved pillars, statues, and other religious symbols, burial niches, and sarcophagi of the syncretic Romano-Egyptian era, discovered in the early 20th century.
Pompey’s Pillar/ElSwary 6
(Stand 24–29)
298–302 A.D.Protected, archeological sites restrictions22,391The middle of AlexandriaThe 30 m high red Aswan granite pillar is a victory monument constructed about 300 A.D. for the Roman Emperor Diocletian, in an archeological site that previously included the Serapeum of Alexandria.
El-Nadora6
(Stand 30–35)
14th century A.D.Protected, archeological sites restrictions34,414In the customs district in AlexandriaTel Kom Nadora appears as an elegant archeological tower, which was used by Napoleon’s armies to assess the numbers of ships coming to Alexandria; Muhammad Ali set up an observatory for the movement of stars and planets. On this hill, the companion Amr ibn al-Aas ascended when he opened the city (25 A.H.–645 A.D.) where he built his mosque, which has been known since that time as the first mosque in the city of Alexandria. The antique tower of Kom Nadora was built after the collapse of the ancient lighthouse of Alexandria. The tower is in the shape of an octagon, with a height of about 25 m, and it consists of 4 floors, connected by a spiral staircase of wood. The oldest plan for this tower was made by an Italian traveler (Hugo Comnelli), 1472 A.D.
Atta Fortress/Tabieh Atta/Anfoshy3
(Stand 36–38)
Not protected, no constraint preventing common activities in the area such as grazing, fire, waste disposal27,360Ras El-Tin Palace, the Naval Base and Qaitbay CitadelNeighborhood used to hear the Ramadan cannon from the Atta site twice a day, firing at fast breaking at the time of the Maghrib call to prayer with another shot at Suhoor before the call to dawn prayer, until the silencing of the cannon in the late eighties.
Koum El-Dekah8
(Stand 39–46)
3rd century Roman EraProtected, archeological site restrictions39,213In the heart of modern AlexandriaRepresents part an ancient Roman cityscape complete with theater, public baths, houses, and palatial villas. What was once a Roman town was neglected, later rediscovered and excavated in 1960. Over the past half-century, discoveries have continued to be made on this site, including a series of lecture halls. The remains of a Roman Theater represent a noteworthy monument on the site. It contains 13 rows of seats arranged in a simple U-shaped formation. Most of the complex at Koum El-Dekah is residential, which includes opulent villas and homes for the wealthiest citizens of Alexandria throughout the 1st and 2nd centuries BCE.
El-Nahassen Fortress/Tabieh El-Nahassen/El-Shalalate Gardens4
(Stand 47–50)
The Greco-Roman eraNot fully protected37,474Al-Shatby district in middle of AlexandriaThe site contained the royal palace gardens and old Alexandria library of the Greco-Roman era, and the third major public park in Alexandria. The parks were established following the ideas of the American landscaper and park-maker Frederick Law Olmsted, and include towers that were once a part of the ancient Roman Alexandrian wall and Copper Fortress, ‘Tabieh El-Nahassen’, where copper tools were manufactured in the era of Mohammed Ali.
Kusa Basha Fortress/Tabieh Kousa Basha9
(Stand 51–59)
1807 ADNot protected, no constraint preventing common activities in the area such as grazing, fire, waste disposal, completely degraded due to overexploitation by local inhabitants36,720Abu Qir east of AlexandriaOne of the oldest taboos, it was established by order of Muhammad Ali Basha, who directed one of the senior commanders called “Muhammad Kousa Basha” to fortify Alexandria from French aggression. It was intended to be an impenetrable fortress to repel the attacks of invaders from eastern Alexandria, especially after the departure of the French campaign, and the failure of the English Fraser campaign. Tabieh is surrounded by a high external wall on all sides. This wall is separated from the sandy hill surrounding it by a trench 20 m wide and 8 m deep.
Table 2. Characteristics of the 4 vegetation groups derived after application of TWINSPAN. The vegetation groups are named as follows: I, Chenopodium murale community; II, Glebionis coronaria community; III, Reichardia tingitana community and IV, Emex spinosa community.
Vegetation GroupVG1VG2VG3VG4
First dominantChenopodium muraleGlebionis coronariaReichardia tingitanaEmex spinosa
Presence (%)839610092
Second dominantEmex spinosaMalva parvifloraMesembryanthemum crystallinumGlebionis coronaria
Presence (%)83798892
Habitats
Rocky ridge top16.712.525.030.8
Rocky ridge slope33.362.543.846.2
Gorge 12.56.315.4
Flat plain50.08.3 7.7
Rocky plateau 18.8
Swamp 4.2
Coastal dune 6.3
Sites
Tabieh Um Kebeba 12.525.0100.0
Koum ElShoakafa33.34.2
ElSwary 25.0
El-Nadora50.012.5
Anfoshy 18.8
Koum El-Dekah 33.3
Tabieh El-Nahassen16.712.5
Tabieh Kousa Basha 56.3
Table 3. Components of plant diversity in different habitats, sites, and the 4 vegetation groups identified in the present study. The vegetation groups are named as follows: I, Chenopodium murale; II, Glebionis coronaria; III, Reichardia tingitana and IV, Emex spinosa. *: p ≤ 0.05, **: p ≤ 0.01, ***: p ≤ 0.001.
HabitatRichnessSimpson’s DShannon’s H′Hill’s N1Hill’s N2Evenness E1Evenness E5
Rocky ridge top23.67 ± 6.080.06 ± 0.032.97 ± 0.3620.49 ± 5.6518.07 ± 5.160.95 ± 0.020.87 ± 0.03
Rocky ridge slope25.60 ± 7.290.06 ± 0.023.05 ± 0.2821.99 ± 6.2519.42 ± 5.450.95 ± 0.010.88 ± 0.03
Gorge18.83 ± 2.400.07 ± 0.012.77 ± 0.1516.16 ± 2.3814.38 ± 2.520.95 ± 0.020.88 ± 0.04
Flat plain28.00 ± 7.130.05 ± 0.023.14 ± 0.2924.00 ± 6.5420.66 ± 5.760.95 ± 0.010.85 ± 0.02
Rocky plateau12.33 ± 6.660.12 ± 0.042.31 ± 0.4710.83 ± 5.519.78 ± 4.700.95 ± 0.020.90 ± 0.03
Swamp10.000.152.128.296.740.920.79
Coastal dune19.000.072.8216.8215.130.960.89
F-value3.59 **6.04 ***4.89 ***3.37 **3.22 **0.762.13
Site
Tabieh Um Kebeba21.80 ± 6.560.07 ± 0.032.88 ± 0.3518.82 ± 5.8916.77 ± 5.370.95 ± 0.020.88 ± 0.03
Koum ElShoakafa26.33 ± 7.370.06 ± 0.023.06 ± 0.3322.10 ± 6.5718.91 ± 5.910.94 ± 0.010.84 ± 0.02
ElSwary28.50 ± 11.000.05 ± 0.023.16 ± 0.3424.83 ± 9.0622.18 ± 7.440.96 ± 0.010.89 ± 0.04
El-Nadora28.33 ± 4.230.05 ± 0.013.17 ± 0.1623.97 ± 3.7820.73 ± 3.270.95 ± 0.010.86 ± 0.02
Anfoshy12.33 ± 6.660.12 ± 0.042.31 ± 0.4710.83 ± 5.519.78 ± 4.700.95 ± 0.020.90 ± 0.03
Koum El-Dekah23.63 ± 4.660.06 ± 0.012.98 ± 0.1920.10 ± 4.1417.58 ± 3.910.95 ± 0.010.87 ± 0.03
Tabieh El-Nahassen26.00 ± 11.690.07 ± 0.053.00 ± 0.6122.61 ± 10.4719.51 ± 9.210.95 ± 0.020.84 ± 0.04
Tabieh Kousa Basha23.67 ± 5.430.06 ± 0.023.00 ± 0.2420.53 ± 4.9818.15 ± 4.580.95 ± 0.010.88 ± 0.03
F-value2.23 *2.58 *2.60 *2.061.900.481.82
Vegetation group
I27.83 ± 7.110.05 ± 0.023.13 ± 0.2823.59 ± 6.4120.33 ± 5.510.95 ± 0.010.85 ± 0.02
II25.04 ± 7.750.06 ± 0.023.02 ± 0.3221.49 ± 6.6718.84 ± 5.830.95 ± 0.010.87 ± 0.04
III20.75 ± 6.740.07 ± 0.032.84 ± 0.3818.07 ± 5.9016.11 ± 5.250.95 ± 0.010.89 ± 0.03
IV23.00 ± 7.470.07 ± 0.042.92 ± 0.4119.81 ± 6.7817.61 ± 6.190.95 ± 0.020.88 ± 0.03
Total23.71 ± 7.520.06 ± 0.032.96 ± 0.3620.41 ± 6.5417.98 ± 5.750.95 ± 0.020.87 ± 0.03
F-value1.790.911.401.441.100.501.53
Table 4. Simple linear correlation coefficient between diversity indices and soil variables.
Soil VariableRichnessSimpson’s DShannon’s H′Hill’s N1Hill’s N2Evenness E1Evenness E5
pH0.089−0.0700.0790.0780.0580.008−0.146
EC0.127−0.1050.1280.1450.1610.1650.119
Ca2+0.161−0.1320.1590.1740.1840.1400.062
Mg2+0.095−0.0820.0980.1120.1300.1450.126
Na+0.096−0.0960.1070.1200.1430.1940.181
K+−0.026−0.0520.015−0.028−0.025−0.006−0.027
HCO30.079−0.1230.1040.0780.0810.0410.003
Cl0.104−0.0730.0990.1220.1380.1550.121
SO42−0.159−0.1600.1740.1770.1930.1690.107
SAR−0.0780.001−0.036−0.044−0.0070.2370.331 *
TDS0.127−0.1050.1280.1450.1610.1650.119
N−0.030−0.0390.001−0.046−0.058−0.124−0.126
P0.290 *−0.263 *0.281 *0.274 *0.2420.099−0.224
Fe−0.1700.159−0.180−0.184−0.190−0.238−0.090
Zn−0.1700.092−0.133−0.156−0.142−0.0130.074
Mn−0.327 *0.345 **−0.360 **−0.319 *−0.308 *0.0520.188
Cu−0.1120.000−0.064−0.101−0.0920.1400.141
OM0.104−0.0190.0650.0810.046−0.149−0.278 *
CaCO3−0.044−0.003−0.018−0.041−0.052−0.013−0.114
Gravel0.225−0.2300.2490.2450.2380.184−0.070
Sand−0.0690.083−0.079−0.055−0.0290.0240.185
Silt−0.0200.001−0.014−0.033−0.052−0.070−0.138
Clay0.110−0.1200.1200.0970.0710.006−0.186
SP0.057−0.1220.0940.0600.0530.057−0.035
Alt0.126−0.291 *0.2210.1120.1110.021−0.014
*: p ≤ 0.05, **: p ≤ 0.01.
Table 5. The significant differences (F-value) in soil characteristics among the locations, habitats and identified vegetation groups, evaluated using one-way analysis of variance (ANOVA-1). *: p ≤ 0.05, **: p ≤ 0.01, ***: p ≤ 0.001.
Soil VariableF-Value
LocationHabitatVG
Physical propertiespH 2.19 *1.340.78
ECdS/m0.960.220.47
Gravel%7.75 ***1.970.81
Sand12.73 ***0.285.03 **
Silt6.15 ***0.122.35
Clay11.77 ***0.565.95 ***
SP6.87 ***0.503.10*
SAR0.921.462.09
OM13.63 ***0.685.37 ***
CaCO31.090.451.04
Available nutrientsTDSppm0.960.220.85
N6.38 ***0.927.37 ***
P16.34 ***2.2613.28 ***
CationsCa2+meq/L1.030.151.11
Mg2+1.580.391.67
Na+0.830.310.86
K+2.90 **0.903.25 *
AnionsHCO32.30 *0.352.09
Cl1.200.510.82
SO42−0.810.010.87
Heavy metalsFeppm5.35 ***1.724.65 **
Zn3.98 **1.941.30
Mn9.24 ***13.82 ***2.34
Cu4.82 ***2.070.60
Publisher’s Note: MDPI stays neutral with regard to jurisdictional claims in published maps and institutional affiliations.

