Abstract
Background: University campuses can be leaders of change by tracking carbon footprints and establishing strategies for reductions. The American University of Sharjah (AUS) has led this effort in the United Arab Emirates (UAE), establishing an Office of Sustainability to address energy consumption on its campus, resulting in a reduction of 30% by 2015. AUS campus uses the Greenhouse Gas Protocol to annually track carbon footprint. The purpose of this paper is to stablish a framework that institutions can use to calculate the carbon footprint (CF) on their university campuses. Methods: The GHG Protocol, which categorizes emissions into three scopes; 1: direct, 2: indirect, and 3: other indirect emissions, was used as a guideline. This paper covers the following: Scope 1: emissions from university fleet, Scope 2: emissions from electricity and water consumption, Scope 3: emissions from the university commute, limited business air travel and waste. The data for each category are analyzed and recommendations to reduce the carbon footprint are presented. Results: The total CO2 emissions for the AUS campus in 2018–2019 were 94,553.30 tCO2e. Additionally, the percentage contribution of total emissions for Scope 1, 2 and 3 were 0.37%, 61.12% and 38.51%. Conclusions: The two highest contributors of CO2 emissions at the AUS campus are electricity consumption (60.91%) and university commute (36.54%). AUS has hosted numerous educational campaigns and awareness programs to try to reduce carbon emissions, which helped in reducing electricity consumption throughout campus; however, these are still insufficient; hence, the importance of quantifying the CF of the AUS campus. Based on the results obtained, recommendations can be made to reduce overall CO2 emissions for AUS and other higher education institutions in the region and internationally.
1. Introduction
Climate change was first viewed as an international concern by the United Nations in 1992 because of its substantial negative effect on the world. Since then, there have been ongoing discussions on the steps required to mitigate it. In 1997, the Kyoto Protocol was established. It highlighted the role carbon emissions played in worsening the issue of climate change and the necessity to reduce the global carbon footprint across all sectors, including various institutions; specifically, higher education institutions (HEI) [1]. As a result of this, the questions of how the carbon footprints of universities would be assessed and what are the most effective method to use have become popular among the scientific community.
Furthermore, carbon footprint (CF) is defined as “a measure of the exclusive total amount of carbon dioxide (CO2) emissions that is directly and indirectly caused by an activity or is accumulated over the life stages of a product” [2]. This concept is crucial in obtaining environmental-based information which will enhance sustainable decision-making. Moreover, the impact of the carbon footprint as well as the correct process to account for it have long been investigated by academics and environmental experts. One such method to account for the carbon footprint is the assessment of the whole lifecycle of a product by quantifying and presenting all emissions [3] (p. 4). Additionally, the concentration of carbon dioxide in the environment is measured as carbon dioxide equivalent (CO2-eq). This has been exponentially increasing throughout the past few decades and has resulted in increasing temperatures which have had major implications for the ecosystem [4]. According to the Intergovernmental Panel on Climate Change’s (IPCC) 1996 guidelines, greenhouse gas (GHG) inventories were introduced to identify and calculate the GHG emissions within the environment and to translate the emissions into universal terms of CO2 equivalent. The framework of these guidelines has been segregated based on the area in which emissions can be recorded, be it through a city, corporate or even a product scale [5]. Therefore, by utilizing the carbon footprint concept, direct and indirect GHG emissions can be reported; thus, providing a complete picture on an entity’s emissions and potential environmental impact.
There is no doubt that the impacts of global warming are accelerating; as a result, various organizations and institutions have begun to evaluate their GHG emissions. One significant group of institutions are HEIs as they tend to provide thousands of students and staff with lecture and working space that demands large amounts of electrical power. In addition to this, because HEIs are centralized organizations which have long planning timeframes and dense populations, they are ideal places to investigate [6] (p. 97). Additionally, many critics believe that HEIs hold a significant responsibility to resolve the issues of sustainability and serve as a role model to society [7]. HEIs should educate their students on sustainable development/practices and address both the ecological and social challenges faced in the present or those which may occur in the future [8]. This is done by introducing ecofriendly practices and by helping students understand the impact their day-to-day activities have on the environment. Likewise, a sustainable institution is expected to cover all aspects; these include teaching, research, community outreach, academia and campus operation [9]. There is even an ongoing discussion within the scientific community on the necessity of universities to become carbon neutral. However, for HEIs to become more sustainable, the first step they should take is assessing the damage of their carbon emissions and the resulting negative effects on climate change. This is done by conducting carbon footprint calculations. By doing this, universities can target their most problematic emissions and help achieve a greener future.
Globally, there are many universities that have begun calculating their carbon footprint as part of a sustainability initiative. According to Grindsted, approximately 1400 universities around the world have signed declarations on Sustainability in Higher Education (SHE) [10], although carbon footprinting is most institutionalized in the USA, where almost 1000 HEIs have registered to use the Sustainability Tracking, Assessment and Rating System (STARS) [9]. With regards to the Gulf Cooperation Council (GCC) region, there seem to be only a few institutions involved in carbon footprinting practices or registered to use the STARS tool. These include King Abdullah University of Science and Technology (KAUST), Prince Sultan University (PSU), both located in Saudi Arabia (neither have achieved a rating), and the American University of Sharjah and University of Sharjah in the United Arab Emirates (both have achieved silver ratings) [11]. Despite the growing emphasis on the importance of recording and publishing carbon inventories in HEIs, there is still much debate on the most effective methods to do so.
Moreover, the most common methodologies used are life cycle assessment (LCA), environmentally extended input–output analysis (EEIOA), hybrid LCA and the GHG Protocol. LCA is very detailed and time consuming. EEIO, on the other hand, does not focus on detail but is reliable and provides a complete overview on the contributions of the total CF. Hence, to balance out the weaknesses most authors use a hybrid LCA which is a mix of both models [12]. Additionally, with regards to EEIO, a key part of applying the model is matching the data from the financial account of an HEI to the EEIO sectors. This matching can sometimes cause problems as an item can be distributed over several EEIO sectors. HEIs use a variation of these methods; for instance, The Norwegian University of Technology & Science (NTNU) used a hybridized model for Scopes 1 and 2 and then for Scope 3 it used EEIOA [12]. Other examples are shown in Table 3. In the case of AUS, the GHG Protocol was implemented as not all the financial data could be obtained or matched to the sectors required for the EEIO model. The literature review clearly demonstrated a lack of available published data in the Gulf region. There are no studies available which compare the methods or results of universities in the Gulf to those in other parts of the world. Hence, this paper is necessary to determine where universities such as AUS rank with regards to carbon emissions and possible areas which can be improved.
The American University of Sharjah (AUS) is a university located in the United Arab Emirates and was founded in 1997. It offers 28 majors and 45 minors at the undergraduate level, 16 master’s degree programs and 3 Ph.D. programs. It covers an area of 128 hectares and in the academic year 2018–2019 the numbers of students, faculty and staff were 5122, 355 and 564. It consists of the following buildings: College of Arts and Sciences (five buildings), College of Architecture, Art and Design (two buildings), College of Engineering (three buildings), the School of Business Administration, administration (two buildings) and a library. It also has faculty housing, student dorms, a sports complex, a healthcare center, a mosque, a range of restaurants/cafes, grocery stores, a barber shop, a travel agency office, a pharmacy and a bank branch (Sharjah Islamic Bank) [13]. AUS has been striving for a more sustainable campus over the years and has done this by focusing on raising awareness and hosting educational campaigns. These campaigns aim to inform the community on the importance of reducing overall emissions generated within the premises of the university. Correspondingly, the university created an Office of Sustainability in 2009 to address the issue of energy consumption. By 2015 energy consumption was reduced by 30%. Despite this achievement in reduction of energy consumption, AUS has recognized the importance of evaluating its carbon footprint (by looking at various sources of emissions) to understand the status of the campus.
The results of this study will help establish future sustainable policies, as well as technical measures which will aim to reduce overall consumption of resources. In addition to this, the results obtained in this research will not only be beneficial for AUS, but they can be used as a baseline for other universities in the region when calculating their carbon footprint. This perhaps will create opportunities to address carbon emissions within HEIs in the region; especially after the UAE government’s strategic initiative to reach net zero was announced in October 2021. This means that more guidance and direction will be provided with regards to carbon footprints of universities. Hence, it will be important that AUS is ahead of any regulations and not trying to keep up with new regulations.
Moreover, it is true that many universities globally account for their carbon emissions and produce annual reports which can be used as a guideline. However, the sources of emission differ from region to region as there are other factors which play a vital role, such as climate and cultural/social practices; therefore, comparisons are difficult. The proposed scientific research methodology will be an effective tool to reduce CO2 emissions and encourage innovations. Furthermore, quantified annual carbon footprint results will provide an analytical basis for the accurate and effective integration of strategic carbon management planning [4]. Focusing strategic planning towards procurement and operational procedures will ensure that effective/sustainable decisions are made and will validate the adaption of sustainable practices. This in turn will reduce emissions significantly.
This research paper aims to propose a framework that can be used by regional and international university campuses for their management to follow best practices to significantly reduce carbon-based emissions. The research primarily aims to calculate AUS’s carbon footprint by segregating emissions into three respective scopes based on whether each activity is a direct or indirect emission source. This is the first study in the region to report carbon footprint calculations and provide recommendations on data gathering and reduction strategies.
2. Materials and Methods
This section of the research paper addresses the following: (1) the use of the GHG Protocol as a methodology in terms of categorization of emissions and calculations conducted; (2) boundaries of the study and accountability; (3) a detailed description of the scopes and emissions assessed in this paper and how each is accounted for; (4) any additional assumptions or exclusions made. Furthermore, the methodology explained below was used to assess the carbon footprint of AUS for the academic year 2018–2019.
2.1. GHG Protocol and Calculation Methodology
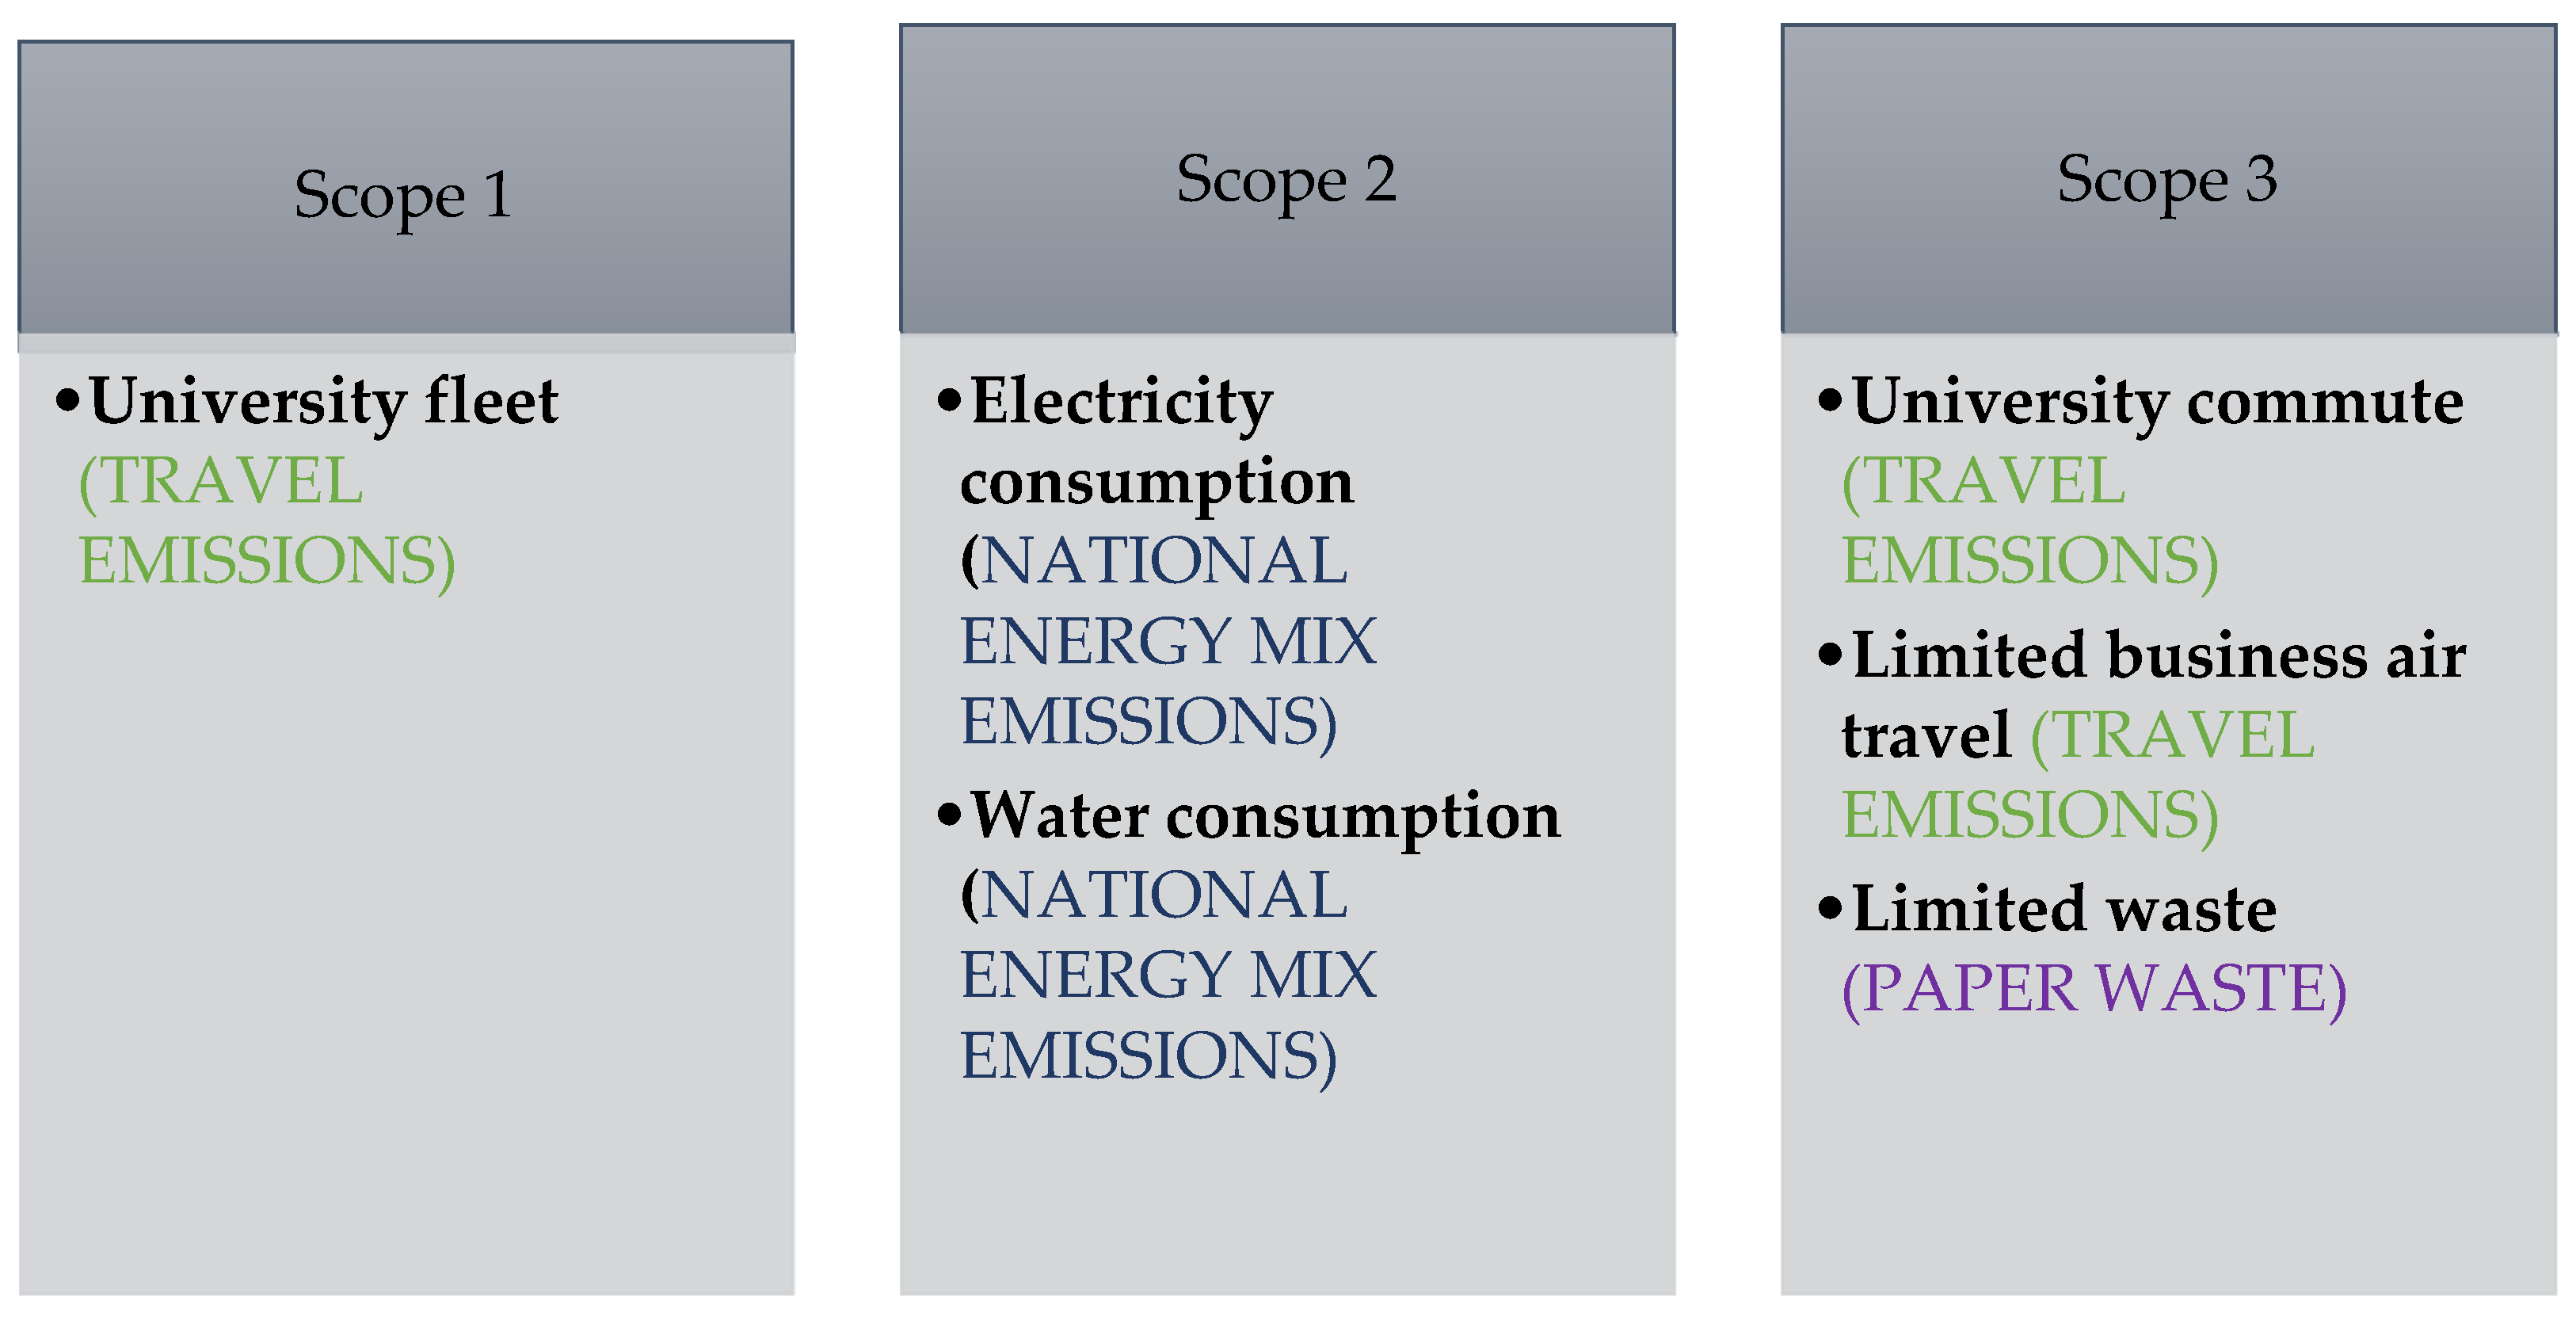
The GHG Protocol initiative was launched in 1998 and aims to develop internationally accepted GHG accounting and reporting standards for various institutions. It does this by categorizing sources of emissions into three main scopes. Scope 1 looks at direct emissions; these are emissions which are owned or controlled by the institute, such as: emissions from combustion in owned or controlled boilers. Scope 2 includes indirect GHG emissions; these are emissions from the generation of purchased electricity and water consumed by the institute. Lastly, Scope 3 accounts for other indirect GHG emissions. These are generated because of activities of the institution but occur from sources which are not owned by it. Today many industries, governments and institutions have adopted the GHG Protocol methods [8]. This is because it is practical and builds on the experience of numerous experts and practitioners [14].
Furthermore, on an international level there are many CF tools such as Carbon Footprint, Carbon Fund, Cool Climate and Simple Carbon Calculator. However, there only exists one tool which is specific to HEIs and that is Campus Carbon Calculator (also referred to as SIMAP), which was created by a US-based organization, Clean Air-Cool Planet (CA-CAP). It uses Excel spreadsheets as well as emission factors from the Environmental Protection Agency (EPA) [15]. This paper did not use this tool as the emission factors are specific only to the USA. Instead, the guidelines provided by the GHG Protocol Corporate Accounting and Reporting Standard, which contains extensive details on carbon footprint calculations, were used to calculate AUS’s carbon footprint. The following equation was applied throughout the report. This formula is also used by software such as Campus Carbon Calculator [16].
A × Fg = Eg
As per the standard, the two most essential values when calculating CO2-based emissions are activity data (A) and emission factors of GHGg (Fg). Activity data is a measure of the level of activity that results in GHG emissions (either directly or indirectly). For example, activity data could be the amount of fuel, or the amount of paper consumed. To then convert this activity data into emissions for that gas (Eg) (in our case CO2 emissions), an emission factor (Fg) is used. Emission factors are specific to each given source and are expressed in terms of CO2/per unit of measurement (activity data for a given source). The GHG emission factors were obtained by different sources of well-recognized institutions that are explained hereafter.
GHG =∑g Eg × GWPg
Moreover, global warming potential (GWPg), refers to the contribution of a greenhouse gas towards global warming in reference to CO2 [14]. According to the IPCC 4th assessment report, the GWP of CO2 in reference to an emission source has been assigned a value of 1 [5]. Total GHG emissions (expressed in tons of CO2 equivalent, tCO2e, are expressed as the sum of the emissions of each gas multiplied by its GWP.
2.2. Boundaries and Accountability
When looking at the boundaries of the study being conducted, both organizational and operational boundaries must be considered to determine accountability. AUS does not manage the maintenance of the grounds of the campus and therefore does not have the water usage data for these activities. However, the emissions for these facilities are released on campus; thus, AUS is held accountable. This is supported by the accounting criteria described by the World Business Council for Sustainable Development and the World Resource Institute, which classifies the scope of the emissions depending on the source (in this case AUS is the source of the emissions) [14].
2.3. Scopes and Sources of Emission
The scopes and sources of emissions (as well as a short description) covered in this study are summarized in Figure 1. These will be assessed in more detail in the sections to follow.
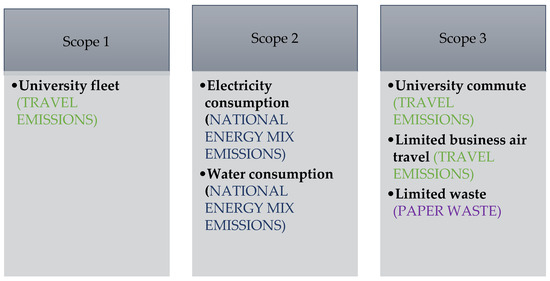
Figure 1.
Scope and sources of emissions.
2.3.1. Scope 1 Emissions
The source which was examined under Scope 1 emissions was the university fleet. This refers to the university-based vehicles utilized in commuting either inside or outside the vicinity of the university. In collaboration with the transportation department, the emissions were derived through obtaining the fuel economy (which is measured in L/100 km), the distance traveled (over the academic year) and the emission factor. To obtain the values of the fuel economy, the model and year of all vehicles were recorded. Additionally, the specific emission factor used (2.3865 tCO2e/L) was taken from the 2006 IPCC guidelines for national GHG inventories on mobile combustion [17].
2.3.2. Scope 2 Emissions
Scope 2 emissions were split into two: electricity consumption and water consumption.
Electricity Consumption
This is the total quantity of the electricity consumed within the premises of the university. The emissions were derived by summing up the total quantity of the electricity consumed monthly (over the academic year) across the entire university campus. These data were retrieved from the university electricity bills, which are issued by the Sharjah Electricity and Water Authority (SEWA). The activity data were measured in kWh. Additionally, the emission factor used (0.98 tCO2e/MWh) was obtained from the UNDP project document of the United Arab Emirates (UAE) [18]. This is because the university does not have access to the emission factors (measured in tCO2e/MWh) used by SEWA.
Water Consumption
This is the total quantity of water consumed within the premises of the university. This includes indoor consumption only. Similarly, to electricity consumption, emissions were derived by summing up the total quantity of the water consumed monthly (over the academic year) across the entire university campus and were retrieved from the utility bills issued by SEWA. The activity data were measured in Gal. The emission factor from SEWA was unavailable; instead, a value of 28.027 tCO2/MIG was used. This was retrieved from Dubai Electricity and Water supply (DEWA). However, the assumption that DEWA and SEWA values are the same contributed to a level of uncertainty and inaccuracy.
2.3.3. Scope 3 Emissions
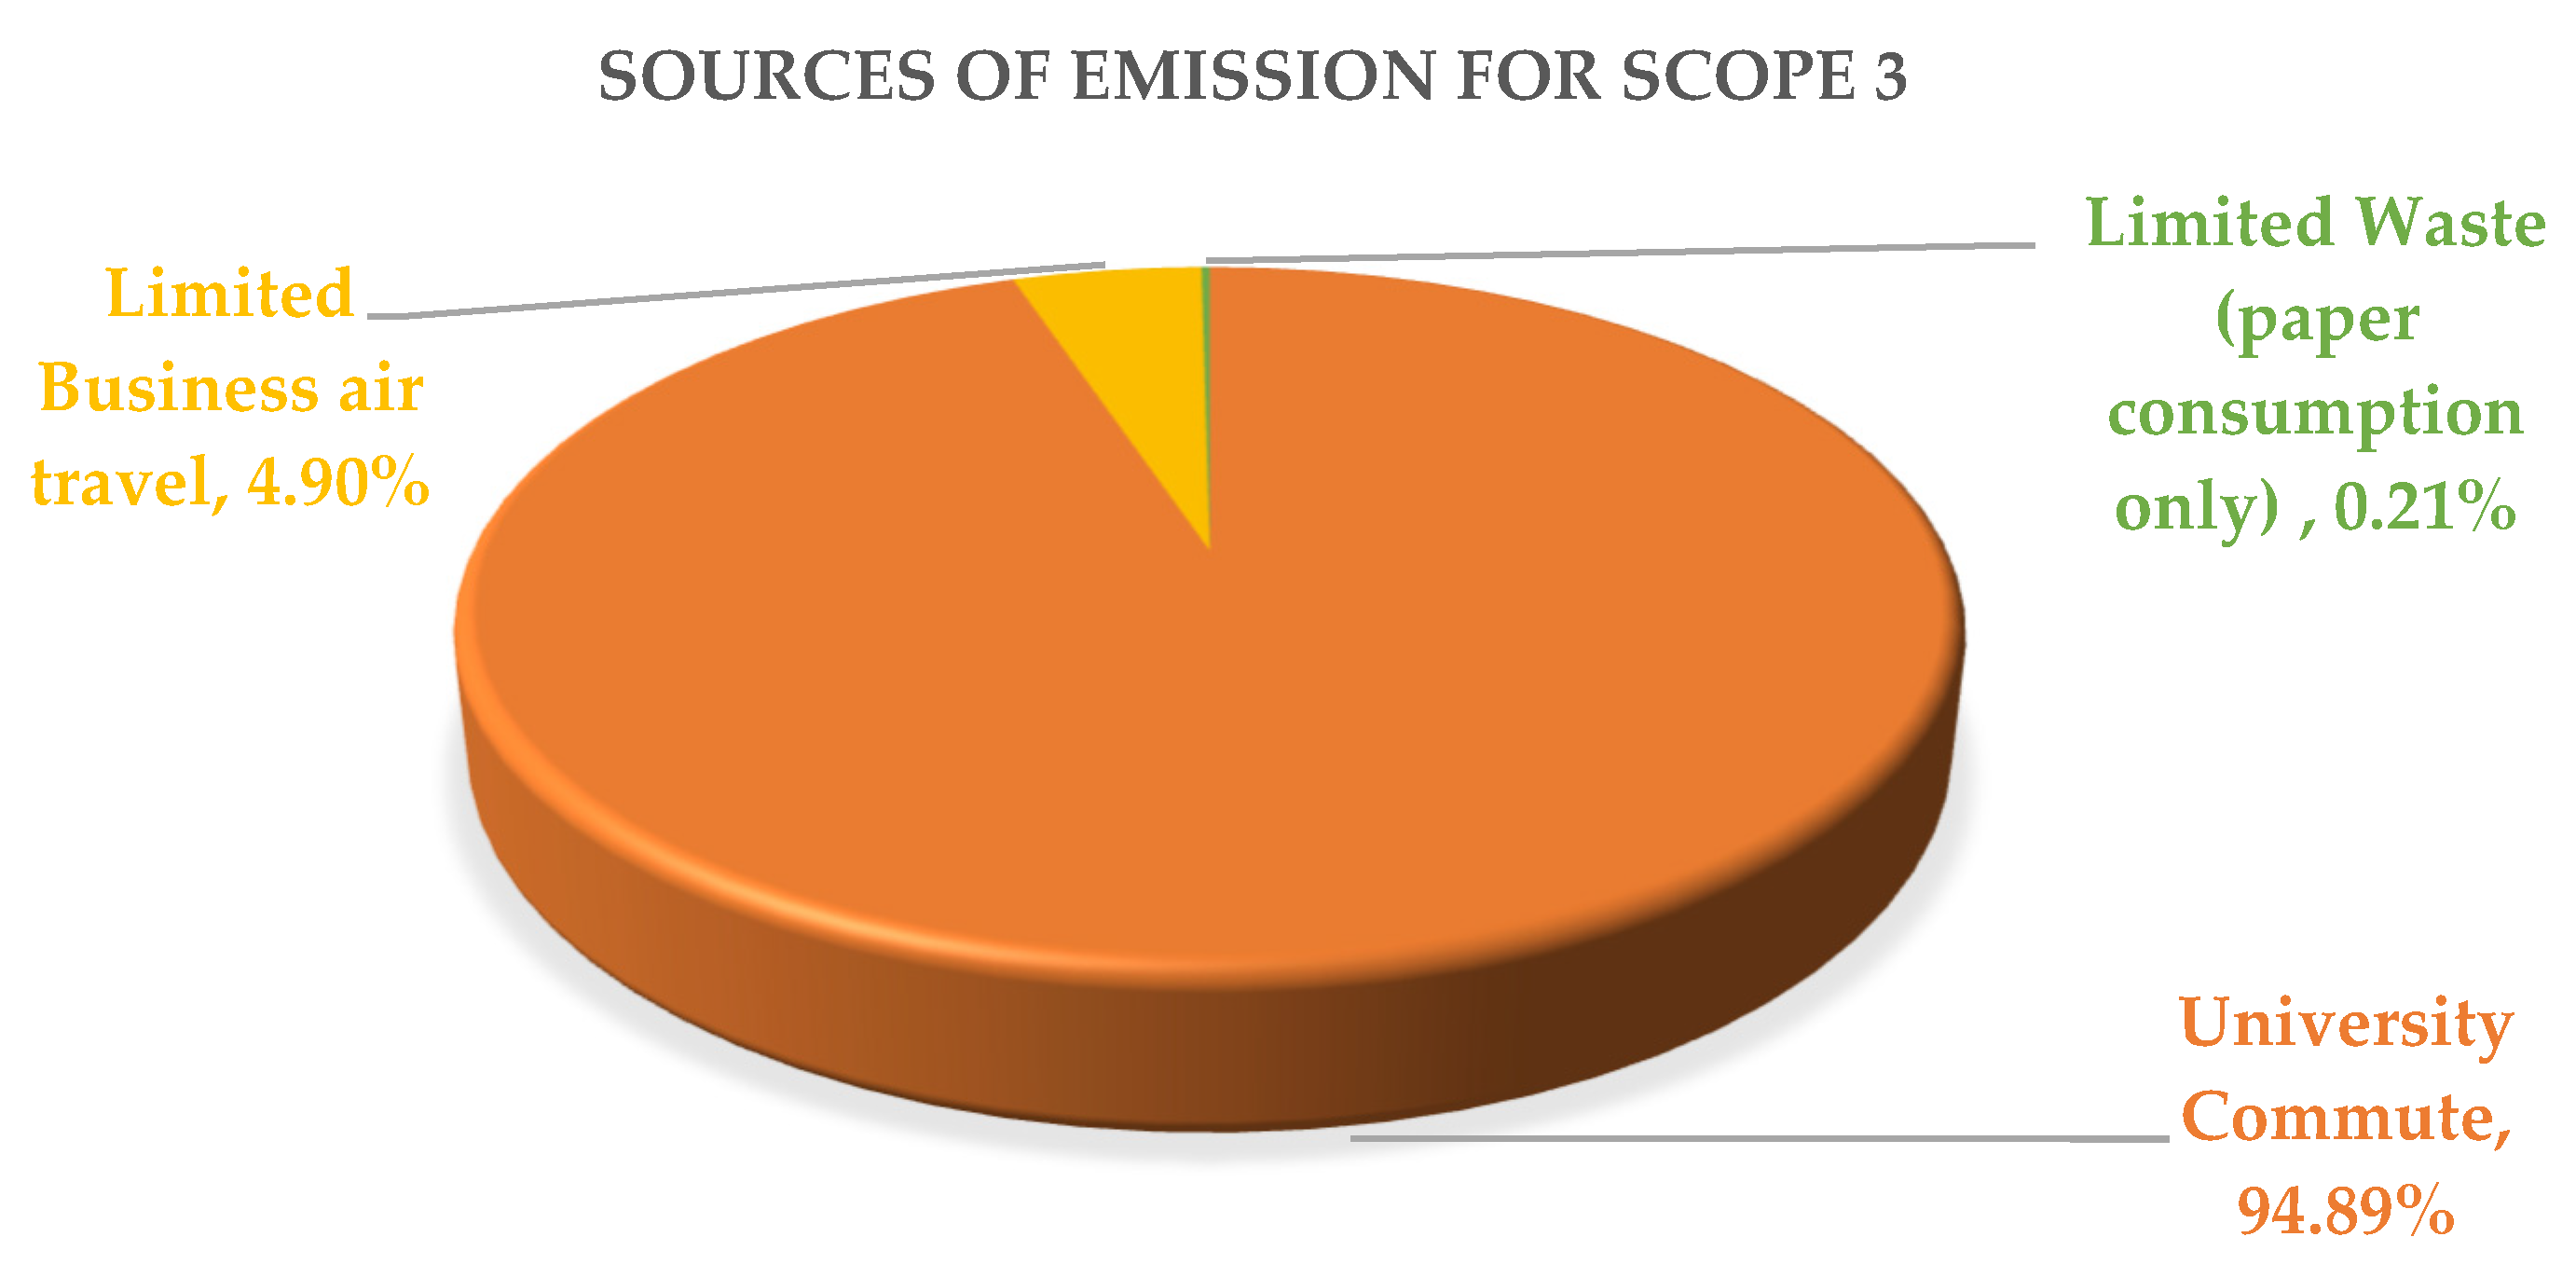
The emissions from Scope 3 were split into three main sources. These were university commute, limited business air travel and limited waste produced.
University Commute
This section investigates university commutes of faculty members, staff and students. With regards to transportation, the data were gathered from AUS Sustainability’s Annual Sustainability Survey. From this data it was observed that most of the faculty members reside on campus. Therefore, their projected emissions due to university commutes would be rather negligible and were not accounted for in the study.
On the other hand, most students and staff commuted to and from university. Obtaining details of individual vehicles was not feasible as it would require a lot of effort and be time consuming. Hence, the survey asked about the fuel economy of the individual’s vehicle, as well as the distance commuted from home to the university. The survey was sent out to the AUS students and staff during the academic semester of spring 2020. Thus, the commute data were pulled from the annual survey and extrapolated from the respondents to give an estimated commute of the AUS community. It must also be noted that the survey was conducted in January/February of 2020 and so answers were not impacted by COVID-19. Moreover, the primary intention of this survey was to obtain a relative estimate on the overall emissions. Some of the questions are listed below:
- How far do you travel one way to commute to AUS campus?
- Less than 5 km;
- 5 km to 9 km;
- 10 km to 19 km;
- 20 km to 29 km;
- 30 km to 39 km;
- 40 km or more.
- From which region do you typically commute to the AUS campus?
- Ras Al Khaimah;
- Ajman;
- Dubai;
- Fujairah;
- Sharjah;
- Abu Dhabi;
- Umm Al Quwain;
- Other (please specify).
- How often do you use each of the following modes of transportation when commuting to and/or from the AUS campus (Always, About half the time, Sometimes, Rarely or Never)?
- Bus and/or train;
- Carpool;
- Taxi;
- Driver.
- What type of vehicle do you typically drive or ride on your commute to campus (most often)?
- Sports car/two-seater;
- Coupe;
- Small sedan;
- Full-size sedan;
- Truck;
- Sport utility vehicle—small (5 seats or less);
- Sport utility vehicle—large (6 seats or more);
- Minivan;
- None of these/Other.
- Which of the following describe the type of vehicle you typically drive on your commute to campus (most often)?
- Electric vehicle or EV;
- Hybrid vehicle;
- Diesel;
- None of these.
The above questions provided an insight on the modes of transportations used. Furthermore, an estimate on the average fuel economy was allocated to each type of vehicle (based on the values in the region). Lastly, the distance covered provided an estimate of the total liters consumed over the course of the two-way trip to the university. The emission factor (2.3865 tCO2e/L) utilized was the same value used for the university fleet in scope 1 [17]. It must also be mentioned that most of the vehicles driven were diesel and gasoline-based; therefore, hybrid and electric vehicle emissions were rather negligible.
Limited Business Air Travel
The data for this section of the report were retrieved through ITL World (travel agency used by AUS) and focused on anonymized employee travel funded by the university. The International Civil Aviation Organization (ICAO) platform was then used to calculate the emissions exhibited per passenger over the course of the journey taken (measured as tCO2e/journey). However, the calculated emissions contain a degree of uncertainty as only limited data were available. The data did not include university sponsored travel that was purchased through the reimbursement process. These data were not tracked and therefore not available. The CO2 emissions calculations were based on the destinations, including all stops, and the class of travel; whereby an estimated average of the total distance traveled was determined. Using this value, the average fuel consumption of the aircraft was formulated and reported in relevance to CO2 emissions.
Limited Waste
This section is divided into two sections: waste generated from paper consumption and general waste.
Firstly, to calculate the amount of waste generated from paper consumption, the total amount of paper (irrespective of the size) consumed across all colleges and administrative departments throughout the academic year) was quantified. This information was retrieved from AUS’s supply chain management department. These data allowed the researchers to measure the activity factor in tons of paper consumed. Additionally, in accordance with the waste reduction model published by the US Environmental Protection Agency (EPA) the emission factor 3.1 tCO2e/ton was used [19].
On the other hand, with regards to general waste disposed of by Sharjah Municipality, an audit was conducted by the sustainable campus initiative in the university. However, insufficient data were obtained to evaluate overall emissions for the waste that was being disposed in either landfills or even the portion recycled. As a result, general waste was not considered in the study. The methodology used is summarized in Figure 2.
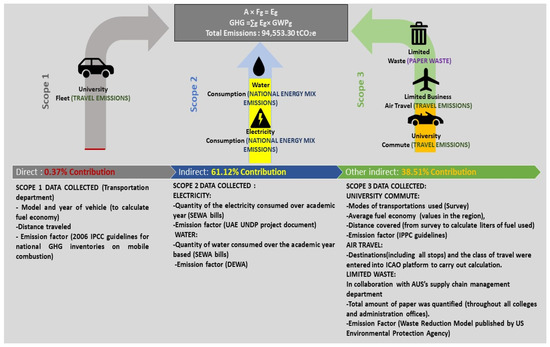
Figure 2.
Summary of methodology.
2.4. Other Assumptions and Exclusions
Below is a list of additional assumptions and exclusions made in this research paper.
- Scope 1 did not account for the emissions of refrigerant generators (operated by diesel). This is because the third-party company that is contracted to operate these generators was not required to provide these data in the current contract; hence, they were not provided to the researchers.
- With regards to air travel, this paper only considered emissions of employees travelling under the funding of the university. It did not consider air travel by sports teams and international students, or those students engaged in study abroad and internship programs. This is because the data were not tracked at this time.
- Emissions from yearly investments in the building’s structure, IT architecture or procurement impacts were not considered as data retrieved from third parties were insufficient and emission factors could not be obtained.
- Emissions from chemicals, gases and detergent consumption were not considered as obtaining emission factors from the respective manufacturing industries was also not possible.
3. Results
In this section, the main result for each scope is presented.
3.1. Scope 1
University Fleet
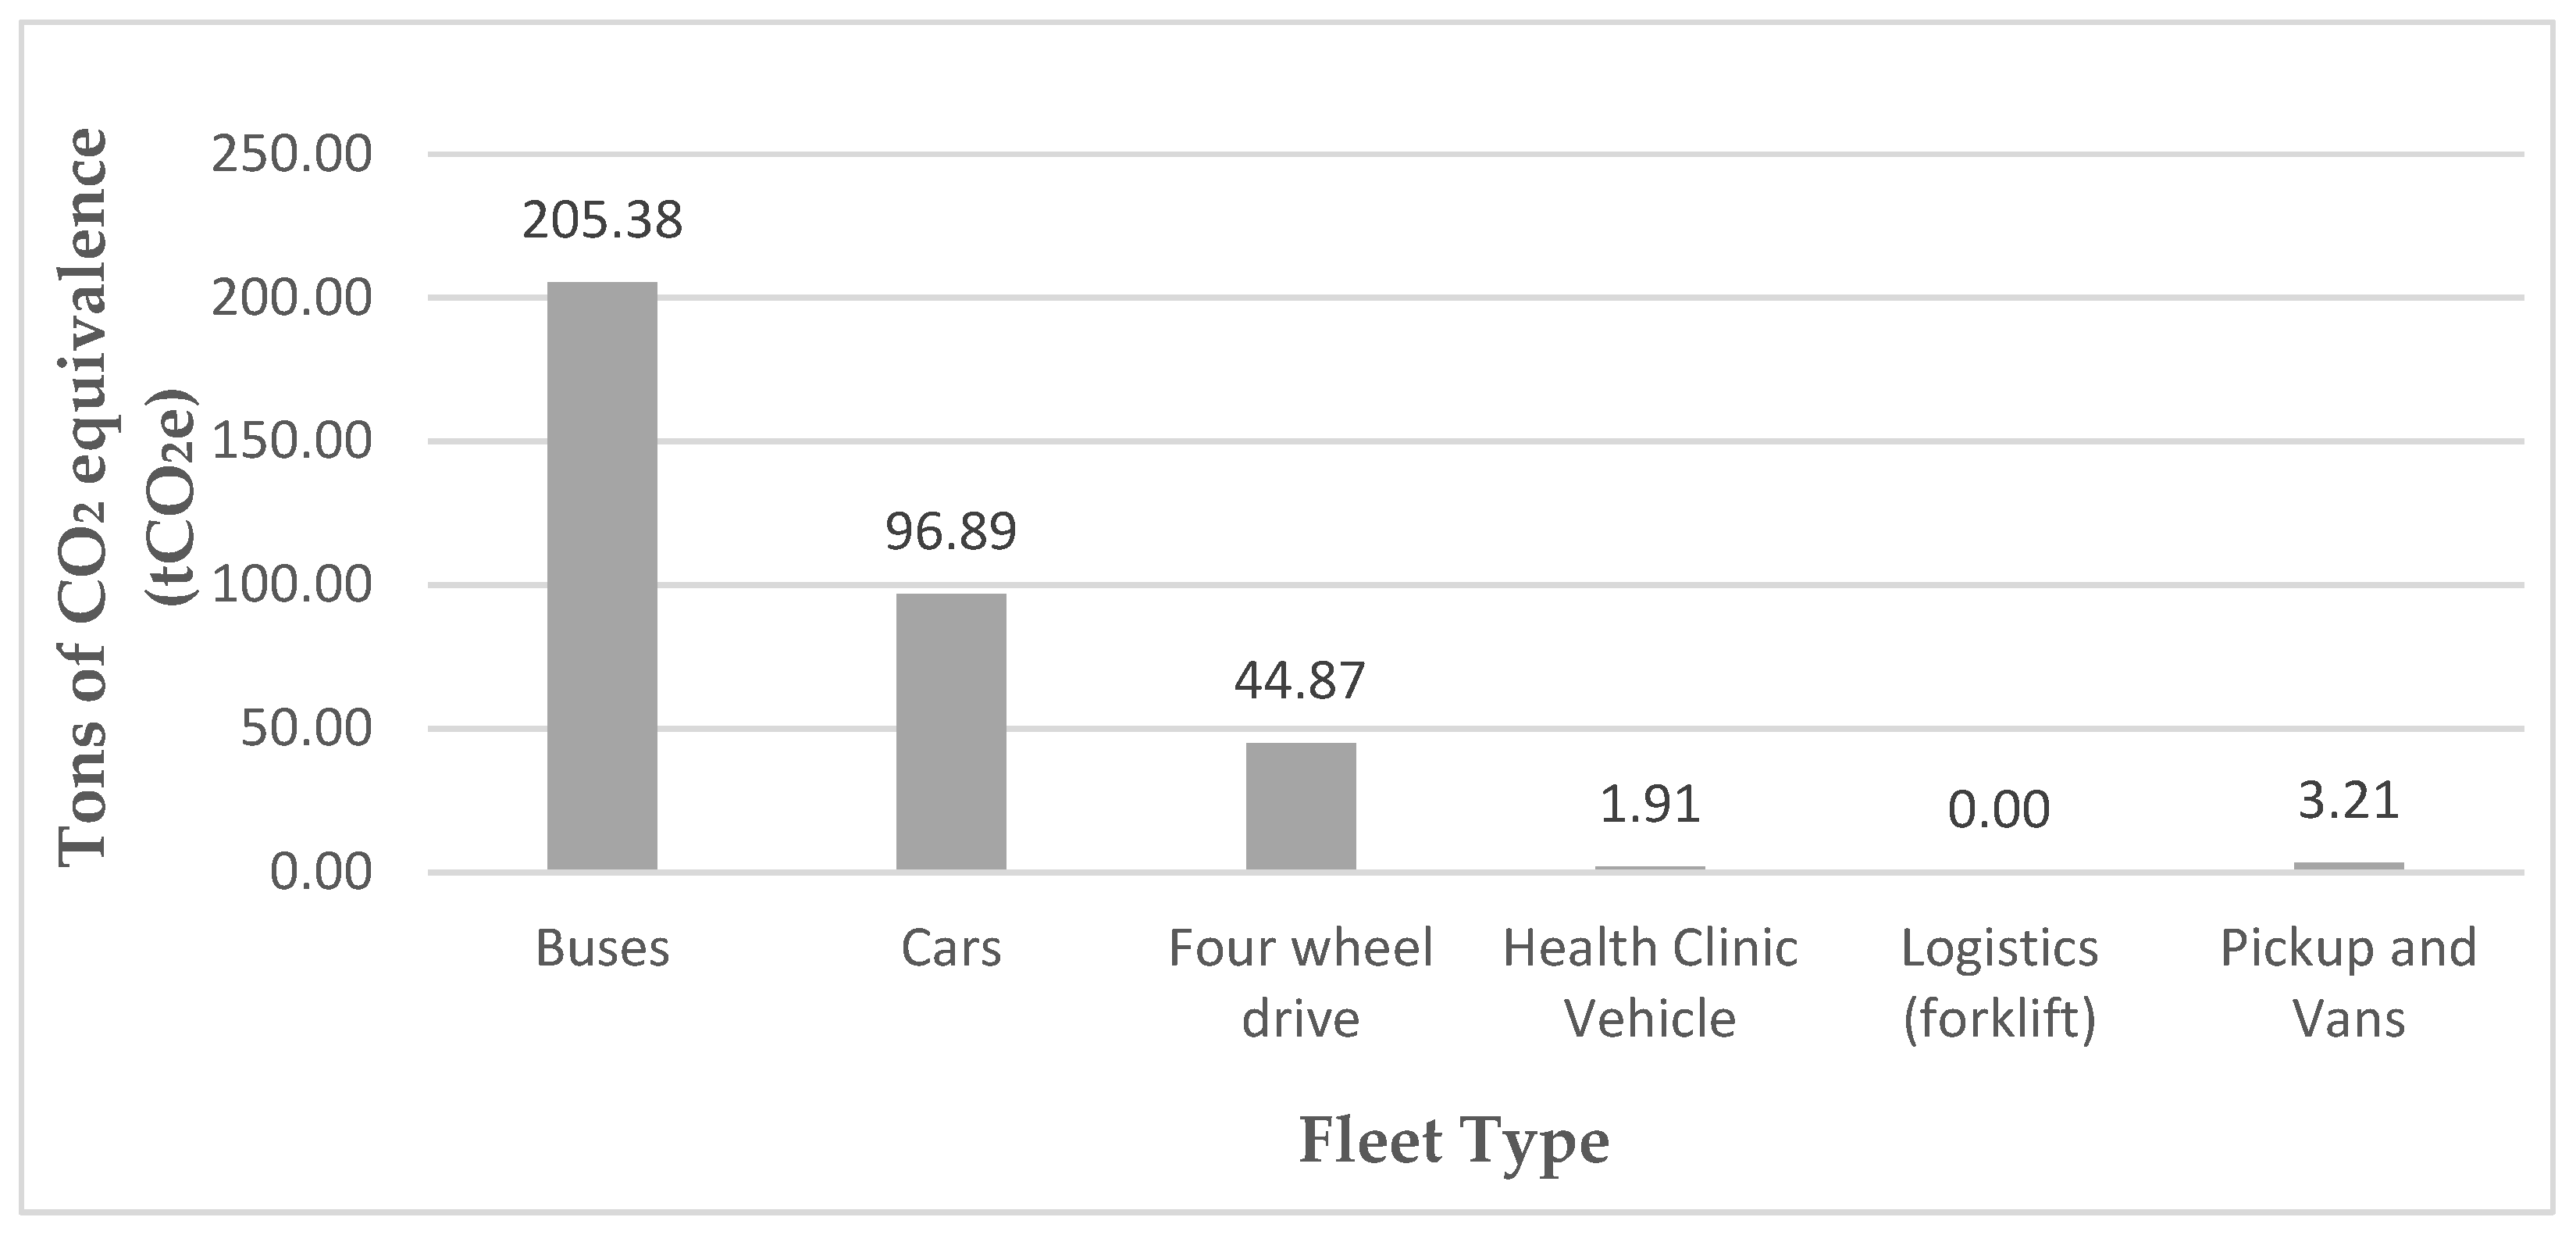
In the academic year 2018–2019 a total of 40 vehicles (cars, buses, pickups, vans and forklifts) were observed. These vehicles consumed a total of 147,607 gallons of both gasoline and diesel over the academic year. Figure 3 summarizes the total tons of CO2 equivalent for each type of vehicle.
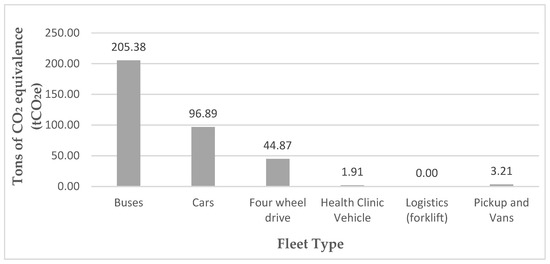
Figure 3.
Emissions of university fleet for the academic year 2018–2019.
The overall emissions amounted to a total of 352 tCO2e (0.37% of total emissions). Buses had the highest emission rate with a value of 205.38 tCO2e. This is because there is a high demand on buses as they are not only used by students to commute to dorms from nearby campuses: there were also shuttle buses which drive to areas outside of AUS. The next highest contributing vehicles were cars utilized for carpooling purposes. On the other hand, with regards to vehicles used for logistics such as a forklifts (used to transport goods present in the storages or garages of AUS), the emission value was reported as 0 as it was calculated in hours of use, not distance.
3.2. Scope 2
3.2.1. Electricity Consumption
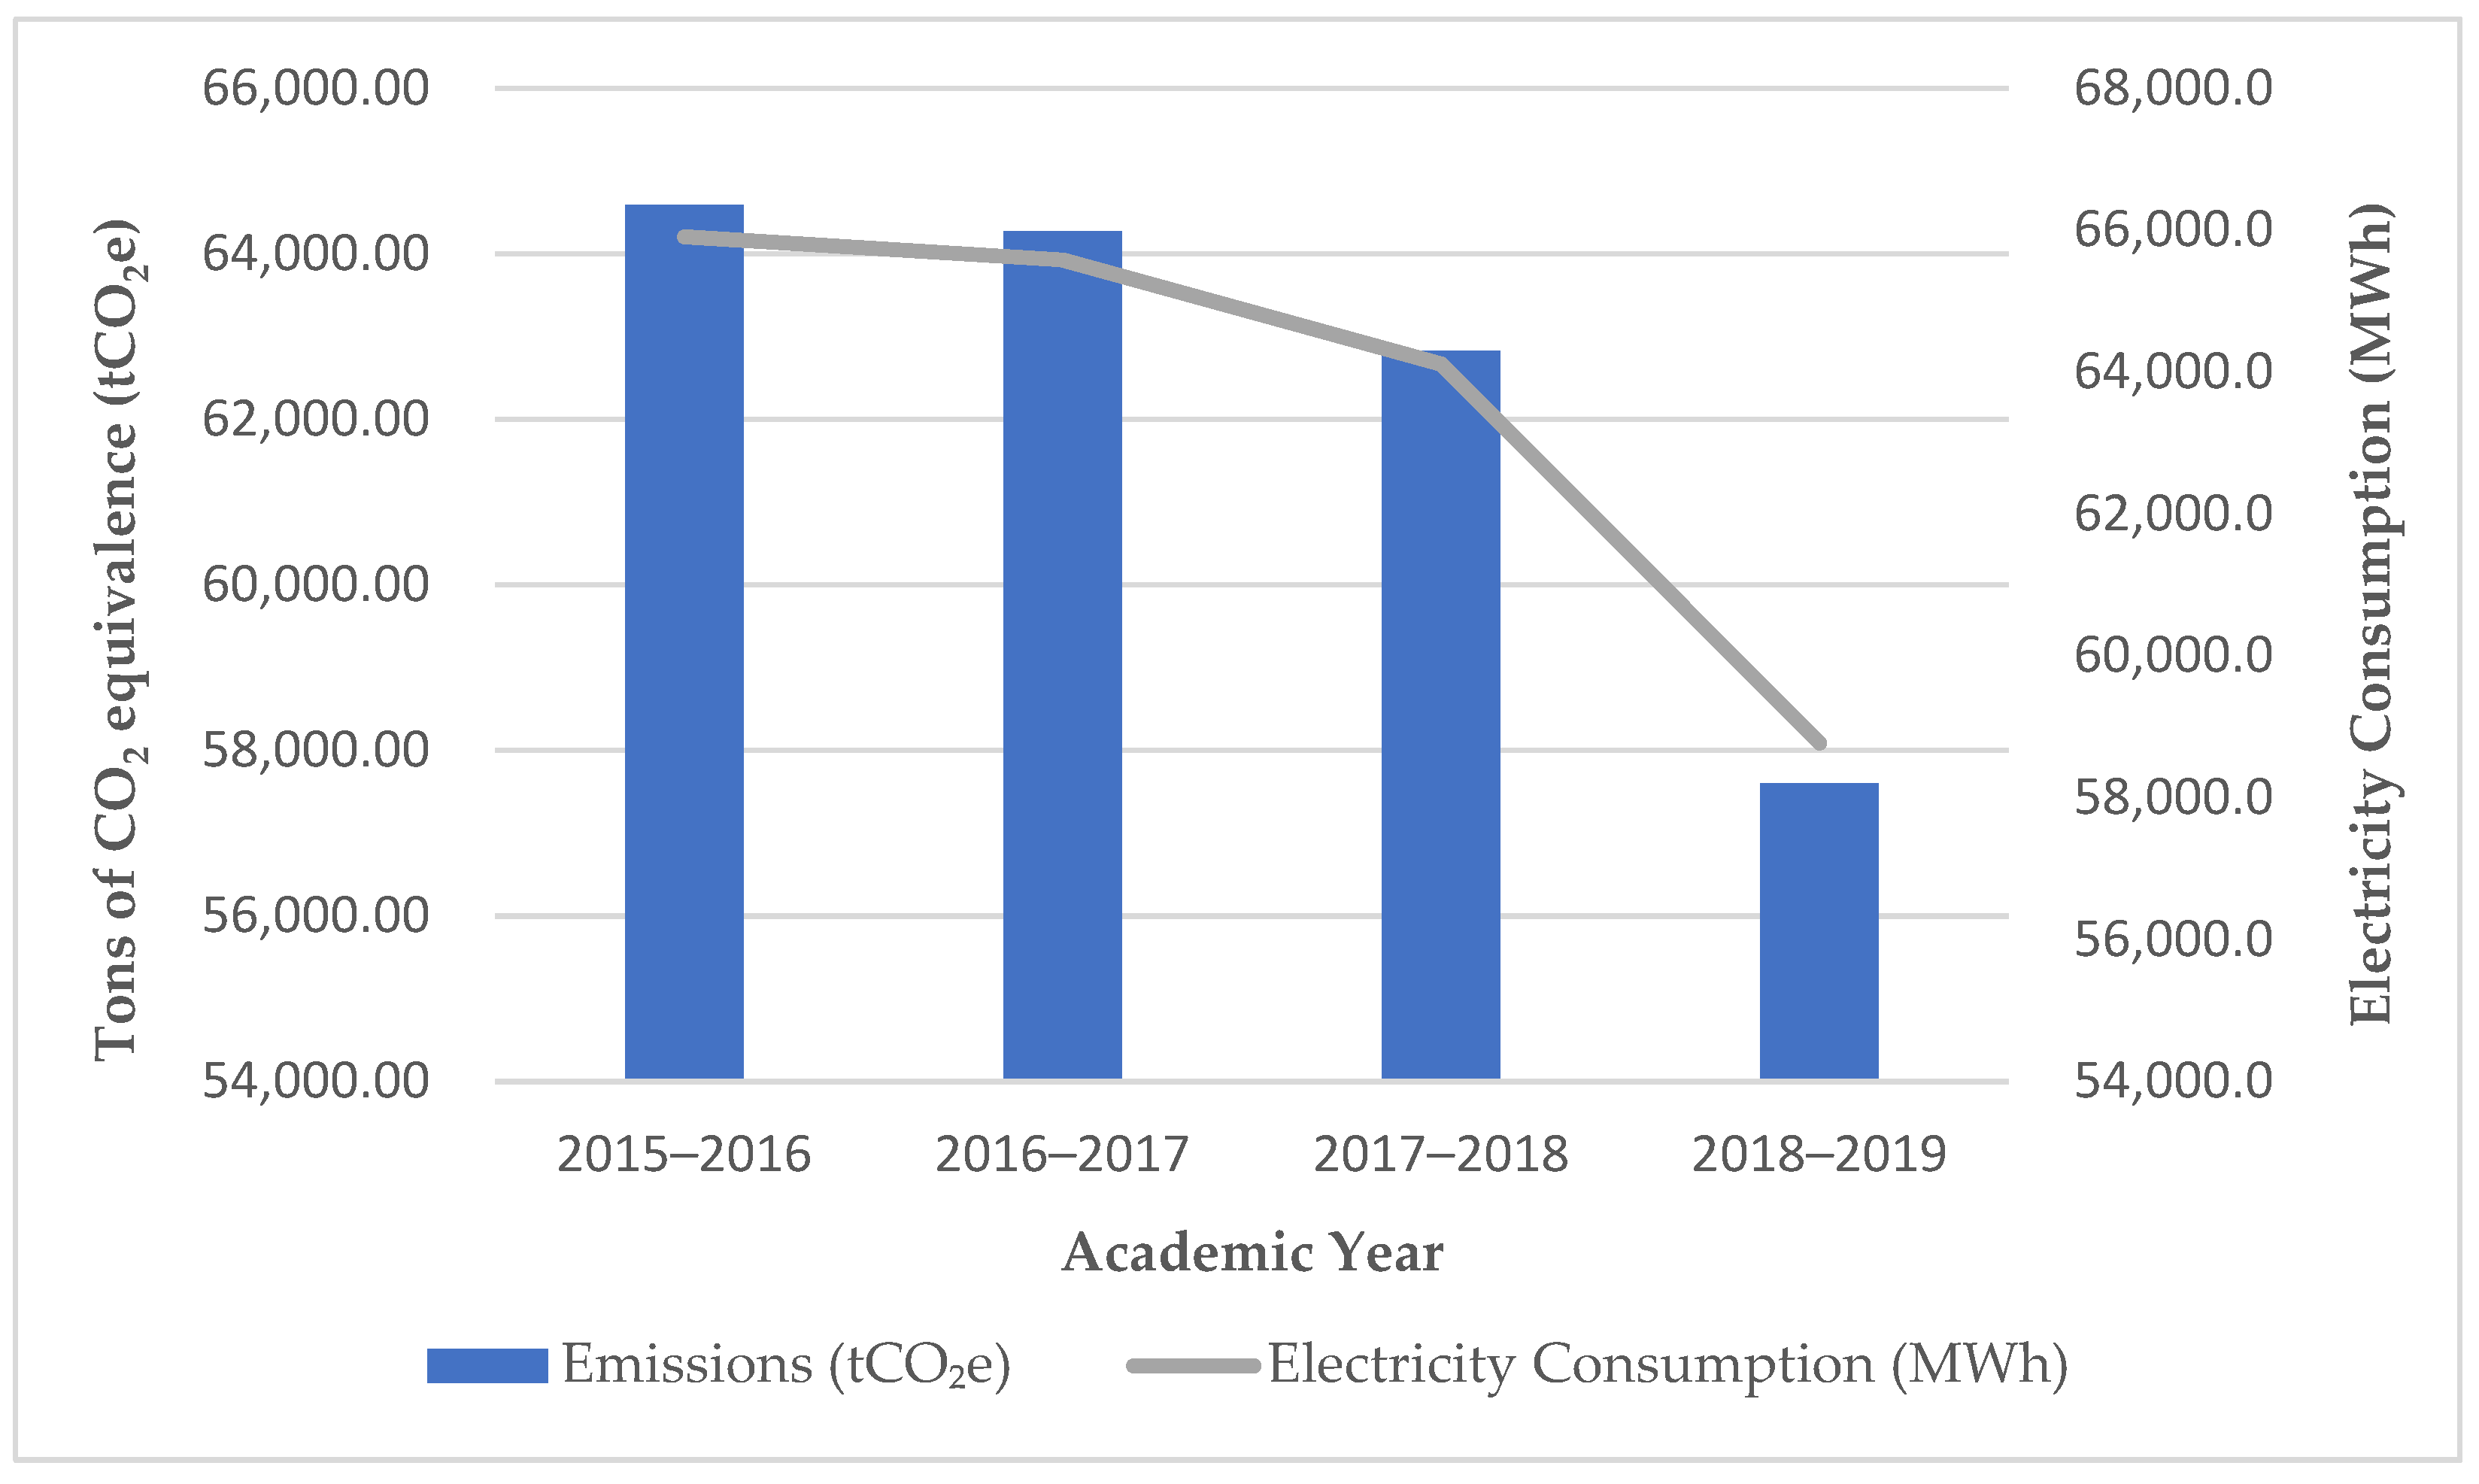
The electricity consumption data for the past four years were collected and used to calculate CO2 emissions. Figure 4 is a representation of these results. In the academic year 2018–2019 the annual electricity consumption was 58,771 MWh. This equates to 57,596.3 tCO2e (CO2 emissions) and contributed to 60.91% of the total emissions at the AUS campus. Over the past four years there was a gradual decrease in emissions, which correlates to a decrease in electricity use. Moreover, there was a decrease of 8.3% between the academic years 2017–2018 and 2018–2019. This was due to the sustainability office’s continuous work through educational campaigns and awareness programs to try and educate students and faculty members on the importance of resource conservation.
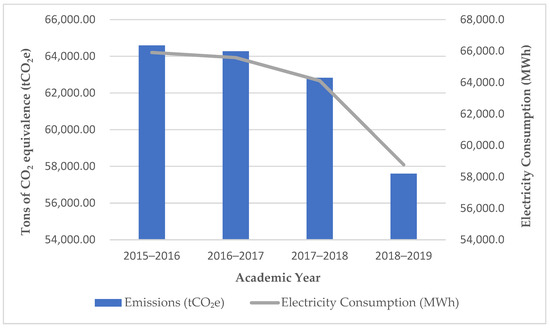
Figure 4.
Electricity consumption and emissions.
3.2.2. Water Consumption
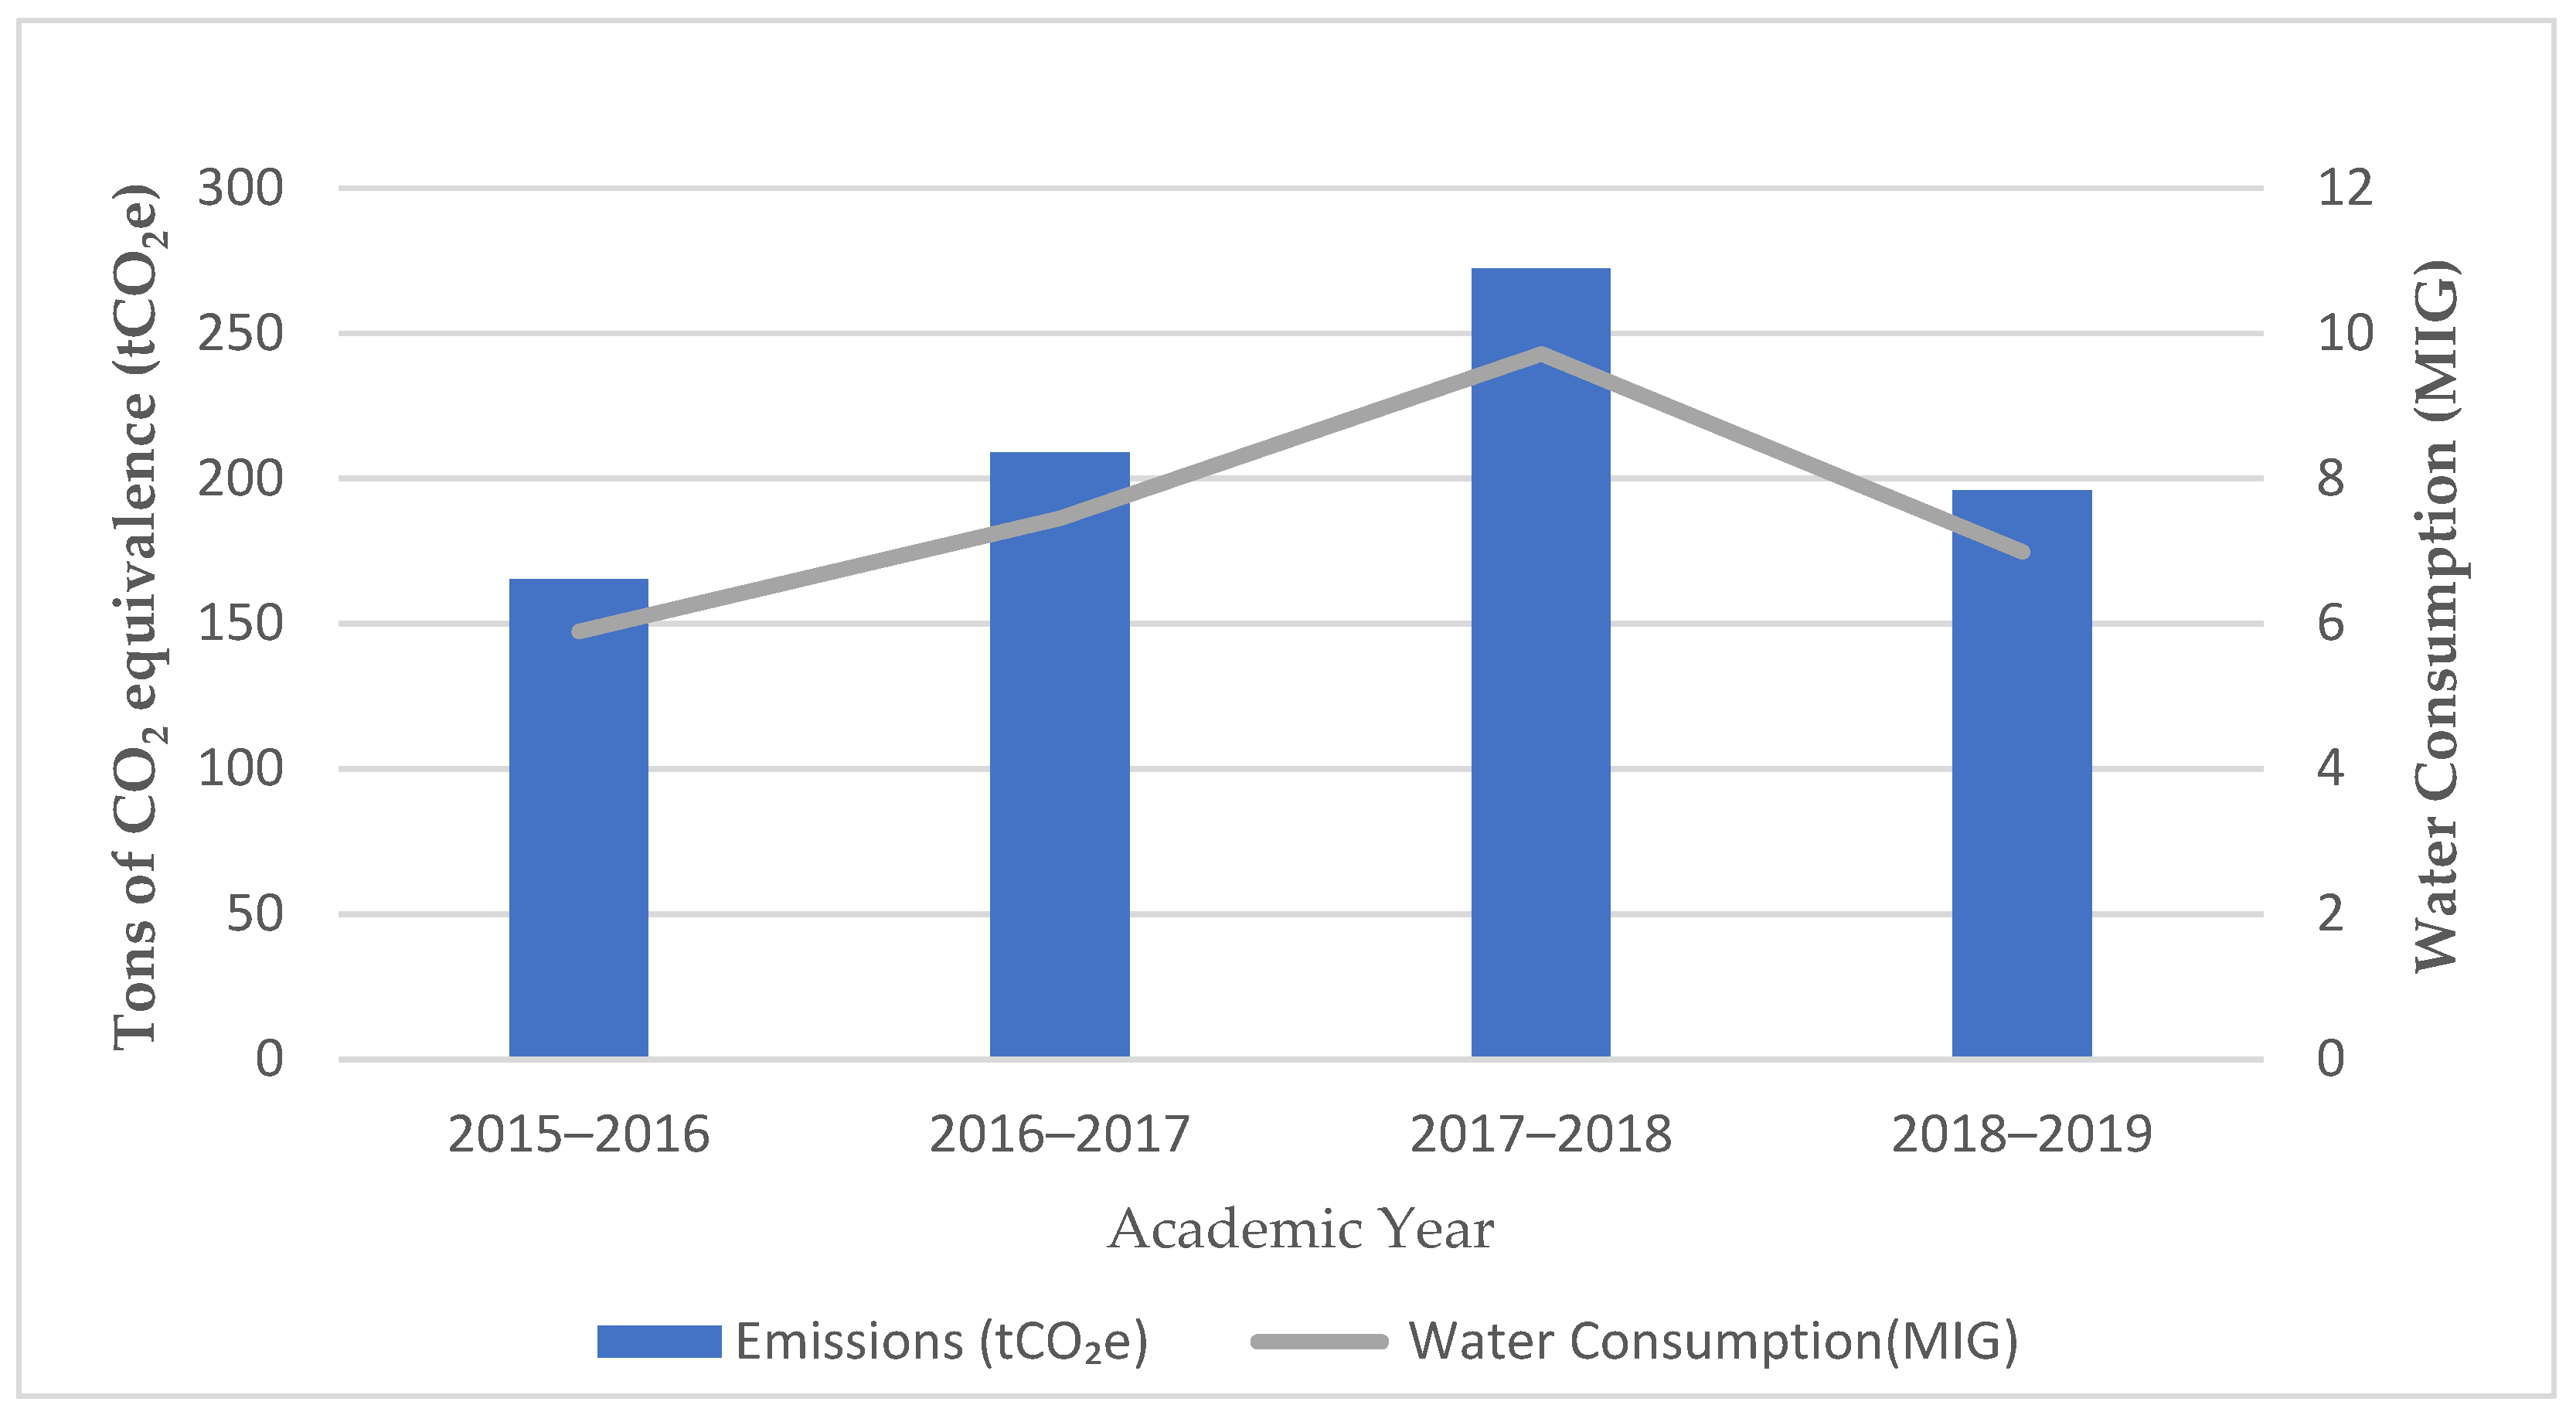
Similarly to electricity consumption data, the water consumption data for the past 4 years were collected and used to calculate CO2 emissions. Figure 5 is a representation of these results.
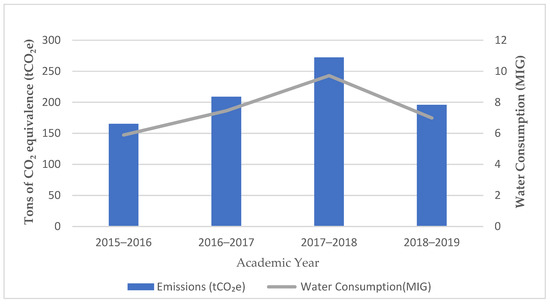
Figure 5.
Water consumption and emissions.
In the academic year 2018–2019 the annual water consumption was 6,988,414 gallons, which equated to 195.87 tCO2e (CO2 emissions) and contributed to 0.21 % of the total emissions at the AUS campus. Additionally, a decrease was visible from 2017–2018 to 2018–2019 (as was seen in the electricity consumption), which was again due to the increase of educational campaigns. The increase in water consumption in 2017–2018 was due to some irregularities in multiple meter readings in the months of October, November and December 2017. These were never rectified; hence, the sharp increase in the water consumption value.
3.3. Scope 3
3.3.1. University Commute
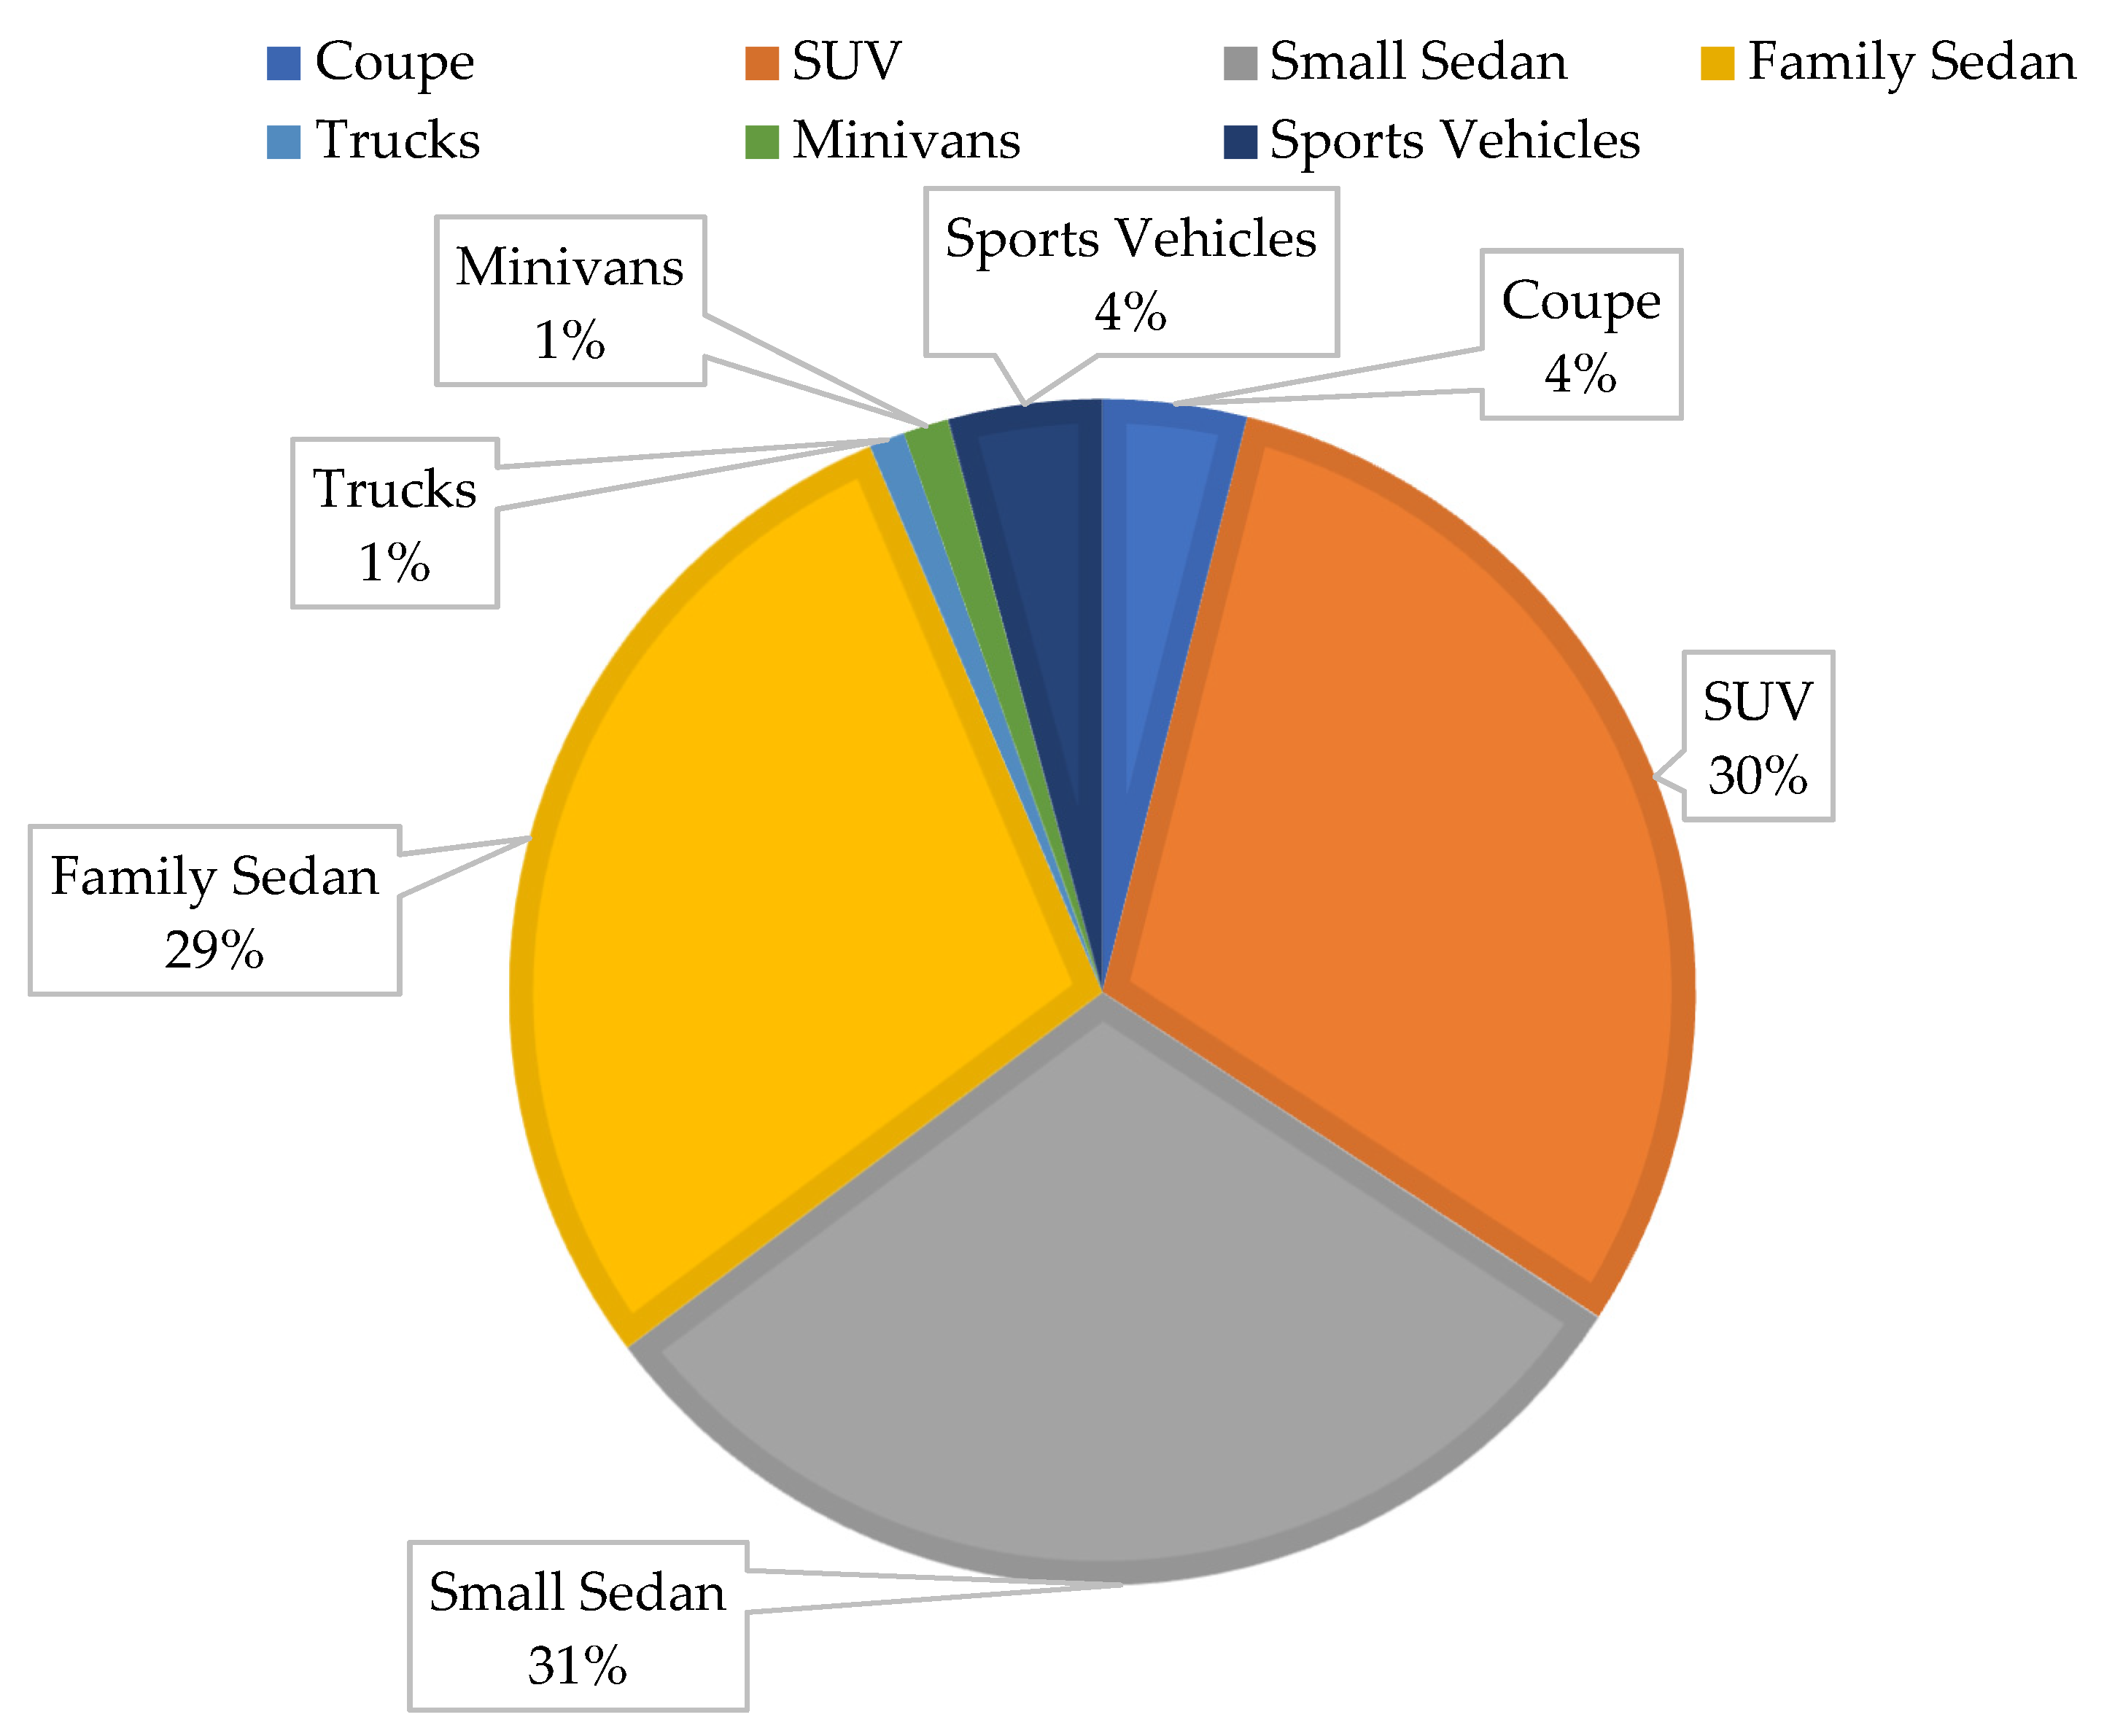
A survey was sent out to AUS students (in spring 2020), and a sample of 406 responses was received. Based on the information collected from the survey, a panoramic view on the modes of transport, total distance commuted to and from AUS, and type of vehicle driven has been obtained. The types of vehicles used by students to commute to AUS varied from coupes to SUVs, small sedans, family sedans, trucks, minivans and sports vehicles. Figure 6 gives a summary of the numbers of each type of car used by survey responders.
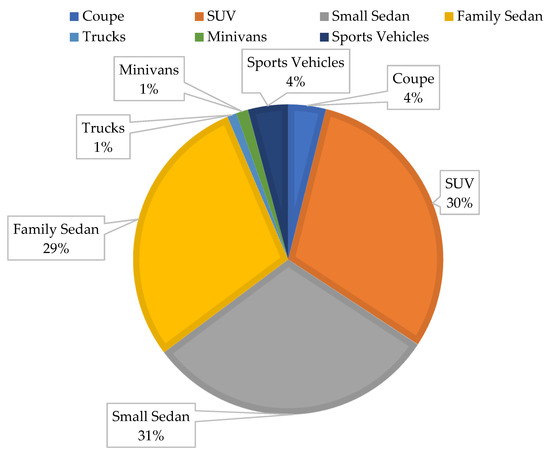
Figure 6.
Types of cars used to commute to AUS based on results of 2020 survey.
Additionally, an estimate average fuel economy was allocated towards each type of vehicle. This was used to generate total CO2 emissions. Table 1 provides an overview of the survey results.

Table 1.
Overview of survey results.
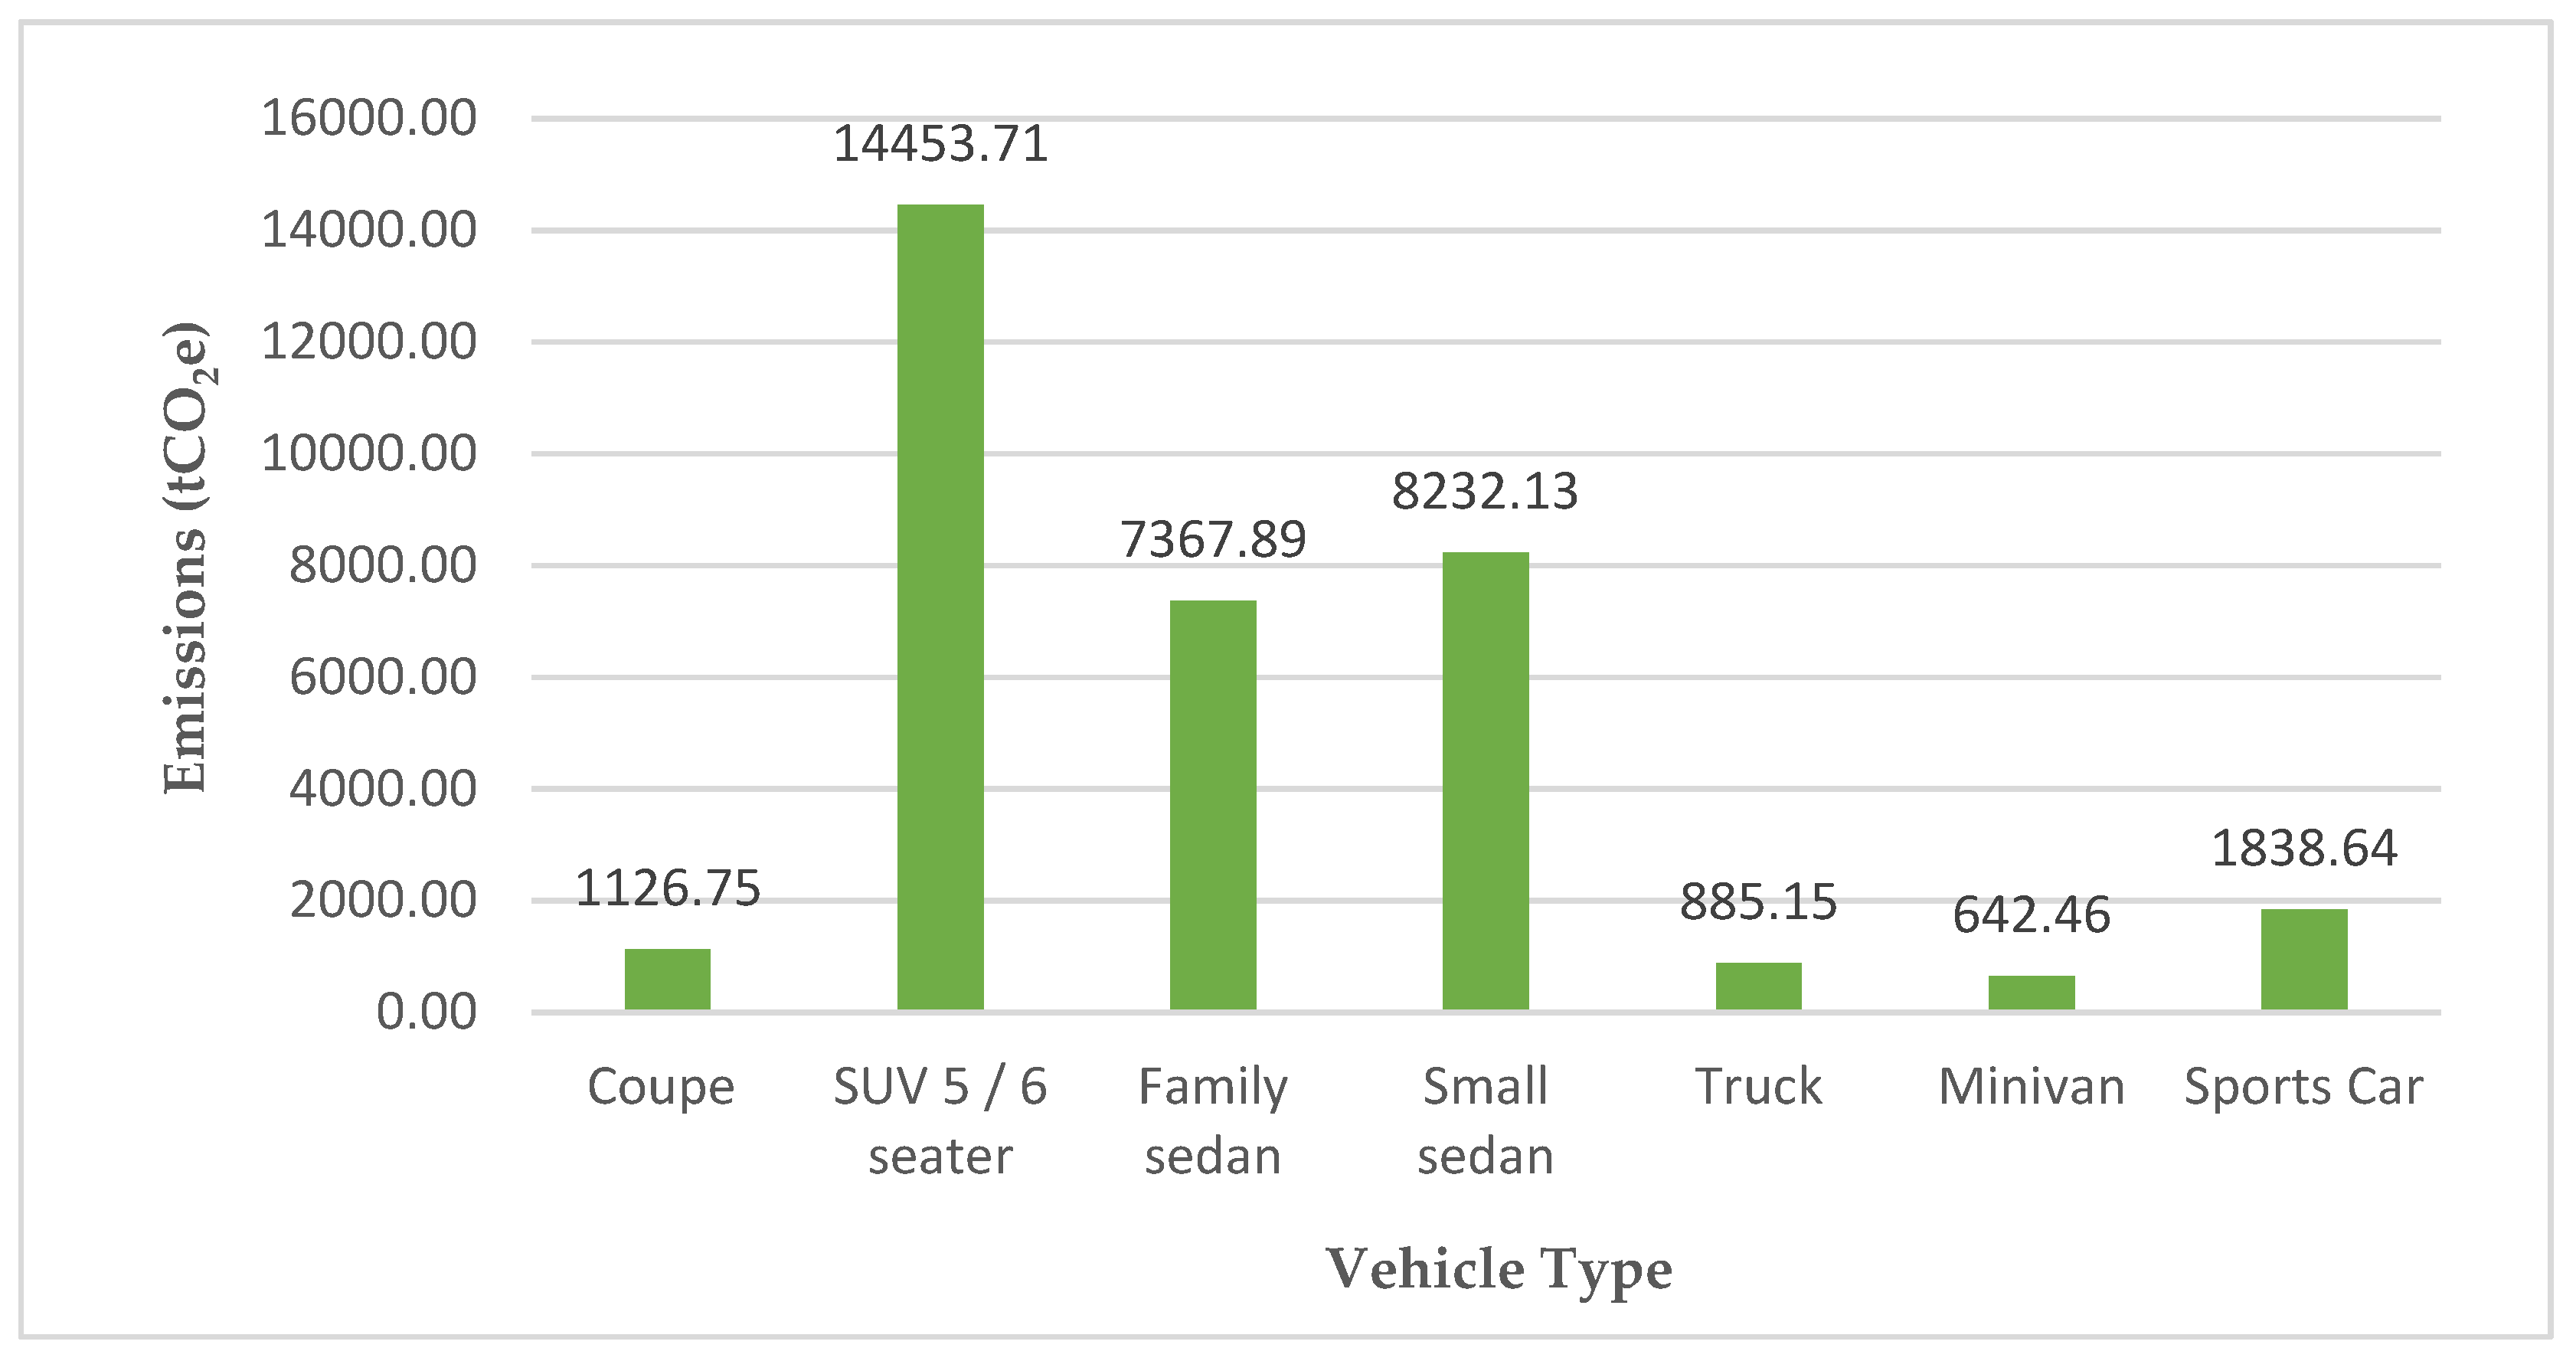
The total annual fuel consumption for the university commute was 3,853,187 gallons. This amounted to a total emission of 34,547 tCO2e (36.5% of the overall emissions at AUS). Figure 7 shows an overview of the types of vehicles as well as their CO2 emissions. SUVs contributed to the highest emissions because of commuting distances and SUVs’ high fuel consumption rate.
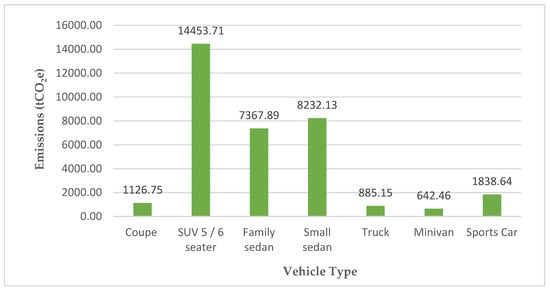
Figure 7.
Total CO2 emissions for university commute (tCO2e) for 2020.
3.3.2. Limited Business Air Travel
Over the course of the academic year 2018–2019, 900 flights were paid for by AUS through the campus travel agent. The emissions amounted to a total of 1784 tCO2e for both economy and business-class flights. This represented a total of 1.88% of the total emissions exhibited by AUS.
3.3.3. Limited Waste
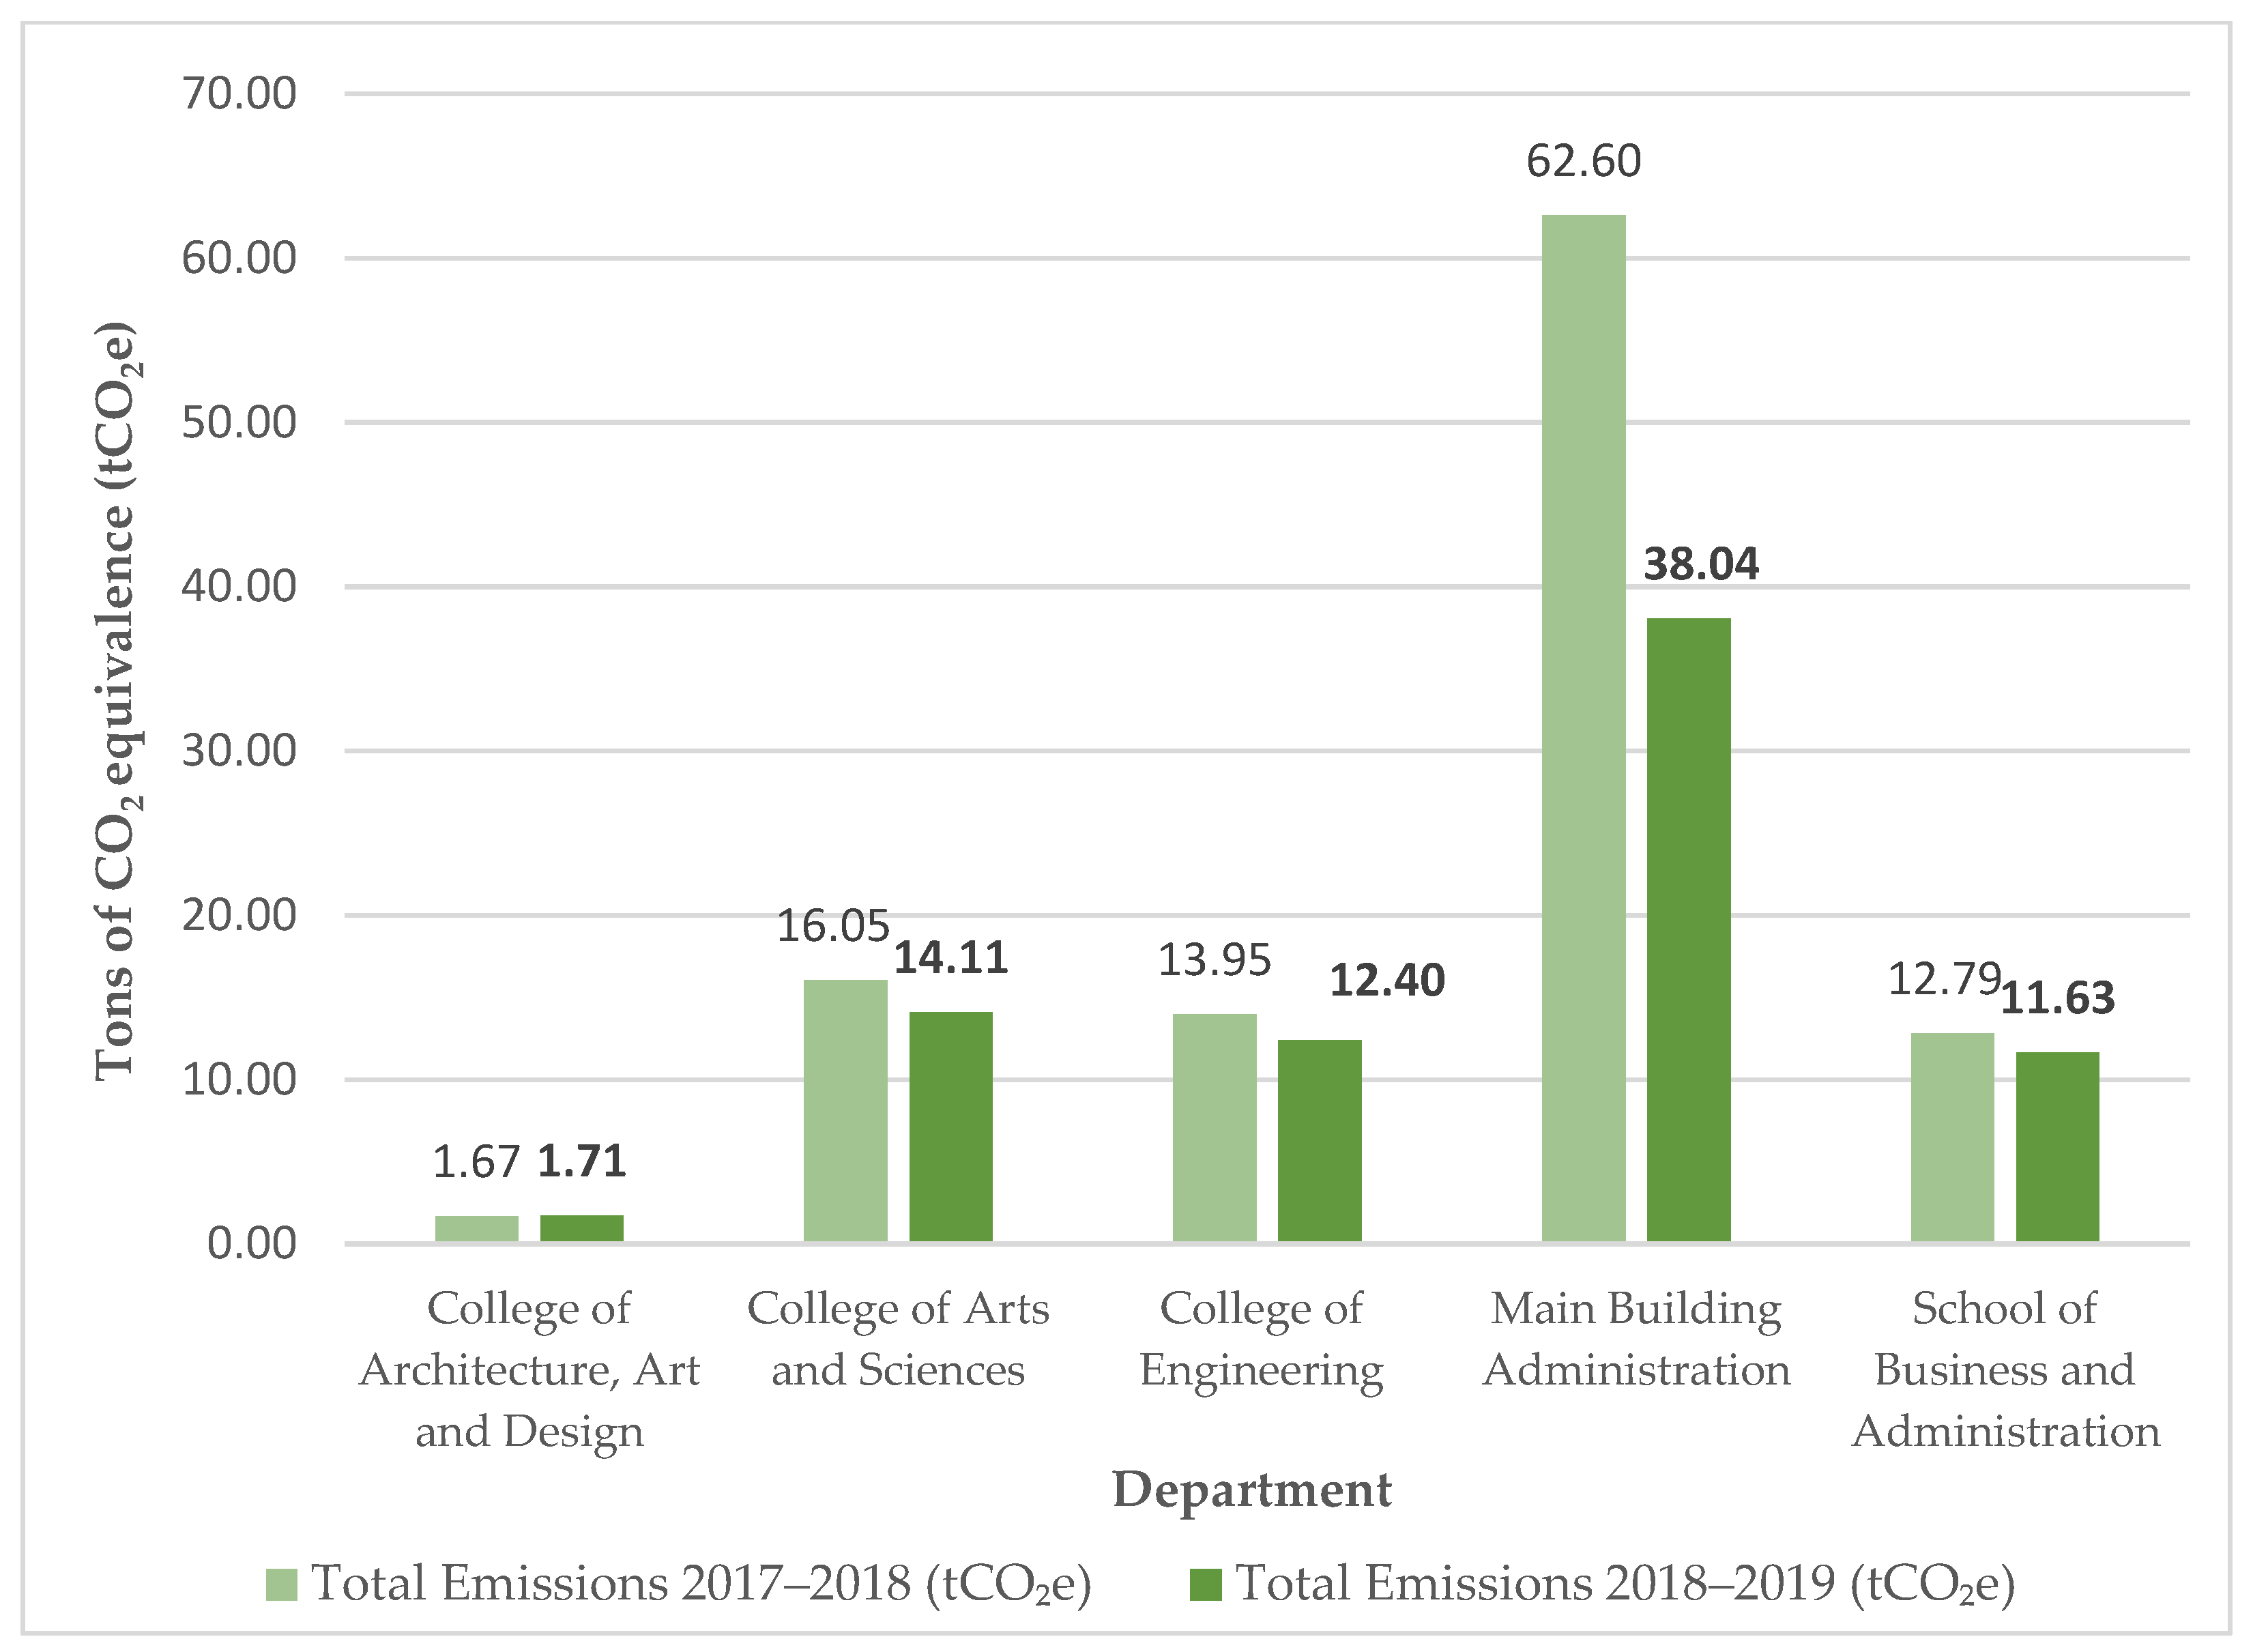
In the academic year of 2018–2019, there was total annual consumption of 25,122 kg of paper waste, which amounted to a total of 77.8 tCO2e. This was 0.08% of the total emissions. Figure 8 shows the emissions for academic years 2017–2018 and 2018–2019 across all colleges at AUS. Over the course of the 2 years, the trend shows a relative decrease in emissions, which correlates to the decrease in the use of paper. The highest consumption took place in the main building; this is most likely due to the greater concentration of administrative offices; hence, greater demand for paper. On the other hand, when observing the four colleges, the College of Arts and Science (CAS) had the highest consumption of paper in both years. Overall, a 39.2% decrease of emissions was observed. This is due to the increase in sustainable practices across campus, such as recycling of paper, which in return offset the amount of emissions.

Figure 8.
Total emissions of all paper waste of AUS departments.
3.4. Total Carbon Footprint
Table 2 provides an overall summary of the total carbon footprint at AUS for the academic year of 2018–2019.
Table 2.
Total carbon footprint at AUS for academic year 2018–2019.
4. Discussion
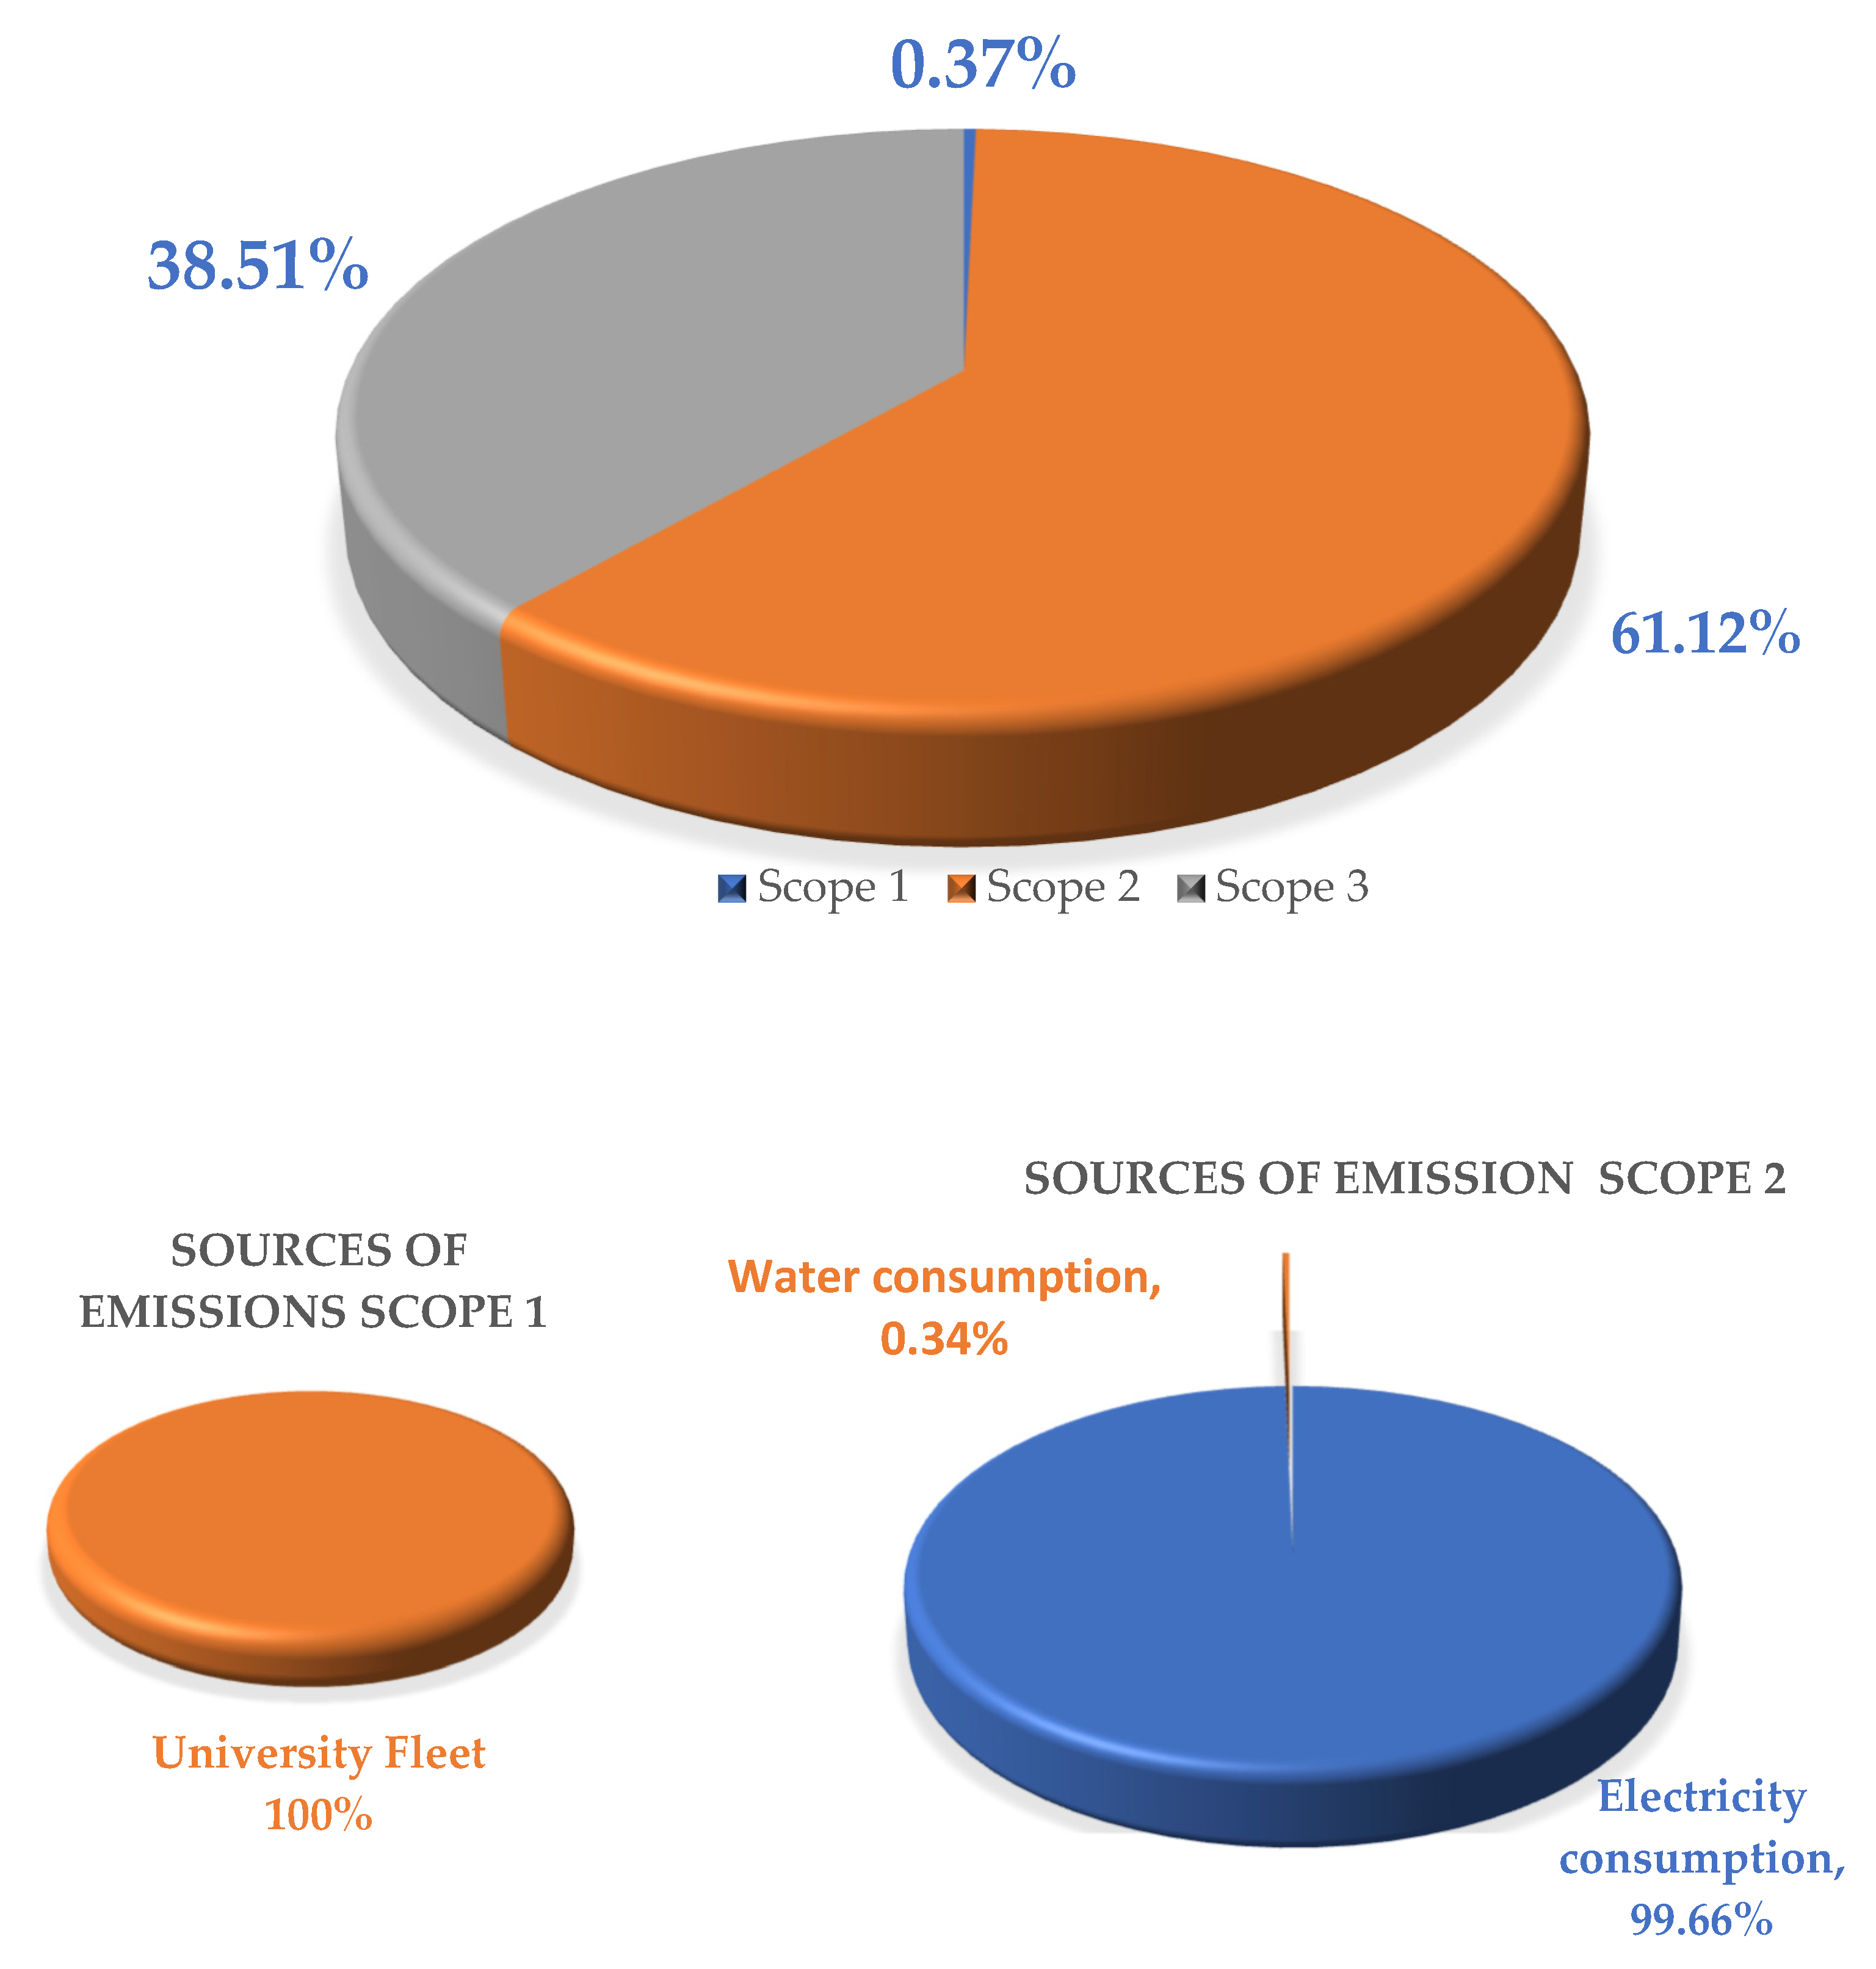
In the academic year 2018–2019 the overall CO2 emissions at AUS were 94,553.30 tCO2e and 60.91% of these emissions were from electricity consumption; thus, Scope 2 contributed to the highest emissions (61.12%). The next largest contributor was university commute (Scope 3) at 36.54%. This is seen in Figure 9.


Figure 9.
Emission contribution of scopes for the academic year 2018–2019.
Additionally, the CO2 emissions per user were 15.7 tCO2e. This is relatively lower than the value provided by the World Bank for CO2 emissions per user in the UAE in 2018, which was 20.8 tCO2e [20]. This is most likely due to the awareness being spread around the AUS campus and the initiative taken to reduce CO2 emissions.
Comparing these values to other studies in the region it is difficult because other methods are used, and because of the sizes of campuses; as well, the numbers of students and faculty staff differ. Hence, only a weighted user amount could be used for comparisons. Additionally, many of the universities only calculate specific CO2 emissions and the accessibility of the CO2 emission data for HEIs in the UAE is limited. However, this will soon change as prior to the Conference of the Parties (COP26) many universities have pledged to start to address climate action and carbon emissions. In fact, nine UAE universities recently joined the race-to-zero pledge [21]. Therefore, it is very important that AUS starts to share its work and findings with regards to CF. Based on the current literature available, the higher colleges of technology in the UAE have only reported carbon emissions for water and power consumption; hence they were not added in Table 3. In 2018, the total value was 51,931 tCO2e, which is very similar to the value obtained for AUS (57,792.1 tCO2e) [22]. Moreover, for the academic year 2019–2020 the University of Sharjah’s Scope 2 (purchasing energy) accounted for 94% of its total emissions; hence, again underlining the conclusion that Scope 2 was the highest contributor [23].
Table 3.
Carbon footprint of universities around the world.
An initial estimate of the carbon footprint in 2016 of Qassim University in Saudi Arabia was made; however, it was not included in Table 3 as it had significant data missing such as those for air travel. However, it showed similar conclusions to the study on AUS in the sense that 64% of the emissions were related to purchased electricity [24]. Table 3 looks at different studies in different regions and compares various factors to see if any correlations can be found. Most of these studies used the GHG Protocol, the minority used HLCA and EEIO.
Firstly, the QS world university rankings of the universities were assessed. It was concluded that there were some correlations between ranking and CO2 emissions but not all universities with similar rankings had the same emissions. For instance, UTalca and De Montfort had similar rankings but completely different CFs: 5472 and 51,080 tCO2e. However, what is evident is that universities with very high rankings generally had large CFs specifically those in the USA. Yale University had a ranking of 14 and emissions of 874,000 tCO2e, which is the highest recorded value in the table. Furthermore, student population seemed to also play a role. The universities with lower student populations, UTalca and UAM, had significantly lower CFs. However, AUS had a lower student population than some of the universities (universities of Cape Town and De Montfort) but still had a higher CF value in comparison to them. This is because other factors such as climate and the number of heating and cooling degree days affect energy consumption. Additionally, a university’s access to public transit also influenced CF values. AUS is on the outskirts of Sharjah, so the main forms of transportation are personal cars or buses; there are no trains or metros in that area. Moreover, another factor is the availability of different facilities; e.g., whether the campuses have laboratories or a hospital onsite. These extra facilities result in higher CFs. For example, the University of Illinois and the University of Cape Town had roughly the same student population and QS ranking but there was a significant difference in CFs. This could be because the University of Illinois has its own hospital facility on campus for its medical school as opposed to the University of Cape Town, whose medical students use a teaching hospital which is close but outside of campus; hence, it would not be included in the carbon footprint [25]. [26]
Additionally, when reviewing global CF values, you can see similar trends in some universities; with Scope 2 having the highest contribution. Examples include the University of Cambridge (in 2017, Scope 2 accounted for 52% [28,29]) and University of Cape Town (Scope 2 accounted for 81% [25,26]). However, this was not the case for all universities. For instance, the University of Illinois’s Scope 1 contributed to 64.7% of its emissions with a much lower Scope 2 contribution of 17.5% [16]. This variation is due to the assumptions made in each study as well as the unavailability of certain data when conducting the study. Another issue is that numerous universities such as Yale University are now running their own power plants, hence, shifting their energy production impacts to Scope 1 [10]. This is also the case for University of Illinois, which also generates its own electricity onsite and so it is considered a stationary combustion. Therefore, comparing scope CF emissions between universities is not always applicable and can cause a misrepresentation of data. However, what is common in all studies is that the biggest CF is the result of energy consumption in terms of electricity and heat production. In general, Europe has many low-CF universities, and the main reasons for this are infrastructure (not having air conditioning) and the availability of green energy, specifically in areas such as Germany and Switzerland [9].
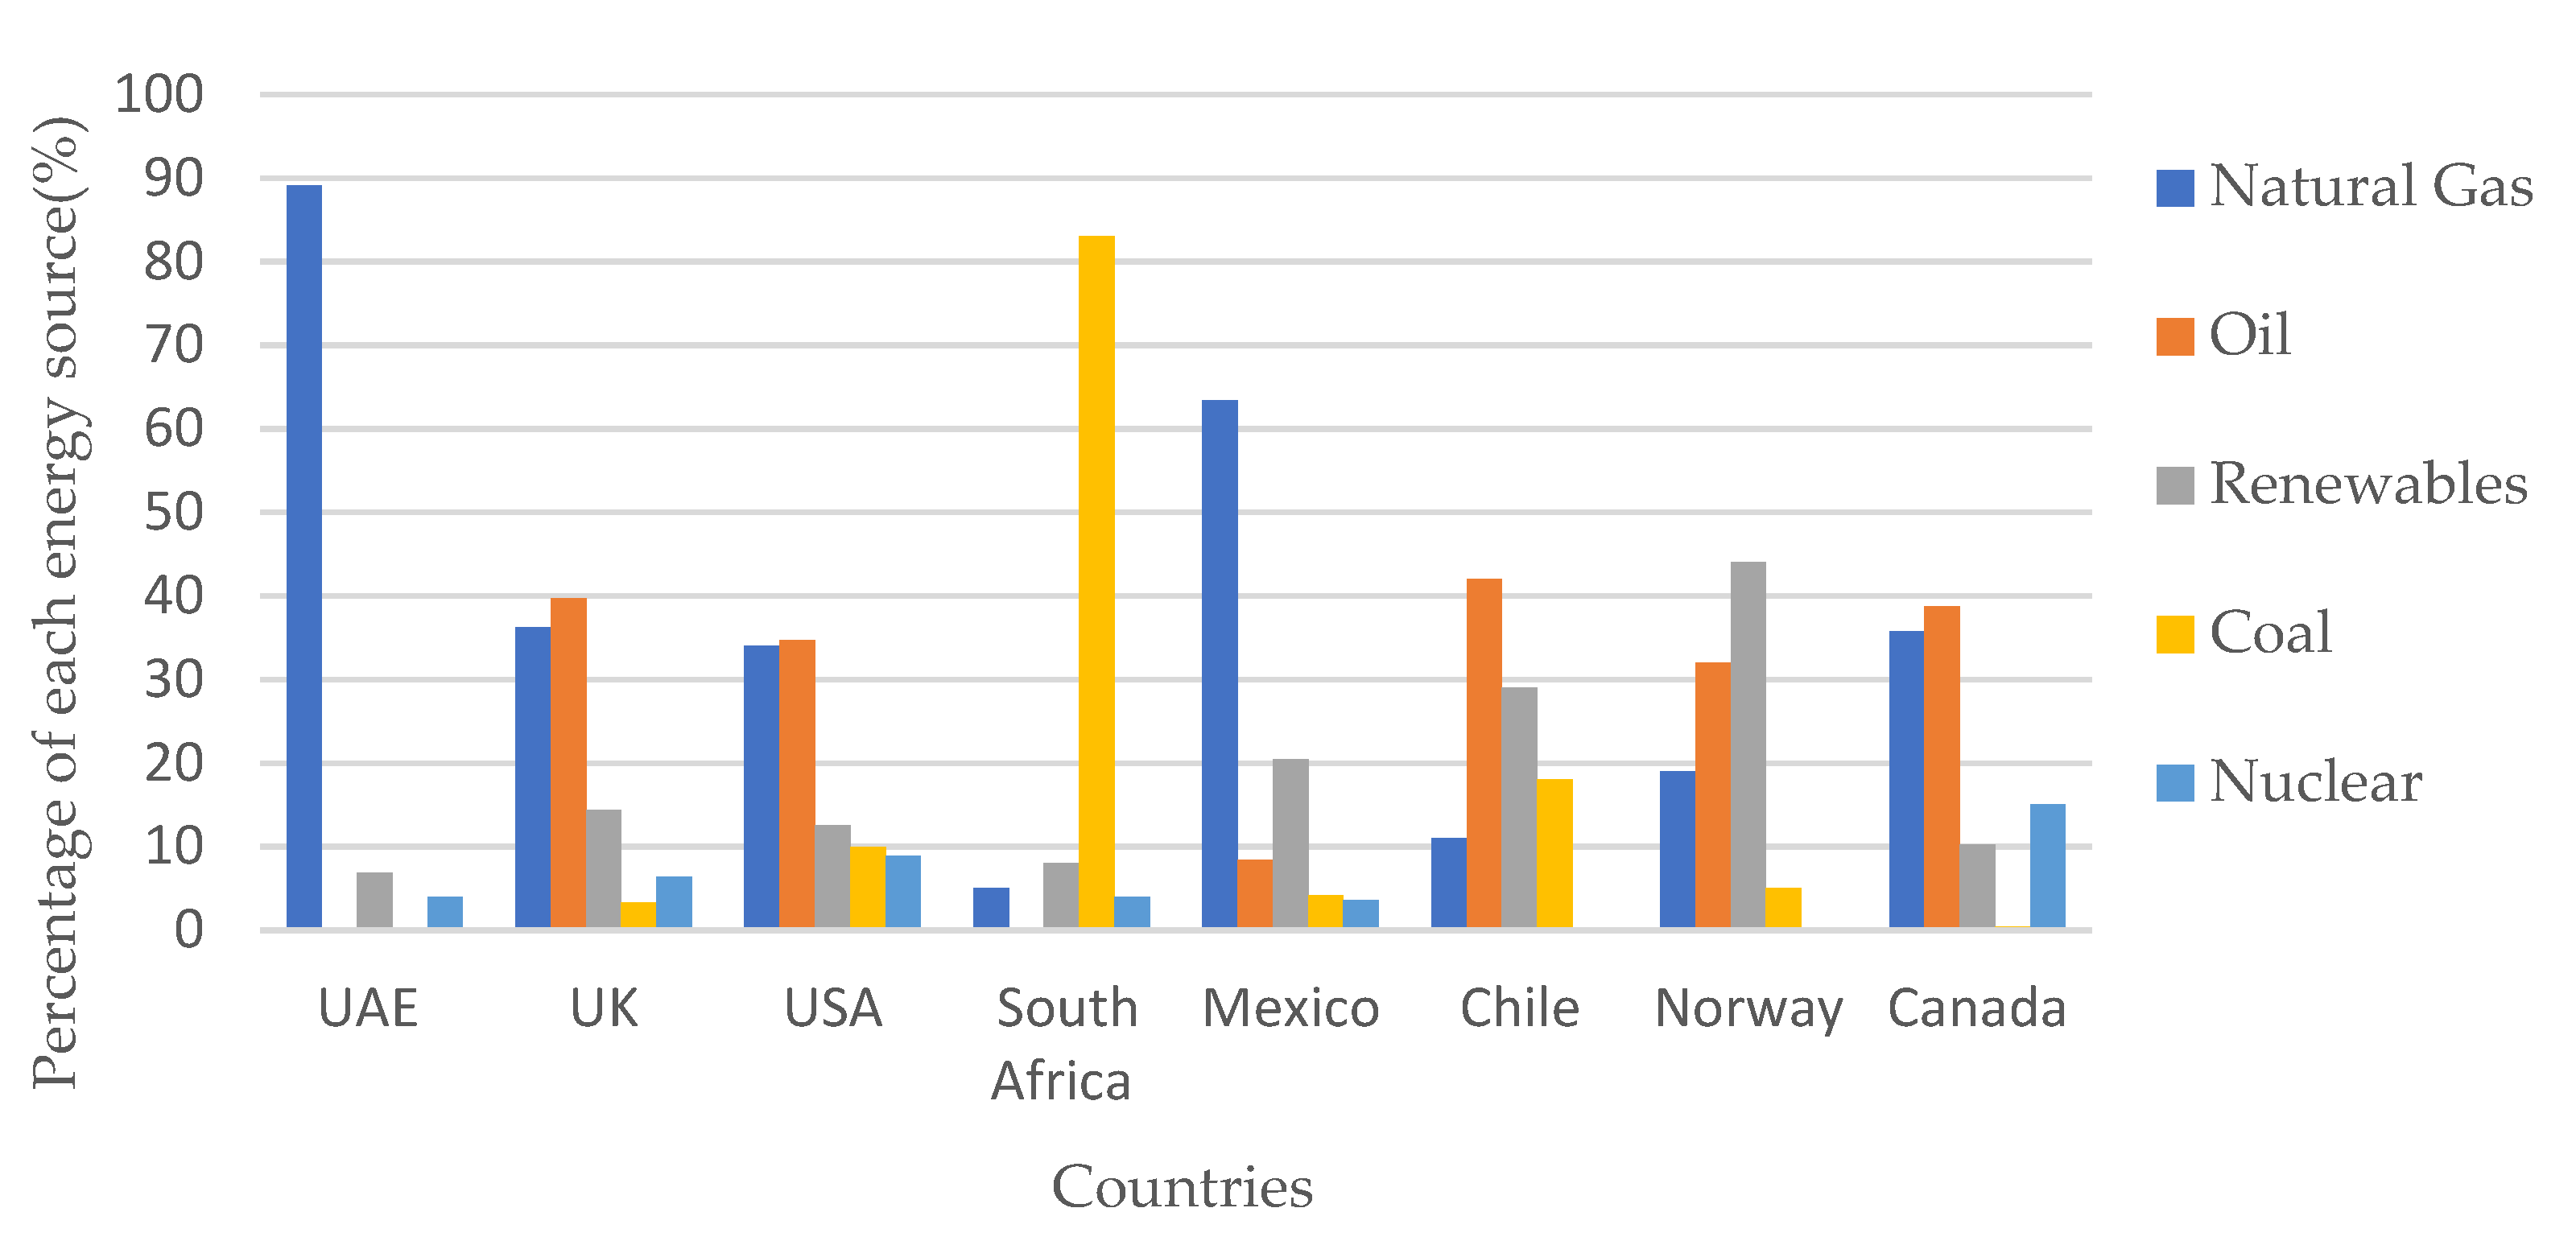
Additionally, the energy mixes of the countries associated to the universities in Table 3 were investigated to see if there were any correlations to CF. Figure 10 provides a summary of these values. The major conclusions were that Mexico, Chile and Norway had the highest percentage of renewable energy sources and their universities generally had lower CFs. NTNU Norway had a higher CF than the other two universities located in Mexico and Chile but in comparison to universities with similar ratings and population it had a lower CF. In addition to the above, the use of coal was low in all countries except South Africa (highest) and Chile. Perhaps if the University of Cape Town increased the use of renewable energy resources, it could reduce its CF further. The UAE used a very high percentages of natural gas; it was the main energy supply and was clearly the reason for the high CF. Lastly the UK, USA and Canada all relied on oil and natural gas equally and these sources were the main contributors to the energy mix. This led to the high CFs seen in Table 3.

Figure 10.
Energy mix for UAE [32], UK [33], USA [34], South Africa [35], Mexico [36], Chile [37], Norway [38] and Canada [39].
As is seen from the Table 3 results, calculating and monitoring the carbon footprint as well as pinpointing scopes with the highest emissions is crucial to reduce emissions of higher education institutions. AUS has recognized this and over the past few years it has looked at various strategies to try to reduce its overall carbon footprint. A key target was to reduce the reliance on purchased energy (almost exclusively from natural gas) on campus. Most of the impact from this work has been through new construction and renovation standards. The university has installed building management systems (BMS) to monitor energy usage and to implement smart controls based on usage patterns and seasonal needs. The university has also improved the building envelope wherever possible, through higher levels of insulation, better windows and doors, and applying sun control film to windows. AUS has also replaced thousands of light fittings both indoors and outdoors through the LED upgrade initiative. Additionally, an adiabatic cooling system was installed in the library for increased chiller efficiency. Lastly, numerous water heaters in both the student residence halls and the academic buildings have been converted to solar heaters, eliminating their draw on the purchased electricity supply.
Moreover, one of the most successful initiatives, which was implemented in January 2020, is the single-use plastic ban which aims to reduce the use of plastic around campus. This initiative has enabled vendors and external departments to limit the use of plastic cups and bottles as well as eliminate the use of plastic bags at AUS’s convenience stores. Additionally, the sustainability office has facilitated a vending machine in the AUS’s student center, where students and faculty members can purchase a reusable cup, and water bottles (which are available in different sizes and colors). This research paper does not include emissions from the use of plastic-based products such as water cooler bottles as the emission factors were not available; however, it is known that these 5 L cooler bottles contribute to CO2 emissions. Therefore, AUS has begun investigating the use of atmospheric water coolers/generators (AWGs) which create drinking water from the air’s humidity through a condensing process.
This paper has identified that most emissions (61%) are a result of Scope 2, which comprises electricity and water consumption emissions. Thus, this should be AUS’s focus and strategies to reduce these emissions are required. Below is a list of possible solutions:
- The use of light and water motion sensors. These should be embedded across all units on campus to ensure that water and electricity sources are used efficiently and only when needed.
- The reuse of water (water waste) is essential when discussing the reduction of water consumption. For instance, it can be observed that around campus a large portion of water bottles are discarded half full. The water left in bottles should be recovered for use elsewhere. This could be resolved by setting up stations in specific areas (perhaps in commonly taken routes between academic buildings) where students can dispose of these bottles. This leftover water can then be used for irrigation, or other non-consumptive uses. This would be accompanied by public service announcements (PSAs) letting students know of the station’s location and purpose.
- Continually reassessing current technologies for drinking water and whether they can be applied to AUS. These include:
- Filtration systems on tap water sources;
- RO systems for tap water drinking fountains;
- Condensation technologies to harness humidity such as the atmospheric water coolers discussed above;
- AUS currently has the International Organization for Standardization 14001 (ISO 14001) energy management system which looks at resource use, waste management and pollution. It should perhaps also investigate obtaining ISO 50001 which is more focused on energy performance indicators. By having both standards, CO2 emissions can be reduced further as all aspects can be considered;
- AUS should also consider carbon offsetting as numerous universities have applied this concept and achieved carbon neutrality. Examples include: the university of Luneburg Germany, which reached carbon neutrality in 2014 (due to offsetting emissions from business trips, electricity and paper consumption). Another example is the University of San Francisco, USA which became carbon neutral in 2019 [40]. AUS should quantitatively study how its land can be used to offset emissions; for instance, planting more trees around campus.
- AUS should investigate switching to renewable energy sources such as solar panels (it has already converted some of the heaters at AUS to solar heaters, but this should be expanded further). Charles Sturt, an Australian university, became carbon neutral in 2016 after adopting rooftop solar, energy efficiency upgrades in buildings and applying sustainable building principles [40].
Furthermore, one of the most effective forms of reducing carbon emissions is educational campaigns, informative lectures, sustainability training programs and workshops around campus. These should aim to educate students and faculty on how to reduce their annual consumption of utilities such as electricity, water and paper. A recent study showed that students who took a year-long course on individual carbon emissions were able to reduce their carbon emissions by 2.86 tons of CO2 per year in five years [41] (p. 1). AUS has already taken this step and has hosted many awareness programs but perhaps the content and style of these presentations should be reassessed. Are they effective enough and are they framing the issue correctly? Is the Americanized education system enough of an influencer on the rather conservative culture at AUS? Or do the underlying communal themes in culture still play a larger part in defining subjective norms? This should be kept in mind when deciding whether to utilize negative or positive “framing” in the creation of context where recycling and reuse are valued [42]. AUS should also reassess if the existing services to reduce emissions are being utilized correctly. For instance, are the current recycling stations located in areas that typically have outlets and large congregations of students in peak hours during breaks? If not, increasing the availability of these stations in these areas is necessary to encourage students and staff to use them.
However, all the above suggestions are useless if the current emissions cannot be accounted for. As is clearly seen in the report, a lot of the data are insufficient to gain a complete picture of carbon emissions and their sources. Emission factors from all entities responsible for providing a service or product to AUS are necessary. Additionally, AUS does not have an equity share or financial control over much of its supply chain. Moreover, corporations usually use the supply chain when defining their Scope 3 boundaries as they are difficult to calculate and are inherently double counted emissions (AUS’s Scope 3 emissions are someone else’s Scope 1 and Scope 2 emissions). Therefore, addressing AUS’s Scope 3 emissions through active procurement policies, standards and practices are where AUS can signal to its local and international supply chain that it is interested in reducing its climate impact. A factor in AUS’s decision-making process for supply chain is based on its vendors’ ecological impacts/practices.
Based on the points discussed above, the researchers recommend the following:
- Utility providers should provide their respective emission factors for their utility production;
- Further discussion with municipal waste providers to assess and analyze the amount of waste generated by AUS (the amounts that are disposed to landfills and those which are recycled);
- Any contractual services with a vendor that could contribute to GHG emissions should contain a clause requiring monthly reporting of the amount of gases or resources used, such as refrigerants. Further discussions with plastic water-bottle vendors are needed to ensure that they provide the emission factors to produce water bottles which are supplied to AUS campus.
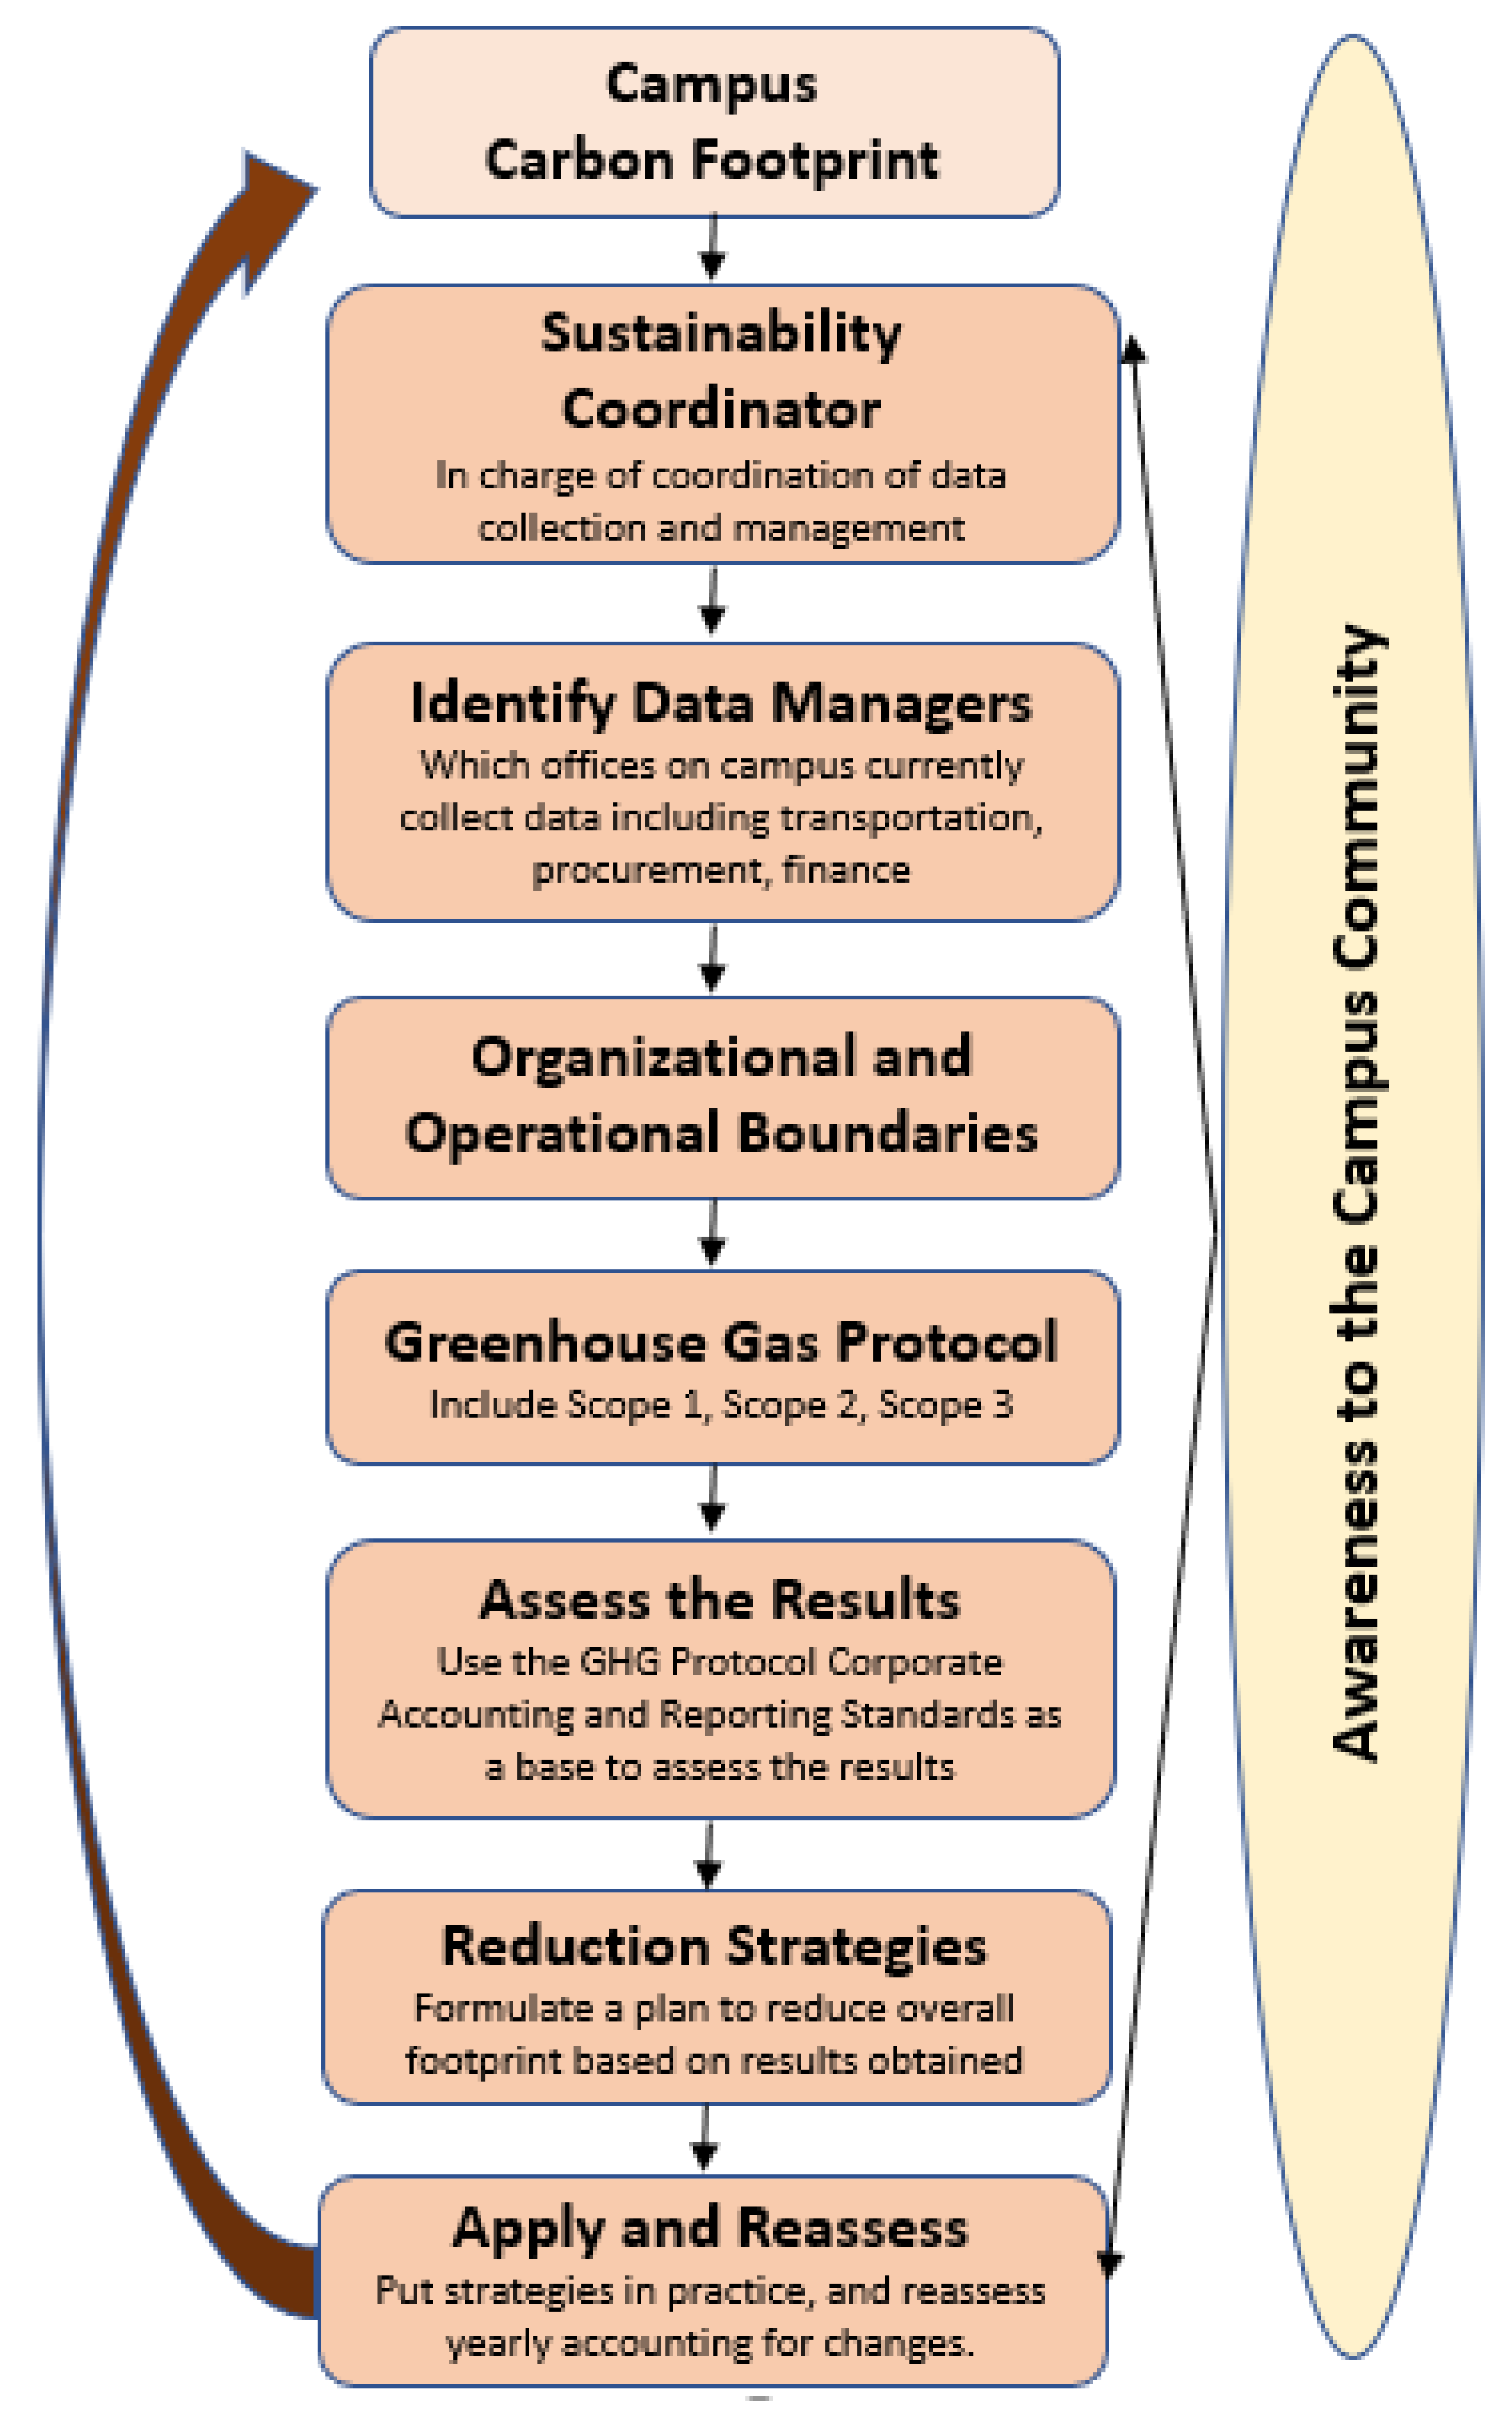
To facilitate the application of this work for other institutions, we have created a framework which includes the main steps discussed in this paper. Previous planning can provide ease of access to data that as we mentioned are not easy to obtain in many instances. Figure 11 provides a framework which will serve as a protocol to be followed by local and international institutions trying to assess and reduce their overall footprint. As shown in Figure 11, the most important aspect is to appoint a sustainability coordinator, who will be in charge of identifying all the offices in charge of providing data as well as ensuring that any third parties can provide required data ahead of time. Additionally, the sustainability coordinator will identify organizational and operational boundaries to determine accountability. Once all the data are accessible, as shown in Figure 2, scopes can be estimated and a tool for carbon footprint estimation applied (in this case the GHG Protocol Corporate Accounting and Reporting Standards was used to assess the results). Finally, based on the obtained results, reduction strategies can be devised and applied, and reassessed to account for reductions. As an important component, awareness must be present of all components of the framework so as to allow the community which includes faculty, staff and students to contribute to the efforts of reduction and data sharing to facilitate the process.
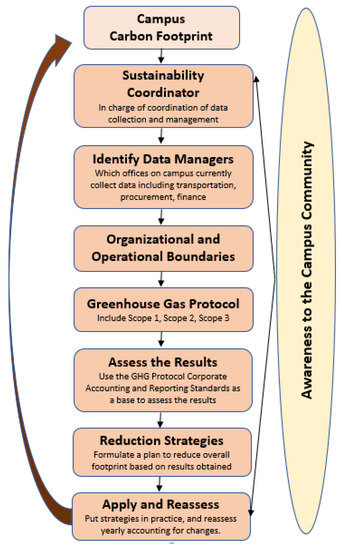
Figure 11.
Framework for applying the concept of carbon footprint assessment on a university campus.
5. Conclusions
We present the efforts of a university campus in the United Arab Emirates to track its campus carbon footprints and devise possible strategies for reductions. Scope 2, which accounts for electricity and water consumption, was reported to be the highest contributor to the carbon footprint in this specific case. The results of this study also suggest that data collection is one of the biggest challenges in the process and that emission factors should be always shared by service providers to facilitate the process. In addition, awareness through sustainability and other training programs plays a major role in involving all offices, faculty and students in a community in efforts to adhere to the most sustainable practices, which can lead to reductions in its carbon footprint. Finally, a framework was stablished that can be followed by other institution to successfully take accountability for actions and find solutions.
Author Contributions
Conceptualization, F.S., M.E.Y. and R.A.; methodology, M.E.Y.; validation, F.S., M.E.Y. and R.A.; formal analysis, M.E.Y.; investigation, S.I.; resources, R.A.; writing—original draft preparation, M.E.Y. and S.I.; writing—review and editing, F.S., S.I., R.A. and M.E.Y.; supervision, F.S. and R.A.; funding acquisition, F.S. All authors have read and agreed to the published version of the manuscript.
Funding
This research received no external funding.
Institutional Review Board Statement
The study was approved by the Institutional Review Board of the American University of Sharjah (IRB 18-454 and IRB 19-486).
Informed Consent Statement
Informed consent was obtained from all subjects involved in the study.
Acknowledgments
The authors of this paper would like to acknowledge the American University of Sharjah for its support in this project. The work in this paper was supported, in part, by the Open Access Program from the American University of Sharjah. This paper represents the opinions of the author(s) and does not mean to represent the position or opinions of the American University of Sharjah. A special thanks to Farida Qtaishat for all her help and contributions in the calculations.
Conflicts of Interest
The authors declare no conflict of interest.
References
- Güereca, L.; Torres, N.; Noyola, A. Carbon Footprint as a basis for a cleaner research institute in Mexico. J. Clean. Prod. 2013, 47, 396–403. [Google Scholar] [CrossRef]
- Wiedmann, T.; Minx, J. A definition of ‘carbon footprint’. In Ecological Economics Research Trends; Pertsova, C.C., Ed.; Nova Science Publishers: New York, NY, USA, 2008; Volume 2, pp. 55–65. [Google Scholar]
- Weidema, B.P.; Thrane, M.; Christensen, P.; Schmidt, J.; Løkke, S. Carbon footprint—A catalyst for life cycle assessment? J. Ind. Ecol. 2008, 12, 3–6. [Google Scholar] [CrossRef]
- Alvarez, S.; Blanquer, M.; Rubio, A. Carbon footprint using the compound method based on financial accounts. The case of the School of Forestry Engineering, Technical University of Madrid. J. Clean. Prod. 2014, 66, 224–232. [Google Scholar] [CrossRef]
- The Intergovernmental Panel on Climate Change. AR4 Climate Change 2007: Synthesis Report. Available online: www.ipcc.ch/report/ar4/syr/ (accessed on 9 March 2020).
- Li, X.; Tan, H.; Rackes, A. Carbon footprint analysis of student behavior for a sustainable university campus in China. J. Clean. Prod. 2015, 106, 97–108. [Google Scholar] [CrossRef]
- Adenle, Y.A.; Alshuwaikhat, H.M. Spatial Estimation and Visualization of CO2 Emissions for Campus Sustainability: The Case of King Abdullah University of Science and Technology (KAUST), Saudi Arabia. Sustainability 2017, 9, 2124. [Google Scholar] [CrossRef] [Green Version]
- Yanez, P.P.; Sinha, A.; Vásquez, M. Carbon Footprint Estimation in a University Campus: Evaluation and Insights. Sustainability 2019, 12, 181. [Google Scholar] [CrossRef] [Green Version]
- Helmers, E.; Chang, C.C.; Dauwels, J. Carbon footprinting of universities worldwide: Part I—objective comparison by standardized metrics. Environ. Sci. Eur. 2021, 33, 30. [Google Scholar] [CrossRef]
- Grindsted, T. Sustainable Universities—From Declarations on Sustainability in Higher Education to National Law. Environ. Econ. 2011, 2, 27–34. [Google Scholar] [CrossRef] [Green Version]
- STARS. STARS Participants & Reports. Available online: https://reports.aashe.org/institutions/participants-and-reports/?sort=rating (accessed on 24 October 2021).
- Larsen, H.N.; Pettersen, J.; Solli, C.; Hertwich, E.G. Investigating the Carbon Footprint of a University-The case of NTNU. J. Clean. Prod. 2013, 48, 39–47. [Google Scholar] [CrossRef]
- STARS. American University of Sharjah OP-1: Greenhouse Gas Emissions. Available online: https://reports.aashe.org/institutions/3388/report/2018-09-16/OP/air-climate/OP-1/ (accessed on 9 March 2020).
- World Business Council for Sustainable Development (WBCSD) & World Resources Institute (WRI). The Greenhouse Protocol—A Corporate Accounting and Reporting Standard. Available online: www.ghgprotocol.org (accessed on 9 March 2020).
- Thurston, M.; Eckelman, M.J. Assessing greenhouse gas emissions from university purchases. Int. J. Sustain. High. 2011, 12, 225–235. [Google Scholar] [CrossRef]
- Klein-Banai, C.; Theis, T.L.; Brecheisen, T.A.; Banai, A. A greenhouse gas inventory as a measure of sustainability for an urban public research university. Environ. Pract. 2010, 12, 35–47. [Google Scholar] [CrossRef]
- Intergovernmental Panel on Climate Change. 2006 IPCC Guidelines for National Greenhouse Gas Inventories. Available online: www.ipcc-nggip.iges.or.jp (accessed on 9 March 2020).
- United Nations Development Programme Country: United Arab Emirates Project Document. Available online: http://www.undp.org/content/dam/undp/documents/projects/ARE/PD%20UAEU%20%20UNDP.pdf (accessed on 9 March 2020).
- U.S. Environmental Protection Agency Office of Resource Conservation and Recovery. Documentation for Greenhouse Gas Emission and Energy Factors Used in the Waste Reduction Model (WARM). Available online: Chrome-extension://efaidnbmnnnibpcajpcglclefindmkaj/viewer.html?pdfurl=https%3A%2F%2Farchive.epa.gov%2Fepawaste%2Fconserve%2Ftools%2Fwarm%2Fpdfs%2FWARM_Documentation.pdf&clen=13140723&chunk=true (accessed on 9 March 2020).
- The World Bank. CO2 Emissions (Metric Tons per Capita)-United Arab Emirates. Available online: www.data.worldbank.org/indicator/EN.ATM.CO2E.PC?locations=AE (accessed on 14 January 2022).
- Race to Zero Universities and Colleges. Current Signatures. Available online: www.educationracetozero.org/current-signatories (accessed on 26 January 2022).
- Higher Colleges of Technology. HCT Carbon Neutral Plan Implemented by 2030. Available online: Chrome-extension://efaidnbmnnnibpcajpcglclefindmkaj/viewer.html?pdfurl=https%3A%2F%2Fhct.ac.ae%2Fwp-content%2Fuploads%2F2020%2F10%2FHCT_carbon_neutral_plan_Oct28.pdf&clen=1452805&chunk=true (accessed on 13 September 2021).
- STARS. University of Sharjah OP-1: Emissions Inventory and Disclosure. Available online: https://reports.aashe.org/institutions/university-of-sharjah-/report/2021-05-09/OP/air-climate/OP-1/ (accessed on 13 September 2021).
- Almufadi, F.A.; Irfan, M. Initial Estimate of Carbon Footprint of Qassim. Int. J. Appl. Eng. Res. 2016, 11, 8511–8514. [Google Scholar]
- QS Top Universities. QS World University Rankings 2020. Available online: www.topuniversities.com/university-rankings/world-university-rankings/2022 (accessed on 8 January 2022).
- Townsend, J.; Barrett, J. Exploring the applications of carbon foot printing towards sustainability at a UK university: Reporting and decision making. J. Clean. Prod. 2015, 107, 164–176. [Google Scholar] [CrossRef]
- Letete, T.; Mungwe, N.W.; Guma, M.; Marquard, A. Carbon footprint of the University of Cape Town. J. Energy S. Afr. 2011, 22, 2–12. [Google Scholar] [CrossRef] [Green Version]
- Mendoza-Flores, R.; Quintero-Ramírez, R.; Ortiz, I. The carbon footprint of a public university campus in Mexico City. Carbon. Manag. 2019, 10, 501–511. [Google Scholar] [CrossRef]
- Ozawa-Meida, L.; Brockway, P.; Letten, K.; Davies, J.; Fleming, P. Measuring carbon performance in a UK University through a consumption-based carbon footprint: De Montfort University case study. J. Clean. Prod. 2013, 56, 185–198. [Google Scholar] [CrossRef]
- University of Cambridge. Environmental Sustainability Report 2017. Available online: www.environment.admin.cam.ac.uk/files/uoc_environment_and_sustainability_report_2017.pdf (accessed on 24 October 2021).
- University of Alberta. Greenhouse Gas Emissions Inventory 2005–2006 Baseline and 2012–2013 Report. Available online: www.ualberta.ca/facilities-operations/media-library/ualberta/vice-president-facilities-and-operations/documents/emso/ua-ghg-inventory-baseline-to-2012-13.pdf (accessed on 24 October 2021).
- Arab Petroleum Investments Corporation. MENA Power Investment Outlook 2020–2024 between Fighting a Pandemic and Managing Renewables. Available online: www.apicorp.org/media-centre/publications/ (accessed on 10 January 2022).
- Statista. The UK’s Energy Mix. Available online: www.statista.com/chart/23544/uk-energy-mix/ (accessed on 10 January 2022).
- Center of Sustainable Systems. U.S. Renewable Energy Factsheet. Available online: css.umich.edu/factsheets/us-renewable-energy-factsheet (accessed on 10 January 2022).
- REN21.Cape Town. Available online: www.ren21.net/cities-2021/cities/capetown/capetown/#:~:text=Coal%20contributed%2083%25%20of%20South,making%20up%20the%20remaining%208%25 (accessed on 10 January 2022).
- International Energy Agency. Electricity Generation Mix in Mexico, 1 January–30 September 2019 and 2020. Available online: www.iea.org/data-and-statistics/charts/electricity-generation-mix-in-mexico-1-jan-30-sep-2019-and-2020 (accessed on 10 January 2022).
- International Renewable Energy Agency. Energy Profile Chile. Available online: www.irena.org/IRENADocuments/Statistical_Profiles/South%20America/Chile_South%20America_RE_SP.pdf (accessed on 10 January 2022).
- International Renewable Energy Agency. Energy Profile Norway. Available online: www.irena.org/irenadocuments/statistical_profiles/europe/norway_europe_re_sp.pdf (accessed on 10 January 2022).
- The Canadian Association of Petroleum Producers. Canada’s Energy Mix. Available online: www.capp.ca/energy/canadas-energy-mix/ (accessed on 10 January 2022).
- Mustafa, A.; Kazmi, M.; Khan, H.R.; Qazi, S.A.; Lodi, S.H. Towards a Carbon Neutral and Sustainable Campus: Case Study of NED University of Engineering and Technology. Sustainability 2022, 14, 794. [Google Scholar] [CrossRef]
- Cordero, E.C.; Centeno, D.; Todd, A.M. The role of climate change education on individual lifetime carbon emissions. PLoS ONE 2020, 15, e0206266. [Google Scholar] [CrossRef] [PubMed] [Green Version]
- Ertz, M.; Huang, R.; Karakas, F.; Serigöllü, E. From single use to multi use: Study of consumer’s behavior toward consumption of reusable containers. J. Environ. Manag. 2017, 193, 334–344. [Google Scholar] [CrossRef] [PubMed] [Green Version]

Publisher’s Note: MDPI stays neutral with regard to jurisdictional claims in published maps and institutional affiliations. |
© 2022 by the authors. Licensee MDPI, Basel, Switzerland. This article is an open access article distributed under the terms and conditions of the Creative Commons Attribution (CC BY) license (https://creativecommons.org/licenses/by/4.0/).