1. Introduction
Solar energy is the cleanest renewable energy and is available abundantly compared to other types of renewable energy resources. Recent advancements in cost reduction and efficiency have made solar energy economically competitive with traditional energy resources.
Nowadays, solar energy use is rapidly expanding, and it plays an increasingly important role in power-generation technology. It is important that solar energy be harnessed in an efficient and cost-effective manner. Known methods that can improve efficiency include using solar concentrators, cleaning solar panels, preventing temperature increase, avoiding shaded areas, and installing the correct type of photovoltaic panels. These methods of increasing the efficiency of solar panels fall under the classification of modifying the external geometry [
1,
2].
In recent research [
1], a newly proposed method with experimental investigation was applied to increase the efficiency of photovoltaic panels by installing different pyramidal shapes of transparent polyethylene materials. These methods are classified mainly under the modification of panel construction in order to enhance the incident rays, especially those rays parallel to the solar panels. The numerical investigation of incident radiation and electrical characteristics of using this method of pyramidal shapes must first be simulated based on the concept of partial differential equation (PDE) discretization using the finite volume method.
Different simulation methods can be performed on solar panels in order to obtain the best efficiency. In this research, a technique to enhance solar cells was carried out by changing the characteristics of the Anti-Reflective Coating (ARC) of the solar cell in order to obtain the optimal layer of ARC [
3]. Finite-element modeling and numerical simulation (TCAD software) techniques were applied in addition to the experiment in order to provide more accurate results. Moreover, the performance of the solar cell was simulated for different incident angles. At each angle, the short circuit current density (
Jsc), open-circuit voltage (
Voc), fill factor (FF), and power conversion efficiency (PCE) were calculated and their performance was compared between uncoated solar cells and solar cells coated with ZnO, SLARC, and SiO
2/Si
3N
4 DLARC. It was shown that solar cells with SiO
2/Si
3N
4 DLARC had better PCE [
3]. Long-term simulation was performed on solar panels using FEM to obtain optimized performance [
4]. The total solar irradiance was not converted completely to electrical power; a portion of it was converted to heat transfer. Thus, the irradiance, electrical yield, and heat transfer through the different parts of the solar cell were simulated over a period of three years in order to obtain the optimized performance of the panel [
4].
The thermal model of the PV module placed above the roof wall was as represented in [
5]. Voltage, current, ambient temperature, module temperature, and irradiation variations were calculated experimentally, and the Galerkin finite element simulation method was used to study the flow and the energy equations. The experimental and simulation results showed good agreement between them. The thermal potential of the PV module was investigated for different distances between the panel and the wall [
5].
In previous research, a method was applied to increase the conversion efficiency of solar cells [
6]. The method involved changing the internal material of the solar cell and then studying the effect of this on the parameters of the solar cell using Solar Cell Capacitance Simulator (SCAP) simulation. The p-type and n-type of the studied solar cells consisted of gallium nitride GaN and Indium gallium nitride (InGaN) materials. The effect of the Indium material and its thickness were studied and simulated to obtain the optimal results [
6].
A model of a panel collector has been presented which makes use of the refraction and the reflection properties of the optics [
7]. A refractive three-dimensional cross compound parabolic concentrator (3DCCPC) of dielectric material with a reflective layer with the same shape (conjugate system) to collect any escaping rays was placed above the solar panel. There was an air gap between the refractive and reflective layers. Four models were applied in order to find the best one; these models were a bare solar cell, an Initial Refractive-based 3DCCPC system, a new refractive 3DCCPC system, and a conjugate system. The optimal design and model were obtained using Monte Carlo ray-tracing simulation. The conjugate system provided the best configuration, and the optimal air gap was 0.1 mm [
7].
In another study, a concentrating photovoltaic-thermal solar system (CPVT) and a thermoelectric (TE) hybrid system were studied using CFD simulation [
8]. Two numerical methods, Monte Carlo ray-tracing (MCRT) and the Finite Volume Method (FVM) were used in this simulation. A comparison between the experimental and simulation results was performed in order to confirm the simulation results. V-trough concentrator with the photovoltaic module was used to achieve ray tracking [
8].
The 3-D ray tracking software was applied to simulate the optimal design of the V-trough concentrator. The optimal design of the V-trough concentrator was obtained by obtaining the optimal vertex angle and slant height. In [
9], the dynamic behavior of the hybrid photovoltaic–thermal model was applied using MATLAB/Simulink. The dynamic behavior was determined as a function of the outlet water and the solar panel temperature to estimate the thermal and electrical efficiency of the panel. The experimental data were the inputs of the program, such as mass flow rate, irradiance, ambient temperature, and inlet fluid temperature. It was shown that the model could predict the outlet water and the solar panel temperature, and there was good agreement with the experimental results [
9].
An unglazed photovoltaic module was applied with a water-cooling system in [
10]. The temperature distribution on the solar panel was studied, and its effect on the electrical parameters and conversion efficiency was discussed. Numerical simulation of the PV module with and without water cooling was carried out using the MATLAB program. A stratospheric airship with a photovoltaic array above it was introduced in [
11]. Computational fluid dynamic software was applied to simulate the thermal distribution of the photovoltaic array. A comparison was performed between the fixed photovoltaic array and the rotated photovoltaic array. The average output power was almost equal in the two types of PV array [
11].
A hybrid model of a photovoltaic–thermal collector with sheet and tube thermal absorber was presented in [
12,
13]. A 3D numerical model was applied to study the temperature distribution on the solar panel and its effect on the efficiency of the solar panel. The main factor in obtaining the output electrical power of the panel was calculating the temperature distribution on the panel. The optimal design and performance of the model depended on such parameters as the number of glazed layers, the material of the glazed layers, the flow rate of the fluid, the spacing between the tubes, and various ambient conditions. The hybrid model used three types of collectors, an unglazed collector, a single-glazed collector, and a double-glazed collector, and made comparisons between them in order to determine the optimal thermal and electrical efficiencies.
The application of resonant dielectric silica poly (N, N′-bis-4-butylphenyl-N, N′-bisphenyl) benzidine (polyTPD) molecules above a thin-film amorphous silicon (a-Si) solar cell was investigated [
14]. Ultra-hydrophobic polyTPD passivates were found to considerably alleviate moisture penetration, resulting in high efficiency and excellent operational stability.
Researchers have applied metal-doped materials made of of ZnO on top of thin-film solar cells to further improve the performance and stability of dye-sensitized solar cell DSSCs [
15,
16], considering stability and repeatability under constant light for 3000 s.
A comparison was performed between the optimal surface texture and non-textured surface according to the light wave propagation inside the solar cell at different incident angles of light; there was a very high improvement in energy flux with the optimal surface compared to the non-textured surface [
17].
When connected to the grid a PV system provides extra electricity to when there is an overflow of generated electricity as well as when the load is lesser due to the power generated by the solar system, as the system connects in parallel with the grid [
18,
19,
20,
21,
22,
23]. The voltage produced by solar panel systems is a DC source, which is then converted to an AC source using an inverter in order to connect the solar system to the grid. As the voltage produced by PV panels is varies with changing climatological conditions, the maximum power point tracking (MPPT) must be used to obtain the maximum power [
21,
22,
23,
24,
25,
26].
In recent decades, researchers have been seeking to develop MPPT techniques in order to obtain the maximum efficiency from the PV cells regardless of climate conditions. There are many techniques for MPPT that are used to obtain the maximum efficiency from PV cells, including different types of indirect and direct MPPT techniques [
20,
21,
22,
23,
24,
25]. Due to climatic changes, certain sources are not available all day. Therefore, it is possible to face problems in covering daily loads, necessitating solutions that involve merging more than one energy unit together [
26,
27,
28,
29,
30,
31].
In this paper, a 3D numerical model study using ANSYS Fluent 14.5 software was performed to test the effect of the pyramidal covers of three different height to base length ratios (1.5, 1.0, and 0.5) based on the incident radiation on the panel surface. A simulation model was applied in order to study the incident radiation on the solar panel with and without pyramids. This study was carried out using three different sizes of pyramids while changing the incidence angle of the radiation source. Moreover, the tests were performed at ten different incidence angles, from 0 to 90 with a step of 10 degrees. Different Perspex pyramidal cover thicknesses were investigated for their ability to enhance the incident ratio on the panel surface. The energy of the light depends on the electrical field, and the electrical field depends in turn on the permittivity. As the relative permittivity of Perspex is higher than the relative permittivity of air, the energy of a panel with a pyramidal cover of Perspex is higher than the energy of a panel without a pyramid. The experimental model herein was established to investigate the accuracy of the simulation model. Finally, the optimum model for a transparent pyramidal concentrator based on the simulation was obtained for the maximum incident radiation. The simulation proves that a pyramidal cover increases the incident radiation falling on the solar panel for all incidence angles of the radiation source.
2. Experimental Setup
A lab experiment was performed to study the effect of Perspex pyramidal covers on the performance of PV panels. Three different sizes of pyramidal cover were manufactured with a square base and height to base length ratios R of 1.5, 1.0, and 0.5. The layout of the experiment is illustrated in
Figure 1.
An opaque box was used to perform the experiment in order to prevent any light entering from outside and to ensure the use of one radiation source, the solar simulator. The solar panel and the radiation source were placed inside the closed box. The solar simulator was fixed using orientation mechanics to permit variation of the incidence angle of the radiation and radiation intensity on the pyramids and the panel. The panel was connected to a voltmeter which was outside the box. The solar simulator was placed on a vertical slider to permit variation of the light incidence angle on the panel. The incidence angle was defined as the angle between the light rays and the normal angle of the panel. The incidence angle was varied from 0° to 90° in 10° steps. A Solar Power Meter was placed inside the black box; its wire continued externally to measure the radiation applied on the pyramids. Eight quadrilateral pyramids were manufactured from Perspex, each with 2 mm thickness.
The experiment was composed of a closed box including the PV panel with the Pyramidal covers of different sizes and a solar light source. The angle of incidence of the radiation varied between 0 and 90° in 10° steps. The output voltage of the PV panel was recorded for each angle and each pyramid size [
1].
An opaque box, as shown in
Figure 1b, was constructed of aluminum and opaque fiber sheets in order to isolate the experiment from outside lighting. The box was covered internally with matte black color paper to overcome any radiation reflection that might affect the performance of the pyramids on the panels. One side of the box was fixed on joints to permit it to open and close in order to adjust the positions of the pyramids and orientation of the solar simulator as well as to take measurements.
The solar panel used was a monocrystalline panel (model SY-20M). The panel was composed of 2 × 4 cells. Each cell had a square shape 12 cm in length. The same dimensions were used to manufacture the pyramid base size.
A solar simulator lamp was used as the radiation source, as shown in
Figure 1a. The simulator model was a PHILIPS PAR38 EC, a 230 V and 120 W model producing 1100 Lumens. At each angle, the average incident radiation on the base was calculated for the model with and without pyramids.
4. Numerical Model
Most engineering applications use simulation techniques to solve certain problems. Simulation models have many advantages in terms of allowing low-cost solutions to be performed with acceptable accuracy compared to experimental work. Simulations can reveal data that are very expensive to measure in labs. Examples of such data include the distribution of properties over surfaces and flow streams in a flow duct. In the present study, the advantage lies in determining the distribution of incident rays on the pyramid surface and base, which acts as the solar panel.
ANSYS fluent 14.5 software was used as the simulation modeler in the present study. It is a finite volume-based software. One of the promising radiation models applied in this software is the Discrete Ordinates (DO) model.
In the present study, three pyramidal covers with three sizes were modeled and studied. The horizontal ray incidence angle was varied from 0° to 90° in 10° steps in order to study its effect on the radiation received at the panel. The simulation procedure included creating a geometry and mesh using ANSYS-ICEM. The mesh was then exported to the solver, in which boundary and initial conditions were set up. After the simulation ended, the, the results were viewed using ANSYS CFD Post software.
Geometry and Mesh
The model geometry and mesh were created using ANSYS-ICEM. The model consisted of two regions. The first region, the Perspex was the material from which the pyramids were made, and had a thickness of 2 mm. The second region was the air inside the pyramid. The boundaries were defined as follows:
The external pyramid surface was considered as a wall boundary condition exposed to the entering radiation;
The internal pyramid surface was exposed to air inside the pyramid, thus participating in the solar radiation model by conducting radiation energy into the base and to the facing internal surfaces;
The base acted as the radiation-receiving surface of the panel;
The Perspex base was the base of the Perspex pyramids.
The geometry of the proposed model is illustrated in
Figure 2, and a sample of the cell distribution is shown in
Figure 3. The governing equation of the radiation model was solved over these cells in order to calculate the radiation intensity reaching the different surfaces, applying the transparency, reflection, and refraction values for the different surfaces and materials.
After creating the mesh of the model, the mesh was exported to FLUENT 14.5. The scale was adjusted according to the dimensions, which the geometry created in ICEM in cm. The selected radiation model was the Discrete Ordinates (DO) model. The materials were set up and their properties were added. The properties of the Perspex were density = 1190 kg/m3, specific heat = 0.35 J/kg·k, Thermal Conductivity = 1.3 W/m·k, Refractive Index = 1.49. The radiation boundary conditions of the different zones were set up as well.
The external wall was considered semi-transparent, and its boundary conditions were direct irradiation = 100 W/m
2 and diffuse fraction = 0.1, and the radiation beam direction was adjusted in the x, y, and z coordinates according to the incident angle of each case. The DO radiation model equation was selected for solving. The maximum number of iterations was set to 1000 iterations in a steady-state simulation. After setting up all the required parameters, the solution converged before reaching the 1000th iteration for all the cases upon the introduction of the convergence criteria, which were set as reaching the calculation residuals to a value of 10 × 10
−6. This convergence was reached after twenty iterations for the R = 1.5 model, as shown in
Figure 4.
Two parameters were studied in the simulation; these parameters were the effect of pyramid size on the radiation received on the panel and the effect of changing the incidence angle of radiation on the radiation received on the panel with pyramids. The three pyramid sizes considered had height to base length ratios of 1.5, 1.0, and 0.5, while the incidence angles considered were between 0° to 90° in steps of 10°.
5. Results and Discussion
For each angle the average incident radiation received on the base was calculated for each size of the pyramid as well as for the base without any pyramids. For the first size of pyramid, the average incident radiation on the base was calculated with and without a pyramid, and the percentage enhancement of the incident radiation due to the pyramid was calculated at each incidence angle. The previous steps were repeated with the two other sizes of pyramid.
The contours of the incident radiation on the base were obtained for three different model sizes of pyramids and with different incidence angles of the radiation source, as shown in the figures below.
5.1. Contours of the Incidence Radiation on the External Wall
The contours of the incidence radiation on the external wall of the pyramids are illustrated in
Figure 5, which shows the radiation distribution on the external wall of the pyramids.
It can be observed that the radiation received on the external surface varies according to the direction from which the radiation is directed. The surface of the pyramid facing the radiation was observed to have a higher incidence of radiation than the other surfaces in all three cases.
5.2. Contours of Incidence Radiation on the Base
The pyramidal covering of the panel was divided into four positions. These positions covered 25%, 50%, 75%, and 100% of the panel area with pyramids, respectively. The pyramid size changed in each position, and the incidence angle changed from 0° to 90°. The 25% covering meant one row of two pyramids each behind the other at the middle of the panel.
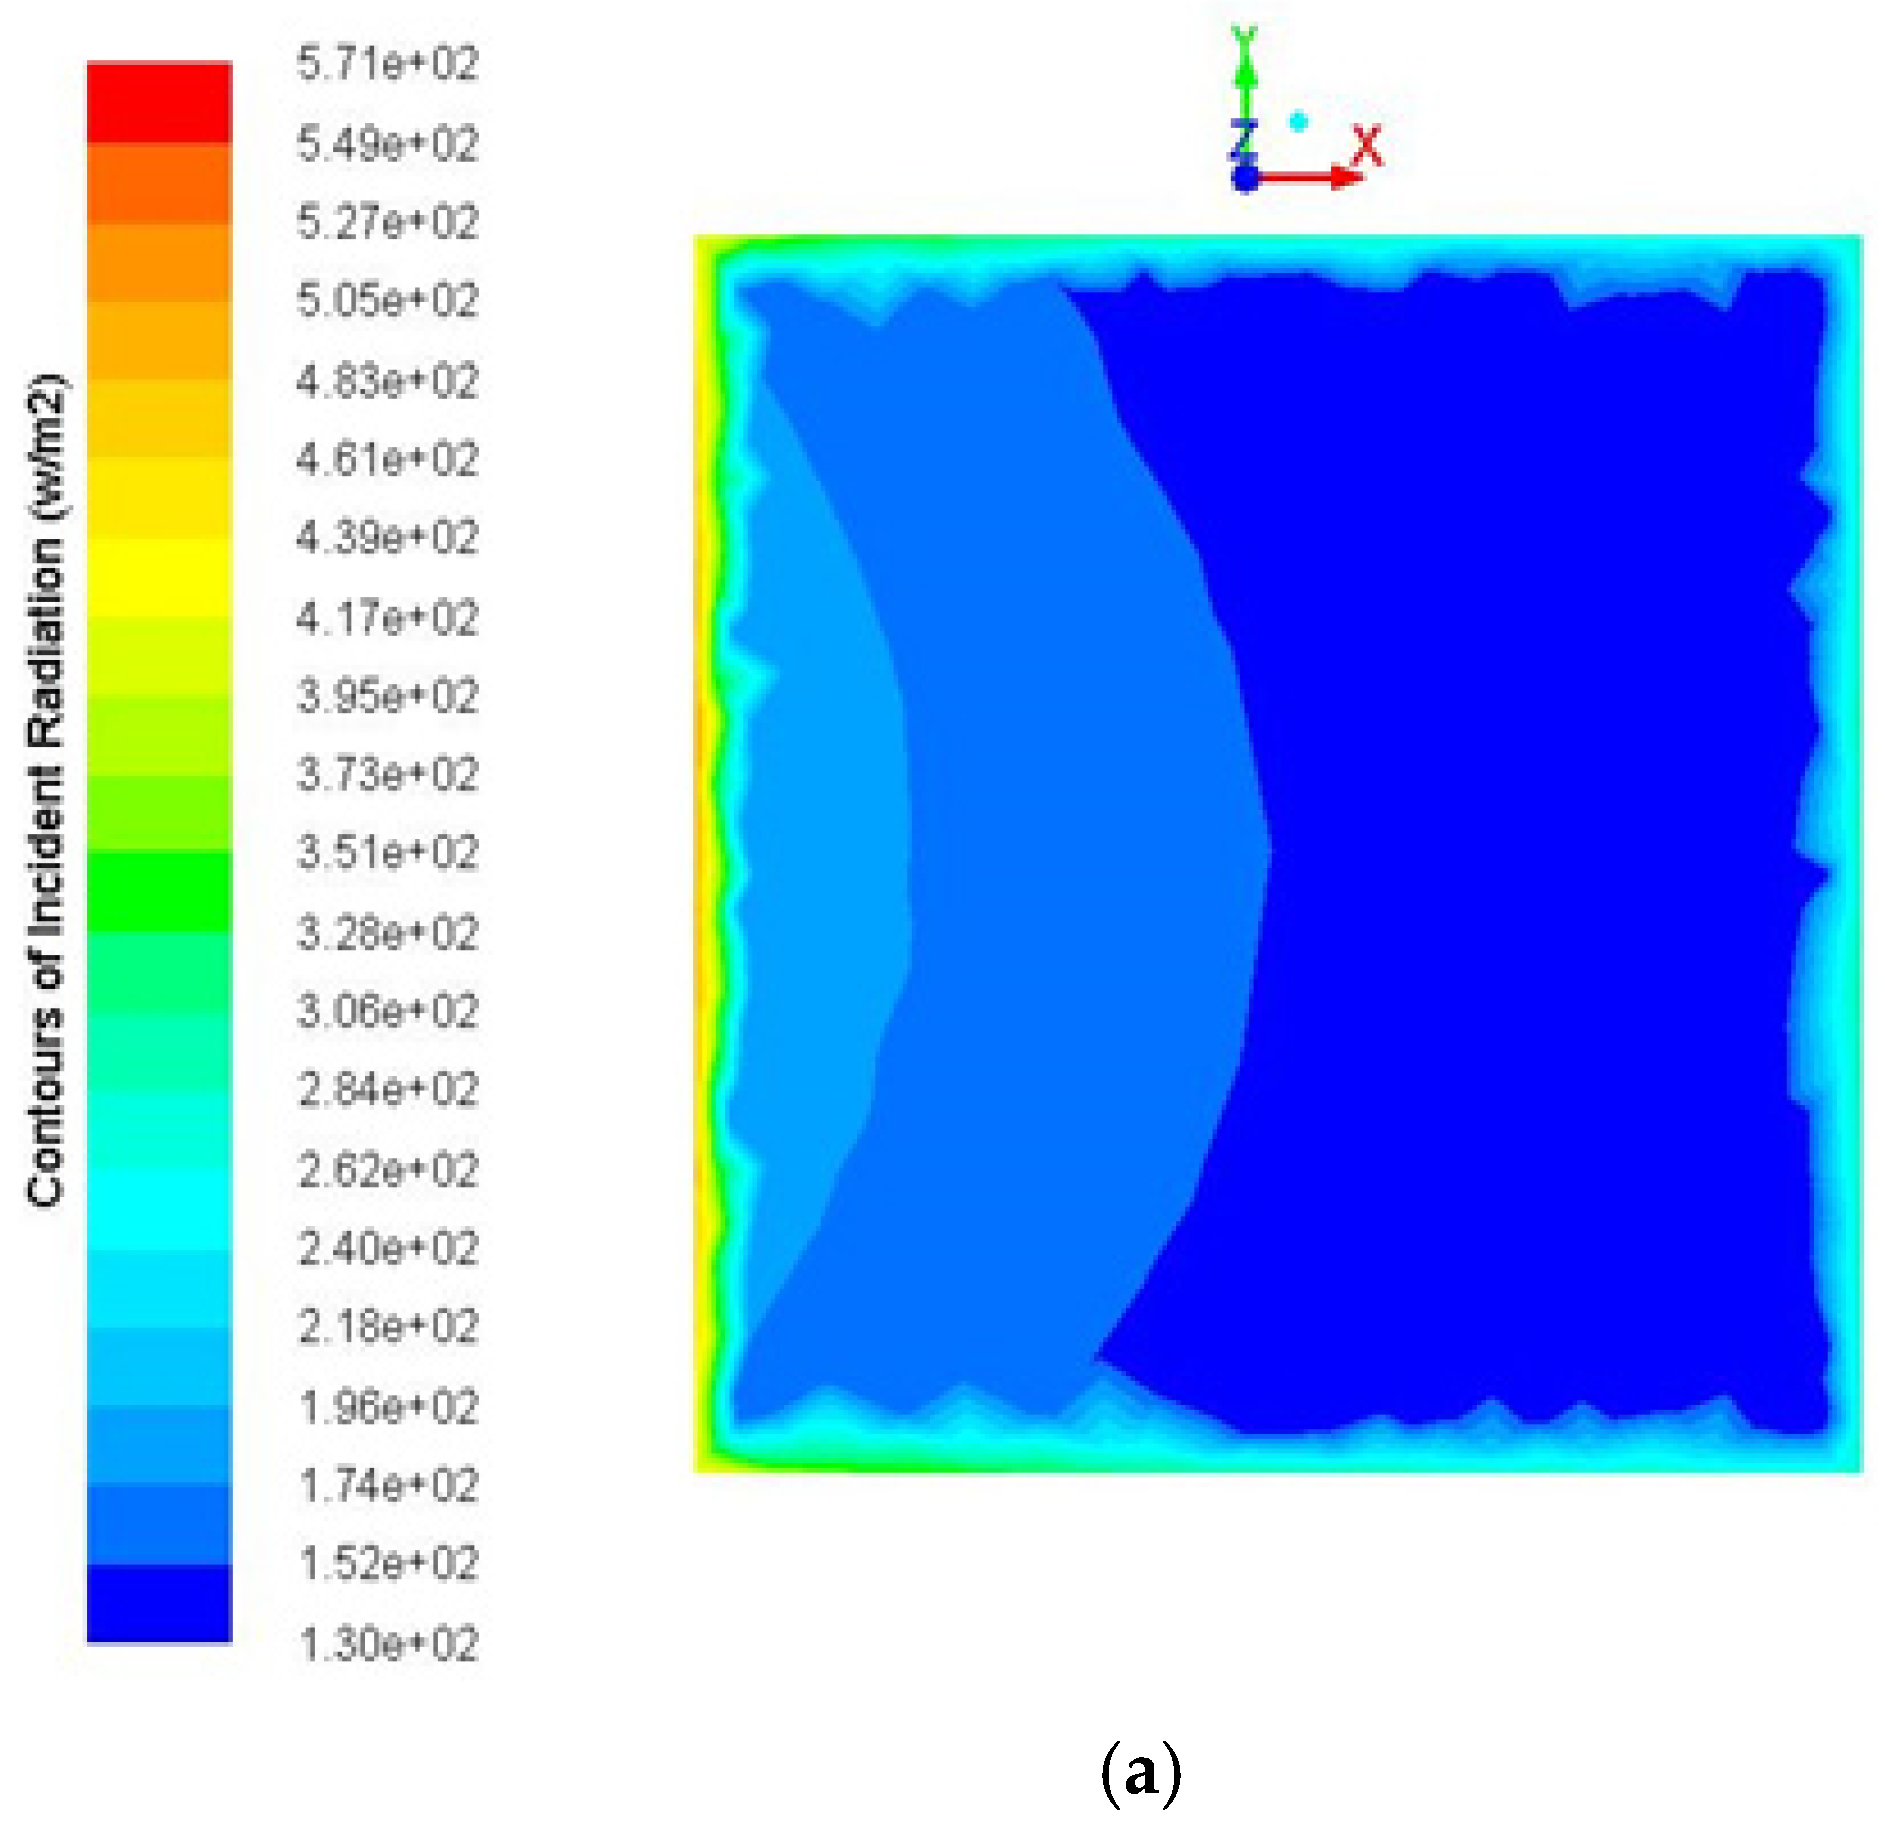
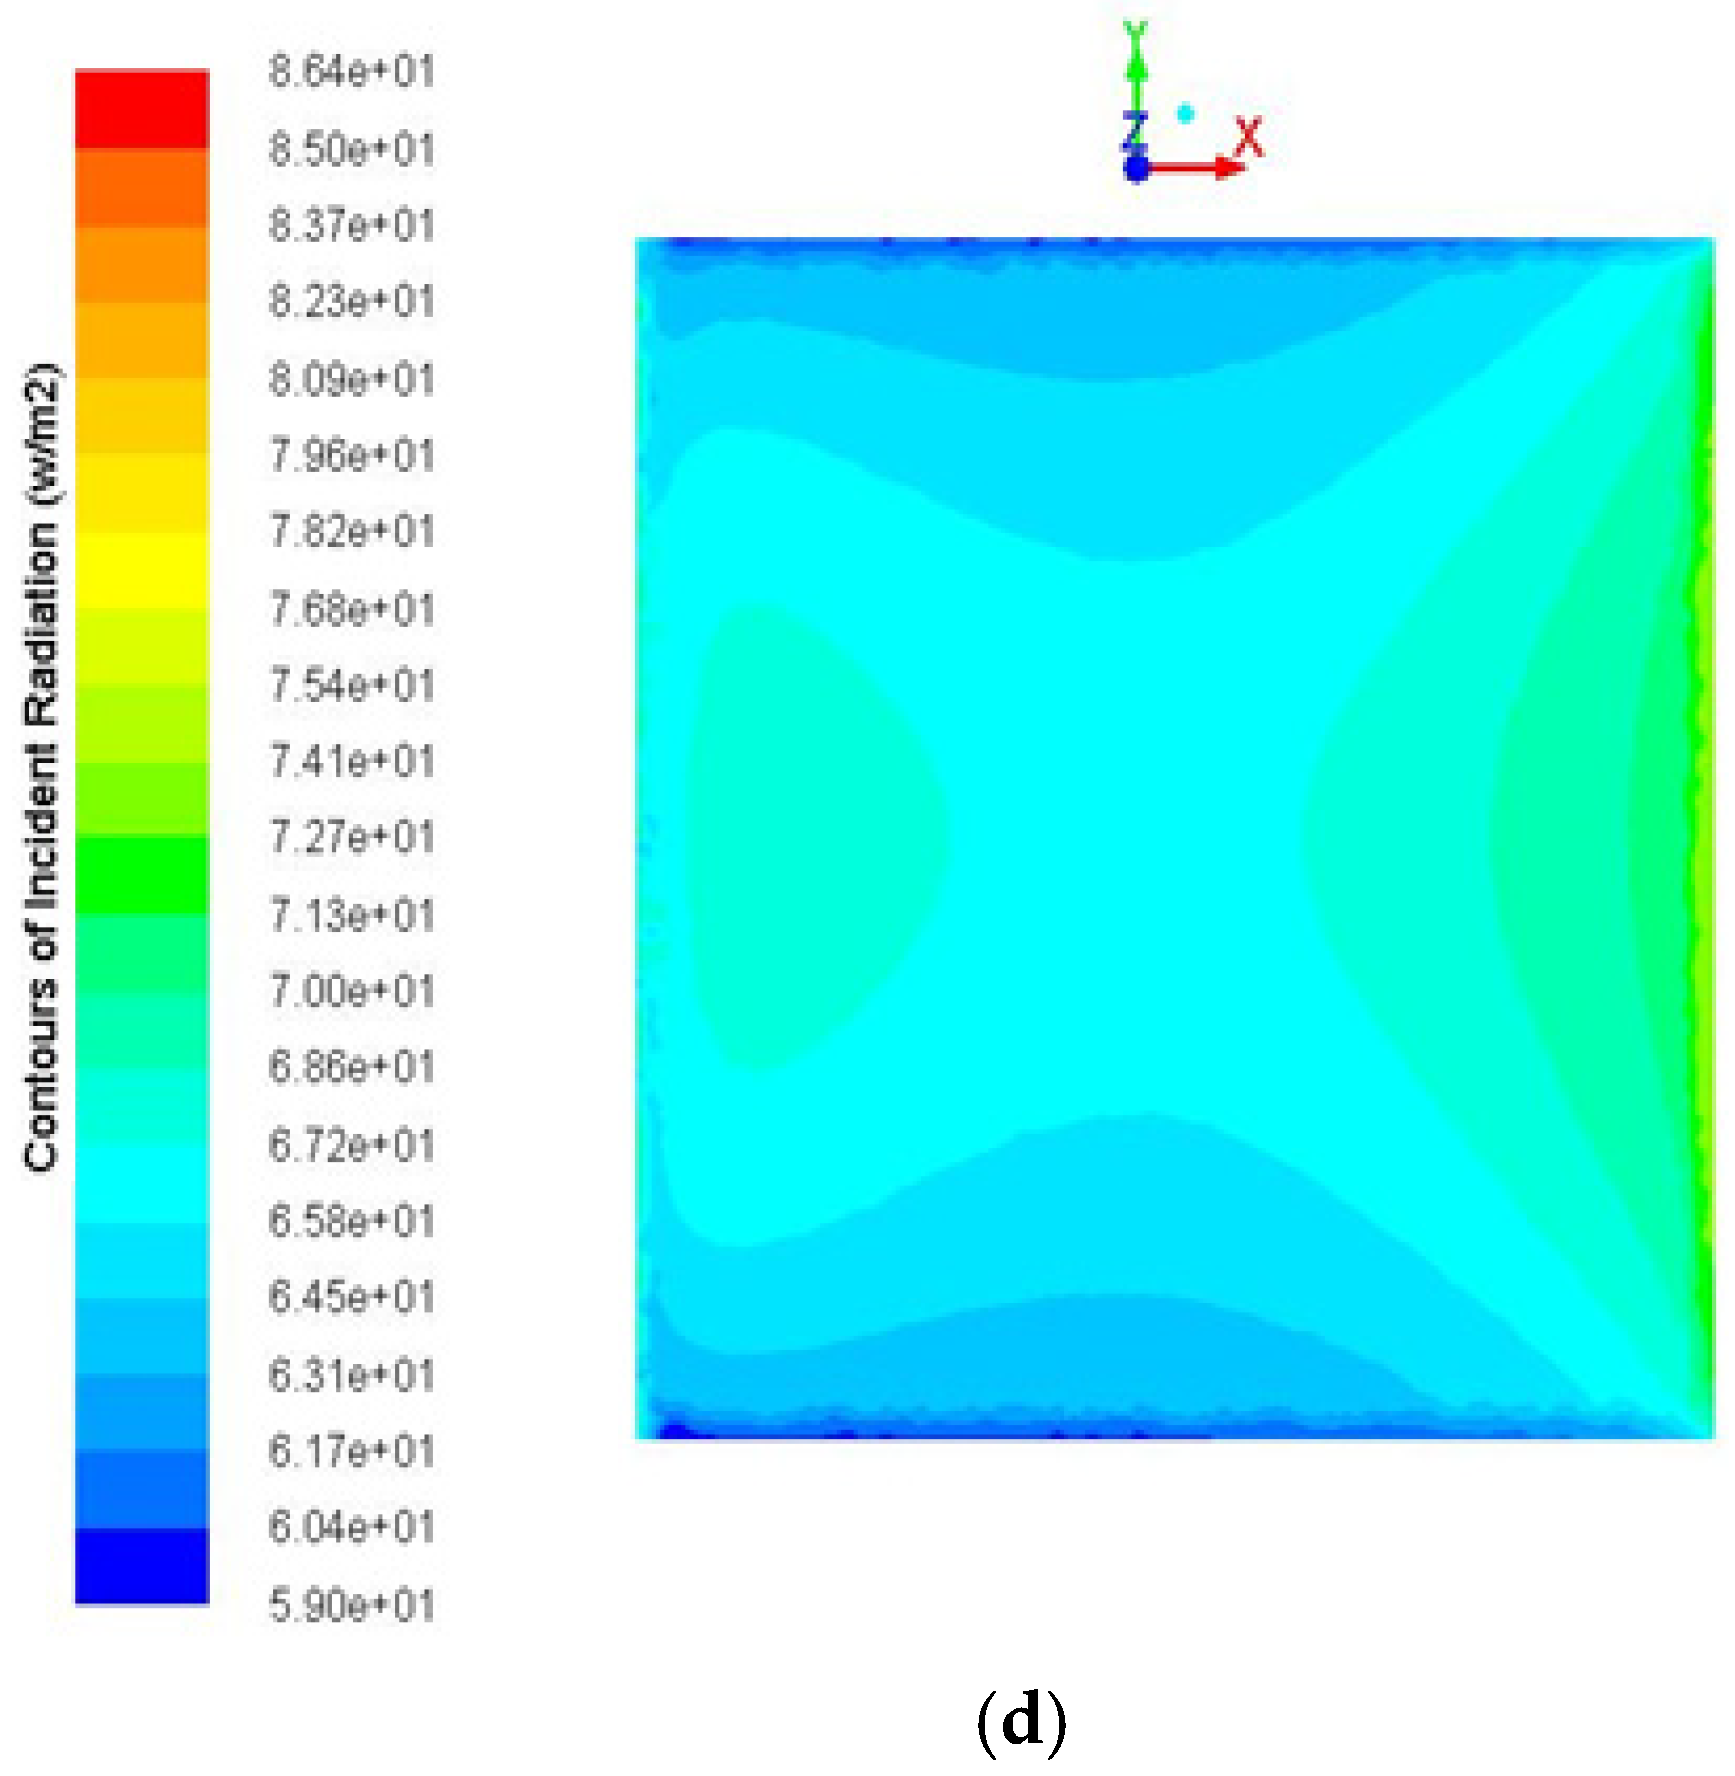
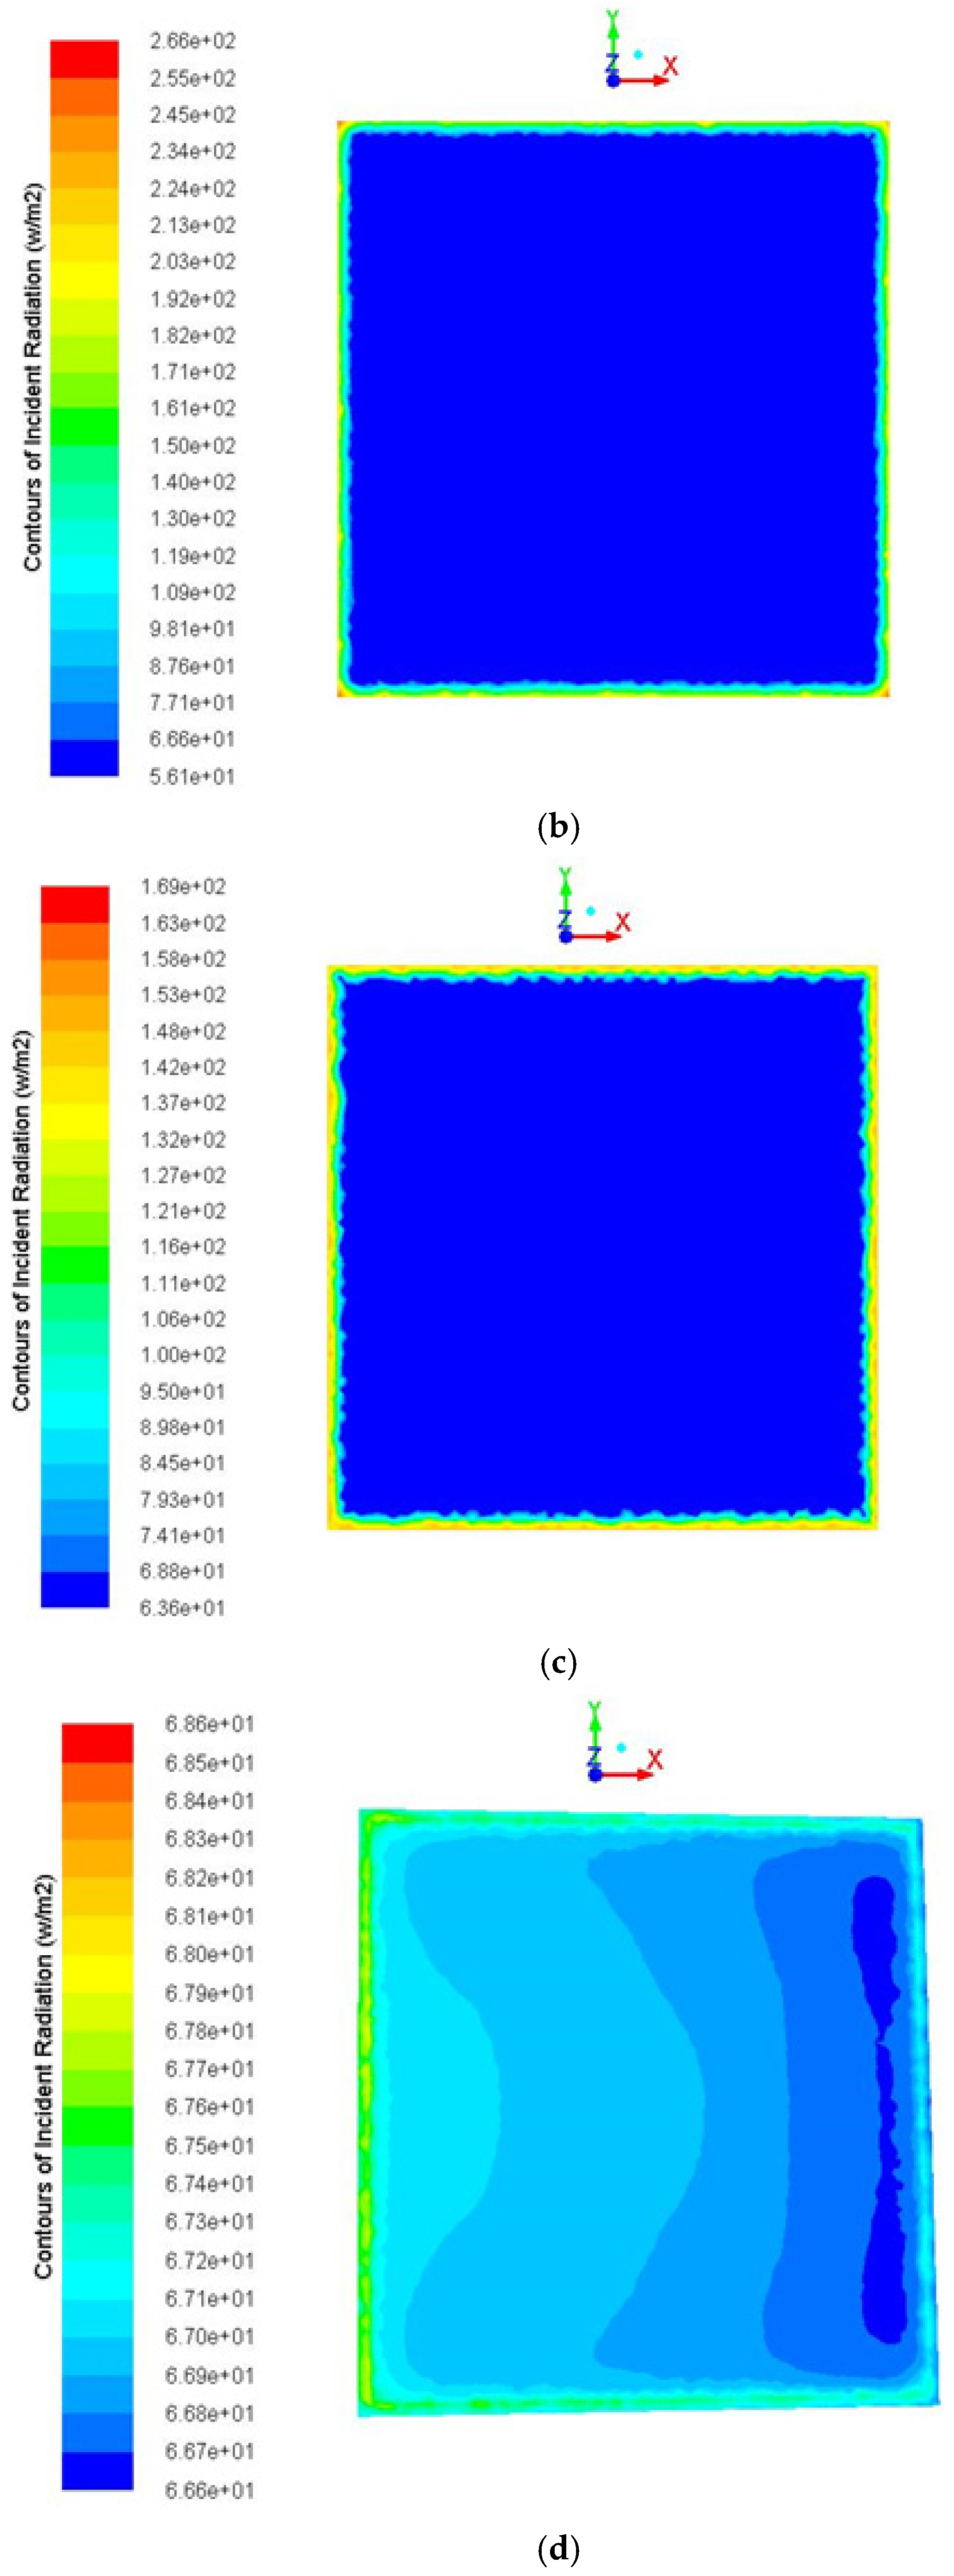
The base represents the solar panel; the contours of the incident radiation on the base are illustrated for the three pyramid models for different incident angles and for the model without any pyramids. The incidence angle is defined as the angle between the radiation direction and the normal angle of the panel. The contours for an incidence angle of 0, which represents a radiation direction perpendicular to the panel, are illustrated in
Figure 6.
It can be observed that the distribution of the radiation on the base is regular in the case with no pyramids. This is due to the absence of the scattering caused by the pyramids in the other cases. However, it can be observed that the maximum local distribution of the radiation encountered at the pyramids covers the Perspex base due to internal radiation refraction in the Perspex, which increases the radiation intensity in the Perspex base.
As illustrated for the incidence angle of 10° in
Figure 7, the local incidence radiation value begins to decrease due to the reduction of the perpendicular radiation component. This reduction takes place in all four models observed.
As illustrated in
Figure 8, for an incidence angle of 20° the local incidence radiation value continues to decrease due to the reduction of the perpendicular radiation component. This reduction takes place in all four models observed.
Figure 9 shows the results with an incidence angle of 30°. The local incidence radiation value continues to decrease due to the reduction of the perpendicular radiation component. This reduction takes place in all four models observed, and the uniformity of distribution of the radiation decreases as well.
Figure 10 illustrates the simulation results with an incidence angle of 40°. The local incidence radiation value continues to decrease due to the reduction of the perpendicular radiation component. This reduction takes place in all four models observed. The uniformity of distribution of the radiation decreases as well.
Figure 11 shows the results with an incidence angle of 50°. The local incidence radiation value continues to decrease due to the reduction of the perpendicular radiation component. Starting from this inclination angle, the distribution of the incident radiation on the base is uniform in the cases of the pyramids, while the intensity increases in the Perspex base region.
Figure 12 shows the simulation results with an incidence angle of 60°; the local incident radiation on the base increases beside the surface facing the radiation in the case without any pyramids.
However, for all cases with pyramids this gradation does not appear at all except in the region of the Perspex base. It can be observed that the R = 1.5 pyramid shows a higher diffusion effect for the incident radiation beside the walls of the pyramid at the base.
As illustrated in
Figure 13, for an incidence angle of 70° the local incident radiation increases on the base beside the surface facing the radiation in the case without pyramids. However, for the cases with pyramids this gradation does not appear at all except in the region of the Perspex base.
The simulation results with an incidence angle of 80° are shown in
Figure 14; the local incident radiation increases on the base beside the surface facing the radiation in the case without pyramids. However, for the cases with pyramids this gradation does not appear at all except in the region of the Perspex base. In the case of the R = 1 pyramid the diffusion of the scattered incident radiation on the base is minimal compared to the other two pyramid types.
The incidence angle of 90°, which is the case when the incident radiation is parallel to the panel, is illustrated in
Figure 15; the local incident radiation increases on the base beside the surface facing the radiation in the case without pyramids. However, for the cases with pyramids this gradation does not appear at all except in the region of the Perspex base. In the case of the R = 1 pyramid, the diffusion of the scattered incident radiation on the base is minimal compared to the other two pyramid types, and it is very clear that the maximum local incident radiation value is achieved in the case of the R = 1 pyramid.
In general, it can be observed that the pyramidal semitransparent covers increase the local radiation received on the panel at the location of the Perspex base due to radiation scattering inside the pyramid. It can be further observed that the maximum local incident radiation in the presence of the pyramidal covers is larger than in the case without pyramids. Of all cases, the pyramidal cover with R = 1.0 provides the maximum local incident radiation. The average incident radiation on the base compared between R = 1.0 and the case without pyramids is illustrated in
Figure 16. The average incident radiation received on the panel is larger in the case with the R = 1.5 pyramidal cover for all tested incidence angles.


