Article

Do Spatially Structured Soil Variables Influence the Plant Diversity in Tabuk Arid Region, Saudi Arabia?

by
Khalid Awadh Al-Mutairi
Department of Biology, Faculty of Science, University of Tabuk, P.O. Box 741, Tabuk 71491, Saudi Arabia
Sustainability 2022, 14(5), 2611; https://doi.org/10.3390/su14052611
Submission received: 29 January 2022 / Revised: 19 February 2022 / Accepted: 22 February 2022 / Published: 24 February 2022

Abstract

:
Plant diversity is affected by spatial variables as well as soil physical and chemical variables. In this study, plant species and soil variables were investigated in five sites of Tabuk Province (Saudi Arabia), namely Aldesah, Alzetah, Alawz, Harra and Sharma, to understand if the spatially structured soil variables (pH, electric conductivity (EC), soil texture, calcium, potassium, phosphorus, phosphate, total organic matter (OM), bicarbonate and sodium) influence the plant diversity. A total of 163 plant species belong to 41 families and 124 genera were reported from the 5 sites. Diversity indices including the species richness (alpha), evenness, Brillouin, Menhinick, Margalef, equitability and estimated Chao-1 were significantly different among the studied sites with pronounced high values in Sharma and Aldesah. The highest value of beta diversity was reported in Aldesah (0.253) followed by Sharma (0.171). According to the principal coordinates of neighbourhood matrix (PCNM) analysis, 11 positive spatial vectors (variables) were found. However, after running the forward selection procedures (using 2 stopping criteria), only 3 spatial vectors were retained (PCNM 1 (adj–R2 = 0.043, F = 5.201, p = 0.004), PCNM 2 (adj–R2 = 0.027, F = 3.97, p = 0.006) and PCNM 3 (adj–R2 = 0.019, F = 3.36, p = 0.007)). The linear models between the selected spatial variables (PCNM vectors) and soil variables were produced to investigate their spatial structure. In the first model, the first PCNM 1 axis showed significant relationship with pH and potassium (adj–R2 = 0.175, p = 0.046). In the second model, the second PCNM 2 axis had a significant relationship with OM and sodium (adj–R2 = 0.561, p < 0.001). Lastly, sodium was the only factor significantly correlated with the third PCNM 3 axis (adj–R2 = 0.365, p = 0.002). In conclusion, the spatially structured variables of soil did not show strong influence on plant diversity except pH and potassium, which were correlated with PCNM 1, OM and sodium, which were correlated with PCNM 2, and sodium, which was correlated with PCNM 3.

1. Introduction

Saudi Arabia has a huge arid and semi-arid area of more than 2 million km2, containing different ecosystems and distinctive habitats harbouring a unique plant diversity [1,2,3], which has exclusive contribution to the flora of the arid region worldwide [3,4].
Studying composition of plant communities is the cornerstone in classic ecological studies, since the structure of the communities is subjected to local and regional factors, as well as to biotic and abiotic factors [5,6,7]. The response of the plant communities to environmental and spatial variables is complex [8], resulting in ambiguities in understanding dispersion, adaptation and distribution of plants under different scenarios [9,10]. For few decades, the ecological studies aimed to understand the dispersion of the plant communities through studying the spatial patterns and the underlying factors influencing the diversity [7,11,12,13]. On the other hand, there is immense deterioration in plant diversity, not only in the arid region, but in every region of the world, due to intensive anthropogenic activities, climate change, agriculture and urban development [10,14,15]. One of the most obvious effects of the deterioration in plant diversity is extinction and spatial homogenization of the plant communities [14].
Based on theoretical studies, in addition to spatial patterns of plant communities, environmental variables can be spatially structured [16]. In this context, the pronounced association between spatially structured environmental variables and plant diversity can result in creating unique habitats and distinctive patterns of species composition. This an acceptable fact, because the spatial structuring mechanisms are complicated, and the structure of plant communities is the result of cumulative and interactive relationships between topographical, environmental, geographical and dispersal drivers [16,17]. Therefore, the degree to which environmental factors influence species composition varies accordingly. Regardless, soil chemical and physical properties are always shown to be the key factors controlling plant diversity [3,18,19].
Understanding the relationship between environmental variables on one side and the spatial variability on the other side is a crucial step prior to planning and implementing any conservation programs [10]. Therefore, there is a growing trend among ecologists and conservationists to study the effect of spatial patterns of environmental variables on organisms’ diversity [12,13,20]. This vast development in the ecology was associated with emerging of the metacommunity theory and dedicating significant efforts in understanding all factors structuring the communities at small, medium and large scales [12,21,22,23,24,25].
There is a long-standing debate and an inconsistency in detecting chief factors structuring plant communities and the patterns of diversity. Several researchers believe that the soil profile and associated topographical factors are the main drivers of plant diversity [3,7,12,20,26,27]. In contrast, some other researchers highlight the contribution of spatial variables and dispersion capability to affect plant diversity [28,29]. In this study, I attempted to determine whether the soil variables are spatially structured, and if this pattern structuring the plant communities in Tabuk arid region (Saudi Arabia). Most previous studies examine the spatial patterns of the plant communities; meanwhile, there has been no effort dedicated to examining whether the spatially structured soil variable can influence plant diversity.

2. Materials and Methods

2.1. Study Sites

Tabuk region is in the northwestern part of Saudi Arabia, with an area of approximately 135,000 km2. It has an arid climate with temperature ranging from 25–40 °C in the summer and 5–25 °C during the winter. The annual precipitation is less than 50 mm. Tabuk region has different habitats and ecosystems (coastal, mountain, sand dunes and valleys). Five sites were investigated in this study: Aldesah, Alzetah, Alawz, Harrah and Sharma. Aldesah is an oasis, located in the east of Tabuk, and is characterized by dense and diverse plant communities; Alzetah is located towards the north of Tabuk and is characterized with several plateaus and sand dunes; Alawz is a mountainous site and can reach the altitude of 2400 m.a.s.l.; Harra is known for its unique igneous rocky structure and less vegetation cover; and Sharma is a coastal area with diverse plant species and life forms.

2.2. Floristic Data

The vegetation survey of plant species in the studied sites was carried out during spring 2018 using 5 × 5 m quadrats—3 sampling locations with 5 quadrats in each site were sampled randomly. The presence/absence data of vascular plants were recorded. Thereafter, the plant species were identified using the available taxonomical keys, mainly those of Chaudhary [30] and Collenette [31]. Voucher specimens were deposited in Tabuk University Herbarium.

2.3. Soil Variables

From each site, three soil samples were collected randomly at depth of 50 cm. The samples were sieved through 2 mm sieve and analysed physically and chemically in the laboratory. A total of 10 environmental variables were determined from the soil samples. The environmental variables were pH, electric conductivity (EC), soil texture, calcium, potassium, phosphorus, phosphate, total organic matter (OM), bicarbonate and sodium. The procedures of analysing soil samples for environmental parameters were carried out following Allen [32] and APHA [33]. The mean and standard deviation values of the soil chemical variables in the studied sites are presented in Table 1.

2.4. Spatial Variables

The geographical coordinates (latitude and longitude) were recorded at each site. The spatial variables were produced from the geographical coordinates using principal coordinates of neighbour matrices (PCNM), which is renowned in spatial ecology to investigate the spatial patterns of ecological data at fine and broad scales. The produced PCNM vectors are considered the spatial variables [34,35].

2.5. Statistical Analysis

The data of soil environmental variables were analysed descriptively for mean and standard deviation. The means of the variables were compared statistically using one-way ANOVA at significance level of 0.05. The Pearson’s correlation test at p < 0.05 was used to examine the relationship between the variables. All analyses were conducted using R program 4.1.2 (R Development Core Team [36]. The function pcnm of the Vegan package of R was used to extract the PCNM spatial variables. The forward selection was conducted using the function forward.sel in the Packfor package considering two stopping criteria (Adjusted R2 and p value of 0.05) to select the significant PCNM vectors. Further details about the forward selection procedures can be found in Blanchet et al. [37]. The test of canonical analysis of principal coordinates based on discriminant analysis (CAP) was applied to investigate the multivariate variation in the taxonomic composition against the five studied sites. The test was carried out using the function CAPdiscrim of the BiodiversityR package. Multivariate homogeneity of groups dispersions (variances) (PERMDISP; Anderson [38] was used to determine the multivariate dispersions in plant communities within each site (i.e., beta diversity across a set of sites). The function betadisper of the Vegan package in R program was utilized to calculate the average the distance of centroid based on Sørenson dissimilarity measure as it is recommended for presence/absence data.

3. Results

A total of 163 plant species of 41 families and 124 genera were reported from all sites. Asteraceae, Brassicaceae, Fabaceae and Boraginaceae families comprised approximately 39% of the total species richness (Figure 1). Table 2 represents the diversity indices in the five study sites. The highest average number of species were reported in Sharma with a mean of 43; however, Aldesah has the lowest number of species (8 species). All the diversity measures showed similar patterns in the different sites. Interestingly, all the diversity indices were significantly different among the study sites.
The multivariate homogeneity of groups dispersion or beta diversity was applied to investigate the variance in the species composition among the sites. The principal coordinates analysis resulted in 14 PCoA axes and the eigenvalues of the first 4 PCoA axes were 1.701, 1.0461, 0.769 and 0.239, respectively. Table 3 represents the eigenvalue of each retained PCoA axis in each site.
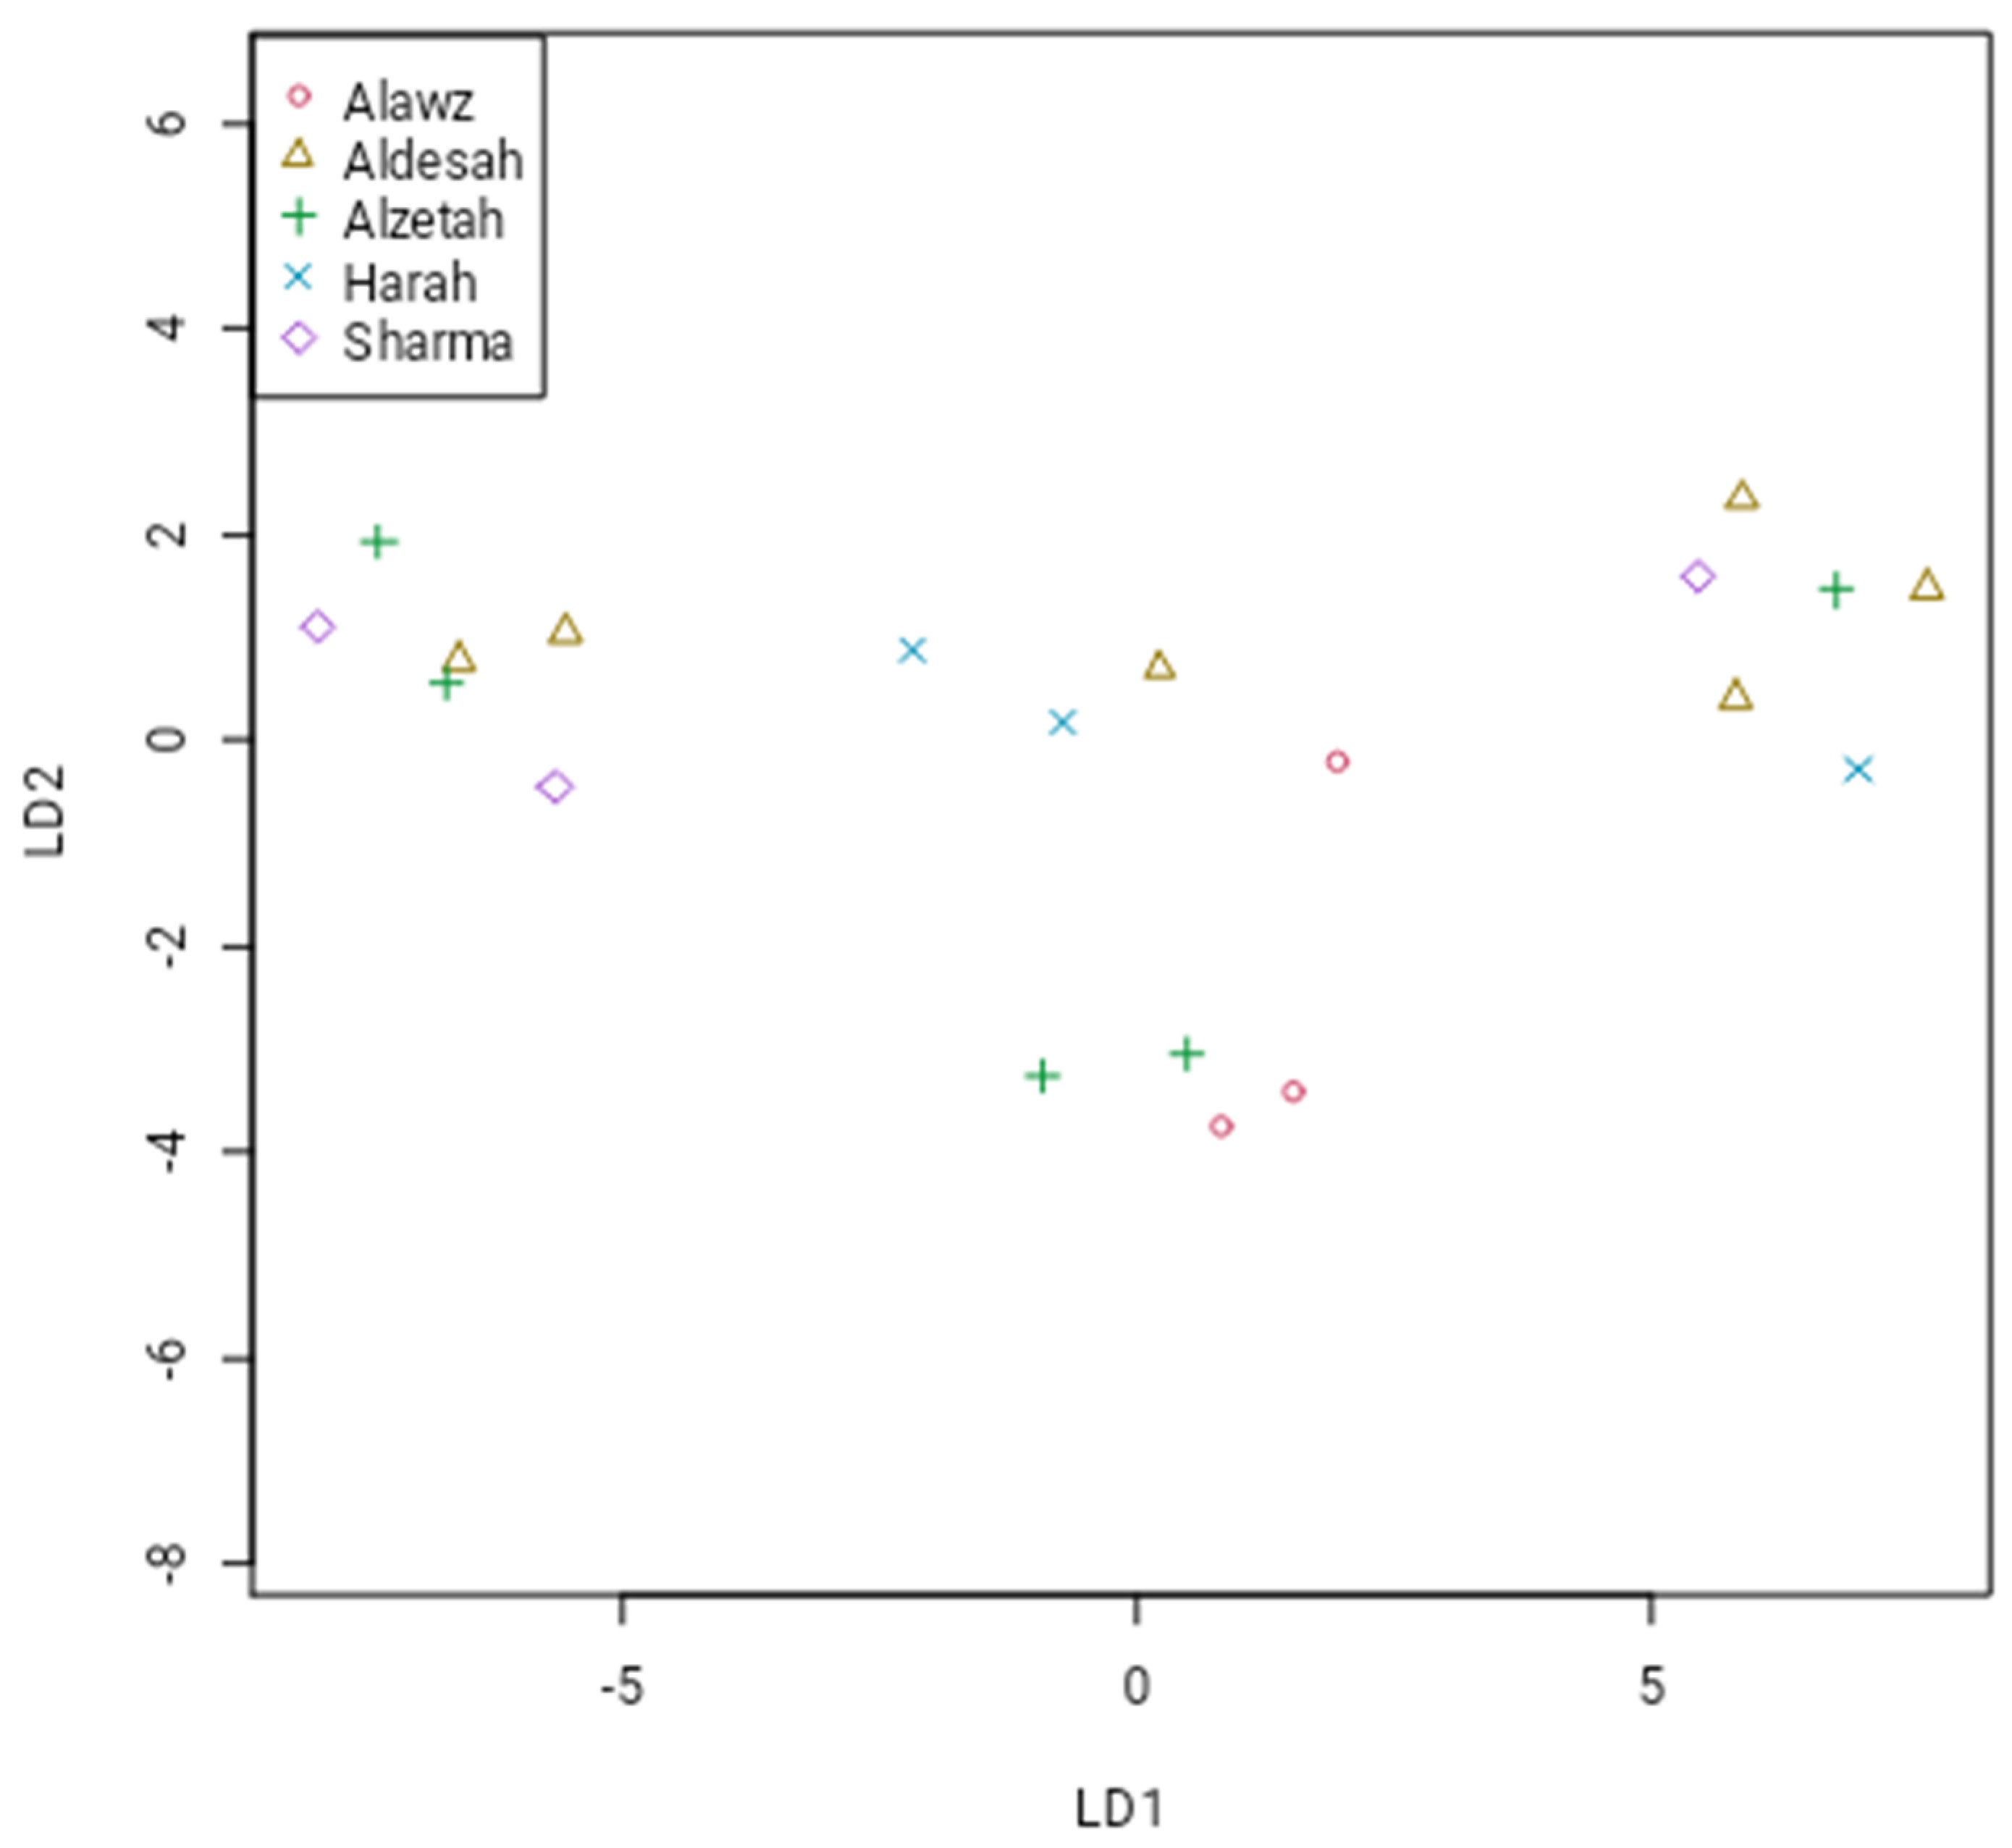
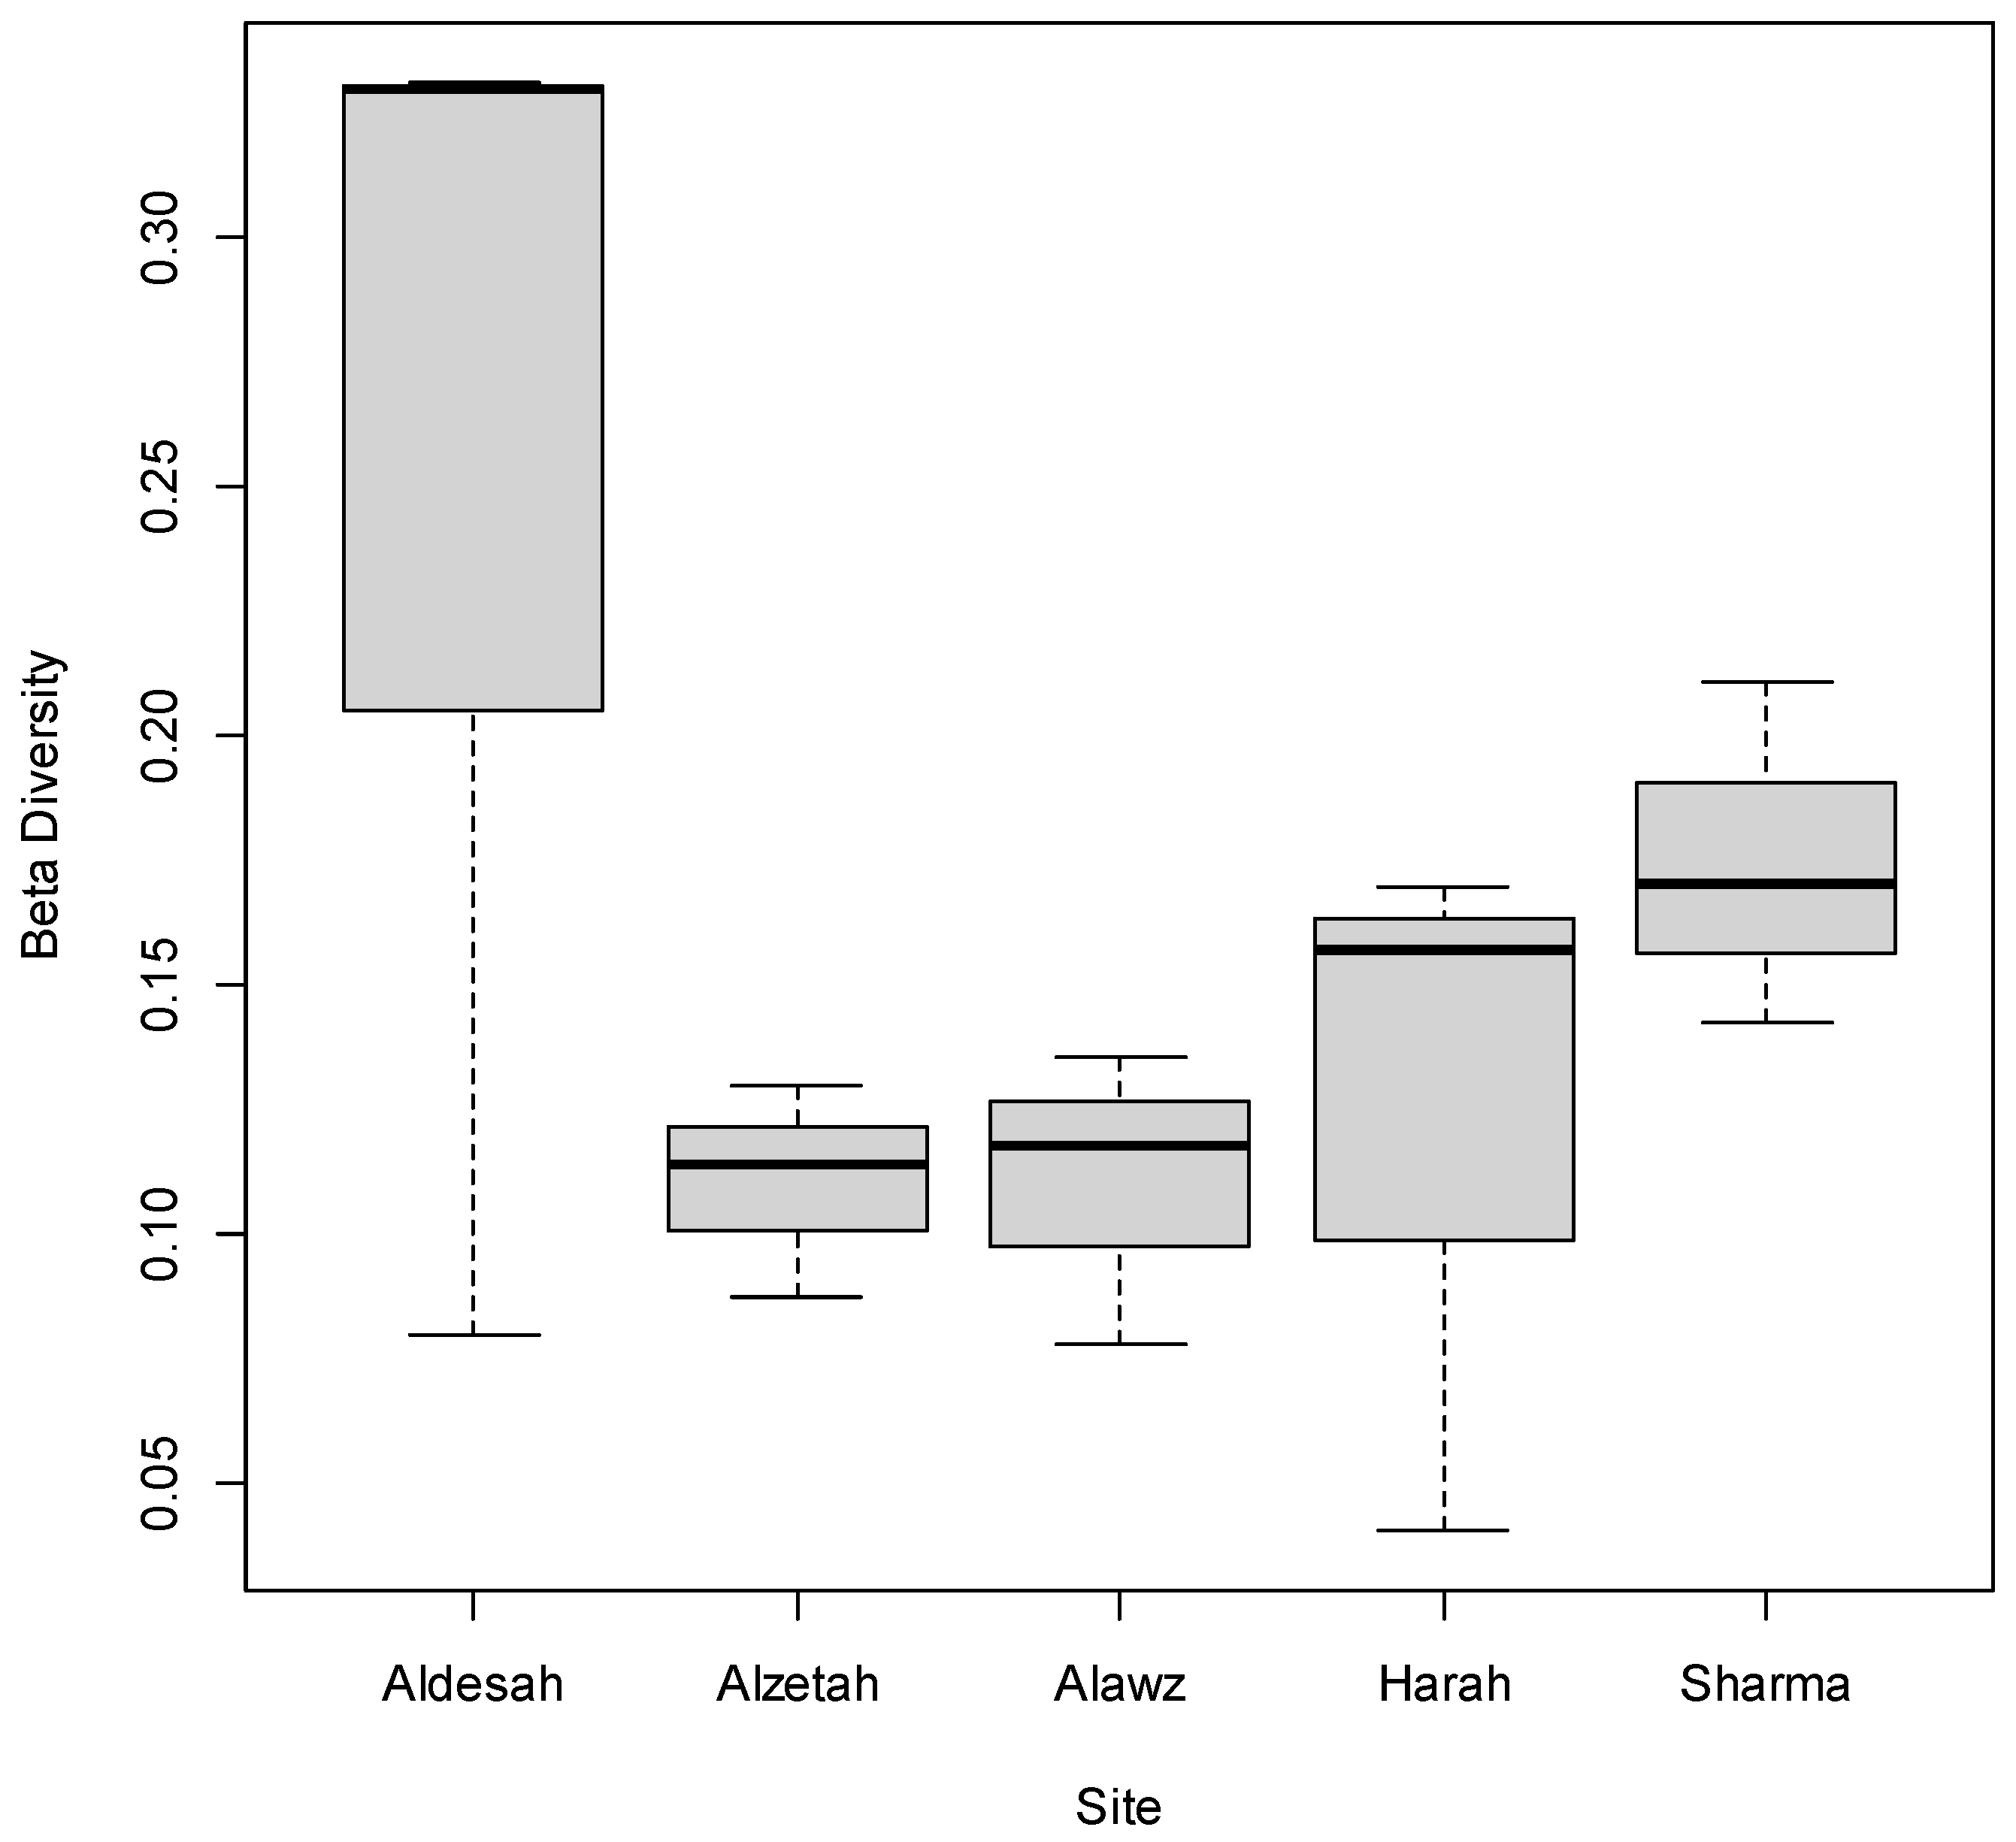
Figure 2 shows the CAP first two axes (F-value = 3.366, p = 0.008) showing the variation in the species composition among the five sites. Figure 3 illustrated the average distance to the centroids (i.e., beta diversity) of plant species in each site (F-value= 1.835 and p = 0.025). The two sites of Aldesah and Sharma had the highest average to distance (i.e., beta diversity) of values of 0.253 and 0.171, respectively.
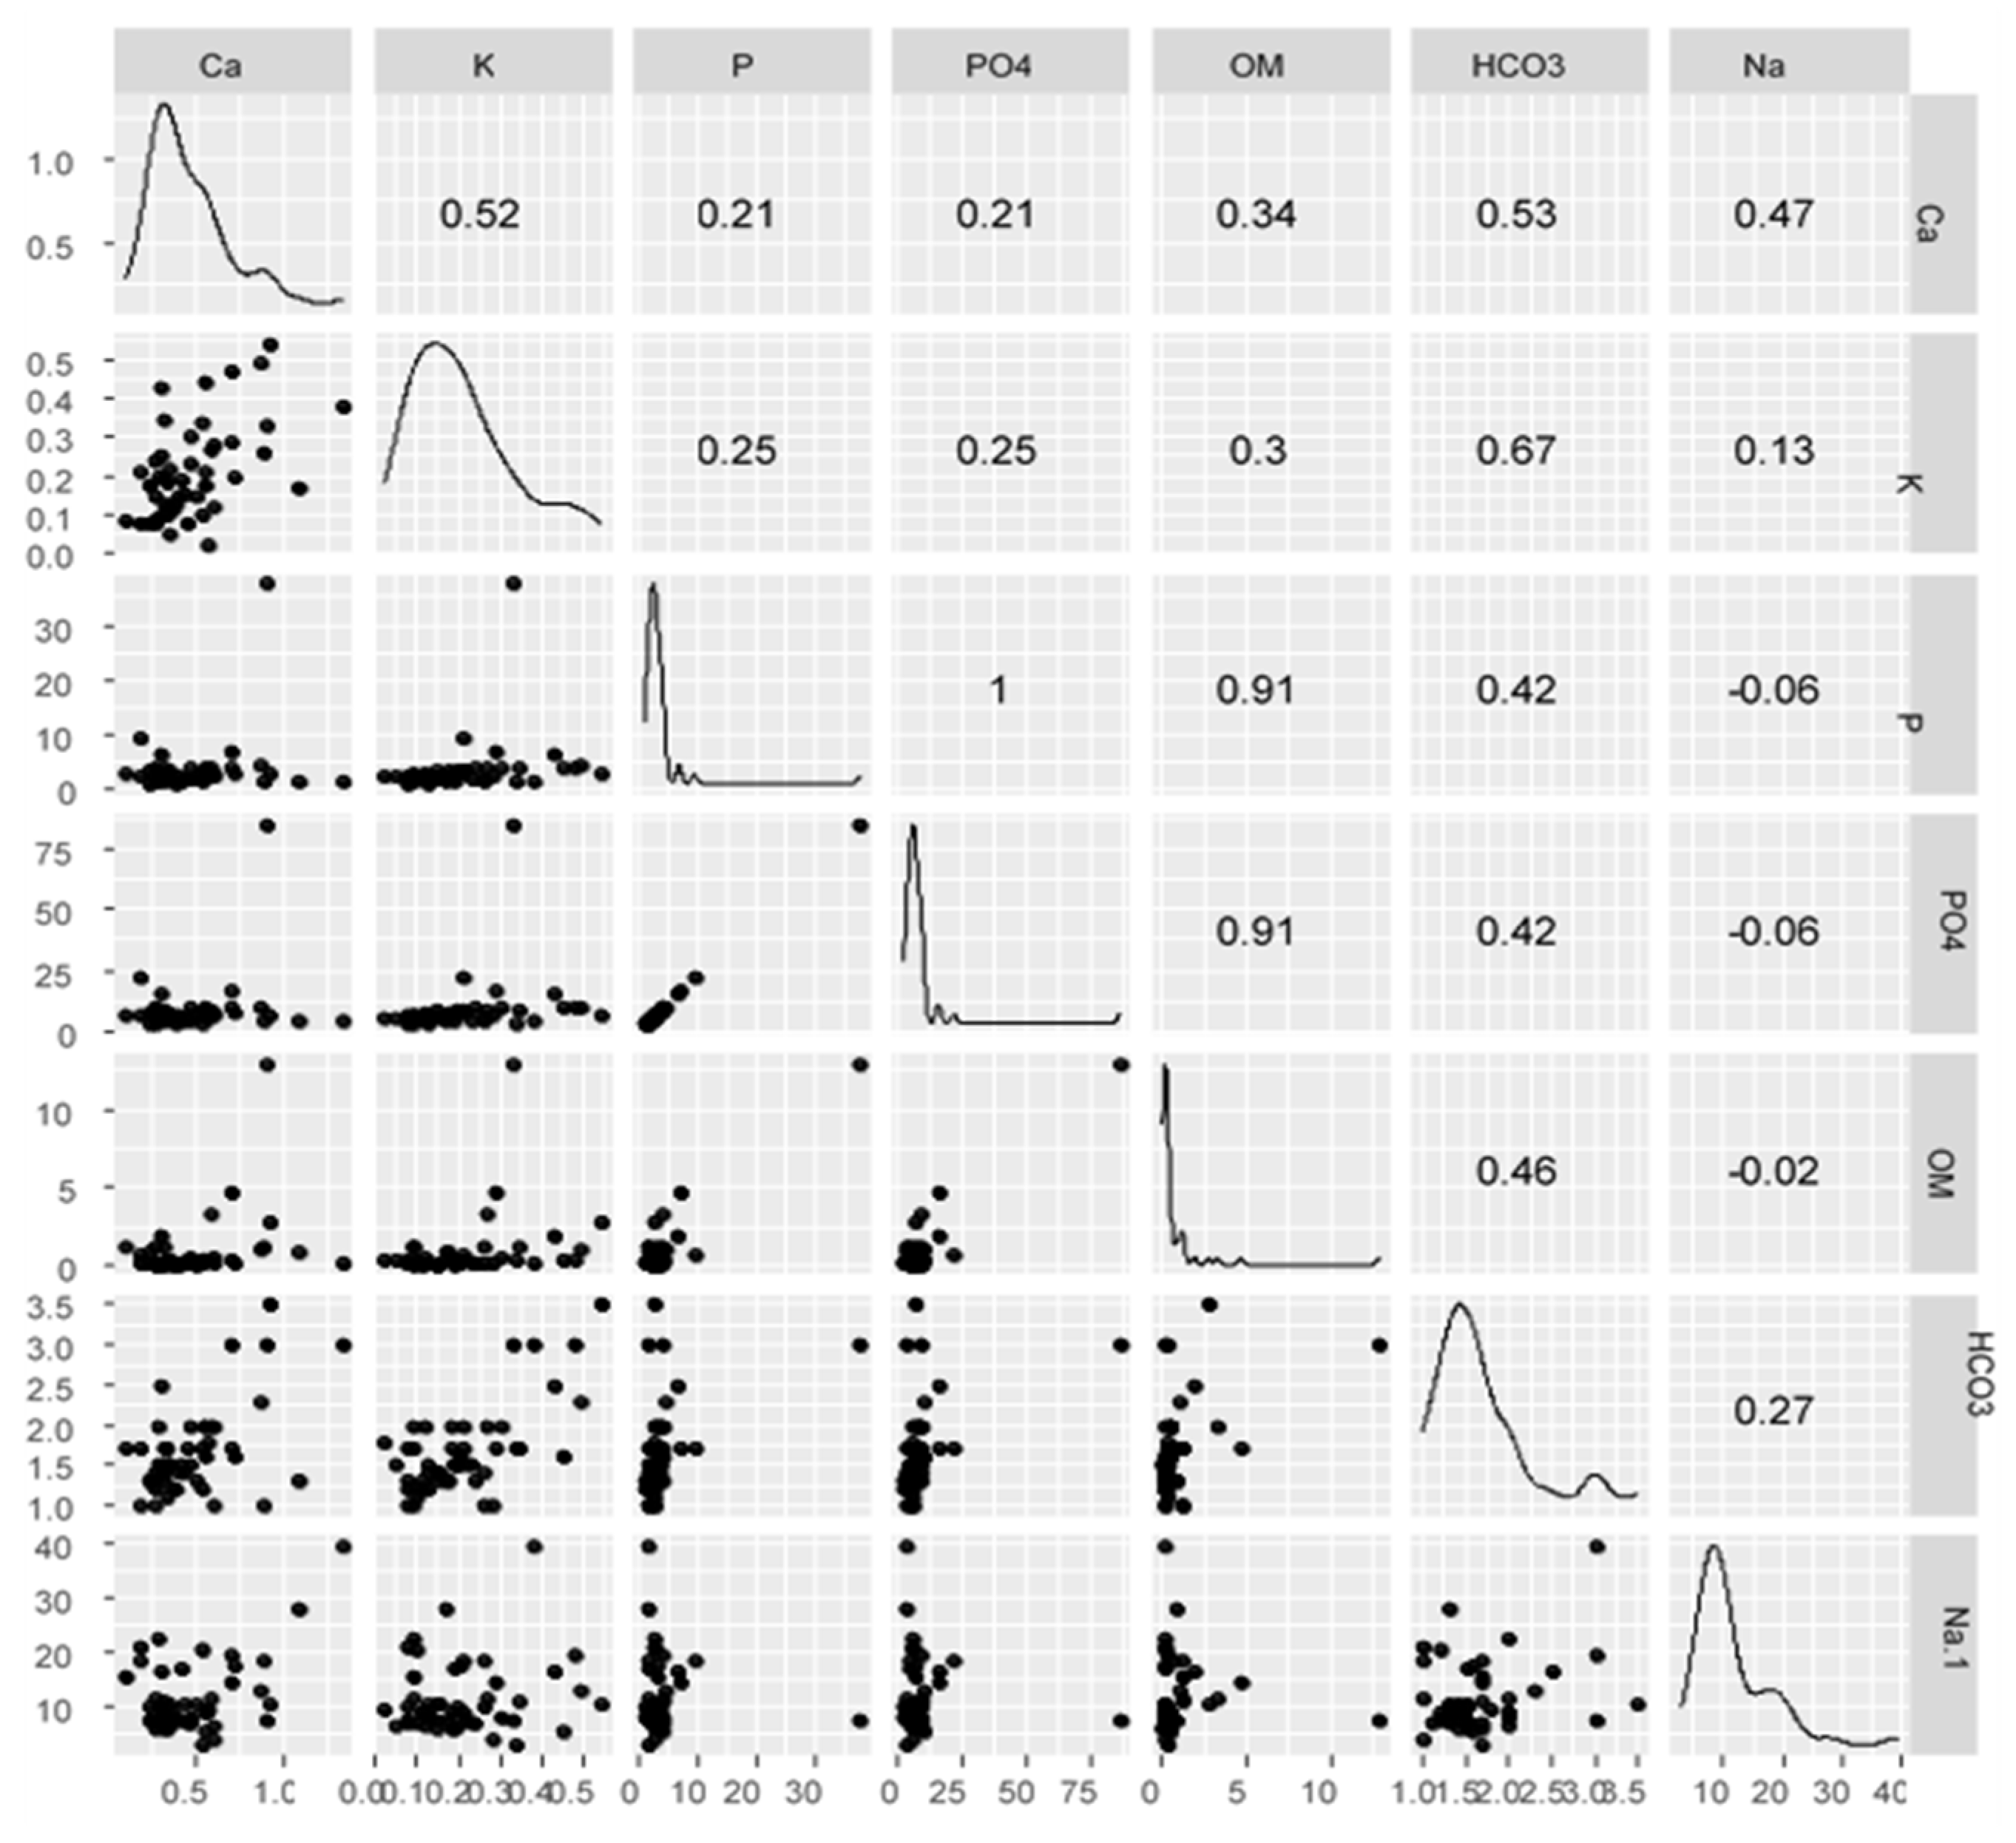
The relationship (Pearson’s test) between the soil chemical variables is depicted in Figure 4. Sodium showed a moderate strong relationship against calcium. The soil contents of the bicarbonate showed moderately strong relationship against organic matter, phosphorus, phosphate, potassium and calcium (but not the sodium). Both phosphorus and phosphate concentrations in the soil exhibited very strong relationship with the organic matter contents. Potassium has a slightly strong relationship with calcium.
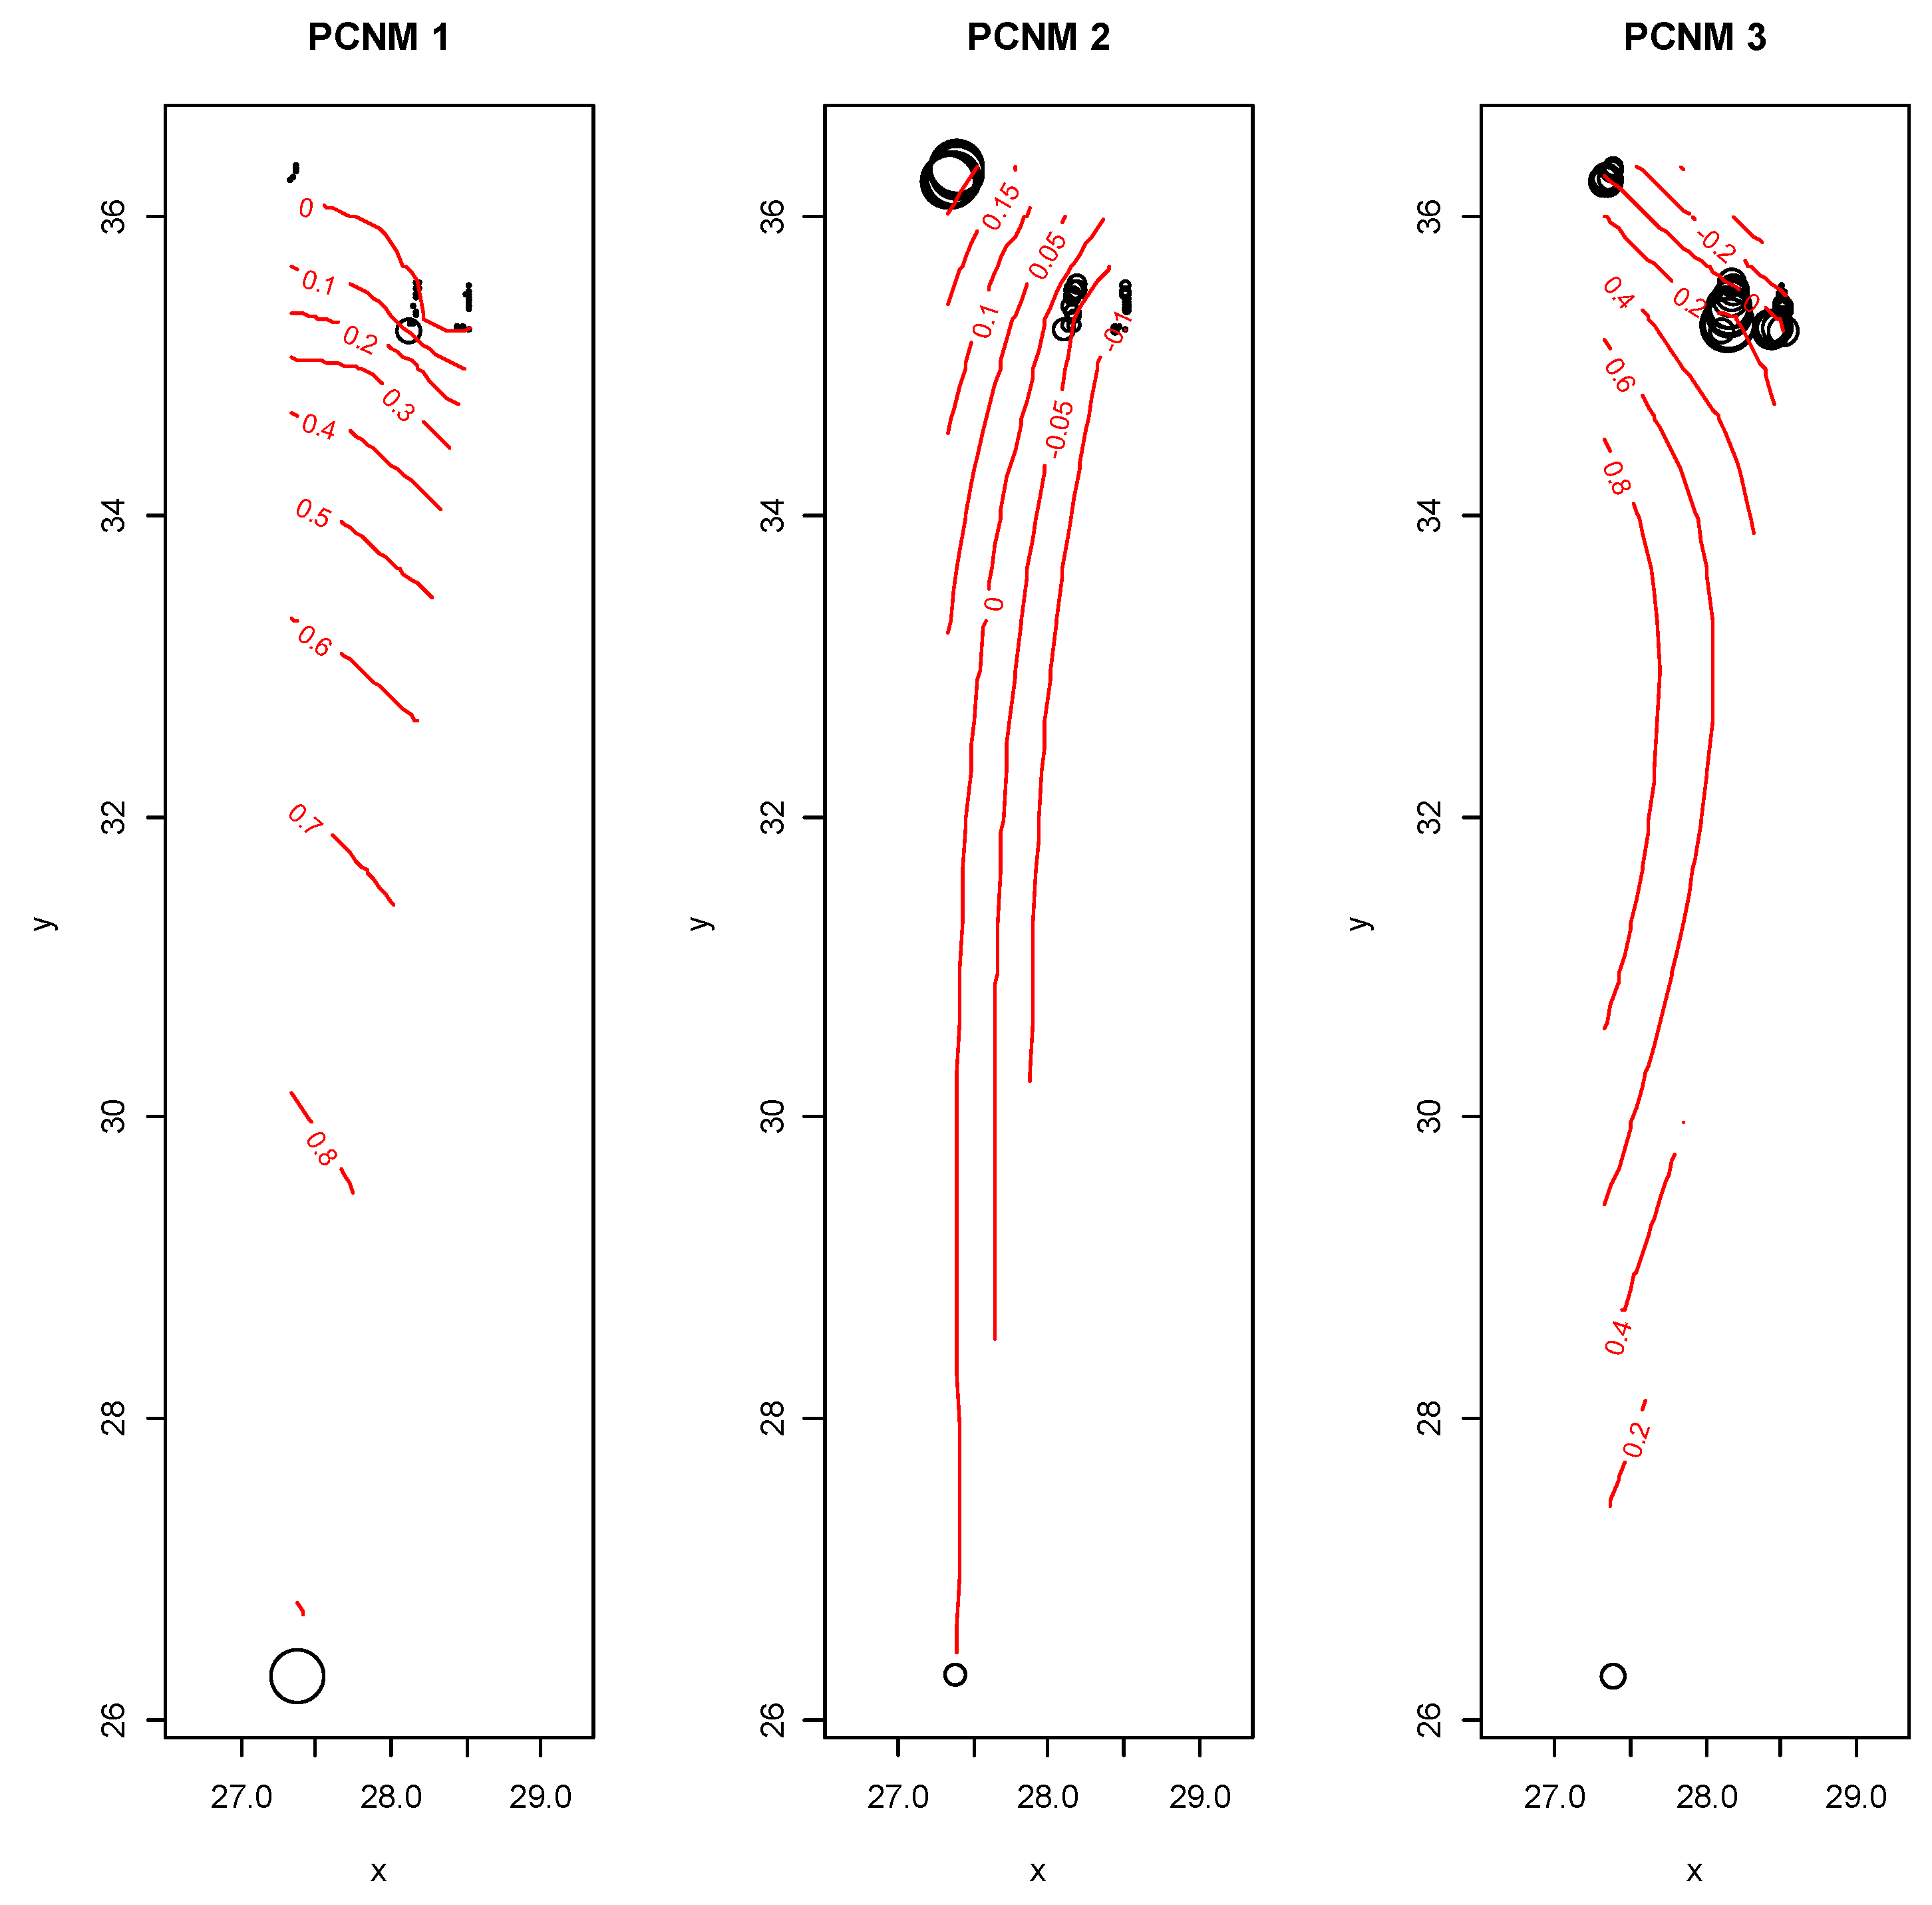
According to the PCNM analysis, 11 spatial vectors (variables) were resulted (positive). However, after running the forward selection procedures (using two stopping criteria), only 3 spatial vectors were retained (PCNM 1 (adj–R2 = 0.043, F = 5.201, p = 0.004), PCNM 2 (adj–R2 = 0.027, F = 3.97, p = 0.006) and PCNM 3 (adj–R2 = 0.019, F = 3.36, p = 0.007)). The selected PCNM vectors were arranged according to their importance and showed the association with plant taxonomic composition. The regression model of species composition versus that with selected spatial variables (i.e., vectors) was significant (F = 5.285, p < 0.001). The three selected PCNM axes are shown in Figure 5.
The linear models between the selected spatial variables (PCNM vectors) and physical and chemical variables of the soil are presented in Table 4. In the first model, the first PCNM axis showed significant relationship with pH and potassium (adj–R2 = 0.175, p = 0.046). In the second model, the second PCNM axis had a significant relationship with organic matter and sodium (adj–R2 = 0.561, p < 0.001). Lastly, sodium was the only factor significantly correlated with the third PCNM axis (adj–R2 = 0.365, p = 0.002).

4. Discussion

Arid and semiarid regions in Saudi Arabia harbours diversity of annual and perennial plant species due to unique combinations of habitats and ecosystems [1,2,3,40,41,42,43]. In this study, 163 species belong to 124 genera, and 41 families were reported from the 5 sites in Tabuk region. This number of species is higher compared with the earlier study conducted by Al-Mutairi et al. [42], who reported a total of 96 species. However, 135 plant species were reported in the hyper-arid environment of “nafuds” sand dunes in the middle of Saudi Arabia [43]. In desert–wetland, Galal et al. [3] reported 142 species in Taif, southwestern region of Saudi Arabia. The variability in the number of recorded species reflects the remarkable plant diversity in this region [44,45]. Climate changes, as well as several anthropogenic activities, are threatening the natural diversity of plants in this region [46,47].
Based on the assumption of Al-Nafie [48], the low species/genera ratios are a common character of semi-arid vegetation, which indicates great plant diversity. In the present assessment, the flora of the study area was characterized with a high species/genera ratio (1.3), which is comparable to 1.3 detected in Wadi Turbah Zahran [49], 1.4 in Wadi Al-Sharaea and Wadi Al-Noman, Makkah (Elaidarous et al. [45] and Abdel Khalik et al. [1], respectively), and 1.9 in Taif’s desert wetlands [3]. Asteraceae, Brassicaceae, Fabaceae and Boraginaceae families comprised approximately 39% of the total species richness. This result coincided with those of Al-Yas et al. [44], Galal et al. [3] and Elaidarous et al. [45], who reported that the dominance of these families may indicate efficient seed dispersal of their taxa, high diversity, and wide distribution.
In this study, the highest alpha diversity was reported in Sharma, followed by Alawz, with values of 43 and 29.67, respectively. These two habitats are totally different in their topographical and environmental settings. Sharma is coastal area, while Alwaz is a mountainous area. Interestingly, the highest β diversity values were reported in Aldesah and Sharma with values of 0.253 and 0.171, respectively. High β diversity in these two sites suggesting habitat heterogeneity within these two sites, as demonstrated by Welter-Schultes and Williams [50], Cody [51], Kreft et al. [52] and Lozano et al. [53]. In addition, different regions may undergo different changes or anthropogenic stress leading to pronounced variability in the species composition and community structure [54].
Understanding the relationship between spatial variables and their contribution to the diversity and shaping the environmental settings became of great interest among ecologists recently (e.g., Hautier et al. [14]; Zhukov et al. [24]; Pineda et al. [55]). Globally, the number of ecological studies emphasized on the spatial patterns is growing. For example, Jones et al. [12] investigated the spatial and environmental drivers of pteridophytes species composition in tropical forests of Costa Rica. Lan et al. [27] determined the spatial patterns of trees community in tropical forests of China. In this region, however, there are a few studies tackled the issue of how spatially structured communities or environmental variables would affect plant diversity. For instance, Al-Mutairi and Al-Shami [56] studied the effect of spatial and environmental variables on plant species richness in several islands of Farasan Archipelago of Saudi Arabia.
In the present findings, only 4 PCNM were retained after forward selection with low adj–R2 (cumulatively about 0.090). This low adjusted R2 indicates poorly structured species composition by the spatial variables. Most of the reports demonstrated that plant communities are mostly structured by topographical and soil chemical and physical characteristics rather than spatial variables. Topographic variables on plant communities [27,56,57,58,59,60,61]. For instance, Jones et al. [12] investigated the effect of 20 soil chemical and physical on plant diversity and found that pH, Ca, Mg, C and N were the strongest parameters describing the variation in the floristic diversity. This was also in agreement with previous findings of Zhang et al. [60] (2010), as 40% of variation in plant diversity was described by the soil parameters. In Farasan Archipelago of Saudi Arabia, Al-Mutairi and Al-Shami [56] found that variation in the species richness of plants was mainly explained by environmental variables (26.3%).
In this study, certain soil chemical variables showed moderate–strong relationships with each other. This indicates strong associations between the soil profile parameters. Furthermore, pH, potassium, organic matter and sodium were spatially structured, as indicated in Table 4. These parameters reflect the variation in the topography and edaphic profiles of the different habitats and can be of great importance in structuring the plant communities. All these spatially structured variables have been previously reported as strong drivers of plant diversity in temperate, arid and semi-arid regions (for example, see Galal et al. [3]). Wang et al. [62] found that organic matter contents of the soil in addition to nitrogen and phosphorus contents were key factors structuring the plant communities in alpine meadows. This is in coincidence of previous reports such as Karst et al. [58], who suggested pH as a main factor explaining variation in floristic diversity.

5. Conclusions

It is concluded that Tabuk region harbours a remarkable diversity of plants. The variation in the species composition within a site or beta diversity was high in Aldesah. The spatial variables did show pronounced influence on the plant diversity. Soil variables of pH, potassium, organic matter and sodium were spatially structured, with strong potential in structuring the plant communities. The plant diversity in the studied sites is presently encountering critical anthropogenic activities, including urbanization, agriculture and grazing, resulting in significant deterioration in the natural biodiversity. Conservation programs should be designed and implemented immediately to protect this natural treasure.

Funding

This research received no external funding.

Institutional Review Board Statement

Not applicable.

Informed Consent Statement

Not applicable.

Data Availability Statement

Not applicable.

Conflicts of Interest

The author declares no conflict of interest.

References

  1. Abdel Khalik, K.; El-Sheikh, M.; El-Aidarous, A. Floristic diversity and vegetation analysis of wadi Al-Noman, Holy Mecca, Saudi Arabia. Turk. J. Bot. 2013, 37, 894–907. [Google Scholar] [CrossRef]
  2. Alsherif, E.A. Ecological studies of Commiphora genus (myrrha) in Makkah Region, Saudi Arabia. Heliyon 2019, 5, e01615. [Google Scholar] [CrossRef] [PubMed] [Green Version]
  3. Galal, T.M.; Al-Yasi, H.M.; Fadl, M.A. Vegetation zonation along the desert-wetland ecosystem of Taif Highland, Saudi Arabia. Saudi J. Biol. Sci. 2021, 28, 3374–3383. [Google Scholar] [CrossRef] [PubMed]
  4. Alfarhan, A.; Al-Turki, T.; Thomas, J.; Basahy, R.A. Annotated list to the flora of Farasan Archipelago, Southern Red Sea, Saudi Arabia. Taeckholmia 2002, 22, 1–33. [Google Scholar] [CrossRef]
  5. Lavorel, S.; Garnier, E. Predicting changes in community composition and ecosystem functioning from plant traits: Revisiting the Holy Grail. Funct. Ecol. 2002, 16, 545–556. [Google Scholar] [CrossRef]
  6. Zhang, T.; Guo, R.; Gao, S.; Guo, J.; Sun, W. Responses of Plant Community Composition and Biomass Production to Warming and Nitrogen Deposition in a Temperate Meadow Ecosystem. PLoS ONE 2015, 10, e0123160. [Google Scholar] [CrossRef]
  7. Qin, Y.; Adamowski, J.F.; Deo, R.C.; Hu, Z.; Cao, J.; Zhu, M.; Feng, Q. Controlling factors of plant community composition with respect to the slope aspect gradient in the Qilian Mountains. Ecosphere 2019, 10, 02851. [Google Scholar] [CrossRef]
  8. Kumordzi, B.B.; Wardle, D.A.; Freschet, G.T. Plant assemblages do not respond homogenously to local variation in environmental conditions: Functional responses differ with species identity and abundance. J. Veg. Sci. 2014, 26, 32–45. [Google Scholar] [CrossRef]
  9. Lu, X.; Freschet, G.T.; Kazakou, E.; Wang, Z.-W.; Zhou, L.-S.; Han, X. Contrasting responses in leaf nutrient-use strategies of two dominant grass species along a 30-yr temperate steppe grazing exclusion chronosequence. Plant Soil 2015, 387, 69–79. [Google Scholar] [CrossRef]
  10. Kougioumoutzis, K.; Kokkoris, I.P.; Panitsa, M.; Trigas, P.; Strid, A.; Dimopoulos, P. Plant Diversity Patterns and Conservation Implications under Climate-Change Scenarios in the Mediterranean: The Case of Crete (Aegean, Greece). Diversity 2020, 12, 270. [Google Scholar] [CrossRef]
  11. Kreft, H.; Jetz, W. Global patterns and determinants of vascular plant diversity. Proc. Natl. Acad. Sci. USA 2007, 104, 5925–5930. [Google Scholar] [CrossRef] [PubMed] [Green Version]
  12. Jones, M.M.; Tuomisto, H.; Borcard, D.; Legendre, P.; Clark, D.B.; Olivas, P.C. Explaining variation in tropical plant community composition: Influence of environmental and spatial data quality. Oecologia 2007, 155, 593–604. [Google Scholar] [CrossRef] [PubMed]
  13. Li, Q.; Yang, X.; Soininen, J.; Chu, C.-J.; Zhang, J.-Q.; Yu, K.-L.; Wang, G. Relative importance of spatial processes and environmental factors in shaping alpine meadow communities. J. Plant Ecol. 2011, 4, 249–258. [Google Scholar] [CrossRef] [Green Version]
  14. Hautier, Y.; Isbell, F.; Borer, E.T.; Seabloom, E.W.; Harpole, W.S.; Lind, E.M.; MacDougall, A.S.; Stevens, C.; Adler, P.B.; Alberti, J.; et al. Local loss and spatial homogenization of plant diversity reduce ecosystem multifunctionality. Nat. Ecol. Evol. 2018, 2, 50–56. [Google Scholar] [CrossRef] [PubMed]
  15. Schuldt, A.; Ebeling, A.; Kunz, M.; Staab, M.; Guimarães-Steinicke, C.; Bachmann, D.; Buchmann, N.; Durka, W.; Fichtner, A.; Fornoff, F.; et al. Multiple plant diversity components drive consumer communities across ecosystems. Nat. Commun. 2019, 10, 1460. [Google Scholar] [CrossRef] [PubMed] [Green Version]
  16. Fortin, M.J.; Dale, M.R.; Ver Hoef, J.M. Spatial Analysis in Ecology. In Wiley StatsRef: Statistics Reference Online; John Wiley & Sons: Hoboken, NJ, USA, 2014; pp. 1–13. [Google Scholar]
  17. Yang, H.; Flower, R.J.; Battarbee, R.W. Influence of environmental and spatial variables on the distribution of surface sediment diatoms in an upland loch, Scotland. Acta Bot. Croat. 2009, 68, 367–380. [Google Scholar]
  18. Vormisto, J.; Svenning, J.-C.; Hall, P.; Balslev, H. Diversity and dominance in palm (Arecaceae) communities in terra firme forests in the western Amazon basin. J. Ecol. 2004, 92, 577–588. [Google Scholar] [CrossRef]
  19. John, R.; Dalling, J.W.; Harms, K.E.; Yavitt, J.B.; Stallard, R.F.; Mirabello, M.; Hubbell, S.P.; Valencia, R.; Navarrete, H.; Vallejo, M.; et al. Soil nutrients influence spatial distributions of tropical tree species. Proc. Natl. Acad. Sci. USA 2007, 104, 864–869. [Google Scholar] [CrossRef] [Green Version]
  20. Vanneste, T.; Govaert, S.; De Kesel, W.; Berge, S.V.D.; Vangansbeke, P.; Meeussen, C.; Brunet, J.; Cousins, S.A.O.; Decocq, G.; Diekmann, M.; et al. Plant diversity in hedgerows and road verges across Europe. J. Appl. Ecol. 2020, 57, 1244–1257. [Google Scholar] [CrossRef]
  21. Hillebrand, H. On the Generality of the Latitudinal Diversity Gradient. Am. Nat. 2004, 163, 192–211. [Google Scholar] [CrossRef] [Green Version]
  22. Ricklefs, R.E. A comprehensive framework for global patterns in biodiversity. Ecol. Lett. 2004, 7, 1–15. [Google Scholar] [CrossRef] [Green Version]
  23. Lan, G.; Getzin, S.; Wiegand, T.; Hu, Y.; Xie, G.; Zhu, H.; Cao, M. Spatial distribution and interspecific associations of tree species in a tropical seasonal rain forest of China. PLoS ONE 2012, 7, e46074. [Google Scholar] [CrossRef] [PubMed]
  24. Zhukov, O.; Kunah, O.; Dubinina, Y.; Zhukova, Y.; Ganzha, D. The effect of soil on spatial variation of the herbaceous layer modulated by overstorey in an eastern European Poplar-willow forest. Ekologia 2019, 38, 253–272. [Google Scholar] [CrossRef] [Green Version]
  25. Pittarekki, M.; Lonati, M.; Enri, S.R.; Lombardi, G. Environmental factors and management intensity affect in different ways plant diversity and pastoral value of alpine pastures. Ecol. Indic. 2020, 115, 106429. [Google Scholar]
  26. Hegazy, A.; Demerdashb, M.-; Hosni, H. Vegetation, species diversity and floristic relations along an altitudinal gradient in south-west Saudi Arabia. J. Arid Environ. 1998, 38, 3–13. [Google Scholar] [CrossRef]
  27. Lan, G.; Hu, Y.-H.; Cao, M.; Zhu, H. Topography related spatial distribution of dominant tree species in a tropical seasonal rain forest in China. For. Ecol. Manag. 2011, 262, 1507–1513. [Google Scholar] [CrossRef]
  28. Valencia, R.; Foster, R.B.; Villa, G.; Condit, R.; Svenning, J.-C.; Hernandez, C.; Romoleroux, K.; Losos, E.; Magard, E.; Balslev, H. Tree species distributions and local habitat variation in the Amazon: Large forest plot in eastern Ecuador. J. Ecol. 2004, 92, 214–229. [Google Scholar] [CrossRef]
  29. Wyatt, J.L.; Silman, M.R. Distance-dependence in two Amazonian palms: Effects of spatial and temporal variation in seed predator communities. Oecologia 2004, 140, 26–35. [Google Scholar] [CrossRef]
  30. Chaudhary, S.A. Flora of the Kingdom of Saudi Arabia: Illustrated; Ministry of Agriculture and Water, National Herbarium, National Agriculture and Water Research Center: Riyadh, Saudi Arabia, 2000; Volume VI, 368p.
  31. Collenette, I.S. Wildflowers of Saudi Arabia; National Commission for Wildlife Conservation and Development: Riyadh, Saudi Arabia, 1999; Volume XXXII, 799p. [Google Scholar]
  32. Allen, S. Chemical Analysis for Ecological Materials; Blackwell Scientific Publications: Hoboken, NJ, USA, 1989. [Google Scholar]
  33. APHA. Water Environment Federation 2005. Standard Methods for the Examination of Water and Wastewater; American Public Health Association: Washington, DC, USA, 2005. [Google Scholar]
  34. Diniz-Filho, J.A.F.; Bini, L.M. Modelling geographical patterns in species richness using eigenvector-based spatial filters. Glob. Ecol. Biogeogr. 2005, 14, 177–185. [Google Scholar] [CrossRef]
  35. Borcard, D.; Legendre, P. All-scale spatial analysis of ecological data by means of principal coordinates of neighbour matrices. Ecol. Model. 2002, 153, 51–68. [Google Scholar] [CrossRef]
  36. R Development Core Team. R: A Language and Environment for Statistical Computing. 2008. Available online: http://www.R-project.org/ (accessed on 12 January 2022).
  37. Blanchet, F.G.; Legendre, P.; Borcard, D. Forward selection of explanatory variables. Ecology 2008, 89, 2623–2632. [Google Scholar] [CrossRef] [PubMed]
  38. Anderson, M.J. Distance-Based Tests for Homogeneity of Multivariate Dispersions. Biometerics 2006, 62, 245–253. [Google Scholar] [CrossRef] [PubMed]
  39. Schloerke, B.; Crowley, J.; Cook, D.; Briatte, F.; Marbach, M.; Thoen, E.; Elberg, A.; Larmarange, J. GGally: Extension to ’ggplot2’, R package version 1.4.0; 2018, p. 361. Available online: https://CRAN.R-project.org/package=GGally (accessed on 12 January 2022).
  40. El-Ghani, M.M.A.; Amer, W.M. Soil-vegetation relationships in a coastal desert plain of southern Sinai, Egypt. J. Arid. Environ. 2003, 55, 607–628. [Google Scholar] [CrossRef]
  41. Al-Turki, T.; Al-Olayan, H. Contribution to the flora of Saudi Arabia: Hail region. Saudi J. Biol. Sci. 2003, 10, 190–222. [Google Scholar]
  42. Al-Mutairi, K.; Al-Shami, S.; Khorshid, Z.; Moawed, M. Floristic diversity of Tabuk Province, North Saudi Arabia Arabia. J. Anim. Plant Sci. 2016, 26, 1019–1025. [Google Scholar]
  43. El-Sheikh, M.A.; Thomas, J.; Arif, I.A.; El-Sheikh, H.M. Ecology of inland sand dunes ‘‘nafuds” as a hyper-arid habitat, Saudi Arabia: Floristic and plant associations diversity. J. Biol. Sci. 2021, 28, 1503–1513. [Google Scholar] [CrossRef]
  44. Al-Yasi, H.M.; Alotaibi, S.S.; Al-Sodany, Y.M.; Galal, T.M. Plant distribution and diversity along altitudinal gradient of Sarrawat Mountains at Taif Province, Saudi Arabia. Biosci. Res. 2019, 16, 1198–1213. [Google Scholar]
  45. Elaidarous, A.A.; Osman, H.E.; Galal, T.M.; El-Morsy, M.H. Vegetation–environment relationship and foristic diversity of Wadi Al-Sharaea, Makkah Province, Saudi Arabia. Rend. Lincei Sci. Fis. 2022, in press. [Google Scholar] [CrossRef]
  46. El-Sheikh, M.A.; Al-Shehri, M.A.; Alfarhan, A.H.; Alatar, A.A.; Rajakrishnan, R.; Al-Rowaily, S.L. Threatened Prunus arabica in an ancient volcanic protected area of Saudi Arabia: Floristic diversity and plant associations. Saudi J. Biol. Sci. 2019, 26, 325–333. [Google Scholar] [CrossRef]
  47. Alharthi, A.; El-Sheikh, M.A.; Elhag, M.; Alatar, A.A.; Abbadi, G.A.; Abdel-Salam, E.M.; Arif, I.A.; Baeshen, A.A.; Eid, E.M. Remote sensing of 10 years changes in the vegetation cover of the northwestern coastal land of Red Sea, Saudi Arabia. Saudi J. Biol. Sci. 2020, 27, 3169–3179. [Google Scholar] [CrossRef]
  48. Al-Nafie, A. Phytogeography of Saudi Arabia. Saudi J. Biol. Sci. 2008, 15, 159–176. [Google Scholar]
  49. Al-Robai, S.A.; Mohamed, H.A.; Howladar, S.M.; Ahmed, A.A. Vegetation structure and species diversity of Wadi Turbah Zahran, Albaha area, southwestern Saudi Arabia. Ann. Agric. Sci. 2017, 62, 61–69. [Google Scholar] [CrossRef]
  50. Welter-Schultes, F.W.; Williams, M.R. History, island area and habitat availability determine land snail species richness of Aegean islands. J. Biogeogr. 1999, 26, 239–249. [Google Scholar] [CrossRef]
  51. Cody, M.L. Plants on Islands: Diversity and Dynamics on a Continental Archipelago; University of California Press: Oakland, CA, USA, 2006. [Google Scholar]
  52. Kreft, H.; Jetz, W.; Mutke, J.; Kier, G.; Barthlott, W. Global diversity of island floras from a macroecological perspective. Ecol. Lett. 2007, 11, 116–127. [Google Scholar] [CrossRef] [PubMed]
  53. Lozano, F.D.; Price, J.; Otto, R.; Fernández-Palacios, J.M. Using taxonomic and phylogenetic evenness to compare diversification in two Island Floras. Perspect. Plant Ecol. Evol. Syst. 2010, 12, 93–106. [Google Scholar] [CrossRef]
  54. Gwali, S.; Okullo, P.; Hafashimana, D.; Byabashaija, D.M. Taxonomic Diversity, Distinctness, and Abundance of Tree and Shrub Species in Kasagala Forest Reserve in Uganda: Implications for Management and Conservation Policy Decisions. Trop. Conserv. Sci. 2010, 3, 319–333. [Google Scholar] [CrossRef]
  55. Pineda, A.; Bortolini, J.C.; Rodrigues, L.C. Effects of space and environment on phytoplankton distribution in subtropical reservoirs depend on functional features of the species. Aquat. Sci. 2021, 84, 5. [Google Scholar] [CrossRef]
  56. Al-Mutairi, K.A.; Al-Shami, S.A. Spatial and Environmental determinants of plant diversity in Farasan Archipelago, Saudi Arabia. Life Sci. J. 2014, 11, 61–69. [Google Scholar]
  57. Bartha, S.; Czárán, T.; Oborny, B. Spatial constraints masking community assembly rules: A simulation study. Folia Geobot. 1995, 30, 471–482. [Google Scholar] [CrossRef]
  58. Karst, J.; Gilbert, B.; Lechowicz, M.J. Fern Community Assembly: The Roles of Chance and the Environment at Local and Intermediate Scales. Ecology 2005, 86, 2473–2486. [Google Scholar] [CrossRef]
  59. Zhao, C.-M.; Chen, W.-L.; Tian, Z.-Q.; Xie, Z.-Q. Altitudinal Pattern of Plant Species Diversity in Shennongjia Mountains, Central China. J. Integr. Plant Biol. 2005, 47, 1431–1449. [Google Scholar] [CrossRef]
  60. Zhang, C.; Zhao, X.; von Gadow, K. Partitioning temperate plant community structure at different scales. Acta Oecologica 2010, 36, 306–313. [Google Scholar] [CrossRef]
  61. Zhang, R.; Liu, T.; Zhang, J.-L.; Sun, Q.-M. Spatial and environmental determinants of plant species diversity in a temperate desert. J. Plant Ecol. 2016, 9, 124–131. [Google Scholar] [CrossRef] [Green Version]
  62. Wang, C.T.; Long, R.J.; Wang, Q.J.; Ding, L.M.; Wang, M.P. Effects of altitude on plant-species diversity and productivity in an alpine meadow, Qinghai–Tibetan plateau. Aust. J. Bot. 2007, 55, 110–117. [Google Scholar] [CrossRef] [Green Version]
Figure 1. Relative number of species of the families recorded in five studied sites of Tabuk, Saudi Arabia.
Sustainability 14 02611 g001
Figure 2. The first two CAP axes showing the variation in the species composition among the five sites.
Sustainability 14 02611 g002
Figure 3. Boxplot of the average distance to the centroid (homogeneity of multivariate dispersions, beta diversity) of plant species composition in five study sites.
Sustainability 14 02611 g003
Figure 4. Collinearity matrix among the soil chemical variables. Numbers represent the Pearson’s coefficient of correlation, while black dots represent the measured variables. Black lines in the diagonal represent the densities of all the variables. This graph was realized with the function “ggpairs” in the GGally R package [39].
Sustainability 14 02611 g004
Figure 5. Ordination of the significant vectors of principal coordinates of neighbour matrices (PCNM). The X and Y axes represent latitude and longitude of the 5 sites, respectively. Three PCNM axes (spatial vectors) retained after forward selection procedures. Plotting the PCNM axes were performed using the function ordisurf of the Vegan package in R program 4.2.1.
Sustainability 14 02611 g005
Table 1. Mean ± SD and the one-way ANOVA results of the soil chemical variables in five studied sites at Tabuk region.
AldesahAlzetahAlawzHarrahSharmaF-Valuep
pH7.860 ± 0.2127.983 ± 0.1298.167 ± 0.0257.963 ± 0.2187.947 ± 0.2701.0400.434
EC (mS cm−1) 0.340 ± 0.3120.193 ± 0.0350.207 ± 0.0670.260 ± 0.0950.200 ± 0.0500.4990.737
Sand74.253 ± 21.91189.117 ± 6.88586.267 ± 9.62177.237 ± 5.69086.830 ± 6.4500.9300.785
Silt21.043 ± 19.6618.230 ± 4.45110.847 ± 9.35818.970 ± 5.69810.960 ± 5.1520.8600.520
Clay4.703 ± 2.3182.653 ± 2.6862.887 ± 2.7943.793 ± 0.8542.210 ± 2.1260.5820.683
Na (mg kg−1)0.948 ± 0.7080.512 ± 0.3310.564 ± 0.3670.451 ± 0.2780.568 ± 0.1330.6830.620
Ca (mg kg−1)0.610 ± 0.6280.482 ± 0.0970.292 ± 0.0470.640 ± 0.2570.378 ± 0.1710.6600.634
K (mg kg−1)0.227 ± 0.1420.218 ± 0.1980.122 ± 0.0290.337 ± 0.1820.261 ± 0.1720.7390.587
P (mg kg−1)4.567 ± 4.2913.067 ± 1.0973.100 ± 0.6082.470 ± 0.5904.100 ± 2.6510.3970.806
PO4 (mg kg−1)10.458 ± 9.8277.023 ± 2.5127.099 ± 1.3935.656 ± 1.3509.389 ± 6.0720.3790.806
OM (%)0.341 ± 0.2600.211 ± 0.1730.079 ± 0.0361.022 ± 1.5042.117 ± 1.0513.0870.048
HCO3 (mg kg−1)1.933 ± 0.9711.333 ± 0.2311.633 ± 0.3212.000 ± 1.3231.833 ± 0.7640.3170.860
Table 2. Mean ± SD and the one-way ANOVA results comparing diversity indices means of plants in the arid region (Tabuk, Saudi Arabia). The values with (*) are significantly different at p = 0.05.
AldesahAlzetahAlawzHarahSharmaANOVA
Alpha diversity8.333 ± 3.51226.333 ± 4.50929.667 ± 4.16324.000 ± 1.00043.000 ± 4.58332.204 *
Shannon2.490 ± 0.4683.742 ± 0.1753.866 ± 0.1483.657 ± 0.0434.246 ± 0.11122.927 *
Evenness1.541 ± 0.0451.617 ± 0.0051.621 ± 0.0041.615 ± 0.0021.629 ± 0.0029.391 *
Brillouin1.317 ± 0.3542.359 ± 0.1582.472 ± 0.1352.282 ± 0.0382.823 ± 0.10326.188 *
Menhinick2.843 ± 0.6145.119 ± 0.4395.438 ± 0.3894.898 ± 0.1026.551 ± 0.35331.823 *
Margalef3.426 ± 0.9727.734 ± 0.9728.448 ± 0.8847.236 ± 0.22011.160 ± 0.90732.774 *
Equitability_J1.214 ± 0.0331.148 ± 0.0071.143 ± 0.0051.151 ± 0.0021.130 ± 0.00414.042 *
Chao-139.333 ± 30.333354.000 ± 120.003446.333 ± 119.822288.833 ± 24.002932.000 ± 193.84523.717 *
Table 3. Eigenvalues of the first four PCoA axes for each study site.
PCoA1PCoA2PCoA3PCoA4
Aldesah−0.492−0.039−0.165−0.129
Alzetah−0.357−0.09840.1720.163
Alawz0.1150.5040.043−0.035
Harah0.445−0.232−0.2430.054
Sharma0.239−0.0820.335−0.131
ANOVAF = 3.876
p = 0.0491
Table 4. The linear regression models at significance level of p < 0.05 between the spatial variables (PCNM vectors) and the soil environmental variables.
PCNM1PCNM2PCNM3
Estimate ± SEt pEstimate ± SEt pEstimate ± SEt p
Intercept−3.224 ± 1.984−1.6240.1130.509 ± 1.2810.3980.6930.053 ± 1.7260.0320.975
pH0.375 ± 0.0522.4730.018−0.192 ± 0.978−1.9640.057−0.124 ± 0.1.2−0.3000.355
EC−0.522 ± 0.578−0.9020.373−0.073 ± 0.038−0.1950.8470.511 ± 0.5031.0160.316
Sand0.007 ± 0.0130.0550.9560.011 ± 0.0081.3010.2010.008 ± 0.0150.6980.489
Silt0.004 ± 0.0160.2240.8240.013 ± 0.0101.3200.1950.014 ± 0.0141.0410.304
Ca−0.008 ± 0.019−0.3990.692−0.169 ± 0.126−1.3480.1860.006 ± 0.1690.0380.970
K0.693 ± 0.2312.9970.0050.213 ± 0.1791.4280.1610.026 ± 0.2010.1310.896
P0.005 ± 0.0041.2360.2240.004 ± 0.0271.5800.1220.003 ± 0.0040.0680.394
PO4−0.002 ± 0.002−1.2630.261−0.002 ± 0.001−1.5700.124−0.001 ± 0.002−0.0630.393
OM0.002 ± 0.0290.6790.5010.116 ± 0.0195.6600.001−0.008 ± 0.025−0.2970.768
HCO30.046 ± 0.0510.7910.434−0.070 ± 0.038−1.8580.0710.095 ± 0.0501.8850.067
Na0.138 ± 0.1141.2370.2230.172 ± 0.0722.3920.022−0.354 ± 0.097−3.6580.001
A dj-R20.1750.5610.365
F-value1.9446.7033.565
p0.0460.0000.002
Publisher’s Note: MDPI stays neutral with regard to jurisdictional claims in published maps and institutional affiliations.