Article

Effect of Increasing Import Competition from China on the Local Labor Market: Evidence from Sweden

1
Division of Chinese Foreign Affairs and Commerce, Hankuk University of Foreign Studies, Seoul 02450, Korea
2
Department of Economics and Statistics, Linnaeus University, 351 95 Växjö, Sweden
3
Independent Researcher, Los Angeles, CA 90012, USA
4
Department of Economics, Pusan National University, Busan 46241, Korea
*
Author to whom correspondence should be addressed.
Sustainability 2022, 14(5), 2631; https://doi.org/10.3390/su14052631
Submission received: 28 January 2022 / Revised: 18 February 2022 / Accepted: 21 February 2022 / Published: 24 February 2022

Abstract

:
Import competition from low-wage countries can worsen labor market conditions in high-income countries and undermine the sustainability of free international trade. We examine the effect of increasing manufacturing imports from China on manufacturing employment and wage earnings distribution in Sweden by employing a two-stage least squares estimation method. The empirical results indicate that, except for the transportation sector, the effect of increasing import exposure to China on manufacturing and non-manufacturing employment growth is statistically insignificant. Regarding earnings distribution, we find that the earnings growth of low-wage workers in the manufacturing sector is not significantly influenced by an increase in Chinese imports. However, wage earners at the median level or above are positively impacted by trade shocks from China. These findings have implications for seeking policy alternatives that can enhance the sustainability of the international trade order.

1. Introduction

International trade frictions between countries intensify, tariff barriers rise, and retaliatory tariffs are frequently imposed. Free trade is shrinking, and protectionism is strengthening. These recent trends threaten the sustainability of the international trade order.
The rapid growth of trade between low- and high-income economies raises concerns about its impact on domestic labor markets in high-income countries [1,2,3,4,5,6,7,8,9,10,11,12,13,14]. The increase in China’s trade with other countries has dramatically changed world trade patterns over the past few decades, leading policymakers to rethink domestic labor market adjustments and their implications. China’s share of world exports has increased from less than 2% in 1998 to 14.7% in 2020, with China’s primary export being manufactured goods (UNCTAD, https://unctad.org/news/china-rise-trade-titan (accessed on 3 February 2022)). In the United States, for instance, numerous manufacturing jobs have been lost to increasing imports of manufactured goods from China [15].
Like other high-income countries, the Sweden-China trade has also increased substantially. According to the National Board of Trade (https://statistikblad.kommerskollegium.se (accessed on 3 February 2022)), in 2020, the total value of Sweden’s exports to China amounted to SEK 78 billion, and imports from China amounted to SEK 85.2 billion, which constitutes 5.5% and 6.2% of Sweden’s total exports and imports, respectively. Among the imported goods from China, machinery and apparatus (39.0%) and manufacturers of metals (7.1%) are the two largest categories. Given the large size of the Sweden-China trade, trade with China will likely influence the Swedish labor market, particularly employment in the manufacturing sector. 
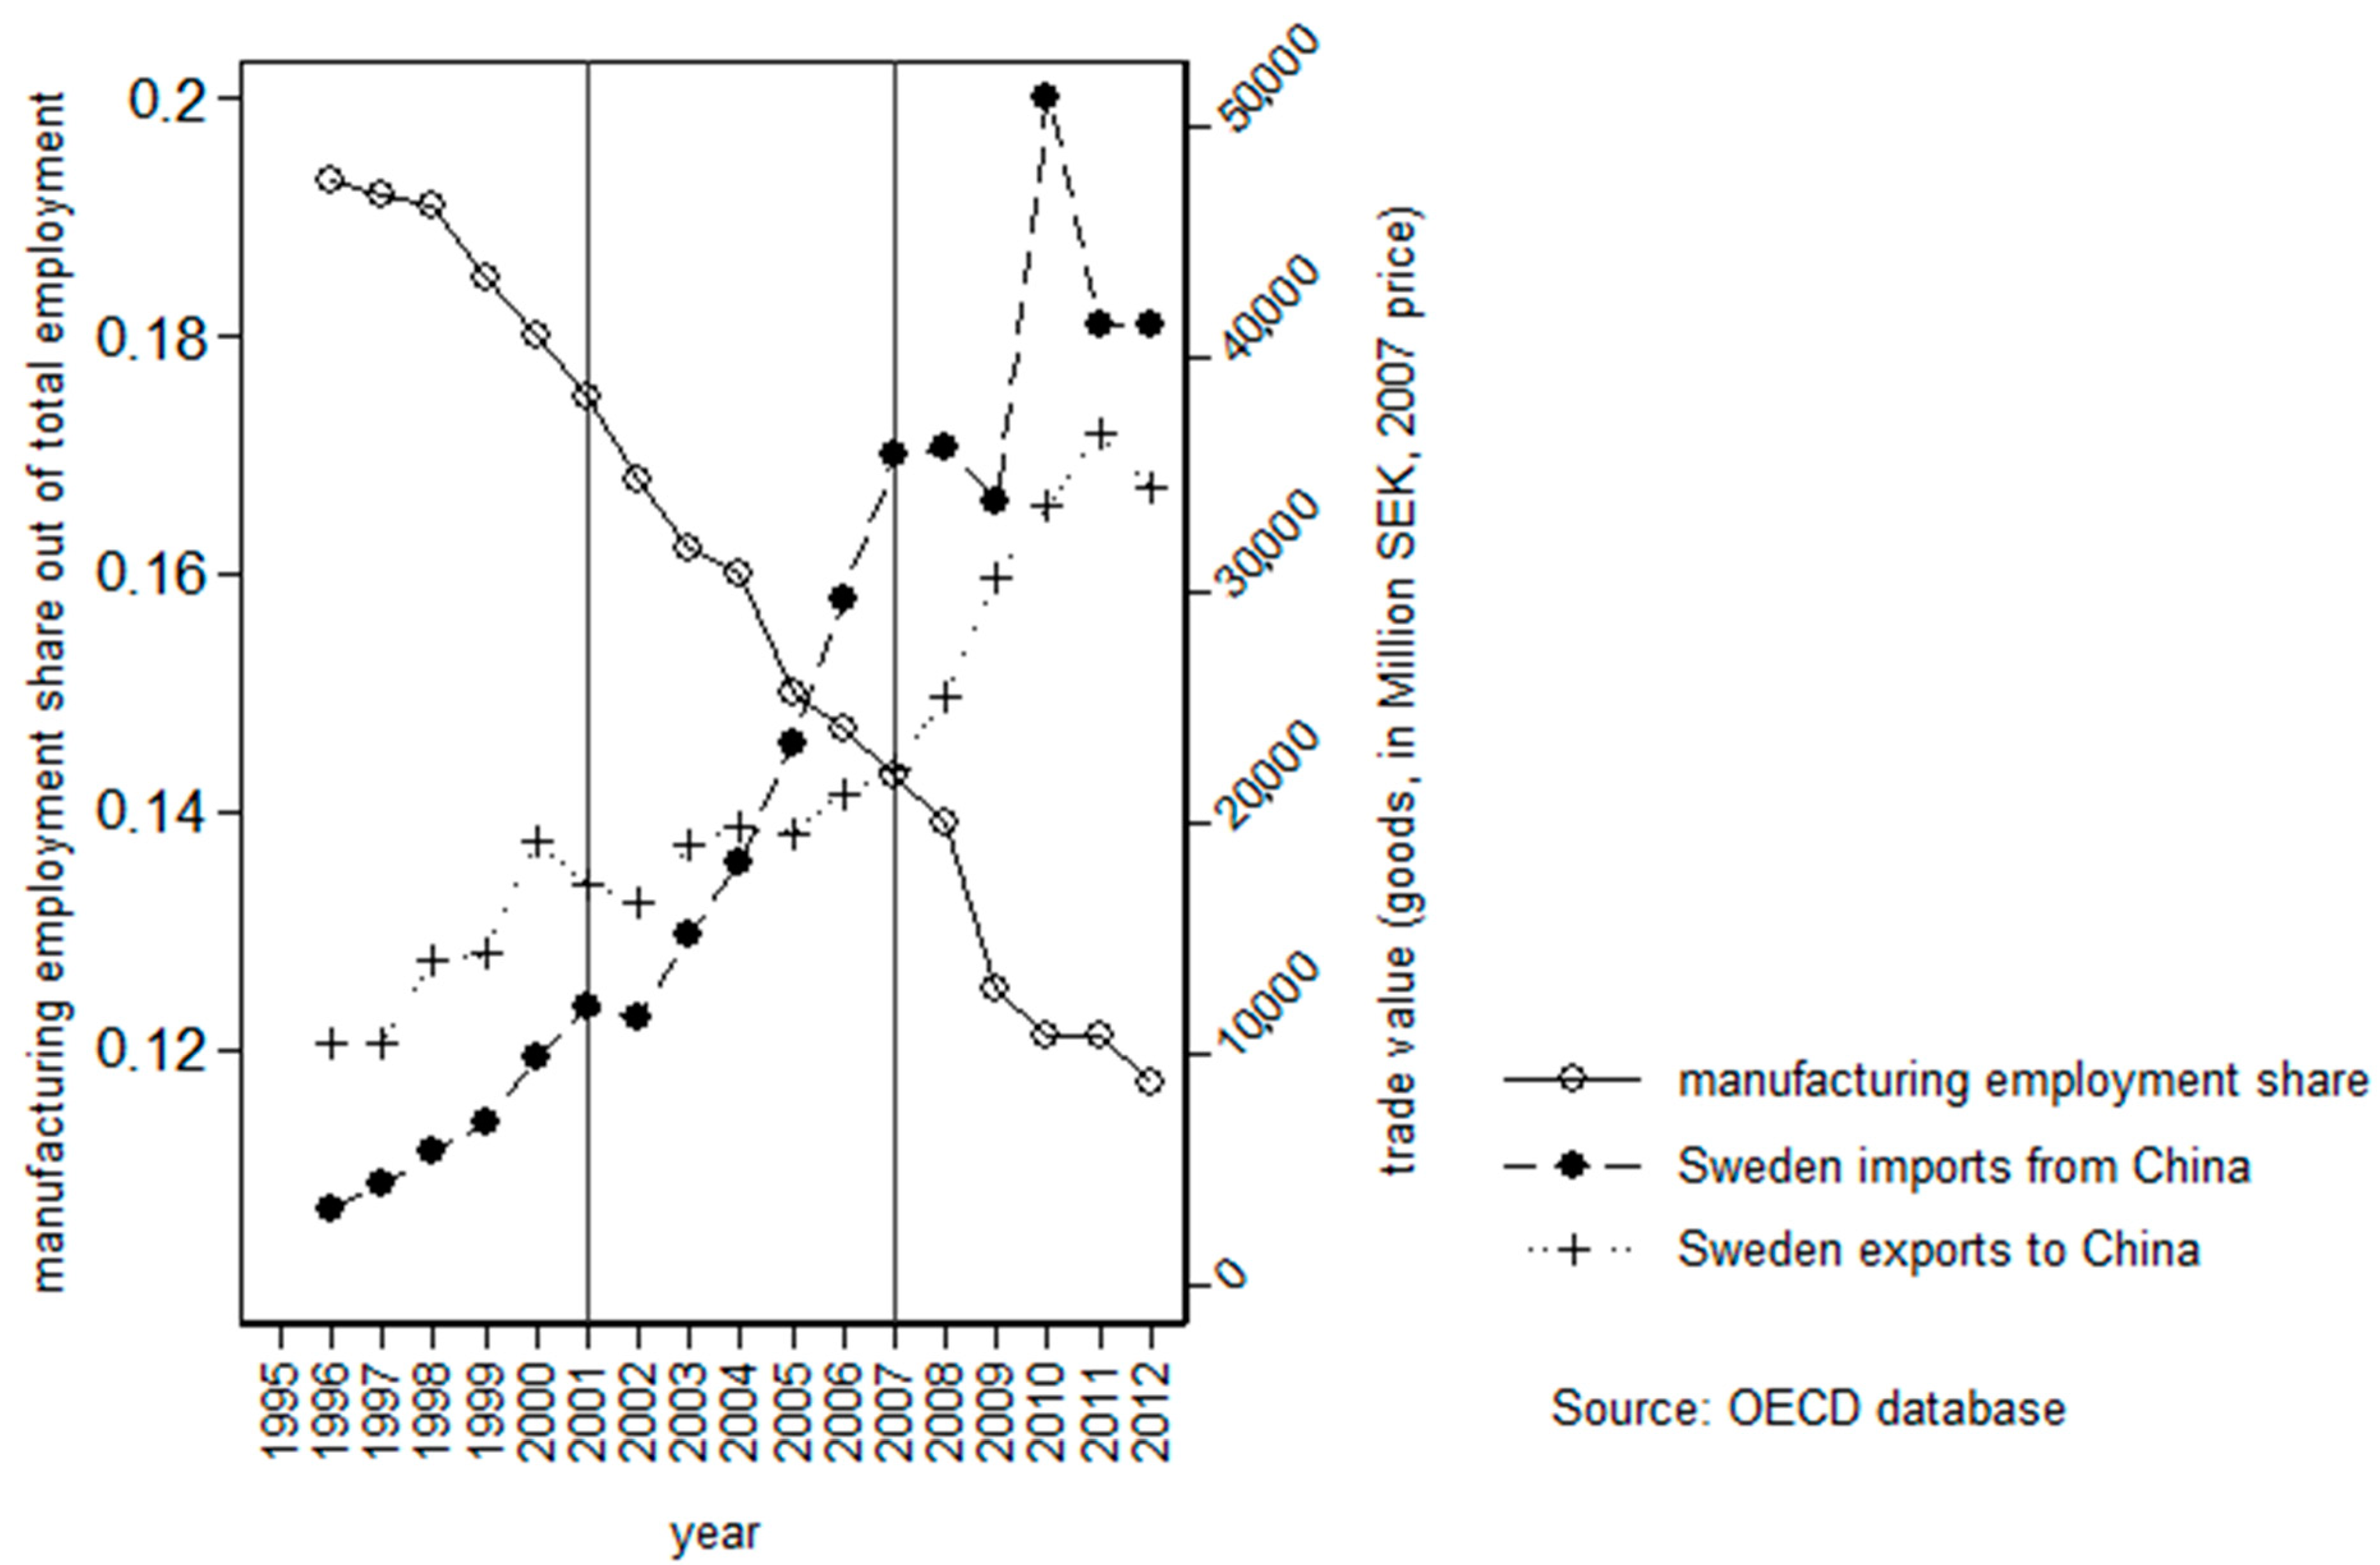
Figure A1 in the appendix displays the Swedish manufacturing employment and the total import/export between China and Sweden during 1996–2012 from the OECD database.
To the best of our knowledge, none of the previous studies have explored the employment effect of import shocks from China on the Swedish labor market. Sweden is an interesting country to study the effects of trade shocks in the labor market as the size of the manufacturing industry, in terms of GDP percentage, is similar to that of the United States. However, its labor market differs from that of the United States in many features related to institutional settings and the skill composition of the labor force (according to World Bank data, manufacturing was approximately 13% and 12% of GDP in 2016 for Sweden and the United States, respectively. See the studies of Adermon and Gustavsson [16] and Anxo [17] for the discussion of skill upgrade and job polarization in Sweden during the last two decades). Specifically, the institutional setting of the Swedish labor market is characterized by a strong influence of unions, a centralized wage bargaining system, a high level of employment protection, and generous unemployment benefits that include several labor market programs. The Swedish population has experienced a clear education and skill upgrade during the last two decades [17]. Low-skilled workers are known to be vulnerable in the labor market under new technology and trade, and Sweden has adequately dealt with the role of technology and globalization through labor policy intervention [18]. In 1997, Sweden launched an adult education program called ‘Knowledge Lift’ to enhance the skill levels of low-skilled workers. During 1997–2000, approximately 10% of the labor force participated in the program [19].
Furthermore, the increasing import trade competition from low-income countries has also raised concerns about the income of wage earners in high-income countries [10]. Compared to other developed countries, Sweden has a high union rate and a considerably high coverage of collective agreement. According to the Swedish National Mediation Office, approximately 90% of wage earners are covered by the collective agreement. Non-union workers may also be covered by the collective agreement. Previous research has shown that the influence of international trade on wages is also related to whether workers are covered by the collective agreement [20]. Some studies have examined the impact of increased import competition from China on the average wage earnings growth [21,22]. However, the average wage earnings growth is not informative about how trade affects workers at various levels of the wage earnings distribution. Therefore, in this study, we also try to contribute to the growing literature on the effect of trade shocks on earnings, emphasizing the distributional earnings effect.
In this context, it is worth investigating whether the increasing import competition from China would affect employment and earnings distribution in a welfare state like Sweden. Therefore, we contribute to the active literature on the labor market effects of increasing import competition from low-income countries in high-income countries. Using the high-quality employment and earnings data from the Population Register from Statistics Sweden (https://www.scb.se/en/finding-statistics/statistics-by-subject-area/trade-in-goods-and-services/ (accessed on 2 February 2022)) during 1996–2007, we investigate the effect of increasing import shocks from China on employment and wage distribution (Our research study is based on population-wide register data from Statistics Sweden and trade data from the UN Comtrade Database (https://comtrade.un.org/ (accessed on 2 February 2022)) for 1996–2007). When investigating the employment effect, we employ the methodology of Autor et al. [15], which relies on the construction of a labor market index subject to trade shocks. The advantage of the implemented methodology lies in its analytical design, which enables the investigation of the causal effects of trade shocks on manufacturing sector employment and the indirect impact of trade shocks on employment outside the manufacturing sector. To investigate the effects of import shocks from China on the earnings distribution, we follow a two-step quantile regression method recently developed by Chetverikov et al. [22].
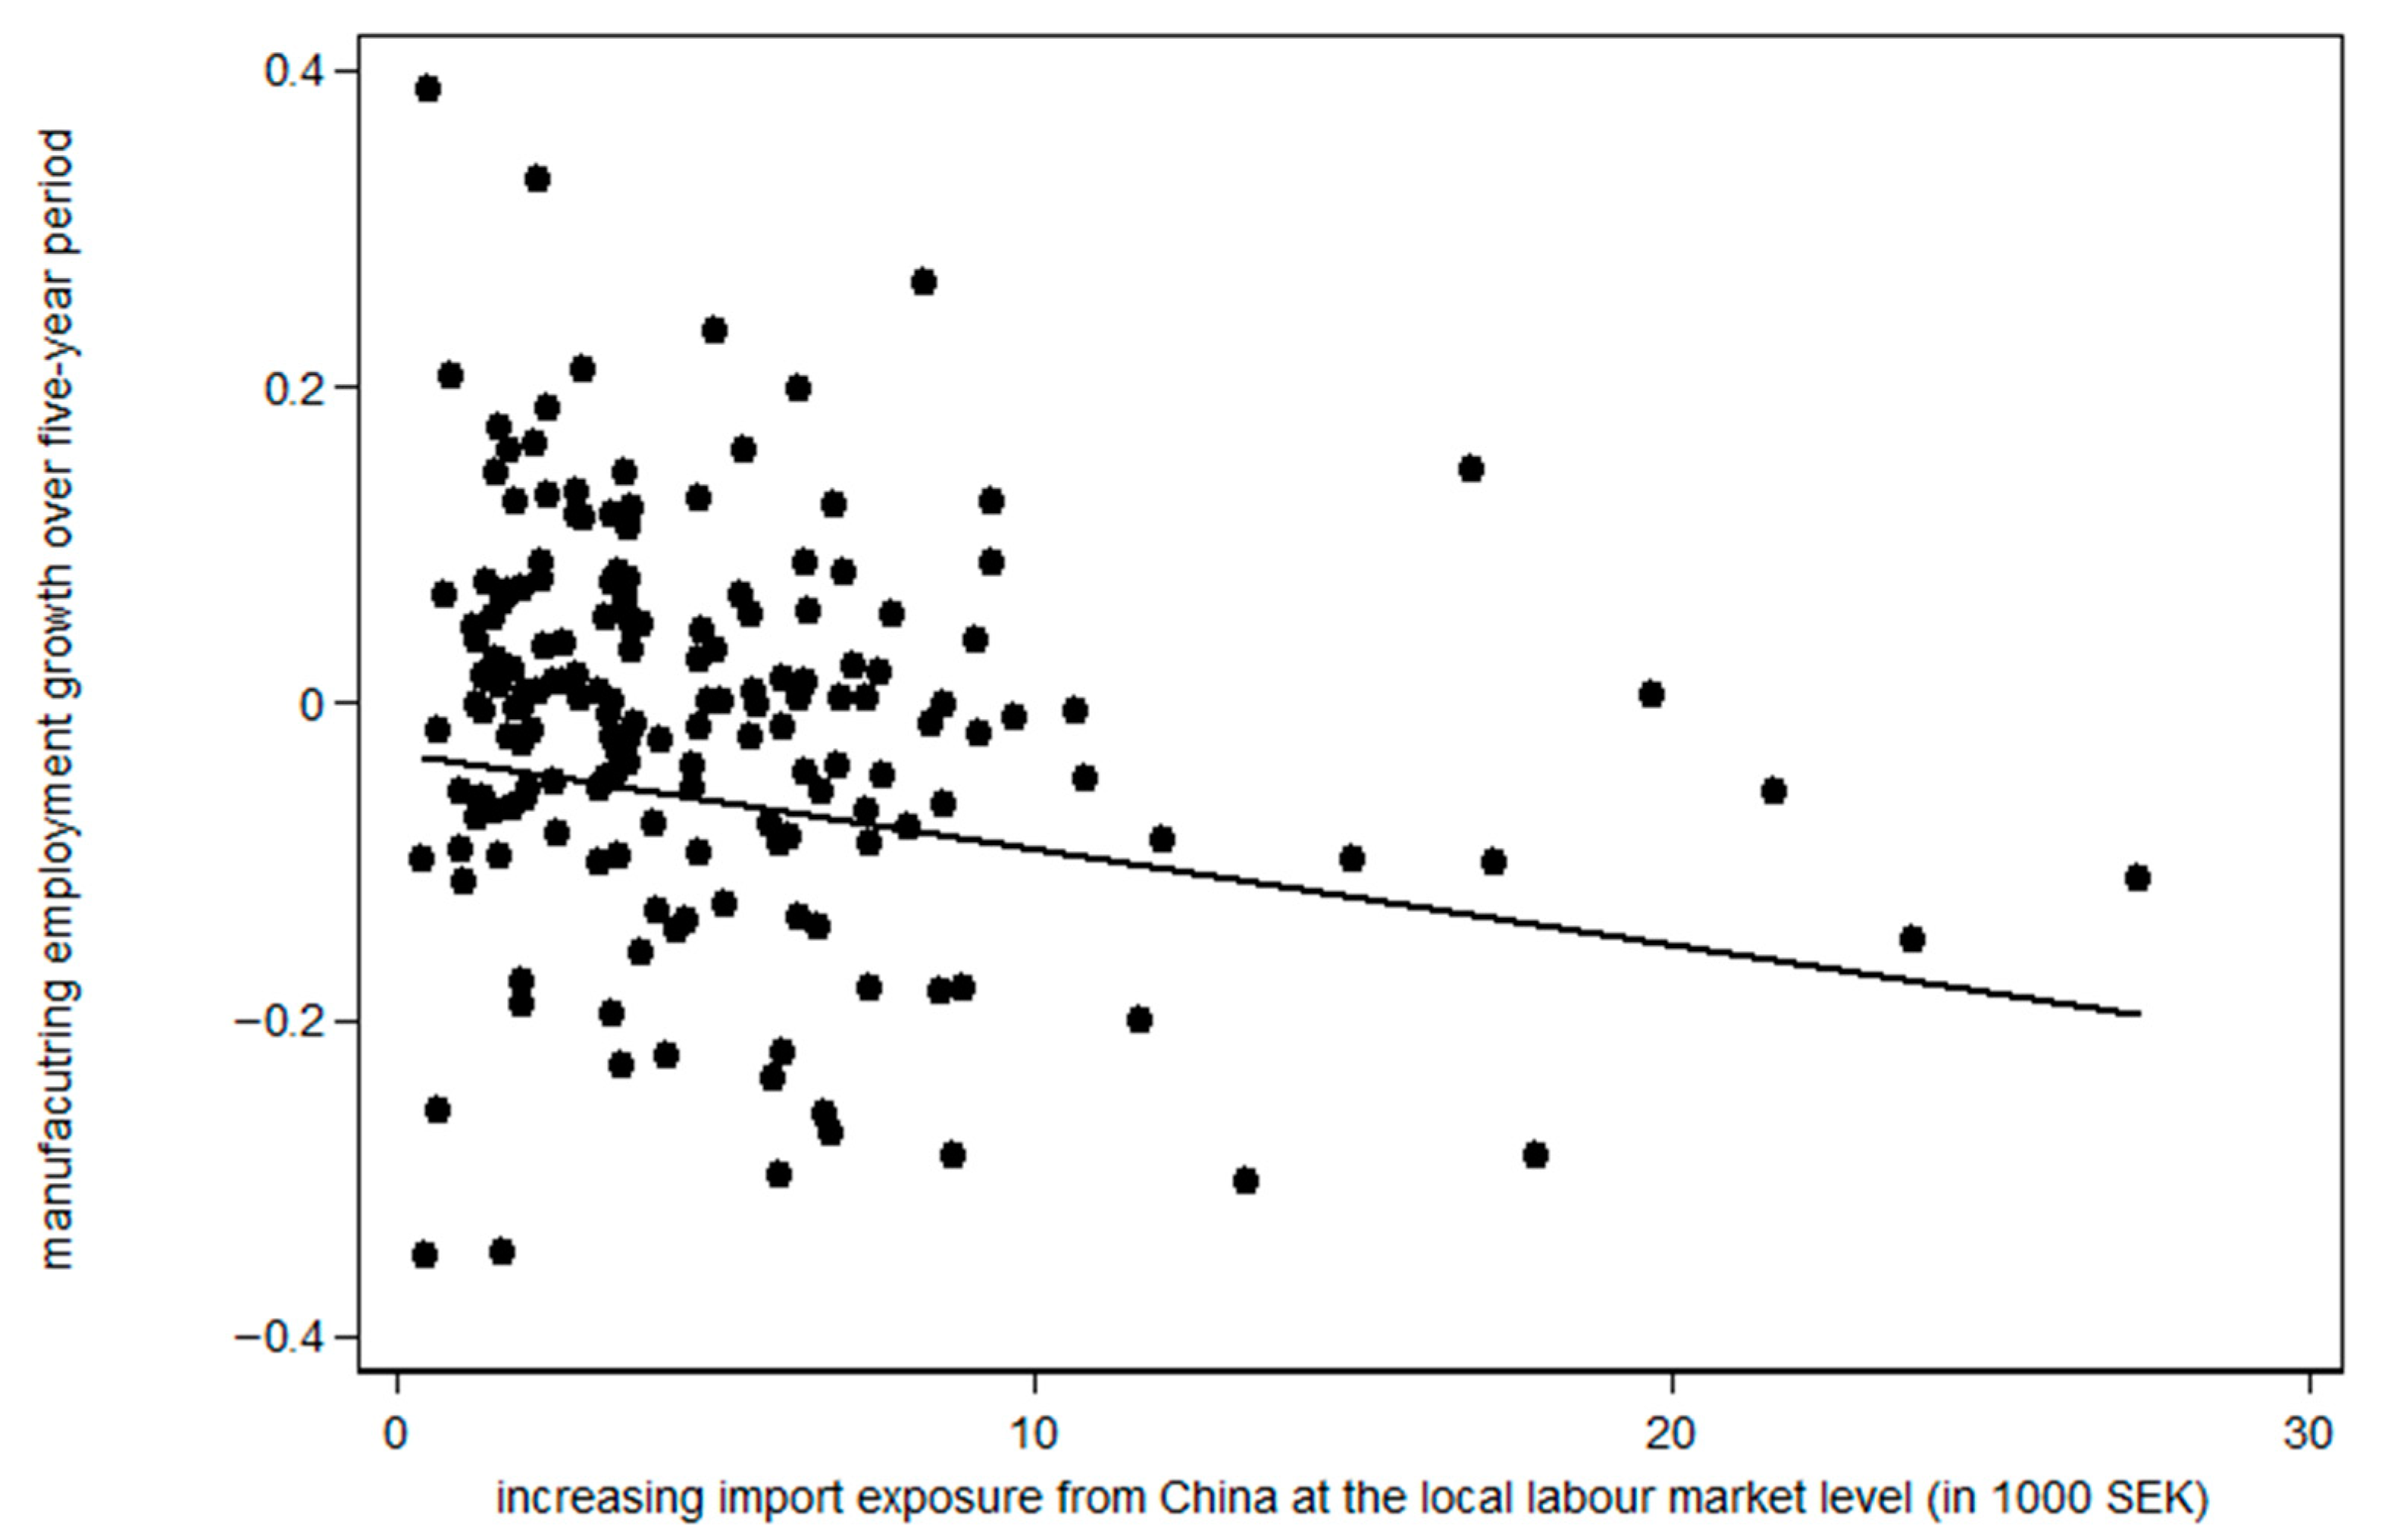
Our main research contribution to the relevant literature stems from the original findings, which state that the impact of increasing import exposure to China on the Swedish manufacturing and non-manufacturing employment growth is statistically insignificant, except for the transportation sector. Regarding earnings distribution, we find that the earnings growth of low-wage earners in the manufacturing sector is not significantly influenced by an increase in Chinese imports. However, wage earners at the median level or above are positively impacted by trade shocks from China. These findings are important to policymakers who regulate the labor market because a high unionization rate, uniform pay increments within the industry, and a centralized wage bargaining system are considered a means to protect the domestic labor market from import competition by low-income countries. Our study also appears to be the first to investigate the effect of trade shocks from China on the Swedish labor market.
The remainder of this paper is organized as follows. Section 2 presents a review of the literature on the international trade and labor market. Further, Section 3 explains the dataset used and the methodology implemented in the analysis. Moreover, Section 4 discusses the empirical results, and Section 5 explains the empirical results. Finally, Section 6 concludes the paper.

2. Literature Review

The theoretical motivation to measure the effect exerted by international trade on a local labor market stems from the studies conducted by Wood [23] and Autor et al. [15,24]. They argue that the exogenous shock of a global economic factor, such as international trade, would affect regional economies in developed countries through two channels: export supply, and import–demand shocks. The export-supply shock from the low-income country reduces the demand for labor force in the industry exposed to trade in the high-income country. The labor force is expected to flow from the sector exposed to international trade to other sectors not exposed to this trade or go into unemployment. Under the import-demand shock, import demand would be expected to increase high-income countries’ regional wages and employment on the traded sector. The labor force is expected to flow from the sectors not engaged in international trade to those involved in it or opt for unemployment. They also demonstrate that increasing import competition from China leads to large negative effects (e.g., unemployment) on regional labor markets concentrated in the manufacturing sector and the cumulative earnings of low-skilled workers. However, the size of the effect is weaker among high-skilled workers. Other studies from Spain [25] and France [26] have arrived at similar findings—the manufacturing sector’s labor force is the most affected by Chinese import competition.
Studies from Northern European countries have revealed mixed evidence regarding the impact of increased Chinese import competition on manufacturing sector workers’ wages. The magnitude of the import trade’s impact on manufacturing employment in these countries is even smaller [21,26,27]. Bilici [26] shows that a Chinese import shock has little impact on the UK manufacturing labor market employment and wages. The study by Dauth et al. [27], within the Eastern European context, identifies a negative effect on local labor markets resulting from the trade with Eastern European countries rather than China. Balsvik et al. [21], using data from Norway, indicate that increasing import exposure from China negatively affects manufacturing employment. However, the estimated effect is quantitatively much smaller than that identified by Autor et al. [15]. Balsvik et al. [21] do not find any negative impact on earnings, which they attribute to Norway’s centralized wage bargaining. Using Danish employer–employee data from 1995 to 2007, Utar [28] finds that increasing the import of Chinese textile products has a negative employment effect in the Danish textile and clothing industry. Furthermore, the study finds that firms react to the Chinese competition by moving away from China’s more competitive products and becoming more skill-oriented. Baziki [29] finds that the rise of Chinese import penetration significantly increases the earnings of high-skilled workers, probably due to the upgrade of a firm’s production technology, in response to the competition from low-income countries, which, in turn, creates a demand for skilled workers. However, that study does not find strong evidence supporting the negative effect of Chinese increasing import penetration on the earnings of low-skilled workers. Baziki et al. [30] show a trade-induced skill upgrade in the Swedish information and communication technologies sector. Blyde et al. [4] investigate how local labor markets in Mexico adjusted in response to an increase in Chinese import competition. They reveal that the negative employment influence was more severe on production workers than on nonproduction workers, implying that workers with lower skills were more severely influenced. Liang [6] examines the effect of trade shocks on US manufacturing employment. The study shows that job creation obtained from the exports to different markets is comparable to the job destruction attributed to the import competition from China. Citino and Linarello [10] examined the influence of increased import competition from China on the Italian manufacturing labor market. They reveal that workers initially employed in more exposed industries did not suffer long-term losses in terms of lower earnings or more discontinuous careers. Lang et al. [11] analyze the effects of Chinese import exposure in the US. They discover that average mental, physical, and general health worsens in local labor markets exposed to greater import competition.

3. Data and Methodology

3.1. Data

To construct the aggregate variables at the local labor market level, we use population wide data ‘Longitudinal integration database for health insurance and labor market studies’ from 1996 to 2007 compiled by Statistics Sweden (SCB), which contain information about residents who are 16 years of age and above. Further, the dataset includes information about individual employment status, socio-economic characteristics, and workplace information such as industries and locations. We deliberately decided the sample period from 1996 to 2007 to avoid the ambiguous effect of complex shocks (such as the 2008 global financial crisis, 2010 European sovereign debt crisis, 2015 European refugee crisis, 2018 U.S.-China trade war and COVID-19 pandemic), as those shocks may be complicated to disentangle the trade-employment effect under these market circumstances. Moreover, during the sample period, China had its fastest increase in the export of manufacturing goods to the world [31]. Consequently, if the local labor market is shocked by imports from China, it is likely to have a greater negative effect on employment during the selected period. We divide the main sample of observations into two five-year periods: 1996–2001 and 2002–2007. We focus on the population between the ages of 16 and 64, which is defined as the working-age population. We measure the employment rate as the ratio between the total number of gainfully employed (both waged and self-employed) and the total working-age population.
To classify the number of manufacturing workers and calculate the total employment at the local labor market level, we link the individual employment status with industry classification and workplace location. Similarly, we use the region of workplace when computing other employment measurements at the local labor market level, such as the share of non-manufacturing employment of working age population. Based on Statistics Sweden’s 2003 local labor market classification, we divide approximately 290 Swedish municipalities into 87 local labor markets. We use this information to construct our variables at the local labor market level. The main dependent variable of the regression model comprises five-year manufacturing employment growth. This growth rate is measured in the natural logarithm form. The individual wage-earning data are measured at the annual level. We utilize this data to compute the five-year wage-earning growth rate in the manufacturing sector, at different percentiles, and at the local labor market level.
The trade data from China to Sweden are drawn from the UN Comtrade Database with the six-digit Harmonised System (HS) product level. These data are commonly used in the relevant literature [15,24,25,27,29]. Similar to Baziki [29], we map the six-digit product-level HS trade data into the Swedish Industrial Classification at the two-digit level. To match the product from HS 1996 to ISIC rev. 3, we first use the correspondence table between the HS 1996 and Central Product Classification (CPC) version 1.0. Next, we use the correspondence table between CPC version 1.0 and ISIC rev. 3. All the correspondence tables are from Eurostat (http://ec.europa.eu/eurostat/ (accessed on 2 February 2022)). We identify 22 manufacturing industries in the entire Swedish manufacturing sector. To analyze the effect of trade on Swedish manufacturing employment, we combine the registered data from 1996, 2001, 2002, and 2007 from Statistics Sweden with the corresponding year’s Sweden–China trade data from the UN Comtrade Database. The original trade flow, measured in US dollars, is converted to SEK based on the annual exchange rate from the Swedish Central Bank. All trade values are measured at 2007 prices.

3.2. Methodology

To examine the China–Sweden trade effect on the Swedish manufacturing employment, we exploit the variation in the increasing import exposure at the local labor market level. Our empirical test follows the approach of Autor et al. [15]. Using the trade data from the UN Comtrade Database, we construct an index to measure the intensifying import competition from China across local labor markets as follows Definition of all variables used in the section are summarized in Table A1):
Δ i m p e x p o s u r e r t = 1 E r t j E r j t E j t Δ i m j t S W E C H N
where r , j , and t represent the local labor market, the two-digital manufacturing industry, and year, respectively. The ratio E r j t E j t measures the share of national industry employment in industry j in the local labor market r at the start of the period (year t ). The parameter E r t denotes the total employment in the local labor market r . The term Δ i m j t S W E C H N represents the change in Chinese imports to Sweden observed in industry j between years t and t + 1 , which stands for the five-year change in imports from China to Sweden. Thus, the constructed variable measures the increasing import exposure from China per worker in the local labor market over the five-year period. To estimate the effect of the increasing import competition on the local labor market, similar to Autor et al. [15], we take the first difference instrument variable approach. The empirical model specification is as follows:
Δ ln ( Y r t ) = β 0 + β 1 Δ i m p e x p o s u r e r t + X r t α + γ t + ε r t  
where r stands for the local labor market, and t stands for the period. The variable Δ ln ( Y r t ) refers to the five-year growth rate of the manufacturing employment share in the local labor market. The parameter of interest is β 1 , which identifies the effect of increasing penetration of Chinese imports at the local labor market level on the outcome variables. The variable X is a set of control variables at the local labor market level that includes the percentage of manufacturing employment, such as college graduates, (foreign-born) immigrants, and women. All variables are measured at the beginning of each period. These variables are included to control for the initial difference in local labor market characteristics, as more educated people, female workers, and immigrants are more likely to work in the service sector. The parameter γ t is a period dummy variable that accounts for common shocks at the national level. As we take the first difference of the dependent variable and the variable of interest, the time-invariant local labor market fixed effect is automatically controlled.
One concern of the model is that the realized import exposure can be endogenous, which correlates with the unobserved industry demand shock [15]. In other words, Δ i m p e x p o s u r e r t can be correlated with the error term. For instance, the estimated β 1 can be downward-biased if both employment and imports have a positive correlation with the unobserved impact on product demand. To isolate the ‘export supply shock’ from China, we apply the empirical strategy proposed by Autor et al. [15]. Specifically, we use the increase in the flow of imports of industry j goods from China to other high-income countries as the instrument variable to predict Swedish imports from China. The instrument variable is constructed as follows:
Δ i m p e x p o s u r e r t O = 1 E r t 3 j E r j t 3 E j t 3 Δ i m j t O T H E R S C H N
In Equation (3), the term i m j t O T H E R S C H N stands for the changes in import flows from China to other high-income countries in industry j and year t . As discussed by Autor et al. [15], employment may react to anticipate exposure to future trade. Thus, to mitigate the simultaneity bias, the increase in import flow from China is distributed according to the lagged industry employment share. We specifically use lagged employment shares from three years prior to the start of each period—1993 and 1999. The validity of instruments depends on the assumption that China’s exports to other high-income countries would affect the Swedish local labor market only through its exogenous rise, which is independent of the domestic demand shock in Sweden. In other words, the link between Swedish imports from China and Chinese exports to other high-income countries is driven solely by China’s export supply shock. The massive increase in productivity after the economic reform in China contributes to China’s export capacity. Between 1998 and 2007, the annual average of total factor productivity (TFP) growth rate is between 3% and 5%, and the rate is much higher in the manufacturing sector, which is approximately 13% a year [32]. Moreover, among the manufacturing industries, the growth of TFP is considerably higher among the metal, machinery, and high-technology industries than other light or processing industries from 1999 to 2007 [33]. Additionally, China, by joining the WTO, significantly reduced its trading cost with other countries due to lower trade barriers [34]. Therefore, China’s supply shock is likely to be independent of the demand shock in Sweden, making the instrument variable creditable.
The selection of instrument countries relies mainly on two criteria. First, high-income countries’ imports from China should be highly correlated with Swedish imports from China to mitigate the weak instrument problem. Second, unobserved domestic shocks in these countries should not be strongly correlated with Sweden. Based on these two criteria, we select countries with comparable income levels as Sweden and exclude neighboring Nordic countries. Further, similar to Dauth et al. [27], we exclude the United States due to its significant impact on the world economy, which could bias the entire estimations. Thus, our final instrument countries include Australia, Canada, New Zealand, Korea, Japan, the UK, France, Germany, Switzerland, Austria, Ireland, Spain, Italy, the Netherlands, and Greece.

3.3. Summary Statistics

Table 1 summarizes the descriptive statistics of the sample data for the two sample periods. The median increase in the import exposure from China per worker, at the local labor market level, in 1996–2001 and 2002–2007 is approximately SEK 2200 and SEK 6400, respectively. If we look at the whole period, the median increase is approximately SEK 3700 per worker. This number is smaller than the corresponding findings in a Norwegian study by Balsvik et al. [21], where the regional exposure at the median level is approximately SEK 4600 (4000 Norwegian Krona) in 1996–2007. The number is more than twice as small as that of the United States [15]. Furthermore, the five-year growth of manufacturing employment, on average, declined by approximately 0.02 and 0.09 during 1996–2001 and 2002–2007, respectively.
Figure 1 shows the existence of a modest negative linkage between the five-year growth rate of manufacturing employment share and the increase in import exposure from China. Regional differences in industrial specialization can make some regions more sensitive to trade shocks from China than others, especially those with many low-skilled manufacturing industries.

4. Empirical Results

4.1. Employment Effect

To examine the influence of Chinese import penetration on employment within the manufacturing sector, we first use the ordinary least squares (OLS) estimation, followed by the two-stage least squares (2SLS) estimation. The F-statistic from the first-stage regression is also shown in Table 2. The first three columns in the table summarizes the results of the OLS estimation. In column 1, we do not use control measures. In column 2, we control for different local labor market characteristics. Further, in column 3, we control for the period effect to remove any national shocks that affect all regions. The estimations from columns 4–7 were conducted using 2SLS followed by adding the control variables, period effect, and metropolitan dummy in that order. Overall, the results indicated that the increase in import exposure to China does not have a statistically significant influence on the employment growth in the Swedish manufacturing sector. These results differ from those found in many other studies [8,15,21,25,26,35,36]. However, they are similar to the results found by Dauth et al. [27] and Bilici [26], where increasing import competition from China has a statistically insignificant employment effect on the manufacturing sectors of Germany and the UK.
Regarding the effect of Chinese import penetration on the non-manufacturing sector (e.g., construction, hotel and restaurant, retail and wholesale, transportation, and business) employment, we hypothesize that if trade exposure has little impact on manufacturing employment, we do not observe any significant trade effect outside the manufacturing sector. This is because the labor force does not flow from the manufacturing sector to the non-manufacturing sector. According to the results presented in Table 3, the increase in import penetration from China does not statistically influence the growth of non-manufacturing employment, except for the transportation sector (we have considered multiple tests as we evaluate the trade effect with respect to multiple outcomes simultaneously. To address this issue, we compute the Sidak–Holm adjusted p -values in Table 3). A possible explanation is that the expansion of international trade requires shipping, warehousing, and distribution. These results imply that the trade-induced labor force flow from the manufacturing sector to the non-manufacturing sector is not significant. Overall, the increasing import exposure from Chinese products has an insignificant labor market impact, regardless of the tradability of the sector, except for the transportation sector.

4.2. Earnings Effect

To estimate the effect of Chinese import penetration on wage earnings distribution, we apply Chetverikov et al.’s [22] two-step approach. The dependent variable measures the five-year change in the logarithm of annual earnings at each quantile in the manufacturing sector at the local labor market level. First, we compute the quantiles of the annual wage earnings for each local labor market based on observations from the registered data at the individual level. Secondly, we use the 2SLS method to estimate the influence of increasing import exposure from China on local earnings growth at different quantiles. Under the quantile regression setting, when the variable of interest is at the group level, and the outcome variable is at the individual-level, the standard quantile regression would suffer drawbacks from three aspects [22]. First, the estimator would be inconsistent due to the endogeneity of the variable of interest and the presence of unobserved additive terms at the group level. Secondly, the standard quantile regression is extremely slow when the number of groups increases. Third, the computation of standard error is burdensome, such as in dealing with the cluster standard error. Chetverikov et al.’s [22] method addresses the above issues by allowing the presence of group level unobservable additive terms in the quantile regression and the use of cluster standard error. The wage-earning data are measured at the annual level because hourly wage data are not available in the source register data.
According to the results summarized in Table 4, we find no evidence that an increase in import exposure from China significantly reduces the earnings growth at the lower limit of the earnings distribution (below the 40th percentile). For the earnings growth at the median or higher percentiles, we find that the effect of increasing import exposure from China significantly increases the local wage earnings growth. Altogether, the results imply that the increasing import competition from Chinese goods does not significantly affect the earnings growth at the lower quantiles of the earnings distribution. However, it significantly and positively affects the upper limit of the earnings distribution. This is in line with the study of Baziki [29], who shows that high-skilled workers are positively affected by China’s import penetration. A possible explanation is that the imported goods from China complement the median and high-income wage earners, who are more skilled workers. The low-income wage earners are not significantly affected by the trade shock from China due to the collective agreement.

5. Possible Explanations and Robustness Checks

The insignificant employment effect on the Swedish labor market may also be explained by the fact that Sweden had already begun importing goods from other low-income countries, such as Eastern European countries. In fact, Savvidou [37] identifies that China and Eastern European countries are the two major low-income sources for Swedish imports. To test this explanation, we consider Swedish imports from Eastern European countries (including Poland, Bulgaria, Hungary, Romania, Slovenia, Slovakia, the Czech Republic, Ukraine, and Russia) between 1996 and 2007. We implement the same index methodology described in Section 4. Furthermore, similar to Dauth et al. [27], we calculate the instrument variable for Swedish imports from Eastern European countries and China by the import flows of the following countries: Korea, Australia, New Zealand, Canada, and the UK (One of the reasons to exclude the imports from Nordic and other continental European countries in the instrument is due to the high correlation for the unobserved demand and supply shock among Sweden and those countries [27]). We first show the effect of import exposure from Eastern countries in column 1 of Table 5, where Eastern countries include both China and Eastern European countries. The estimated coefficient is approximately 0.001, which is statistically insignificant. In columns 2 and 3, we examine the effects from Eastern European countries and China separately (The estimated coefficient in column 3 of Table 5 is different from the baseline result in column 7 of Table 2 because we use fewer countries to construct the instrument variable in the former). Our regression results show that neither the rise of imports from Eastern European countries nor that from China have had any significant effect on the five-year growth of manufacturing employment. Thus, we argue that the rise of Eastern European countries is less likely to explain the insignificant labor market influence of increasing import competition from China.
Previous literature has also identified that the increasing import competition from low-income countries can induce firms in high-income countries to upgrade their product quality and invest more in technology [38,39]. If Swedish firms have anticipated their rising exposure to globalization, especially the competition from low-income countries, firms would likely adjust their product portfolio, for instance, through innovation, to differentiate from the imported foreign goods. Sweden is known as one of the most innovative countries in Europe [40]. However, due to the lack of firm-level data, it is not possible to directly test whether more innovated firms are less likely to downsize. Other studies, such as that of Hombert and Matray [41], have shown that research and development (R&D) intensive firms are more resilient to trade shocks from low-income countries by performing product differentiation. Hombert and Matray [41] show that manufacturing firms in the United States at the 25th percentile of the R&D distribution experience a significant employment reduction when facing import competition from China. However, trade does not affect firms in the 75th percentile of the distribution. Therefore, the stock of innovation can be one factor that explains why the Swedish labor market is not affected by the increasing import competition from low-income countries.
Just as increasing import exposure from low-income countries may lead to negative consequences on regional employment in high-income countries, increasing Swedish exports to low-income countries would boost the regional economy, which may have a positive influence on the local labor market. Thus, in this section, we test the role of increasing Swedish exports to China on manufacturing employment. Additionally, we conduct several robustness checks on the baseline results. These results are available upon request.
In analyzing the net effect of trade on employment, it is important to consider exports. Along with Bilici [26] and Dauth et al. [27], we construct an index that measures the increase in Swedish export exposure to China at the local labor market level. Following Table A2 in the appendix, the estimated result from column 2 shows that the expansion of Swedish exports to China by SEK 1000 would increase the growth of local manufacturing employment by 0.9 percentage points. In assessing the endogeneity, we use the increase in other high-income countries’ exports to China as the instrument variable for the increase in Swedish exports to China. However, the instrument variable could not pass the relevance test. The F-statistic for the export variable from the first-stage regression is below 10, which questions the instrument’s strength. Therefore, the extent to which the increase in export exposure to China would benefit Swedish employment is uncertain because the estimated coefficients from OLS are likely to be biased. One possible explanation for the weak instrument is that exported goods from advanced countries to China are fairly diversified across high-income countries compared with Chinese exports to advanced countries, which are primarily labor-intensive manufactured goods. Although we cannot measure the impact of exports on the labor market, it may be important to control export competition to investigate the import effect on manufacturing employment and earnings growth. Table A3 in the Appendix A shows that the conclusion is robust to the inclusion of export competition in the model specification.
In the previous sections, we investigated the effect of trade-induced shocks from China on manufacturing employment growth. However, trade effects likely vary for different demographic groups. We further explore the effect of trade on manufacturing employment by education and age groups. The education group is classified as follows: university, secondary school, and elementary school. The age group is classified into three: 16–34, 35–50, and 51–64. Again, we cannot find any strong evidence indicating that increasing import competition from China has a significant effect on manufacturing employment growth. Additionally, we find that increasing import penetration from China has insignificant effects on the change in the working-age population at the local labor market level. These findings are shown in Table A4 and Table A5 in the Appendix A.
A possible explanation to these results is that the imports from China include the final and intermediate goods, which can be processed and sold. If the increasing imports is mainly due to intermediate goods, it may raise the firm’s productivity as revenue increases. Therefore, firms may increase the labor demand, which would partially offset the increasing import competition effect from final goods. To address this issue, we attempt to distinguish between final and intermediate goods. We follow other studies using the input-output table from Statistics Sweden. Unfortunately, the input–output table is only available for 1995, 2000, and 2005. Therefore, we take the data from these years as a proxy for the 1996, 2001, 2002, and 2007 data. We use the share of Swedish imports of final goods from the world as a proxy for the imports of final goods from China. The regression results are presented in Table A6 in the Appendix A. The results indicate that the increasing import exposure of final goods from China does not significantly influence the growth of manufacturing employment. However, the result must be interpreted with caution as we use the share of Swedish imports of final goods from the world as a proxy for the share from China, where the share is based on final goods from both high- and low-income countries.
The literature on job offshoring and skill-biased technical change demonstrates that routine-intensive tasks are more easily offshored to other countries or replaced by technology than non-routine tasks [15,42], which contributes to the decline of manufacturing employment in developed countries. Therefore, local economies that initially have high routine-intensive employment are more likely to see a reduction in employment. To address this factor, we construct a variable that measures the percentage of routine-intensive occupations for each local labor market. To measure the intensity of routine tasks for each occupation, we use the shares from a previous Swedish study by Hakkala et al. [43]. The variable of the share of routine occupation in the local labor market ranges from zero to one, where zero means the local labor market has the lowest share of routine-intensive occupations, and one means the local labor market has the highest. As our occupation data are only available from 2001 onwards, we restrict our empirical investigation to the second period (2002–2007). The regression results from Table A7 in the Appendix A reveal that adding the control of the percentage of routine occupations hardly affects the estimation of our variable of interest.

6. Conclusions

Trade frictions between countries intensify, tariff barriers rise, and retaliatory tariffs are frequently imposed. Free trade is shrinking and protectionism is strengthening. These recent trends threaten the sustainability of the international trade order.
Over the past few decades, the growth in Chinese exports has dramatically changed world trade patterns. As shown in previous literature, the large inflow of Chinese products has had a substantial negative effect on the labor markets in some high-income countries [15]. Furthermore, research has shown that the labor market effect of trade shocks from low-income countries on high-income countries also depends on the institutional setup of the labor market [20,26]. The institutional setup and features of the Swedish labor market differ from those of many other European countries and the United States. Thus, it is important to understand the Swedish labor market’s reaction to increasing import competition from low-income countries such as China. In this study, we apply the methodologies of Autor et al. [15], which rely on the construction of a regional labor market index subject to trade shocks to investigate whether the effect of international manufacturing imports from China on the Swedish labor market (i.e., manufacturing, and non-manufacturing employment growth and wage earnings distribution) is statistically significant.
The empirical results indicate that the impact of increasing import exposure to China on Swedish manufacturing employment growth is statistically insignificant. We further rule out the explanation that Sweden had already begun importing goods from Eastern European countries before the rise in imports from China. The insignificant employment effect contradicts findings from other developed countries [15,25,26]. One explanation is that, relative to the larger effect of the Chinese supply shock in the US labor market, for instance Autor et al. [15], China’s supply shock on the Swedish labor market might be too small to be able to generate any significant employment effect. Furthermore, the employment adjustment may occur at the intensive rather than the extensive margin, which requires further exploration. Our findings on employment also differ from the previous findings from the neighboring country, Denmark, where Utar [28] shows a negative employment effect in the textile industry in Demark due to the rise of Chinese competition. One possible explanation for the different findings may be related to the level of innovation, technological advancement, and the specialization of products among Swedish firms are different from those among Danish firms, in which the level of innovation in Sweden is considered to be high [40]. For example, to deal with the foreign competition, the Swedish textile industry was reconstructed in the 1970s and has since become extremely focused and specialized according to the 2015 report from the Swedish trade and employer’s association for companies in the textile and fashion industry [44]. Hence, one way to survive in the increasing competition from low-income countries, as suggested by Hombert and Matray [41], is to differentiate domestic products from imported goods through quality upgradations. Furthermore, our finding is also similar to that of Balsvik et al. [21], who show a modest employment effect from Norway due to the competition from China.
Regarding the wage earnings distribution, our research results indicate that the earnings growth of low-wage earners in the manufacturing sector is not significantly influenced by increases in Chinese imports. However, wage earners at the median level or above are positively affected by trade shocks from China. This is in line with the studies of Baziki [30] and Balsvik et al. [21], who find that skilled workers are positively influenced by import shocks from China. Owing to the high coverage of collective agreement, wage earners at the lower percentile of the earning distribution are less likely to be influenced by the increase in import penetration from low-income countries. Furthermore, the results also suggest that imports from China might be complementary to median- or higher-wage earners who are more skilled. The findings imply that the increasing import competition from low-income countries could potentially widen the income gap between low- and high-wage workers.
Given the response of the Swedish labor market to trade shocks from China, labor market factors such as a high participation rate of union and collective agreement may likely help deter the negative impact of trade shocks on employment and earnings growth. However, continuous investment in human capital and the R&D of firms can also play a role when faced with an increase in import competition from low-income countries [45]. These policies can enhance the sustainability of the beneficial trade between Sweden and China.

Author Contributions

All the authors contributed to the entire process of writing this paper. Conceptualization, Z.J., C.M., J.A.H., S.-M.Y.; Data curation, C.M., J.A.H.; Methodology, C.M., J.A.H.; Formal analysis, C.M., J.A.H.; Funding acquisition, Z.J., S.-M.Y.; Investigation, Z.J., C.M.; Project administration, Z.J., S.-M.Y.; Software, C.M.; Supervision, S.-M.Y.; Validation, Z.J.; Visualization, C.M.; Writing—original draft, Z.J., C.M., J.A.H., S.-M.Y.; Writing—review & editing, Z.J., S.-M.Y. All authors have read and agreed to the published version of the manuscript.

Funding

This work was supported by the Ministry of Education of the Republic of Korea and the National Research Foundation of Korea (NRF-2020S1A5B8103268).

Institutional Review Board Statement

Not applicable.

Informed Consent Statement

Not applicable.

Data Availability Statement

Sweden’s local labor market data are collected from the Statistics Sweden (SCB) (https://www.scb.se/en/finding-statistics/ (accessed on 2 February 2022)). Sweden-China trade data are collected from the UN Comtrade Database (https://comtrade.un.org/data (accessed on 2 February 2022)).

Acknowledgments

We would like to thank Anders Åkerman, Ariell Reshef, Dominique Anxo, Lina Aldén, Erik Lindqvist, Mats Hammarstedt, Magnus Carlsson, seminar participants at the Department of Economics and Statistics at Linnaeus University.

Conflicts of Interest

The authors declare no conflict of interest.

Appendix A

Table A1. Definition of variables.
Definition of variables at the local labor market level
Explanatory variables:
Δ i m p e x p o s u r e : the increase of import exposure with China per worker
Share of female employment: number of female workers / working age population
Share of university education: number of people has attended university / working age population
Share of immigrants: number of foreign born people / working age population
Metropolitan Dummy: equal to 1 if the local labor market is Stockholm, Gothenburg and Malmo, 0 otherwise.
Period dummy: equal to 1 if the period is 2002–2007, 0 if the period is 1996–2001.
Dependent variables:
The change of manufacturing employment share: the logarithm change of manufacturing employment share out of working age population (age 16–64) over the five years.
The change of share of non-manufacturing employment: the logarithm change of non- manufacturing employment share out of working age population (age 16–64) over the five years.
The change of share of construction employment: the logarithm change of construction employment share out of working age population (age 16–64) over the five years.
The change of share of hotel/restaurant employment: the logarithm change of hotel/restaurant employment share out of working age population (age 16–64) over the five years.
The change of share of retail/whole sale employment: the logarithm change of retail/whole sale employment share out of working age population (age 16–64) over the five years.
The change of share of transportation employment: the logarithm change of transportation employment share out of working age population (age 16–64) over the five years.
The change of share of business employment: the logarithm change of business employment share out of working age population (age 16–64) over the five years.
Wage earning: annual wage earning (in 2007 price), registered
Table A2. OLS estimation of the increasing import and export exposure on the manufacturing employment growth.
(1)(2)
VariablesManuf. Employment GrowthManuf. Employment Growth
Δ i m p e x p o s u r e −0.006 ***−0.002
(0.002)(0.002)
Δ e x p e x p o s u r e 0.022 ***0.009 **
(0.006)(0.004)
Initial manuf. employment share −0.134
(0.173)
Initial female employment share 0.145
(0.473)
Initial university education. share −0.289
(0.222)
Initial immigrant share −0.239
(0.205)
Observations174174
R-squared0.1890.377
Period effectNY
Metropolitan dummyNY
Note: We have 87 local labor markets for each period. As we take the first difference of variables, the local labor market effect is controlled. All the regressions are estimated by OLS and weighted by initial period population. See also the note of Table 2. *** indicates significance at the 1% level. ** indicates significance at the 5% level.
Table A3. Robustness check for increasing import exposure from China on wage earnings distribution and manufacturing employment growth.
(1)(2)(3)(4)(5)(6)(7)(8)(9)(10)(11)
Variablesp10p20p30p40p50p60p70p80p90Average Wage GrowthManuf. Empl. Growth
0.0090.0020.0020.003 **0.004 **0.005 ***0.006 ***0.006 **0.006 **0.005 **0.005
(0.006)(0.003)(0.001)(0.001)(0.002)(0.002)(0.002)(0.002)(0.002)(0.002)(0.004)
Observations174174174174174174174174174174174
R-squared0.0590.2030.3490.4230.3670.3890.3920.4030.5020.4380.059
F-statistic27.2827.2827.2827.2827.2827.2827.2827.2827.2827.9127.28
Period effectYYYYYYYYYYY
Metropolitan dummyYYYYYYYYYYY
Note: The dependent variables from columns 1–9 measure the earnings growth at each percentile over the five-year period. The dependent variable in the 10th column measures the average wage earnings growth over the five-year period. All the regressions are estimated by 2SLS and weighted by initial period population. The control variables are the same with column 7 of Table 2 plus the control for increasing export exposure at the local labor market level. The dependent variables from column 1–9 measure the growth of earnings at each percentile. Columns 10 and 11 measure the five-year growth about average earning and manufacturing employment. See also the notes of Table 2 and Table 3. *** indicates significance at the 1% level. ** indicates significance at the 5% level.
Table A4. The increasing import exposure from China and the manufacturing employment growth by age and education.
Age GroupEducation Level
(1)(2)(3)(4)(5)(6)
VariablesAge 16–34Age 35–50Age 51–64UniversitySecondary SchoolElementary School
Panel A
Δ i m p e x p o u r s e 0.0170.0000.0010.0110.0030.000
(0.011)(0.005)(0.003)(0.008)(0.005)(0.004)
R-squared0.1690.2980.5030.2750.6230.119
F-statistic27.9127.9127.9127.9127.9127.91
Period effectYYYYYY
Panel B (control for metropolitan dummy)
Δ i m p e x p o u r s e 0.019 *0.0000.0000.0130.003−0.000
(0.011)(0.005)(0.004)(0.008)(0.005)(0.004)
R-squared0.1690.2980.5030.2730.6230.119
F-statistic27.2827.2827.2827.2827.2827.28
Period effectYYYYYY
Metropolitan dummyYYYYYY
Observations174174174174174174
Note: All the regression parameters are estimated by 2SLS and weighted by initial period population. See also the notes of Table 2 and Table 3. * p < 0.1.
Table A5. The increasing import exposure from China and the change of working-age population share.
(1)(2)
VariablesPopulation ShiftPopulation Shift
Δ i m p e x p o u r s e 0.0010.002
(0.002)(0.002)
Observations174174
R-squared0.7080.723
F-statistic27.9127.28
Period effectYY
Metropolitan dummyNY
Note: Robust standard errors are in parentheses. All the regression parameters are estimated by 2SLS and weighted by initial period population. See also the notes of Table 2 and Table 3.
Table A6. The increasing import exposure from China and the manufacturing employment growth by final goods.
(1)(2)
VariablesManuf. Employment GrowthManuf. Employment Growth
Δ i m p e x p o u r s e (final goods)0.0120.013
(0.013)(0.013)
Observations174174
R-squared0.2830.277
F-statistic13.4013.72
Period effectYY
Metropolitan dummyNY
Note: All the regression parameters are estimated by 2SLS and weighted by initial period population. See also the notes of Table 2 and Table 3.
Table A7. The increasing import exposure from China and the manufacturing employment growth based on 2002–2007.
(1)(2)
VariablesManuf. Employment GrowthManuf. Employment Growth
Δ i m p e x p o s u r e 0.0050.005
(0.008)(0.007)
Initial manuf. employment share−0.302−0.296
(0.280)(0.283)
Initial female employment share−0.535−0.545
(0.684)(0.704)
Initial university education share−0.330−0.353
(0.364)(0.442)
Initial immigrant share−0.221−0.225
(0.348)(0.359)
Initial share of routine occupations −0.049
(0.658)
Observations8787
R-squared0.1210.125
F-statistic13.3312.37
Metropolitan dummyYY
Note: We have 87 local labor markets for each period. As we take the first difference of variables, the local labor market effect is controlled. All the regressions are estimated by 2SLS and weighted by initial period population. See also the notes of Table 2 and Table 3.
Figure A1. The manufacturing employment share and imports from China at the manufacturing industry level.
Sustainability 14 02631 g0a1

References

  1. Greenland, A.; Lopresti, J.; McHenry, P. Import competition and internal migration. Rev. Econ. Stat. 2019, 101, 44–59. [Google Scholar] [CrossRef]
  2. Dippel, C.; Gold, R.; Heblich, S.; Pinto, R. Instrumental Variables and Causal Mechanisms: Unpacking the Effect of Trade on Workers and Voters; NBER Working Papers No. 23209; National Bureau of Economic Research, Inc.: Cambridge, MA, USA, 2017. [Google Scholar]
  3. Dix-Carneiro, R.; Kovak, B.K. Trade liberalization and regional dynamics. Am. Econ. Rev. 2017, 107, 2908–2946. [Google Scholar] [CrossRef] [Green Version]
  4. Blyde, J.S.; Busso, M.; Romero Fonseca, D. Labor Market Adjustment to Import Competition: Long-Run Evidence from Establishment Data; IDB Publications (Working Papers) 10097; Inter-American Development Bank: Washington, DC, USA, 2020. [Google Scholar]
  5. Caselli, M.; Fracasso, A.; Traverso, S. Globalization and electoral outcomes: Evidence from Italy. Econ. Politics 2020, 32, 68–103. [Google Scholar] [CrossRef] [Green Version]
  6. Liang, Y. Job creation and job destruction: The effect of trade shocks on US manufacturing employment. World Econ. 2021, 44, 2909–2949. [Google Scholar] [CrossRef]
  7. Colantone, I.; Stanig, P. The trade origins of economic nationalism: Import competition and voting behavior in Western Europe. Am. J. Political Sci. 2018, 62, 936–953. [Google Scholar] [CrossRef]
  8. Blanco, A.; Borland, J.; Coelli, M.; Maccarrone, J. The impact of growth in manufactured imports from China on employment in Australia. Econ. Rec. 2021, 97, 243–266. [Google Scholar] [CrossRef]
  9. Branstetter, L.G.; Kovak, B.K.; Mauro, J.; Venancio, A. The China Shock and Employment in Portuguese Firms; NBER Working Papers No. 26252; National Bureau of Economic Research, Inc.: Cambridge, MA, USA, 2019. [Google Scholar]
  10. Citino, L.; Linarello, A. The impact of Chinese import competition on Italian manufacturing. Rev. Int. Econ. 2022, in press. [Google Scholar] [CrossRef]
  11. Lang, M.; McManus, T.C.; Schaur, G. The effects of import competition on health in the local economy. Health Econ. 2019, 28, 44–56. [Google Scholar] [CrossRef] [Green Version]
  12. Traiberman, S. Occupations and import competition: Evidence from Denmark. Am. Econ. Rev. 2019, 109, 4260–4301. [Google Scholar] [CrossRef] [Green Version]
  13. Malgouyres, C. The impact of Chinese import competition on the local structure of employment and wages: Evidence from France. J. Reg. Sci. 2017, 57, 411–441. [Google Scholar] [CrossRef] [Green Version]
  14. Hayakawa, K.; Ito, T.; Urata, S. Impacts of increased Chinese imports on Japan’s labor market. Jpn. World Econ. 2021, 59, 101087. [Google Scholar] [CrossRef]
  15. Autor, D.H.; Dorn, D.; Hanson, G.H. The China syndrome: Local labor market effects of import competition in the United States. Am. Econ. Rev. 2013, 103, 2121–2168. [Google Scholar] [CrossRef] [Green Version]
  16. Adermon, A.; Gustavsson, M. Job polarization and task-biased technological change: Evidence from Sweden, 1975–2005. Scand. J. Econ. 2015, 117, 878–917. [Google Scholar] [CrossRef]
  17. Anxo, D. Upskilling to avoid jobs’ polarisation and growing income inequalities: The Swedish experience. Econ. Lav. 2016, 50, 13–24. [Google Scholar]
  18. Friberg, N. Thematic Review on Adult Learning: Sweden; Working Paper; OECD: Paris, France, 2000. [Google Scholar]
  19. Albrecht, J.; van den Berg, G.J.; Vroman, S. The Knowledge Lift: The Swedish Adult Education Program that Aimed to Eliminate Low Worker Skill Levels; IZA Discussion Paper No. 1503; Institute of Labor Economics (IZA): Bonn, Germany, 2005. [Google Scholar]
  20. Carluccio, J.; Fougère, D.; Gautier, E. Trade, wages and collective bargaining: Evidence from France. Econ. J. 2015, 125, 803–837. [Google Scholar] [CrossRef] [Green Version]
  21. Balsvik, R.; Jensen, S.; Salvanes, K.G. Made in China, sold in Norway: Local labor market effects of an import shock. J. Public Econ. 2015, 127, 137–144. [Google Scholar] [CrossRef] [Green Version]
  22. Chetverikov, D.; Larsen, B.; Palmer, C. IV quantile regression for group-level treatments, with an application to the distributional effects of trade. Econometrica 2016, 84, 809–833. [Google Scholar] [CrossRef] [Green Version]
  23. Wood, A. North-South Trade, Employment and Inequality: Changing Fortunes in a Skill-Driven World; Clarendon Press: Oxford, UK, 1994. [Google Scholar]
  24. Autor, D.H.; Dorn, D.; Hanson, G.H.; Song, J. Trade adjustment: Worker-level evidence. Q. J. Econ. 2014, 129, 1799–1860. [Google Scholar] [CrossRef]
  25. Donoso, V.; Martín, V.; Minondo, A. Do differences in the exposure to Chinese imports lead to differences in local labour market outcomes? An analysis for Spanish provinces. Reg. Stud. 2015, 49, 1746–1764. [Google Scholar] [CrossRef]
  26. Bilici, O. International Trade in a Competitive World: Empirical Evidence from the UK. Ph.D. Thesis, University of Essex, Essex, UK, 2016. [Google Scholar]
  27. Dauth, W.; Findeisen, S.; Suedekum, J. The rise of the East and the Far East: German labor markets and trade integration. J. Eur. Econ. Assoc. 2014, 12, 1643–1675. [Google Scholar] [CrossRef]
  28. Utar, H. When the floodgates open: “Northern” firms’ response to removal of trade quotas on Chinese goods. Am. Econ. J. Appl. Econ. 2014, 6, 226–250. [Google Scholar] [CrossRef] [Green Version]
  29. Baziki, S.B. Firms, International Competition, and the Labor Market; Economic Studies, 151; Department of Economics, Uppsala University: Uppsala, Sweden, 2015. [Google Scholar]
  30. Baziki, S.B.; Ginja, R.; Milicevic, T.B. Trade Competition, Technology and Labour Reallocation; IZA Discussion Paper No.10034; Institute of Labor Economics (IZA): Bonn, Germany, 2016. [Google Scholar]
  31. Husted, S.; Nishioka, S. China’s fare share? The growth of Chinese exports in world trade. Rev. World Econ. 2013, 149, 565–585. [Google Scholar] [CrossRef]
  32. Zhu, X. Understanding China’s growth: Past, present, and future. J. Econ. Perspect. 2012, 26, 103–124. [Google Scholar] [CrossRef] [Green Version]
  33. Liu, T.; Li, K.-W. Analyzing China’s productivity growth: Evidence from manufacturing industries. Econ. Syst. 2012, 36, 531–551. [Google Scholar] [CrossRef]
  34. World Trade Organization. World Trade Report 2021: Economic Resilience and Trade; WTO Publications: Geneva, Switzerland, 2021; Available online: https://www.wto.org/english/res_e/booksp_e/wtr21_e/00_wtr21_e.pdf (accessed on 2 February 2022).
  35. Acemoglu, D.; Autor, D. Skills, Tasks and Technologies: Implications for Employment and Earnings. In Handbook of Labor Economics; Ashenfelter, O., Card, D., Eds.; Elsevier: Amsterdam, The Netherlands, 2011; pp. 1043–1171. [Google Scholar]
  36. Artuc, E.; Chaudhuri, S.; McLaren, J. Trade shocks and labor adjustment: A structural empirical approach. Am. Econ. Rev. 2010, 100, 1008–1045. [Google Scholar] [CrossRef] [Green Version]
  37. Savvidou, E. Globalization’s effects on Sweden’s labor market. Sver. Riksbank Econ. Rev. 2007, 2007, 58–75. [Google Scholar]
  38. Amiti, M.; Khandelwal, A.K. Import competition and quality upgrading. Rev. Econ. Stat. 2013, 95, 476–490. [Google Scholar] [CrossRef] [Green Version]
  39. Bloom, N.; Draca, M.; van Reenen, J. Trade induced technical change? The impact of Chinese imports on innovation, IT and productivity. Rev. Econ. Stud. 2016, 83, 87–117. [Google Scholar] [CrossRef] [Green Version]
  40. Carlsson, B.; Jacobsson, S. Technological systems and economic policy: The diffusion of factory automation in Sweden. Res. Policy 1994, 23, 235–248. [Google Scholar] [CrossRef]
  41. Hombert, J.; Matray, A. Can innovation help US manufacturing firms escape import competition from China? J. Financ. 2018, 73, 2003–2039. [Google Scholar] [CrossRef]
  42. Grossman, G.M.; Rossi-Hansberg, E. Trading tasks: A simple theory of offshoring. Am. Econ. Rev. 2008, 98, 1978–1997. [Google Scholar] [CrossRef] [Green Version]
  43. Hakkala, K.N.; Heyman, F.; Sjöholm, F. Multinational firms, acquisitions and job tasks. Eur. Econ. Rev. 2014, 66, 248–265. [Google Scholar] [CrossRef]
  44. TEKO. The Swedish Textile Industry: Statistics and Analysis. 2015. Available online: https://www.teko.se/wp-content/uploads/branschstatistikrapport_final-1.pdf (accessed on 2 February 2022).
  45. Williams, T.; Conwell, L. Schooled by trade? Retraining and Import Competition. 2022. Available online: https://ssrn.com/abstract=4018568 (accessed on 2 February 2022).
Figure 1. Five-year change of manufacturing employment share and the increase of local labor market import exposure from China.
Sustainability 14 02631 g001
Table 1. Summary statistics.
1996–20012002–2007
VariableMeanSDMedianMeanSDMedian
Δ i m p e x p o s u r e (in 1000 SEK)2.31.12.25.93.56.4
Growth of manufacturing emp. share−0.020.10.01−0.090.07−0.03
Growth of non-manufacture emp. share0.070.020.050.030.020.04
Growth of median wage earning growth in manufacturing sector0.10.020.10.10.010.1
Share of manufacturing emp. (%)13.45.114.713.05.314.5
Share of female emp. (%)32.61.631.734.51.733.5
Share of university education (%)23.95.716.028.956.419.2
Share of immigrants (%)13.15.17.814.35.58.2
Observations87 87
Notes: Emp. indicates employment. The variables of share of manufacturing employment, female employment, university education, and immigrants are measured at the beginning of each period—1996 and 2002. The import exposure is measured in the 2007 price level. The growth rate is measured by the change of logarithm from t to t + 1 .
Table 2. Increasing import exposure and the five-year manufacturing employment growth.
(1)(2)(3)(4)(5)(6)(7)
VariablesOLSOLSOLSIVIVIVIV
Δ i m p e x p o s u r e −0.006 ***−0.007 ***−0.003−0.003−0.0040.0060.006
(0.002)(0.002)(0.002)(0.003)(0.003)(0.005)(0.005)
Initial manufacturing employment share −0.022−0.002 −0.122−0.156−0.152
(0.171)(0.162) (0.182)(0.179)(0.180)
Initial female employment share −0.1110.009 −0.325−0.257−0.246
(0.568)(0.492) (0.552)(0.501)(0.499)
Initial university education share −0.543 ***−0.345 −0.539 ***−0.176−0.199
(0.196)(0.218) (0.200)(0.264)(0.278)
Initial immigrant share −0.148−0.262 −0.149−0.356 *−0.408 *
(0.166)(0.172) (0.169)(0.193)(0.232)
First stage estimates
Δ i m p e x p o s u r e other countries 0.018 ***0.016 ***0.012 ***0.012 ***
(0.002)(0.002)(0.002)(0.002)
Reduced form regression (in 1/1000)
−0.057−0.0610.0730.074
(0.049)(0.047)(0.055)(0.053)
Observations174174174174174174174
R-squared0.0570.3350.3660.0440.3320.3080.305
F-Statistic 67.4848.9527.9127.28
Period EffectNNYNNYY
Metropolitan DummyNNNNNNY
Note: Standard errors shown in parentheses are clustered at the local labor market level, *** p < 0.01, * p < 0.1. In total, we have 174 observations (87 × 2) as we have 87 local labor markets with 2 periods. All the regressions are weighted by initial period population.
Table 3. Increasing import exposure from China and different labor market indicators.
(1)(2)(3)(4)(5)(6)
VariablesNon-ManufactureConstructionHotel/RestaurantRetail/Whole SaleTransportationBusiness
Δ i m p e x p o u r s e 0.0040.006−0.003−0.0060.022 ***0.008
(0.002)(0.006)(0.007)(0.004)(0.007)(0.008)
Unadjusted p-value0.1010.2710.6910.1410.0010.280
Adjusted p-value0.4130.6130.6910.4560.0060.613
Observations174174174174174174
R-squared0.4540.2680.1180.0100.0180.487
F-statistic27.2827.2827.2827.2827.2827.28
Period effectYYYYYY
Metropolitan dummyYYYYYY
Note: F-statistic from the first-stage regression is shown. The adjusted p-value is computed from the Sidak-holm adjusted p-values. All the regressions are estimated by 2SLS and weighted by initial period population. The control variables are the same with column 7 of Table 2. See also the note of Table 2. *** indicates significance at the 1% level.
Table 4. Increasing import exposure from China and wage earnings distribution.
(1)(2)(3)(4)(5)(6)(7)(8)(9)(10)
Variablesp10p20p30p40p50p60p70p80p90Average Wage Growth
Δ i m p e x p o u r s e 0.0090.0020.0020.003 **0.004 **0.006 ***0.006 **0.006 **0.006 **0.005 **
(0.006)(0.003)(0.001)(0.001)(0.002)(0.002)(0.002)(0.003)(0.003)(0.002)
Observations174174174174174174174174174174
R-squared0.0590.2030.3490.4230.3670.3890.3920.4030.5020.438
F-Statistic27.2827.2827.2827.2827.2827.2827.2827.2827.2827.91
Period EffectYYYYYYYYYY
Metropolitan dummyYYYYYYYYYY
Note: The dependent variables from columns 1–9 measure the earnings growth at each percentile over the five-year period. The dependent variable in the 10th column measures the average wage earnings growth over the five-year period. All the regressions are estimated by 2SLS and weighted by initial period population. See also the notes of Table 2 and Table 3. *** indicates significance at the 1% level. ** indicates significance at the 5% level.
Table 5. Increasing import exposure from ‘Eastern Countries’ and manufacturing employment growth.
(1)(2)(3)
VariablesEastern CountriesEastern EuropeChina
Import exposure0.001−0.0040.002
(0.002)0.004(0.003)
Observations174174174
R-squared0.3560.3410.345
F-Statistic222.4369.4034.35
Period EffectYYY
Metropolitan DummyYYY
Note: All the regressions are estimated by 2SLS and weighted by initial period population. The control variables are the same with column 7 of Table 2. The instrument countries include Korea, Australia, New Zealand, Canada, and the UK. The Eastern countries include both the Eastern European countries and China. The Eastern European countries include Slovenia, Poland, Bulgaria, the Czech Republic, Hungary, Slovakia, Romania, Ukraine, and Russia. See also the notes of Table 2 and Table 3.
Publisher’s Note: MDPI stays neutral with regard to jurisdictional claims in published maps and institutional affiliations.

