Article

Using Machine Learning to Predict Visitors to Totally Protected Areas in Sarawak, Malaysia

by
Abang Zainoren Abang Abdurahman
1,
Wan Fairos Wan Yaacob
2,3,*,
Syerina Azlin Md Nasir
2,
Serah Jaya
1 and
Suhaili Mokhtar
4
1
Faculty of Business Management, Universiti Teknologi MARA Cawangan Sarawak, Kota Samarahan 94300, Sarawak, Malaysia
2
Faculty of Computer and Mathematical Sciences, Universiti Teknologi MARA Cawangan Kelantan, Kampus Kota Bharu, Lembah Sireh, Kota Bharu 15050, Kelantan, Malaysia
3
Institute for Big Data Analytics and Artificial Intelligence (IBDAAI), Kompleks Al-Khawarizmi, Universiti Teknologi MARA, Shah Alam 40450, Selangor, Malaysia
4
Sarawak Forestry Corporation, Jalan Sungai Tapang, Kota Sentosa, Kuching 93250, Sarawak, Malaysia
*
Author to whom correspondence should be addressed.
Sustainability 2022, 14(5), 2735; https://doi.org/10.3390/su14052735
Submission received: 25 January 2022 / Revised: 21 February 2022 / Accepted: 23 February 2022 / Published: 25 February 2022

Abstract

:
The machine learning approach has been widely used in many areas of studies, including the tourism sector. It can offer powerful estimation for prediction. With a growing number of tourism activities, there is a need to predict tourists’ classification for monitoring, decision making, and planning formulation. This paper aims to predict visitors to totally protected areas in Sarawak using machine learning techniques. The prediction model developed would be able to identify significant factors affecting local and foreign visitors to these areas. Several machine learning techniques such as k-NN, Naive Bayes, and Decision Tree were used to predict whether local and foreign visitors’ arrival was high, medium, or low to these totally protected areas in Sarawak, Malaysia. The data of local and foreign visitors’ arrival to eighteen totally protected areas covering national parks, nature reserves, and wildlife centers in Sarawak, Malaysia, from 2015 to 2019 were used in this study. Variables such as the age of the park, distance from the nearest city, types of the park, recreation services availability, natural characteristics availability, and types of connectivity were used in the model. Based on the accuracy measure, precision, and recall, results show Decision Tree (Gain Ratio) exhibited the best prediction performance for both local visitors (accuracy = 80.65) and foreign visitors (accuracy = 84.35%). Distance to the nearest city and size of the park were found to be the most important predictors in predicting the local tourist visitors’ park classification, while for foreign visitors, age, type of park, and the natural characteristics availability were the significant predictors in predicting the foreign tourist visitors’ parks classification. This study exemplifies that machine learning has respectable potential for the prediction of visitors’ data. Future research should consider bagging and boosting algorithms to develop a visitors’ prediction model.

1. Introduction

In 2019, 1.466 billion people traveled internationally around the world, and about 360.4 million of those are from Asia and The Pacific [1]. In the same year, Malaysia welcomed 26.1 million visitors’ representing USD 4 billion or 1.5% of international tourism exports revenue. However, in 2020, the number plunged by 87.4%, with only a total of 4.332 million tourists arriving in Malaysia [2]. Due to the COVID-19 pandemic, this negative growth is not only hitting Malaysia but also other Asian and Pacific countries, which recorded an 84% decrease in total arrival [1]. Although the current figure shows a decreasing trend due to the COVID-19 pandemic, the importance of tourism to the country is undeniable. There are numerous benefits from tourism including job creation, foreign currency earnings, infrastructure development, poverty eradication, inequality reduction, and balanced regional development. Tourism can generate income for the country and is also important for creating world peace [3].
The totally protected areas worldwide are receiving billions of visitors [4]. This positive impact has led to an increase in the number of tourism activities. TPAs in Sarawak have received quite a number of visitors throughout the years. Recently, there has been an increase in the interest of the management for more accurate predictions of tourism volume, such as using machine learning techniques. Identifying the possible factors that may affect visitors to visit national parks, nature reserves, and wildlife sanctuaries become their main concern in sustaining these TPAs. The insights from visitors’ data can aid in decision making related to exhibitions, marketing operations, resource planning, and revenue optimization. Thus, this study aims to understand the natural factors that affect the visitors’ attendance to totally protected areas in Sarawak and investigate the comparable impact of other effects. With the advancement of predictive models such as machine learning techniques, findings from this study can be used as a guide to relevant parties for a range of planning tasks. Machine learning (ML) can achieve the most reliable correlation in a system with a data driving tool. It artificially generates knowledge from experience. This data-driven knowledge can then be adapted and applied to address new challenges and evaluate previously unexplored data [5]. ML allows information technology (IT) systems to identify patterns and rules based on existing data and algorithms and build solutions on their own [6]. Over the years, using ML has proven to be beneficial in a variety of sectors, with success owing to the development of more advanced ML models [7,8].

2. Literature Review

Machine learning is leading to technological innovation in all fields, with a great impact on the tourism sector. There is no difficulty in changing diametrically the forms of commercialization and the way the travel industry works. In previous works, tourism forecasting has attracted the study of various researchers mainly due to the importance of tourism in national economies [9,10]. Time-series and regression methods have mostly dominated the forecasting models of current research approaches. Although these traditional techniques have proved some success in tourist forecasting, new methods such as machine learning methods can contribute significantly to this area. As a matter of fact, machine learning methods have been successfully applied to many forecasting applications, including tourism forecasting [11].
Forests play an important role in ecotourism throughout the world, especially in developing countries where the economic benefits that can be generated are significant for low-income families. Some other benefits obtained from ecotourism are forest protection, preservation of wildlife, maintenance of cultural traditions, gender equality, and social cohesion [3,12]. Several studies have been carried out to look into forest management or protected areas challenges and strategies, visitor’s characteristics and behaviors, land usage, distance influence, accessibility, and climate change factors [3,13,14]. Management of tourist sites should ensure that their tourists’ infrastructures are properly developed. These added-value activities would attract more visitors to visit these protected areas; therefore, correct handling of tourists is often the key to success [15]. Moreover, the transition from service-based to the experienced-based economy has shifted the focus on the creation and delivery of meaningful and memorable tourism experiences [11]. The study of memorable tourism experiences (MTE) has gained momentum recently to further understand visitors’ behavior and intention. Apart from that, other forms of active or specialized tourism related to protected areas are also developing, such as skiing, cycling, and horse-riding tourism, as well as mountain climbing and speleological tourism, which utilizes characteristics of the natural environment [15]. Most of the forests or protected areas offer nature preserved in an unchanged or barely changed form, and their location is usually far from urbanized areas [16]. Moreover, a study by Groulx et al. [17] suggests the importance of climate change adaptation in protected areas to tourist behavior, whose impacts could substantially diminish the site’s pull as a tourism destination. To ensure successful destination management, all these factors are highly dependent on accurate tourism demand forecasts, which is feasible through a machine learning approach.
With the recent advancement of technology, machine learning (ML) techniques offer powerful estimation to achieve sustainable tourism through pattern recognition, improve from experience of real-world data (training sets) to predict an outcome, and make decisions on its own [11]. Recent works on tourism forecasting have seen the use of web search data, which has been proven to improve forecasting performance. Li et al. [9] adopted a combination of the network search index, Baidu index, and hybrid neural network to effectively forecast daily tourist flow in China. Sun et al. [10] proposed kernel extreme learning machine (KELM) models with integrated Baidu index and Google index to resolve difficulties in forecasting tourist volume flows and other complex and burdensome forecasting problems. Similarly, works by Höpken et al. [18] adopted the machine learning technique ANN to improve tourists’ arrival prediction by including travelers’ web search traffic as an external input attribute. The findings reveal that Google Trends data, which mirror online travelers’ search behavior, increase the performance of the model compared to autoregressive integrated moving average (ARIMA) model that used past tourists’ arrivals data. ARIMA model has been found to be the most prevailing method in tourism forecasting, but it is sometimes inferior to intelligence methods [10].
A number of studies focused on the performance of ML models in predicting tourists by developing and implementing more sophisticated and advanced machine learning algorithms. Rezapouraghdam et al. [11] proposed fuzzy-set qualitative comparative analysis (fsQCA) together with an adaptive neuro-fuzzy inference system (ANFIS) to predict the complexities of visitors’ behavior in relation to environmental phenomena, particularly at sensitive ecological sites. The performance of ML is normally measured based on a selection of training and testing datasets. The critical issue of performing data mining and machine learning is underfitting and overfitting training data. In line with this, determination of how to get the best parameter models should be carried out. Previously, the researcher could be using kind of heuristics and metaheuristics optimization [19,20,21,22]. In addition, the split of training and testing data has also influenced the accuracy of the model, such as the percentage 90:10, 80:20, 70:30, 60:40, and 50:50 [23,24,25,26]. On the other hand, there are some techniques to separate the training and testing data using the K fold [27,28].
Livieris et al. [29] proposed a new machine learning prediction model, weight constrained neural networks (WCNNs), to predict tourists’ volume in Greece, which outperformed classical neural networks and the state-of-the-art regression models. The findings proved that the model was able to efficiently analyze data and forecast the size of tourists’ volume and demand. The work by Li et al. [9] optimizes the connection weight and threshold of the neural network by introducing the hybrid fruit fly optimization algorithm back propagation (FOA-BP) model to improve the generalization ability and learning performance as well as overall search efficiency. Experimental results showed that the hybrid model can greatly improve the prediction effect of the original model and provide a new view for short-term tourism demand forecasting.
Many economies around the world depend on the tourism industry for their success. Boosting the country’s revenue, creating job opportunities, and improving the country’s infrastructures are some benefits gained from tourism. This ultimately brings numerous social, economic, and environmental changes to a country. Therefore, it would be in a country’s best interest to promote tourism and to provide a favorable environment to attract domestic and foreign tourists. Numerous economic factors that determine tourists’ arrival are exchange rate, level of income, tourism price and substitute tourism price, behavioral habits, per capita income of tourists, and trade liberalization [30,31,32,33]. Tourism demand is also affected by non-economic factors like quality and quantity of facilities such as restaurants, tour services, health care, housing, parking, and tourist guides [34].
People are usually driven to visit places that have unusual or interesting attractions [34,35,36]. Protected areas, which are categorized as natural attractions, are increasingly turning out to be popular tourist destinations. Visitors are attracted to visit these areas for their panoramic views, waterfalls, wide varieties of flora and fauna, and abundance of natural wonders. A park that has an assortment of natural features would be able to attract a larger number of visitors [37,38,39]. These parks offer different attractions that would satisfy different travel motives [40]. The age of parks also significantly influences the number of visitors. The older the parks, the more popular they are amongst visitors. As these parks have a long history, the public has a greater awareness of their existence [41,42]. Visitors also perceived that older parks have larger budgets and thus will have better services and facilities [39]. Besides age, the size of the parks also affects visitors’ satisfaction. Larger parks generally have more recreation facilities, more plants, and more activities. As visitors go to national parks to experience nature firsthand, the number of habitats will influence their visits to the parks. Parks with more habitats will attract more visitors [43]. In terms of recreational facilities like visitor centers, boardwalks, and paved internal roads, their availability in parks has a strong influence on the number of tourist visitations. Visitors tend to prefer parks with these facilities [38]. In addition, it is also important to maintain these facilities to enhance visitors’ experience. Facilities that are well maintained are usually able to provide security and encourage more outdoor activities [43].

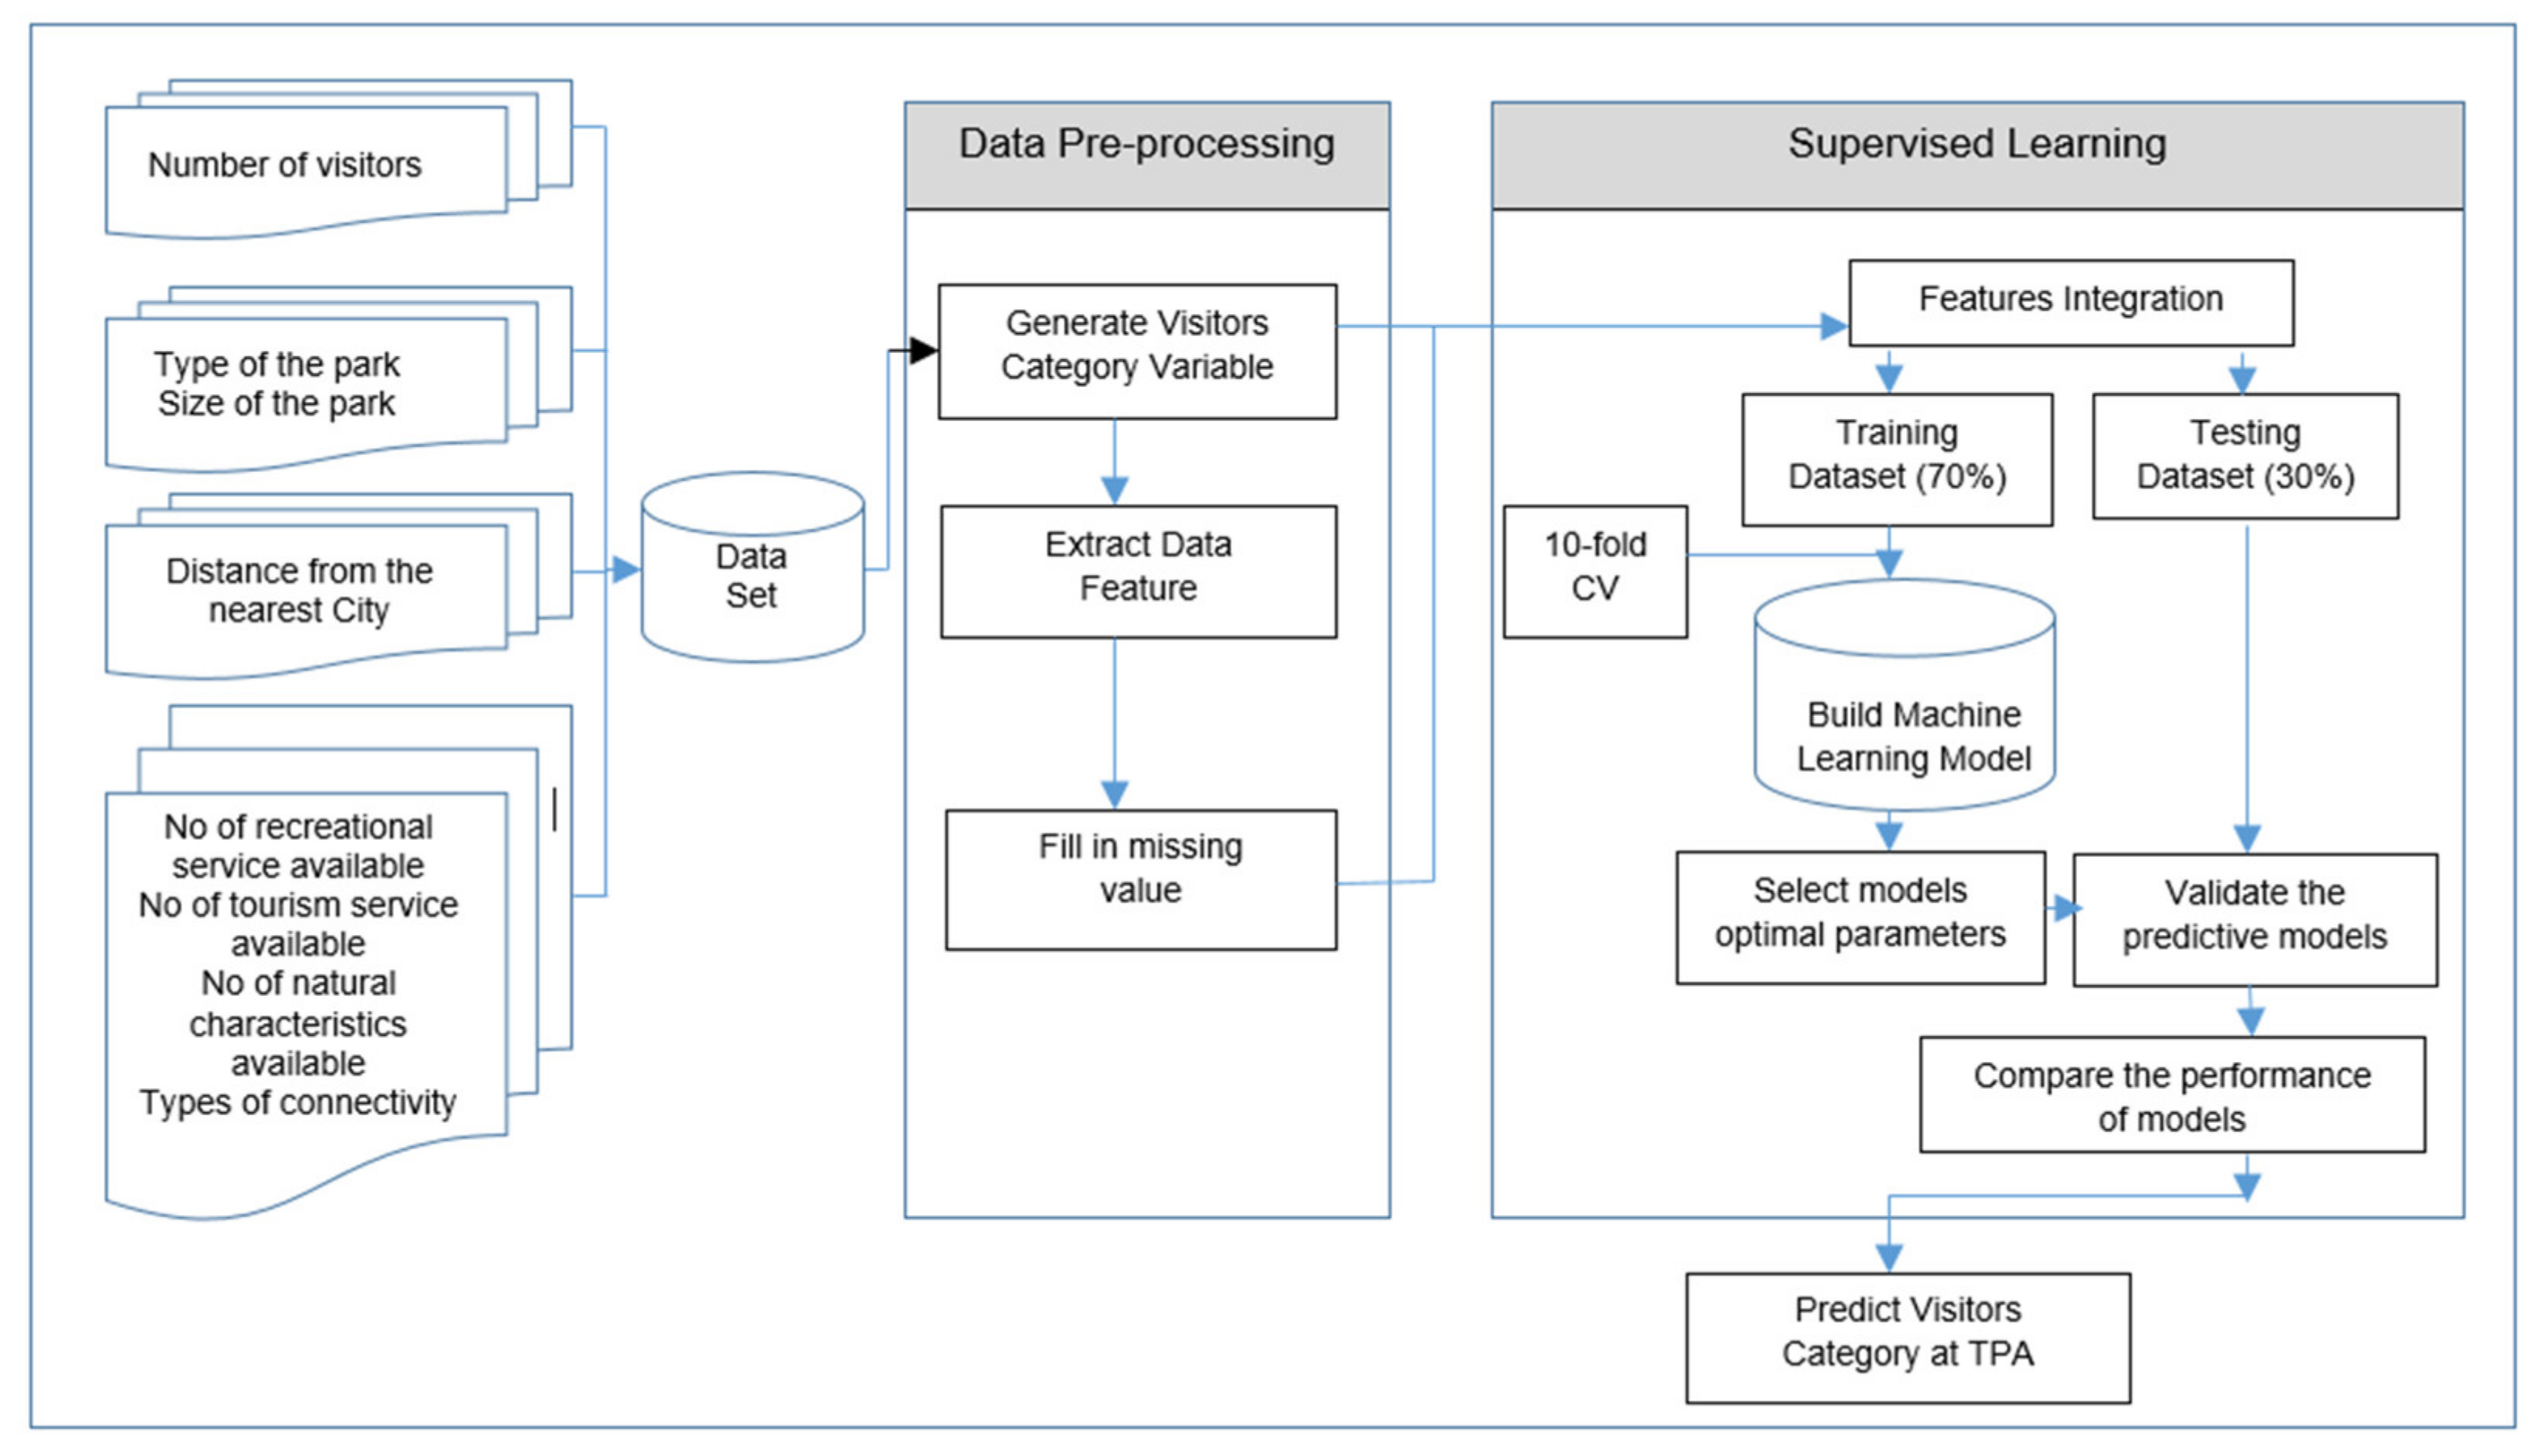
3. Materials and Methods

This study applied the CRISP-DM (cross industry standard process for data mining) [44] methodology process in developing a predictive model using machine learning as being used by other researchers [45]. Following the six steps of the CRISP-DM model, this study begins the process by understanding the business problem where it involves transforming the business problem of predicting visitors’ category of the park into a data mining problem. Then, the next step involves data understanding, including data collection and familiarization on the measurement scale of the data. Then, the data were prepared and analyzed. This involves pre-processing, cleaning, and transforming the data into suitable measurements for analysis. After pre-processing, the data were partitioned into two parts, which are 70% for the training set and 30% for the testing set using K-fold cross validation. This ratio of 70:30 was chosen as it is a common ratio used by researchers [46] to obtain the optimum performance of the classifier for model validation. The process was done using K-fold cross validation as it better uses the data and can offer much more information about algorithm performance [27,28]. Then, the fourth step is modeling, which involves several machine learning models for prediction. After model development, it is evaluated based on accuracy measures and can be used for deployment. The block diagram of the classified prediction process is shown in Figure 1. In brief, the dataset, which was comprised of visitor’s category, type of the park, size of the park, distance from the nearest city, number of recreational services available, number of tourism services available, number of natural characteristics available, and types of connectivity was pre-processed. Then, five machine learning algorithms, including k-NN, naïve Bayes, decision tree (gain ratio, decision tree (information gain), and decision tree (Gini) that fit with classification problem for prediction purposes, were applied to construct the predictive models. The models’ parameters were optimized with 10-fold cross-validation. After that, the predictive models were validated, and the performances of these models were compared. Finally, the visitor’s arrival based on the optimal machine learning model was predicted. The details are discussed in the following sub-sections.

3.1. Study Area

Sarawak, the largest state in Malaysia, also known as “Land of Hornbill”, is located on the island of Borneo sharing its border with Kalimantan of Indonesia, Brunei Darul Salam, and Sabah. Sarawak, with the size of 124,450 square kilometers [47], stretches out along the island’s northwest coast, including many beaches on the South China Sea. Sarawak can be segmented into three areas which are coastal lowlands comprising peat swamp as well as narrow deltaic and alluvial plains; a large area of undulating hills ranging to about 300 m; and the mountain highlands extending to the Kalimantan border [48]. In addition, the Sarawak landscape is known for the rugged, thick green rainforest of its interior; much of it is totally protected areas. Sarawak’s totally protected areas encompassing national parks, wildlife sanctuaries, and rehabilitation, including nature reserves, are part of vast conserved rainforests.
Sarawak has three types of Totally Protected Areas (TPAs) which are (i) National Parks, (ii) Wildlife Sanctuaries and (iii) Nature Reserves. Eighteen locations TPAs, which account for only 1.82% of Sarawak’s entire territory (approximately 2270 km2) as displayed in Figure 2. The oldest TPA, which was gazetted in 1957, is Bako National Park, whilst the newest addition established in 2013 is Fairy Cave Nature Reserve, located near the city of Kuching. The size of parks ranges from 0.06 km2 to 857 km2. Gunung Mulu National Park is the largest park covering 857.71 km2, followed by Maludam National Park. At the opposite end of the scale is the Wind Cave nature reserve, with a total area of only 0.0616 km2. It is followed by Sama Jaya Nature Reserve, which covers 0.379 km2, and Fairy Cave Nature Reserve at 0.56 km2. These TPAs offer long-term conservation of nature with associated ecosystem services and cultural values that indirectly attract many local and even foreign visitors to explore them. This includes endless plants and animals, including several species of primates, birds, and mammals; on-site accommodation ranging from hostel beds to chalets; and daily activities including jungle trekking, wildlife spotting, night safaris, and canopy walks.

3.2. Data Description

Data on the number of visitors for local and foreign tourists who come from all states in Malaysia as well as other countries were obtained from the Sarawak Forestry Corporation, Sarawak. These data contain the aggregate numbers of local and foreign tourists’ arrival at all totally protected areas in all national parks, nature reserves, and wildlife centers for each month from January 2015 to December 2019, giving a total of 1080 observations for both local and foreign tourists. Additionally, the study focused on classifying the visitor’s arrivals, and the categorical variable was generated from the monthly total visitors’ arrival. In the absence of a guideline threshold for the monthly number of visitors, the categories of visitors’ arrival were determined as three groups of low, medium, and high visitor’s arrival by reference to the previous studies [49]. Specifically, for the local visitors, the low visitors refer to a total number of fewer than 1000 tourists, medium visitors between the range of 1001 to 3000 while more than 3001 are classified as high visitors. Meanwhile, for foreign visitors, the low visitors refer to a total number of fewer than 200 tourists, medium visitors range between 201 and 1500, and more than 1501 are classified as high visitors. These categorical variables of Visitors Category arrival were used as the primary dependent variables in the analysis. Detailed description on the variables involved in this study is described in Table 1.
The explanatory variables considered in this study are the type of the park, size of the park, distance from the nearest city, types of connectivity, number of recreational services, tourism, and natural characteristics available. The diversity of the parks is reflected in the variety of designations given. Basically, Sarawak has three types of totally protected areas which are national parks, nature reserves, and wildlife centers. Generally, national parks are open to the public with a certain entrance fee for recreation, trailing, camping, sightseeing, and educational activities. In addition, the nature reserves have the same purpose as the national parks except that they are smaller in size, which is less than 1000 ha. On the contrary, wildlife sanctuaries have limited public access and are strictly for conservation and research for both foreign and domestic researchers [50] (Forest Department Sarawak, 2020). In this study, the types of TPAs were denoted as 1 for national park, 2 for nature reserve, and 3 for wildlife center.
Distance to the city is another variable used in this study. It refers to the distance that tourists travel to visit parks based on the location of the park from the nearest city. Distance is an important component known as park ‘accessibility’ because distance from a park appears to be strongly correlated with other aspects of park use, such as the frequency of visitation or the types of activities people undertake when they visit a park. The size of each park is also considered in this study which is measured in square kilometers. The individual size of parks in Sarawak varied from 0.06 to 857 km2. The natural characteristics available were also one of the factors used as covariates. This variable counted the number of natural characteristics available for each park. According to International Union for Conservation of Nature (Available online: iucn.org), the natural features could include natural geological and geomorphological features, such as waterfalls, cliffs, craters, caves, fossil beds, sand dunes, rock forms, valleys, and marine features such as seamounts or coral formations, culturally-influenced natural features: such as cave dwellings and ancient tracks, natural–cultural sites: such as the many forms of sacred natural sites (sacred groves, springs, waterfalls, mountains, sea coves, etc.), which are of importance to one or more faith groups and cultural sites with associated ecology where protection of a cultural site also protects significant biodiversity, such as archaeological/historical sites that are inextricably linked to a natural area.
Another important variable considered is the recreational service available at the park. This variable calculated the number of recreational services available at each park. Recreation is considered to be the activities that tourists carry out during their visits to the parks. The recreation facilities such as trails, campfires, huts, guidance services, etc., being offered to the tourists are considered. While tourism-services-provided factors computed the number of tourism services provided at each park. The tourism services offer services connected with accommodation, bus tours, taxis, tour guiding, vending, water sports, food and beverage, cultural history sites, etc. Finally, the type of connectivity is the last factor considered, which refers to how tourists can get access to the park. There are five categories identified, namely connectivity by type 1 = road, 2 = road and water, 3 = road and air, 4 = water and air, and 5 = road, water, and air.

3.3. Machine Learning Methods

In this study, five well-accepted machine learning algorithms, k-NN, naïve Bayes, decision tree—gain ratio, decision tree—Gini Index, and decision tree—information gain, were applied to develop predictive models with the unique feature set. The following machine learning methods were considered according to their characteristics.

3.3.1. K-NN Algorithm

K-NN algorithm is one of the well-known classification methods. This algorithm classifies objects based on closes training examples in the feature space. The closeness is defined in terms of a distance metric called Euclidean distance [51]. Thus, in this study, the object is classified by a majority vote of its neighbor, with the object being assigned to the class most common among its k nearest neighbors, as illustrated in Figure 3 below. The best choice of k depends upon the data.

3.3.2. Naïve Bayes

Naïve Bayes is a supervised algorithm for building classifiers based on Bayes theorem using classification methods. Naïve Bayesian model is easy to build and especially useful for large data sets. In this algorithm, the occurrence of each feature is independent of the occurrence of various features. It needs a small number of training data for classification, and all terms can be precomputed; thus, classifying becomes easy, fast, and effective. This classifier predicts the posterior probability for a given tuple whether it belongs to a particular class based on the prior probability using Bayesian formula. Then it classifies the object into the category with maximum posteriori probability. The Bayes’ theorem calculate the posterior probability P ( H | X ) , from P H , P ( X | H ) and P X [51] as follow:
P H | X = P X | H . P H / P X
where H is class variable data set and X is a dependent feature vector (of size n) where X = ( x 1 ,   x 2 ,   x 3 , ,   x n ) .

3.3.3. Decision Tree

Decision tree is one of the supervised learning algorithms. The decision tree can also be used in classification and regression. In a decision-tree building algorithm, first, the best attribute of the dataset is placed at the root, then the training dataset is split into subsets. The splitting of data depends on the features of the datasets. This process is done until all data are classified and the leaf node at the various branch is identified. Information gain can be calculated to find which feature is giving the highest information gain. Decision trees are created for making a training model that can be used to predict the class or the value of the target variable.

3.4. Performance Evaluation

This study used 10-fold cross-validation to evaluate the machine learning models. Cross-validation was conducted by splitting the data into 10 subsets of training and validation set randomly. Model performance measures were then calculated and averaged out from the output to increase accuracy and avoid overfitting. Classification accuracy (CA), sensitivity, and specificity were computed from the classification table results of the prediction model fitted from the algorithm. The performance evaluation was as follows:
  • Classification accuracy measures the proportion of correctly classified cases predicted by the model. It divides the total of correctly classified cases with all observations. The higher the accuracy, the better the model is.
  • Sensitivity measures the true positive rate, which refers to the probability of detecting the true outcome. It measures the proportion of positive cases that are correctly identified by the model.
  • Specificity measures the true negative rate, which refers to the probability of detecting the false outcome. It measures the proportion of negative cases that are correctly identified by the model.

4. Results

4.1. Prediction Model for Local Visitors

There were five machine learning algorithms fitted for the local visitors’ data in this study which are k-NN, naïve Bayes, and three types of decision tree algorithms, namely gain ratio, Gini, and entropy. All these five types of algorithms were compared based on accuracy measures. Table 2 summarizes the accuracy rate for five models applied on the training and validation set. The results are obtained from a 10-fold cross-validation process. Based on Table 2, the decision-tree model of gain ratio was chosen as the best predictive model to predict local visitors to protected areas in Sarawak. It gives a high accuracy rate of 80.65% with a standard deviation of 4.35. Further explanations on the gain ratio decision rules are described in the next section.
Based on gain ratio decision tree in Figure 4, the importance predictor for the decision tree (gain ratio) model for local visitors shows that distance to the nearest city is the most important variable, followed by the size of the park. Based on the gain ratio decision rules, a very clear significant rule to predict high local visitors to Sarawak’s protected areas is when the distance of the park to the nearest city is less than 22.6 km. This shows that the local tourist is very much concerned about the distance of the park to the nearest city. Another significant rule found from this gain ratio tree for predicting medium visitors to the park is when the size of the park is less than 61.88 km2, and the distance of the park to the nearest city is between 22.6 km and 115 km, while those parks with a size of greater than 98.66 km2 and distance to the nearest city is greater than 22.6 km are expected to receive low visitors. Another rule that also describes low visitors’ park is when the distance of the park to the nearest city is greater than 115 km with a size of less than 98.66 km2. The interpretations of the gain ratio rule to predict visitors to protected areas that involve high, medium, and low visitors are presented in Table 3 and Figure 5 below.

4.2. Prediction Model for Foreign Visitors

Five machine learning algorithms were fitted for the foreign visitors’ data in this study which are k-NN, naïve Bayes, and three types of decision tree algorithms, namely gain ratio, Gini, and entropy. All five types of algorithms were evaluated and compared based on accuracy measures. Table 4 summarizes the accuracy rate for five models applied on the training and validation set using 10-fold cross-validation. Based on Table 4, naïve Bayes, gain ratio decision tree, Gini decision tree, and entropy decision tree give the highest accuracy value. However, the gain ratio was chosen as the best splitting criteria among other algorithms since this study has polynomials attributes with many values. It gives a high accuracy rate of 84.35% with a standard deviation of 3.19. Hence, further explanations on the gain ratio decision rules are described in the next section.
Based on gain ratio decision rules in Figure 4, the age of the park is the most important predictor to determine the number of foreign visitors visiting the park. Other important factors of concern by the foreign visitors besides age are types of the park, size, connectivity, number of recreational activities available, and distance of the park from the nearest city. Based on Figure 6 and Table 5 gain ratio decision rules, the most significant rule to predict high foreign visitors park in Sarawak’s totally protected area is when the age of the park is more than 54.5 years old. Another rule that predicts the high foreign visitors’ park is when the age is less than 54.5 years old, but the park is a wildlife center with distance to the nearest city less than 22 km.
Based on these findings, it was found that the older the age of the park, the higher is the tourists’ preference to visit the park. They also prefer wildlife centers as compared to national parks and nature reserves. For the prediction of medium visitors’ park, the first significant rule that highlights the medium visitors’ park is when the age of the park is less than 54.5 years and the type of the park is a nature reserve. The second rule that significantly predicts the medium foreign visitors’ park is when the age of the park is less than 54.5 years and a wildlife center with the distance of the park to the nearest city is 33.2 km. The third rule to predict medium visitors’ park is when the age of the park is less than 54.5 years old and type of park is a national park with a size of more than 549 km2. Other significant factors that determined the medium foreign visitors’ park are connectivity and availability of recreational services provided. When the age of the park is less than 54.5 years old and the size of a national park is between 15.1 and 79.7 km2 and has connectivity access by road, water, and air, the park is also predicted as a medium visitors park. The park that received low visitors is the national park that is less than 54.5 years old, with a size between 79.7 and 549 km2, and also those national parks with that age range and size of less than 15.1 km2.

5. Discussion

This paper intends to identify factors affecting local and foreign visitors to Sarawak’s totally protected areas using machine learning models. This study focuses on eighteen totally protected areas covering national parks, nature reserves, and wildlife centers in Sarawak, Malaysia. Data on local and foreign tourists’ arrival from 2015 to 2019 were evaluated for the best machine learning model to predict visitors’ arrival. Variables such as the number of tourists and recreation services availability, natural characteristics availability, and types of connectivity were used in each model. Five machine learning algorithms fitted for local visitors’ data applied in this study were k-NN, naïve Bayes, gain ratio, Gini, and entropy. Comparatively, based on accuracy measures, the decision tree model of gain ratio was chosen as the best predictive model to predict local visitors to totally protected areas in Sarawak. It gives a high accuracy rate of 80.65% with a standard deviation of 4.35.
The interpretations of the gain ratio rule to predict local visitors to totally protected areas categorized the parks as high, medium, and low visitors. Based on gain ratio decision rules, Semenggoh and Sama Jaya were categorized as high visitors parks. Medium local visitors’ parks comprised of Bako, Niah, Wind Cave, Santubong, Fairy Cave, Gunung Gading, Kubah, and Matang. Meanwhile, Talang Satang, Tanjung Datu, Maludan, Gunung Mulu, Batang Air, Logan Bunut, Similajau, and Lambir Hills were categorized as low visitors parks.
For foreign visitors’ parks, the gain ratio was also chosen as the best predictive model with an accuracy rate of 84.35% and a standard deviation of 3.19. Based on gain ratio decision rules, it was found that the older the age of the park, the higher is the tourists’ preference to visit the park. They also prefer wildlife centers as compared to national parks and nature reserves. When the age of the park is less than 54.5 years old with a size between 15.1 and 79.7 km2 and has connectivity access by road, water, and air, the park is also predicted as a medium visitors’ park. National parks that are less than 54.5 years old, with sizes between 79.7 and 549 km2, and also national parks with that age range with a size of less than 15.1 km2 received low visitors.

6. Conclusions

Results show that Semenggoh and Sama Jaya are categorized as high local visitors parks. Both parks are located near to city centers and are easily accessible by road. Therefore, these parks are one of the main tourism packages offered by travel agencies and independent tour guides. As the price of these packages is comparatively lower than other packages, they are highly demanded by both local and foreign visitors. The parks’ location also makes them popular among schools and higher institutions to conduct study tours. More initiatives and collaborations can be deliberated to attract schools and higher institutions to conduct study tours at medium and low visitors parks. Medium local visitors parks comprised of Bako, Niah, Wind Cave, Santubong, Fairy Cave, Gunung Gading, Kubah, and Matang, while Talang Satang, Tanjung Datu, Maludan, Gunung Mulu, Batang Air, Logan Bunut, Similajau, and Lambir Hills are categorized as low visitors parks.
All these parks are unique on their own and can offer different experiences to visitors. Recreational activities like camping, jungle trekking, and hiking can be carried out at these parks. Some parks, except those that limit their number of visitors, can also attract ardent environmentalists through their conservation programs. Competitions for video- and photo-taking and storytelling can be organized to gather useful information that can be used to develop packages that fulfill the current market demand. These competitions, which invite participation from the public, will instill a better sense of belonging to the packages offered. The public will feel that their participation has contributed to the development of the packages. In addition to packages currently offered in the market, these new packages should appeal to visitors and lure them into considering these parks as their holiday destinations.
More promotion activities can be carried out to promote these packages. Digital billboards can be an essential promotional tool as it increases the visibility of products. These billboards are able to engage with customers on a grand scale and thus create greater awareness of the packages offered. Besides using digital billboards, one of the best ways for promotion is using social media. By taking advantage of social media, a huge number of potential customers can be captured. For example, travel influencers can help to publish these tour packages on their social media pages. Social media groups for hikers, campers, and jungle trekkers can be exploited by the concerned party to promote these parks. They can be a group member and utilize this platform to attract potential visitors. Similarly, videos can be used as a visual interactive insight to help visitors visualize themselves in a particular destination and would inspire them to purchase the packages offered. Continuous participation in trade exhibitions, locally or abroad, could also be used as a promotional tool. At these exhibitions, besides creating awareness of the parks’ existence, the medium and low visitors’ parks can be offered to organizations and institutions as teambuilding or motivational retreats.
Events play an important role in attracting tourists and are often staged to increase the appeal of attractions. Events such as trail run with tree species, insects, and plants can be organized to attract visitors, particularly to the low visitors TPAs. SFC should consider investing in new infrastructures and maintaining the current ones to ensure such events can be carried out. This would ultimately create job opportunities and bring socio-economic development to the community.
Information is imperative to predict tourist demand, to allow a better decision-making process, and to manage knowledge flows and interaction with customers [48]. Organizations that manage TPAs engaging in tourism need to understand and capitalize information to offer visitors with authentic, unique, and inspirational visiting experience [49]. Information on visitors’ demographic profiles, behavioral, and motivational aspects will enable SFC to predict and restrategize products’ offerings, presentations, delivery systems, infrastructure, amenities, and human capital development. Additionally, understanding the needs of visitors will also ensure more efficient and effective services are provided. SFC should also have an extensive database and information derived from research to detect changes in conditions of the parks. The carrying capacity of parks that record a high number of visitors should be identified and monitored. This is important to ensure that these increases in visitation will not affect visitors’ experience and the health of ecosystems and wildlife. Hence, it is important for SFC to develop digital visitors’ database system that will enable SFC management to analyze data for useful purposes to determine when to take actions and plan for future directions.

Author Contributions

Conceptualization, A.Z.A.A. and W.F.W.Y.; Data curation, W.F.W.Y. and S.A.M.N.; Formal analysis, W.F.W.Y.; Funding acquisition, A.Z.A.A. and S.J.; Methodology, W.F.W.Y.; Resources, S.M.; Visualization, W.F.W.Y. and S.A.M.N.; Writing—original draft, W.F.W.Y., S.A.M.N., and S.J.; Writing—review and editing, A.Z.A.A. and S.J. All authors have read and agreed to the published version of the manuscript.

Funding

The authors would like to thank Sarawak Forestry Corporation for the funding of this research (100-TNCPI/PRI 16/6/2(058/2021)).

Data Availability Statement

Not applicable.

Acknowledgments

Authors would like to thank reviewers for their helpful and constructive comments and suggestions that greatly contributed to improving the final version of this paper.

Conflicts of Interest

The authors declare no conflict of interest.

References

  1. UNWTO. Global and Regional Tourism Performance. 2021. Available online: https://www.unwto.org/global-and-regional-tourism-performance (accessed on 15 October 2021).
  2. Tourism Malaysia. International Tourist Arrivals to Malaysia Plunge 83.4% in 2020. 2021. Available online: https://www.tourism.gov.my/media/view/international-tourist-arrivals-to-malaysia-plunge-83-4-in-2020 (accessed on 10 October 2021).
  3. De Urioste-Stone, S.M.; Scaccia, M.D.; Howe-Poteet, D. Exploring visitor perceptions of the influence of climate change on tourism at Acadia National Park, Maine. J. Outdoor Recreat. Tour. 2015, 11, 34–43. [Google Scholar] [CrossRef]
  4. Gosal, A.S.; McMahon, J.A.; Bowgen, K.M.; Hoppe, C.H.; Ziv, G. Identifying and mapping groups of protected area visitors by environmental awareness. Land 2021, 10, 560. [Google Scholar] [CrossRef]
  5. Rashid Niaghi, A.; Hassanijalilian, O.; Shiri, J. Estimation of reference evapotranspiration using spatial and temporal machine learning approaches. Hydrology 2021, 8, 25. [Google Scholar] [CrossRef]
  6. Drexl, J.; Hilty, R.; Beneke, F.; Desaunettes, L.; Finck, M.; Globocnik, J.; Gonzalez Otero, B.; Hoffmann, J.; Hollander, L.; Kim, D.; et al. Technical Aspects of Artificial Intelligence: An Understanding from an Intellectual Property Law Perspective; research paper no. 19–13; Max Planck Institute for Innovation & Competition: Munich, Germany, 2019; pp. 1–14. [Google Scholar] [CrossRef] [Green Version]
  7. Krizhevsky, A.; Sutskever, I.; Hinton, G.E. Imagenet Classification with Deep Convolutional Neural Networks. In Advances in Neural Information Processing Systems; Curran Associates Inc.: Red Hook, NY, USA, 2012; pp. 1–9. [Google Scholar]
  8. Mnih, V.; Heess, N.; Graves, A. Recurrent Models of Visual Attention. Advances in Neural Information Processing Systems. In Proceedings of the 28th Annual Conference on Neural Information Processing Systems 2014 [(NIPS)], Montreal, QC, Canada, 8–13 December 2014; pp. 1–9. [Google Scholar]
  9. Li, K.; Lu, W.; Liang, C.; Wang, B. Intelligence in tourism management: A hybrid FOA-BP method on daily tourism demand forecasting with web search data. Mathematics 2019, 7, 531. [Google Scholar] [CrossRef] [Green Version]
  10. Sun, S.; Wei, Y.; Tsui, K.L.; Wang, S. Forecasting tourist arrivals with machine learning and internet search index. Tour. Manag. 2019, 70, 1–10. [Google Scholar] [CrossRef]
  11. Rezapouraghdam, H.; Akhshik, A.; Ramkissoon, H. Application of machine learning to predict visitors’ green behavior in marine protected areas: Evidence from Cyprus. J. Sustain. Tour. 2021, 30, 1–25. [Google Scholar] [CrossRef]
  12. Rodríguez-Piñeros, S.; Mayett-Moreno, Y. Forest owners’ perceptions of ecotourism: Integrating community values and forest conservation. Ambio 2015, 44, 99–109. [Google Scholar] [CrossRef] [Green Version]
  13. Rossi, S.D.; Byrne, J.A.; Pickering, C.M. The role of distance in peri-urban national park use: Who visits them and how far do they travel? Appl. Geogr. 2015, 63, 77–88. [Google Scholar] [CrossRef] [Green Version]
  14. Taplin, R.H.; Rodger, K.; Moore, S.A. A method for testing the effect of management interventions on the satisfaction and loyalty of national park visitors. Leis. Sci. 2016, 38, 140–160. [Google Scholar] [CrossRef]
  15. Widawski, K.; Olesniewicz, P.; Rozenkiewicz, A.; Zareba, A.; Jandová, S. Protected areas: Geotourist attractiveness for weekend tourists based on the example of Gorczanski National Park in Poland. Resources 2020, 9, 35. [Google Scholar] [CrossRef] [Green Version]
  16. Joppa, L.N.; Pfaff, A. High and far: Biases in the location of protected areas. PLoS ONE 2009, 4, e8273. [Google Scholar] [CrossRef]
  17. Groulx, M.; Lemieux, C.J.; Lewis, J.L.; Brown, S. Understanding consumer behaviour and adaptation planning responses to climate-driven environmental change in Canada’s parks and protected areas: A climate future scapes approach. J. Environ. Plan. Manag. 2017, 60, 1016–1035. [Google Scholar] [CrossRef]
  18. Höpken, W.; Eberle, T.; Fuchs, M.; Lexhagen, M. Improving tourist arrival prediction: A big data and artificial neural network approach. J. Travel Res. 2020, 60, 998–1017. [Google Scholar] [CrossRef]
  19. Alfares, H.K.; Nazeeruddin, M. Electric load forecasting: Literature survey and classification of methods. Int. J. Syst. Sci. 2002, 33, 23–34. [Google Scholar] [CrossRef]
  20. Caraka, R.E.; Yasin, H.; Chen, R.C.; Goldameir, N.E.; Supatmanto, B.D.; Toharudin, T.; Basyuni, M.; Gio, P.U. Evolving hybrid cascade neural network genetic algorithm space-time forecasting. Symmetry 2021, 13, 1158. [Google Scholar] [CrossRef]
  21. Santra, A.K.; Christy, C.J. Genetic algorithm and confusion matrix for document clustering. Int. J. Comput. Sci. 2012, 9, 322–328. [Google Scholar]
  22. AgaAzizi, S.; Rasekh, M.; Abbaspour-Gilandeh, Y.; Kianmehr, M.H. Identification of impurity in wheat mass based on video processing using artificial neural network and PSO algorithm. J. Food Process. Preserv. 2021, 45, 1–13. [Google Scholar] [CrossRef]
  23. Zeinalnezhad, M.; Chofreh, A.G.; Goni, F.A.; Klemeš, J.J. Air pollution prediction using semi-experimental regression model and Adaptive Neuro-Fuzzy Inference System. J. Clean. Prod. 2020, 261, 1–16. [Google Scholar] [CrossRef]
  24. HHrdle, W.K.; Prastyo, D.D.; Hafner, C.M. Support vector machines with evolutionary feature selection for default prediction. SSRN Electron. J. 2017, 1–24. [Google Scholar] [CrossRef] [Green Version]
  25. Caraka, R.E.; Hudaefi, F.A.; Ugiana, P.; Toharudin, T.; Tyasti, A.E.; Goldameir, N.E.; Chen, R.C. Indonesian Islamic moral incentives in credit card debt repayment: A feature selection using various data mining. Int. J. Islam. Middle East. Financ. Manag. 2021. [Google Scholar] [CrossRef]
  26. Nayak, J.; Naik, B.; Behera, H.S. A comprehensive survey on support vector machine in data mining tasks: Applications & challenges. Int. J. Database Theory Appl. 2015, 8, 169–186. [Google Scholar] [CrossRef]
  27. Sani, N.S.; Rahman, M.A.; Bakar, A.A.; Sahran, S.; Sarim, H.M. Machine learning approach for bottom 40 percent households (B40) poverty classification. Int. J. Adv. Sci. Eng. Inf. Technol. 2018, 8, 1698–1705. [Google Scholar] [CrossRef]
  28. Zhao, D.; Huang, C.; Wei, Y.; Yu, F.; Wang, M.; Chen, H. An effective computational model for bankruptcy prediction using kernel extreme learning machine approach. Comput. Econ. 2017, 49, 325–341. [Google Scholar] [CrossRef]
  29. Livieris, I.E.; Pintelas, E.; Kotsilieris, T.; Stavroyiannis, S.; Pintelas, P. Weight-constrained neural networks in forecasting tourist volumes: A case study. Electronics 2019, 8, 1005. [Google Scholar] [CrossRef] [Green Version]
  30. Borhan, N.; Arsad, Z. Determining Factors Affecting Tourism Demand for Malaysia Using ARDL Modeling: A Case of Europe Countries. In AIP Conference Proceedings; AIP Publishing LLC: Melville, NY, USA, 2016; Volume 1782, p. 050005. [Google Scholar]
  31. Mordecki, G. Determinants of Argentinean Tourism Demand in Uruguay. In Documentos de Trabajo; Working Papers; Instituto de Economia—IECON, Universidad de la República: Montevideo, Uruguay, 2014; pp. 14–17. [Google Scholar]
  32. Ţigu, G.; Simoni, S. Analyzing the mountain tourism demand in Romania over the last two decades. Ann. Univ. Oradea Econ. Sci. Ser. 2015, 24, 696–705. [Google Scholar]
  33. Rasekhi, S.; Mohammadi, S. Factors affecting tourism demand in the Caspian Sea Littoral States. Tour. Manag. Stud. 2017, 12, 63–81. [Google Scholar]
  34. Pishbahar, E.; Yadavar, H. Effective factors on tourism demand of aras free zone: Using structural equation modeling (SEM) approach. Iran. J. Agric. Econ. Dev. Res. 2018, 48, 547–729. [Google Scholar]
  35. Azlizam, A.; Syed-Alias, S.N.H.; Mazlina, J.; Idris, N.H.; Manohar, M. The attractiveness of Taman Negara National Park, Malaysia as perceived by local visitors. J. Wildl. Parks 2018, 33, 1–13. [Google Scholar]
  36. Nur Hafizah, I.; Azlizam, A.; Manohar, M.; Mazlina, J. Attractiveness of recreational forests: An overview on selected research. Int. J. Indep. Res. Stud. 2013, 2, 102–108. [Google Scholar]
  37. Hong-Bumm, K. Perceived attractiveness of Korean destinations. Ann. Tour. Res. 1998, 25, 340–361. [Google Scholar] [CrossRef]
  38. Castro, E.V.; Souza, T.B.; Thapa, B. Determinants of tourism attractiveness in the national parks of Brazil. Parks J. 2015, 21, 51–62. [Google Scholar]
  39. Neuvonen, M.; Pouta, E.; Puustinen, J.; Sievanen, T. Visits to national parks: Effects of park characteristics and spatial demand. J. Nat. Conserv. 2019, 18, 224–229. [Google Scholar] [CrossRef]
  40. Martinette, K.; Melville, S. Travel motivation of tourists to Krugerand Tsitsikamma National Parks: A comparative study. S. Afr. J. Wildl. Res. 2010, 40, 93–102. [Google Scholar]
  41. Hanink, D.M.; White, K. Distance effects in the demand for wildland recreational services: The case of national parks in the United States. Environ. Plan. A 1999, 31, 477–492. [Google Scholar] [CrossRef]
  42. Mills, A.S.; Westover, T.N. Structural differentiation: A determinant of park popularity. Ann. Tour. Res. 1987, 14, 486–498. [Google Scholar] [CrossRef]
  43. Liu, R.; Xiao, J. Factors affecting users’ satisfaction with urban parks through online comments data: Evidence from Shenzhen, China. Int. J. Environ. Res. Public Health 2020, 18, 253. [Google Scholar] [CrossRef] [PubMed]
  44. Marbán, Ó.; Mariscal, G.; Segovia, J. A Data Mining & Knowledge Discovery Process Model; IntechOpen: London, UK, 2019. [Google Scholar]
  45. Yaacob, W.F.W.; Nasir, S.A.M.; Yaacob, W.F.W.; Sobri, N.M. Supervised data mining approach for predicting student performance. Indones. J. Electr. Eng. Comput. Sci. 2019, 16, 1584–1592. [Google Scholar] [CrossRef]
  46. Salim, N.A.M.; Wah, Y.B.; Reeves, C.; Smith, M.; Yaacob, W.F.W.; Mudin, R.N.; Dapari, R.; Sapri, N.N.F.F.; Haque, U. Prediction of dengue outbreak in Selangor Malaysia using machine learning techniques. Sci Rep. 2021, 11, 939. [Google Scholar] [CrossRef]
  47. Ministry of Tourism, Arts and Culture Sarawak. Economic Planning Unit Sarawak. Sarawak Tourism Quick Facts. 2019. Available online: https://mtac.sarawak.gov.my/page-0-228-200-SARAWAK-TOURISM-QUICK-FACTS.html (accessed on 1 January 2022).
  48. The Geography of Sarawak. Available online: https://sarawak.gov.my/web/home/article_view/159/176/ (accessed on 1 January 2022).
  49. Abang Abdurahman, A.Z.; Md Nasir, S.A.; Wan Yaacob, W.F.; Jaya, S.; Mokhtar, S. Spatio-temporal clustering of Sarawak Malaysia total protected area visitors. Sustainability 2021, 13, 11618. [Google Scholar] [CrossRef]
  50. Totally Protected Area (TPA). Available online: https://forestry.sarawak.gov.my/modules/web/pages.php?mod=webpage&sub=page&id=661# (accessed on 1 January 2022).
  51. Han, J.; Kamber, M.; Pei, J. Data Mining: Concepts and Techniques; Elsevier: Amsterdam, The Netherlands, 2012; Volume 10, pp. 978–981. [Google Scholar]
Figure 1. Block diagram of the classified prediction process.
Sustainability 14 02735 g001
Figure 2. Location of TPAs (national parks, nature reserves, and wildlife sanctuaries) in Sarawak.
Sustainability 14 02735 g002
Figure 3. K-NN algorithm classification illustration.
Sustainability 14 02735 g003
Figure 4. Gain ratio decision tree output for local visitors.
Sustainability 14 02735 g004
Figure 5. English rule for gain ratio decision tree.
Sustainability 14 02735 g005
Figure 6. Gain ratio decision tree output for foreign visitors.
Sustainability 14 02735 g006
Table 1. Description of variables.
AttributeDescriptionValue
Visitors_CatLVisitors’ category for local visitors1 = Low visitors
2 = Medium visitors
3 = High visitors
Visitors_CatFVisitors’ category for foreign visitors1 = Low visitors
2 = Medium visitors
3 = High visitors
Type of parkType of the park1 = National park
2 = Nature reserve
3 = Wildlife centre
SizeSize of the parkkm2
NaturalNumber of natural characteristics available at the park1, 2, …, 10
Rec_ServiceNumber of recreational services available1, 2, …, 10
Type of connectivityTypes of connectivity1 = Road
2 = Road and water
3 = Road and air
4 = Water and air
5 = Road, water, and air
Distance cityDistance from the nearest cityDistance of the park from the nearest city (km)
Table 2. Model Performance Result for Local Visitors.
NoAlgorithmAccuracy Rate (%)Std Deviation (+/−)Misclassification Rate (%)
1.K-NN76.486.7823.52
2.Naïve Bayes75.285.7124.72
3.Decision tree—gain ratio80.654.3519.35
4.Decision tree—Gini80.654.7719.35
5.Decision tree—entropy80.654.7719.35
Table 3. English rules of gain ratio decision tree for local visitors.
NoEnglish Rules of Gain Ratio
1.The park is high visitors park when the distance of the park to the nearest city is less than 22.6 km.
2.The park is a medium visitors park when the size of the park is less than 61.88 km2 and the distance of the park to the nearest city is between 22.6 km and 115 km.
3.The park is low visitors park when the size of the park is greater than 98.66 km2 and the distance of the park to the nearest city is greater than 22.6 km.
4.The park is low visitors park when the distance of the park to the nearest city is greater than 115 km, with the size of the park less than 98.66 km2
Table 4. Description of variables.
NoAlgorithmAccuracy Rate (%)Std Deviation (+/−)Misclassification Rate (%)
1.K-NN83.433.770.1657
2.Naïve Bayes84.353.190.1565
3.Decision tree—gain ratio84.353.190.1565
4.Decision tree—GINI84.353.190.1565
5.Decision tree—entropy84.353.190.1565
Table 5. English rules of gain ratio decision tree for foreign visitors.
NoEnglish Rules of Gain Ratio
1.The park is a high foreign visitors park when is when the age of the park is more than 54.5 years old.
2.The park is a high foreign visitors park when the age is less than 54.5 years old and type of park is wildlife center with a distance of the park to the nearest city less than 22 km.
3.The park is a medium foreign visitors park when the age of the park is less than 54.5 years and the type of the park is a nature reserve.
4.The park is a medium foreign visitors park when the age of the park is less than 54.5 years and the type of the park is a wildlife center with the distance of the park to the nearest city is 33.2 km.
5.The park is a medium foreign visitors park when the age of the park is less than 54.5 years old and the type of park is a national park with a size of the park more than 549 km2.
6.The park is a medium foreign visitors park when the age of the park is less than 54.5 years old and the type of park is a national park with a size between 15.1 and 79.7 km2 and has connectivity access by road, water and air.
7.The park is a low foreign visitors park when the age of the park is less than 54.5 years old and the type of park is a national park with a size between 79.7 and 549 km2.
8.The park is a low foreign visitors park when the age of the park is less than 54.5 years old; the type of park is a national park, and the size of the park is less than 15.1 km2.
Publisher’s Note: MDPI stays neutral with regard to jurisdictional claims in published maps and institutional affiliations.

