Abstract
In order to address the environmental impact of building carbon emissions, some developed countries have established certification standards for green housing. However, in many other countries, the green housing and the traditional housing may coexist in the market, and consumers’ willingness to buy the green housing can be different. This paper constructs a duopoly game model that includes a green developer and a traditional developer considering the heterogeneity of consumers’ green preferences and studies how mandatory green standards and subsidies affect the green developer’s pricing decision, profits and the carbon emission reductions of the green housing. The results show that when the marginal cost of green technology is high, raising green standards will hurt the green developer’s profits. Therefore, fiscal subsidies should be considered. The green developer obtains higher profits when subsidizing green consumers. The effectiveness of increasing carbon emission reduction is better when subsidizing the green developer and how to subsidize depends on the cost structure of the green housing. In addition, subsidizing green consumers and the incremental cost of green housing can improve the policy effect of green housing standards. Therefore, a mixed policy of subsidies and green standards can also have a good effect.
1. Introduction
In response to global warming, countries around the world are gradually paying attention to carbon emission reduction in more areas. In recent years, many studies have shown that buildings are the main energy consumption and carbon emission sector. From 2005 to 2018, China’s building energy consumption and carbon emissions showed a steady growth trend. In 2018, building energy consumption accounted for 21.7% of national energy consumption and carbon emissions accounted for 21.9% of national carbon emissions. Among them, residential buildings account for the largest proportion. Energy carbon emissions from urban and rural residential buildings accounted for 42.2 and 20.7% of the country’s total building energy carbon emissions, respectively (China Building Energy Consumption Annual Report 2020, http://www.gba.org.cn/h-nd-1489.html, accessed on 21 October 2021). In addition to the operational phase, the construction, renovation and demolition of residential buildings can also have a serious negative impact on the environment [1].
In order to alleviate the burden of traditional building energy consumption on environmental resources and social development, China began to gradually develop green buildings at the beginning of this century. The green building is defined as a building that can save resources (energy saving, land saving, water saving and material saving) during the whole life cycle, protect the environment, reduce pollution, provide people with health, applicability and efficient living space and coexist in harmony with nature [2].
According to the Thirteenth Five-Year Plan for Building Energy Efficiency and Green Building Development (Thirteenth Five-Year Plan for Building Energy Efficiency and Green Building Development, https://www.mohurd.gov.cn/gongkai/fdzdgknr/tzgg/201703/20170314_230978.html, accessed on 19 November 2021), (1) China’s building energy efficiency standards are lower compared to developed countries with the same climatic conditions, (2) the standards are applied and the quality is uneven, (3) there are still about 60% of the existing buildings in cities and towns that are not energy efficient, with low energy efficiency and poor living comfort, (4) the overall scale of green buildings is small and the development is unbalanced and the actual operational effect of some green building projects is not as good as expected and (5) the development of green buildings mainly relies on administrative constraints and financial capital investment to promote. The market allocation of resources mechanism is still not perfect.
Different consumers may have very different understandings, expectations and value perceptions of green housing. Therefore, it is imperative to study the green housing market under the premise of considering the differences in consumers’ green preferences. Green housing has significant positive externality and usually has a higher cost and selling price. In order to promote emerging green housing, government subsidies should be taken into consideration.
We try to figure out the following problems: (1) how government policies affect carbon emission reduction in the green housing and green developer’s profits and (2) with different competition structure and consumer concern, what kind of subsidies can achieve better effect on carbon emission reduction. To capture the discussed issues, we study an oligopoly market composed of a green developer (GD) and a traditional developer (TD). According to different consumers’ concerns, two models are proposed: the Carbon Emission Concern Model (CECM) and the Emission Reduction Concern Model (ERCM). When studying each model, we consider different competition structures, including GD leading mode and TD leading mode. First, we analyze the equilibrium solutions in the four scenarios when there is no government subsidy. Next, we take different forms of government subsidies into consideration and study the effects of different subsidy policies.
The main contributions of this article are as follows: (1) We propose a consumer utility function that includes subjective willingness and external factors to characterize the complex purchase behavior of different consumers in a market which includes green housing and traditional housing. (2) This paper studies the problem of government subsidies in the duopoly housing market considering consumers’ green preferences and compares the effects of government subsidies from two perspectives: the same subsidy rate and the same subsidy amount. (3) This study provides some useful conclusions, for example, when the incremental cost of the green housing is high, raising the green housing standard is ineffective. The use of financial subsidies has a positive effect on reducing carbon emissions and promoting green housing, among which, subsidizing green consumers is more beneficial to the green developer’s profits, and subsidizing the green developer has better effectiveness on carbon emission reduction. In addition, subsidizing green consumers and subsidizing the incremental cost of green housing can improve the policy effect of green housing standards. Therefore, a mixed policy of green standards and government subsidies can be implemented.
The rest of this paper is structured as follows. We sort out the literature related to our research in Section 2 and present a problem description as well as model setup in Section 3. In Section 4, we study the equilibrium solutions of the two models without government subsidies. In Section 5, we study the equilibrium solutions of the two models with government subsidies and study the impact of different policies on green developer’s profits and the policy effectiveness on improving carbon emission reduction. In Section 6, we summarize the conclusions and discuss future research.
2. Literature Review
In recent years, many scholars have made contributions to the research on green housing. We review the research closely related to our problem, including (1) consumers’ green preferences and (2) policy tools on green housing.
Compared with traditional buildings, the necessary green incremental cost in the construction process of green building will cause a certain green price premium [3,4]. If the economic returns of green housing are sufficient to offset the incremental green costs, which depends on consumers’ acceptance of the green premium, real estate companies will have greater incentives to develop green housing [5]. Hu et al. [6] found that consumers’ income levels determine their willingness to pay for green attributes. Only the rich are willing to pay for green apartments to improve their living comfort. Zhang et al. [7] found that the level of information consumers receive about green housing will affect their willingness to pay for green housing. Feng et al. [8] found that REITs with higher ESG disclosure levels retain a higher market value. De Silva et al. [9] found that education level and gender are more likely to affect environmental awareness. Dippold et al. also confirmed the impact of education level on environmental awareness. In addition, the political preferences of the Democratic Party also have a positive impact on environmental awareness [10].
Research on policy tools focuses on mandatory green standards and incentives. Chen et al. [11] studied green building (GB) in Hong Kong and Singapore and found that government intervention, especially economic and publicity measures, is an important driving force for the GB market. Qi et al. [12] studied construction contractors and found that management attention and government regulatory pressure are the two most important driving forces, but the pressure of project stakeholders does not have much impact. Cidell et al. [13] found that for all cities in the United States with a population of more than 50,000, government policies do lead to more green buildings, rather than population or other factors. Fuerst et al. [14] found that only the mandatory requirements for new buildings to obtain LEED certification can have a significant positive impact on market penetration. Wiley et al. [15] and Reichardt et al. [16] found that buildings with Energy Star-label and LEED certification had higher rents and occupancy. Some studies of green building certification in other countries also show that obtaining green building certification can increase the value of a building [17,18,19]. Tleuken et al. [20] reviewed existing green building certification systems in the context of the COVID-19 pandemic and found that all GBCSs are insufficiently prepared for waste and wastewater management. Some authors have suggested that government subsidies can effectively stimulate the development of green buildings [21,22,23]. MacAskill et al. [24] studied the issue of split incentives in the context of affordable rental housing subsidy schemes. Lai et al. [25] studied the retrofit subsidy issue. Guo et al. [23] found that subsidy-punishment incentives are the most effective compared to subsidy type and without government intervention type. However, due to political, economic and cultural differences, the development model of green housing in different countries can be different [26]. Due to insufficient post-policy supervision and other reasons, the effectiveness of China’s current green housing policies has been questioned [27], and there is a lack of incentives for market-based mechanisms to develop green housing [28].
Some limitations still exist in the above literature. Compared with them, this study has the following novelties: (1) Most literature on consumers’ preferences for green housing studies consumers’ purchasing behavior of green housing in isolation. This paper studies the coexistence of traditional housing and green housing in the market. (2) Few studies on green housing policies consider consumers’ green preferences. In this paper, a consumer utility function including subjective intentions and external factors is constructed to describe the purchasing behavior of different consumers. (3) Existing literature on incentives for green housing often only discusses subsidy mode or penalty mode. This paper studies the impact of subsidies on mandatory green standards. We construct a price game model including a green housing developer and a traditional housing developer considering consumers’ green preferences. We study the impact of green standards and three government subsidies on carbon emission reduction in green housing and the green developer’s profits.
3. Problem Description
The market includes a green housing developer and a traditional housing developer. The green housing has lower carbon emissions but higher costs (additional green incremental costs) than the traditional housing. Consumers in the market have different expectations for the greenness of residences. When the greenness of the house is higher than the green expectations of consumers, they will gain additional utility, otherwise they will lose utility.
3.1. Oligopoly Competition Market for Developers
The specific geographical environment, history and national regional development policies are important constraint variables in the real estate market, so the real estate market is a typical regional market. In the regional market, due to the scarcity of resources such as the geographical location, natural environment and real estate development and construction planning conditions, the products have a regional monopoly. At the same time, real estate companies in the region compete with each other [29].
Under an oligopoly market structure, housing prices will be determined mainly by the developer with monopoly power [30]. In this paper, there is a green developer and a traditional developer competing in an oligopolistic market. We will separately study the market leadership of the green developer or the traditional developer. The leading company has stronger pricing capabilities. Therefore, after the leading company decides the price, the following company can determine the price of its product. The two developers play a pricing game in a market where consumers have different preferences for greenness.
3.2. The Heterogeneity of Consumers’ Green Preferences
China still has an emerging green building market. According to a survey report by Dodge Data & Analytics, one third () of respondents from China report that they are currently performing less than of their projects green (World Green Building Trends 2016, https://www.worldgbc.org/news-media/world-green-building-trends-2016, accessed on 17 November 2021). Therefore, Chinese consumers’ understanding and expectations of green housing can be quite different. In this study, we focus on the heterogeneity of consumers’ green preferences. Existing studies showed that urban residents’ willingness to pay for green housing is affected by internal psychological factors and external situational factors [31]. The internal psychological factors include environmental concern, cognition and individual attitudes, while the external situational factors include social atmosphere and group pressure [32]. Referring to the existing literature, we construct the consumer utility functions as follows,
Here, is a certain consumer’s utility for the traditional housing and the green housing . In our setting, a certain consumer will only buy one house that can bring him greater positive utility. That is to say, if neither of the two kinds of housing can bring positive utility to a certain consumer, then they would not buy either. is the basic performance of the green housing and the traditional housing. Basic performance refers to the value of all the functions of a house that consumers can feel except for green performance (referring to reducing carbon emissions in this paper). is the price of the green housing and the traditional housing. E represents the greenness of the green housing. In this paper, we define the amount of carbon emission reduction per unit area compared with traditional housing as greenness. The government controls the greenness of green housing through mandatory green standards, which is a kind of non-subsidy policy. e represents the consumer’s expectation of greenness, and it portrays the internal psychological factors. When the greenness of houses is not equal to the consumer’s expectations, they will gain additional utility or feel loss, which is also affected by . The parameter is the concern of the whole society on the carbon emissions of the green housing and the traditional housing, which represents external environmental factors. When consumers of the whole society pay more attention to the carbon emission reduction ability of the green housing, even if the actual greenness is only slightly higher than expected, it may bring great additional utility. In the same way, when the entire society pays more attention to the carbon emissions of the traditional housing, even if it is actually slightly lower than a consumer’s expectation, they may find it difficult to accept. In this paper, we assume that consumers obey a uniform distribution on e. Each unit of e can provide the same demand, which is defined as the density of consumers n. All notations used in the paper are documented in Table 1.

Table 1.
List of notations.
This paper devotes to figuring out how GD and TD compete in the regional oligopoly market, and under different power structures and social environmental conditions, how mandatory green standards and different government subsidies affect developers’ optimal pricing decisions and carbon emission reductions. Compared with the study by Guo et al. [23], which studies green residential housing incentive strategies through a dynamic game approach, our model takes into account the heterogeneity of consumers’ green preferences and the competition between two developers. The consumer utility function we constructed includes internal subjective willingness and external consumer concern factors, which can describe complex consumer behavior better. Our model includes two competing developers, which is closer to reality. We study the equilibrium solutions of CECM and ERCM without government financial subsidies and with government financial subsidies, respectively, and study GD leading mode (GL) and TD leading mode (TL) in each model. The research in this paper is based on the following model assumptions:
A1: A certain consumer only chooses one of the following behaviors: buying green housing, buying traditional housing or buying nothing.
A2: A consumer has and only has the ability to pay for a house, regardless of the price.
A3: Both the green housing and the traditional housing have market shares .
4. Analysis in the Absence of the Government Subsidies
We start from a market without government subsidies. GD and TD engage in an oligopolistic pricing game in a market where consumers’ green preferences are heterogeneous. According to different market environments and power structures, we derive the optimal decisions and profits of GD and TD.
The consumer’s utility function is shown in Equation (1). When concerns on the carbon emissions of the green housing and the traditional housing are equal (), the necessary and sufficient conditions for consumers’ utility of the green housing to be greater than that of the traditional housing () is , where can be regarded as the total performances of the green housing measured in currency, including basic performance and emission reduction performance. This means that, for any consumer, the additional utility of green housing carbon reduction is instead of . At this time, consumers’ green preferences are no longer heterogeneous, and all consumers in the market will adopt consistent choices, where one of GD and TD completely monopolizes the market, which contradicts model assumption A3. So, we carry out the following study on the premise that .
Generally, the R&D cost of green technology is quadratic, which is a one-time investment. However, in this paper, we do not consider the situation of GD investing in research and development of green technologies. The green cost is the additional construction cost of green housing. It is the marginal cost per unit of demand, defined as a linear function , for simplicity. In the absence of government subsidies, the profits of green buildings depend on the basic economic returns of traditional buildings and the green premium [33]. The profit functions of the two developers are as follows,
where and are the marginal profit of the traditional developer and the green developer, respectively. We assume that the market demand for any interval of the same length is equal, which is defined as the density of consumers n. So, the market share of the consumers with green expectations from to is .
4.1. Carbon Emission Concern Model
In this subsection, we study the Carbon Emission Concern Model (CECM), where carbon emissions of the traditional housing are more concerned . In this model, we study two modes, GD leading mode (GL) and TD leading mode (TL). We focus on the situation where both GD and TD have market shares and .
Since both GD and TD have market shares, market of the green housing and the traditional housing overlaps partially. Suppose that there is so that and so that . If does not exist, taking as an example, , . for and , for , which means the green housing completely monopolizes the market, and vice versa, which contradicts the model assumption A3. So, there is . According to the utility functions, , . When , the demand functions are as follows,
The CECM is as follows,
The backward induction is used to solve the optimal pricing decisions and the corresponding market demand and profit of the two developers. In the objective function of the green housing, the coefficient of is . In the objective function of the traditional housing, the coefficient of is . All constraints are linear constraints. So, the model is a convex optimization.
In the GL mode, the reaction function is , so GD’s optimal pricing decision , corresponding demand and profit are as follows,
TD’s optimal pricing decision , corresponding demand and profit are given in Appendix A.
Similarly, the reaction function in TL mode is and GD’s optimal pricing decision , corresponding demand and profit are as follows,
4.2. Emission Reduction Concern Model
In this subsection, we study the Emission Reduction Concern Model, where carbon emission reduction in the green housing is more concerned . We also focus on the situation where both GD and TD have market shares . So, market of the green housing and the traditional housing overlaps partially. Suppose that there is so that and so that . When , and when , . According to the utility functions, , . When , the demand functions are as follows,
The ERCM is as follows,
In the objective function of the green housing, since , the coefficient of is . In the objective function of the traditional housing, the coefficient of is . All constraints are linear constraints. So, the model is a convex optimization. Similar to Section 4.1, backward induction is used to solve the model. In GD leading mode, the reaction function is , so GD’s optimal pricing decision , corresponding demand and profit are as follows,
In TDeveloper leading mode, the reaction function is . GD’s optimal pricing decision , corresponding demand and profit are as follows,
We study the policy impact of mandatory green standards without government subsidies. How green standards affect the market share of green housing, carbon emission reductions and GD’s profits are given in Section 4.3.
4.3. Equilibrium in the Absence of the Government Subsidies
Based on the optimal decisions obtained in the previous subsections, we study the policy effects of non-subsidy policies (mandatory green standards) adopted by the government under different power structures and market conditions.
Proposition 1.
When , the government cannot increase the market share of the green housing of GD by raising green standards.
In order to simplify calculation and analysis, we assume that the basic performance and basic cost of the green housing and the traditional housing are equal, respectively, , . The partial derivatives of green housing’s market share of two models are as follows,
From Equations (8)–(11), when , . When the marginal cost of green technology is high, but the emission reduction performance of the green housing has not received enough attention, with the improvement of greenness, GD has to bear higher green costs, and the price of the green housing is forced to rise. However, because consumers pay less attention to the emission reduction performance of the green housing, the additional utility brought by the improvement of greenness cannot make up for the utility loss caused by the price increase. Therefore, with the improvement of greenness, the green housing loses its market share, which means that government cannot promote green housing by setting higher green standards. Government subsidies should be considered in this case.
Proposition 2.
When , raising green standards will help increase carbon emission reduction when the greenness of the green housing is low.
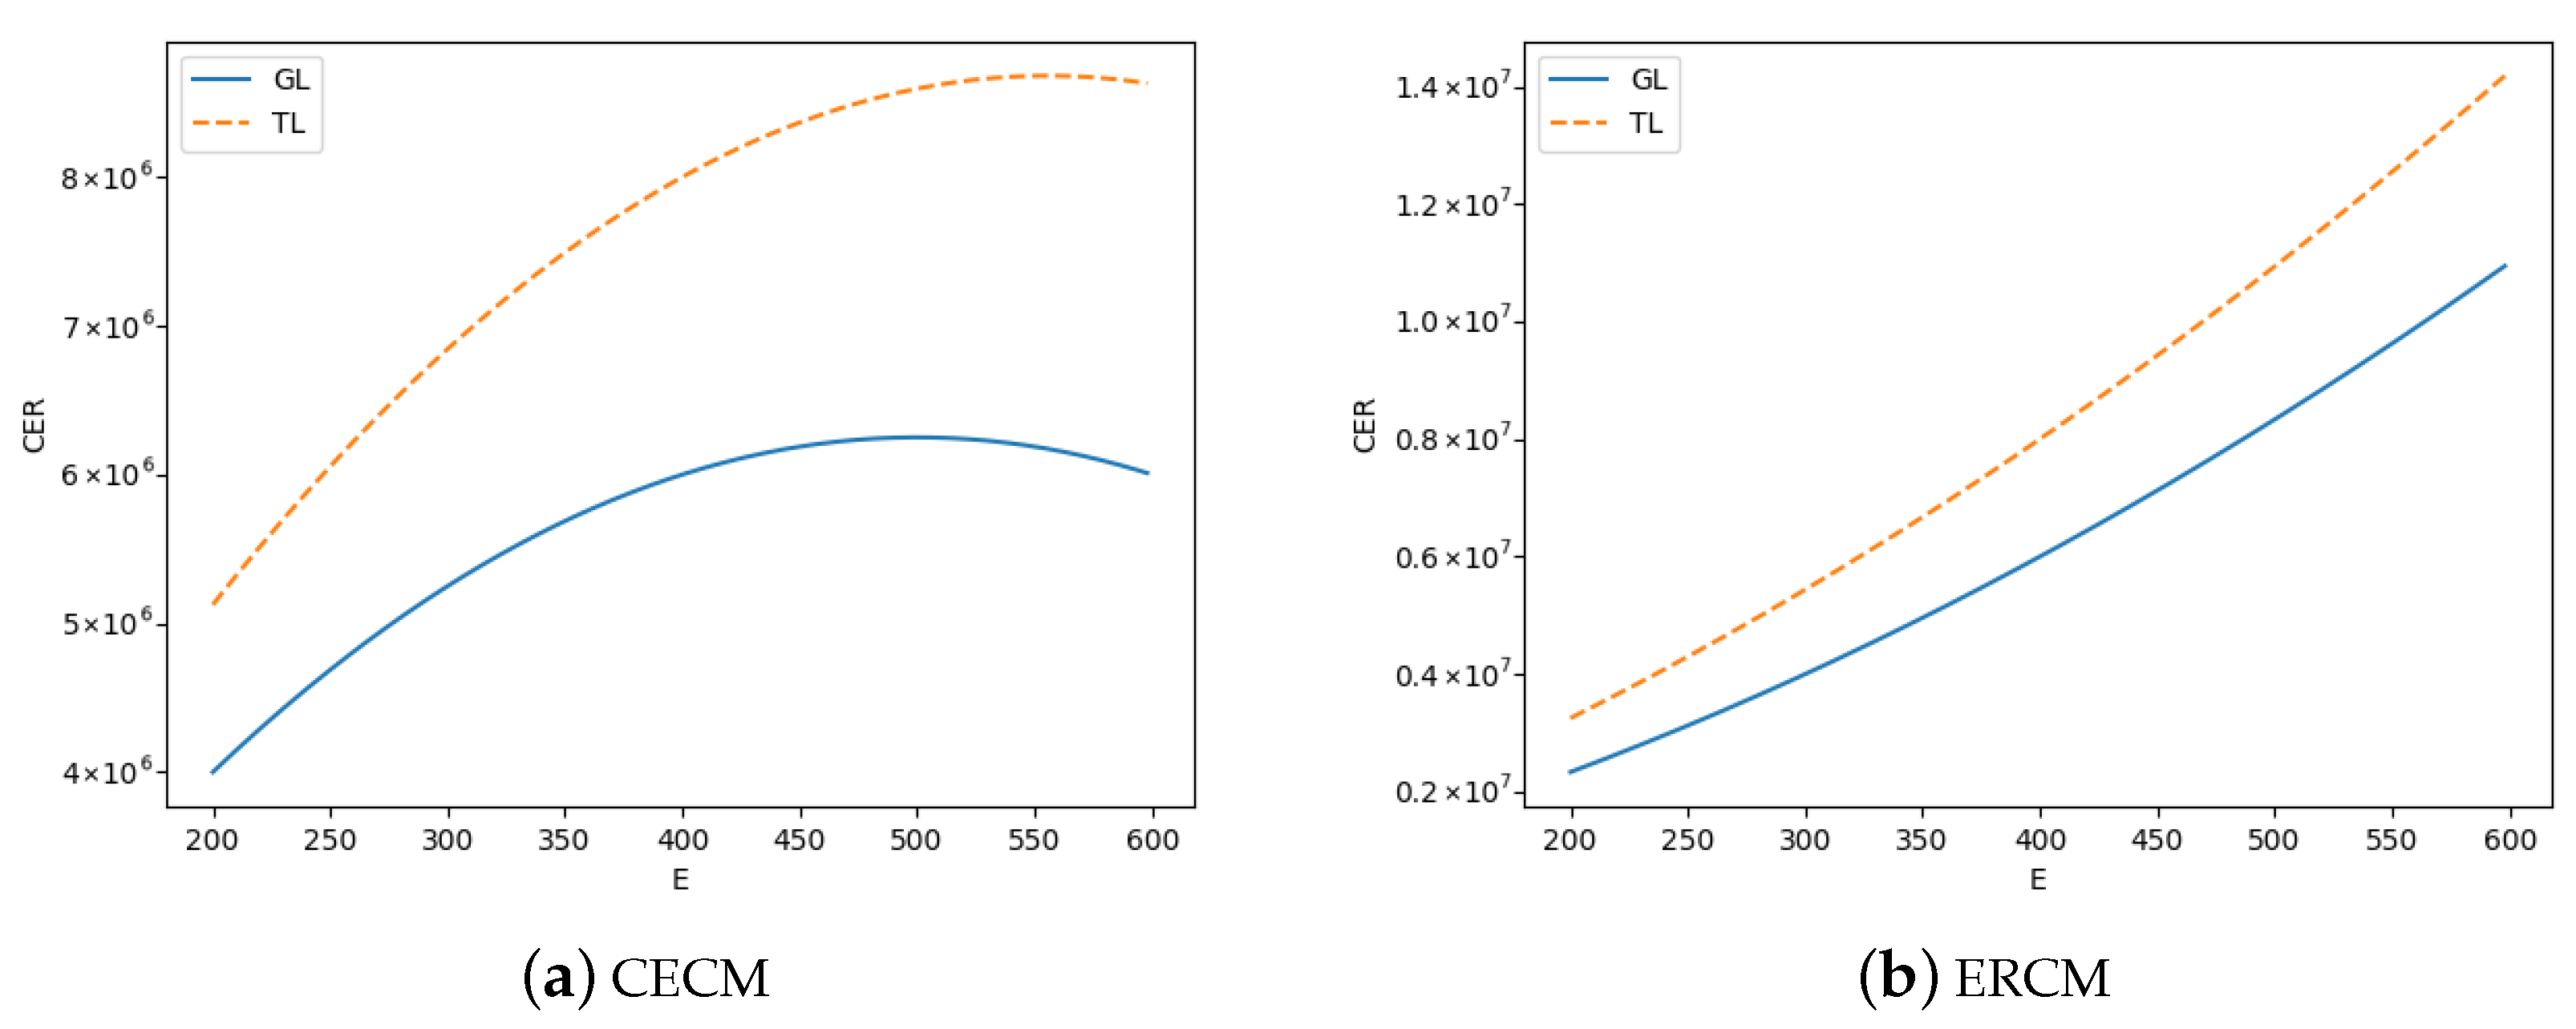
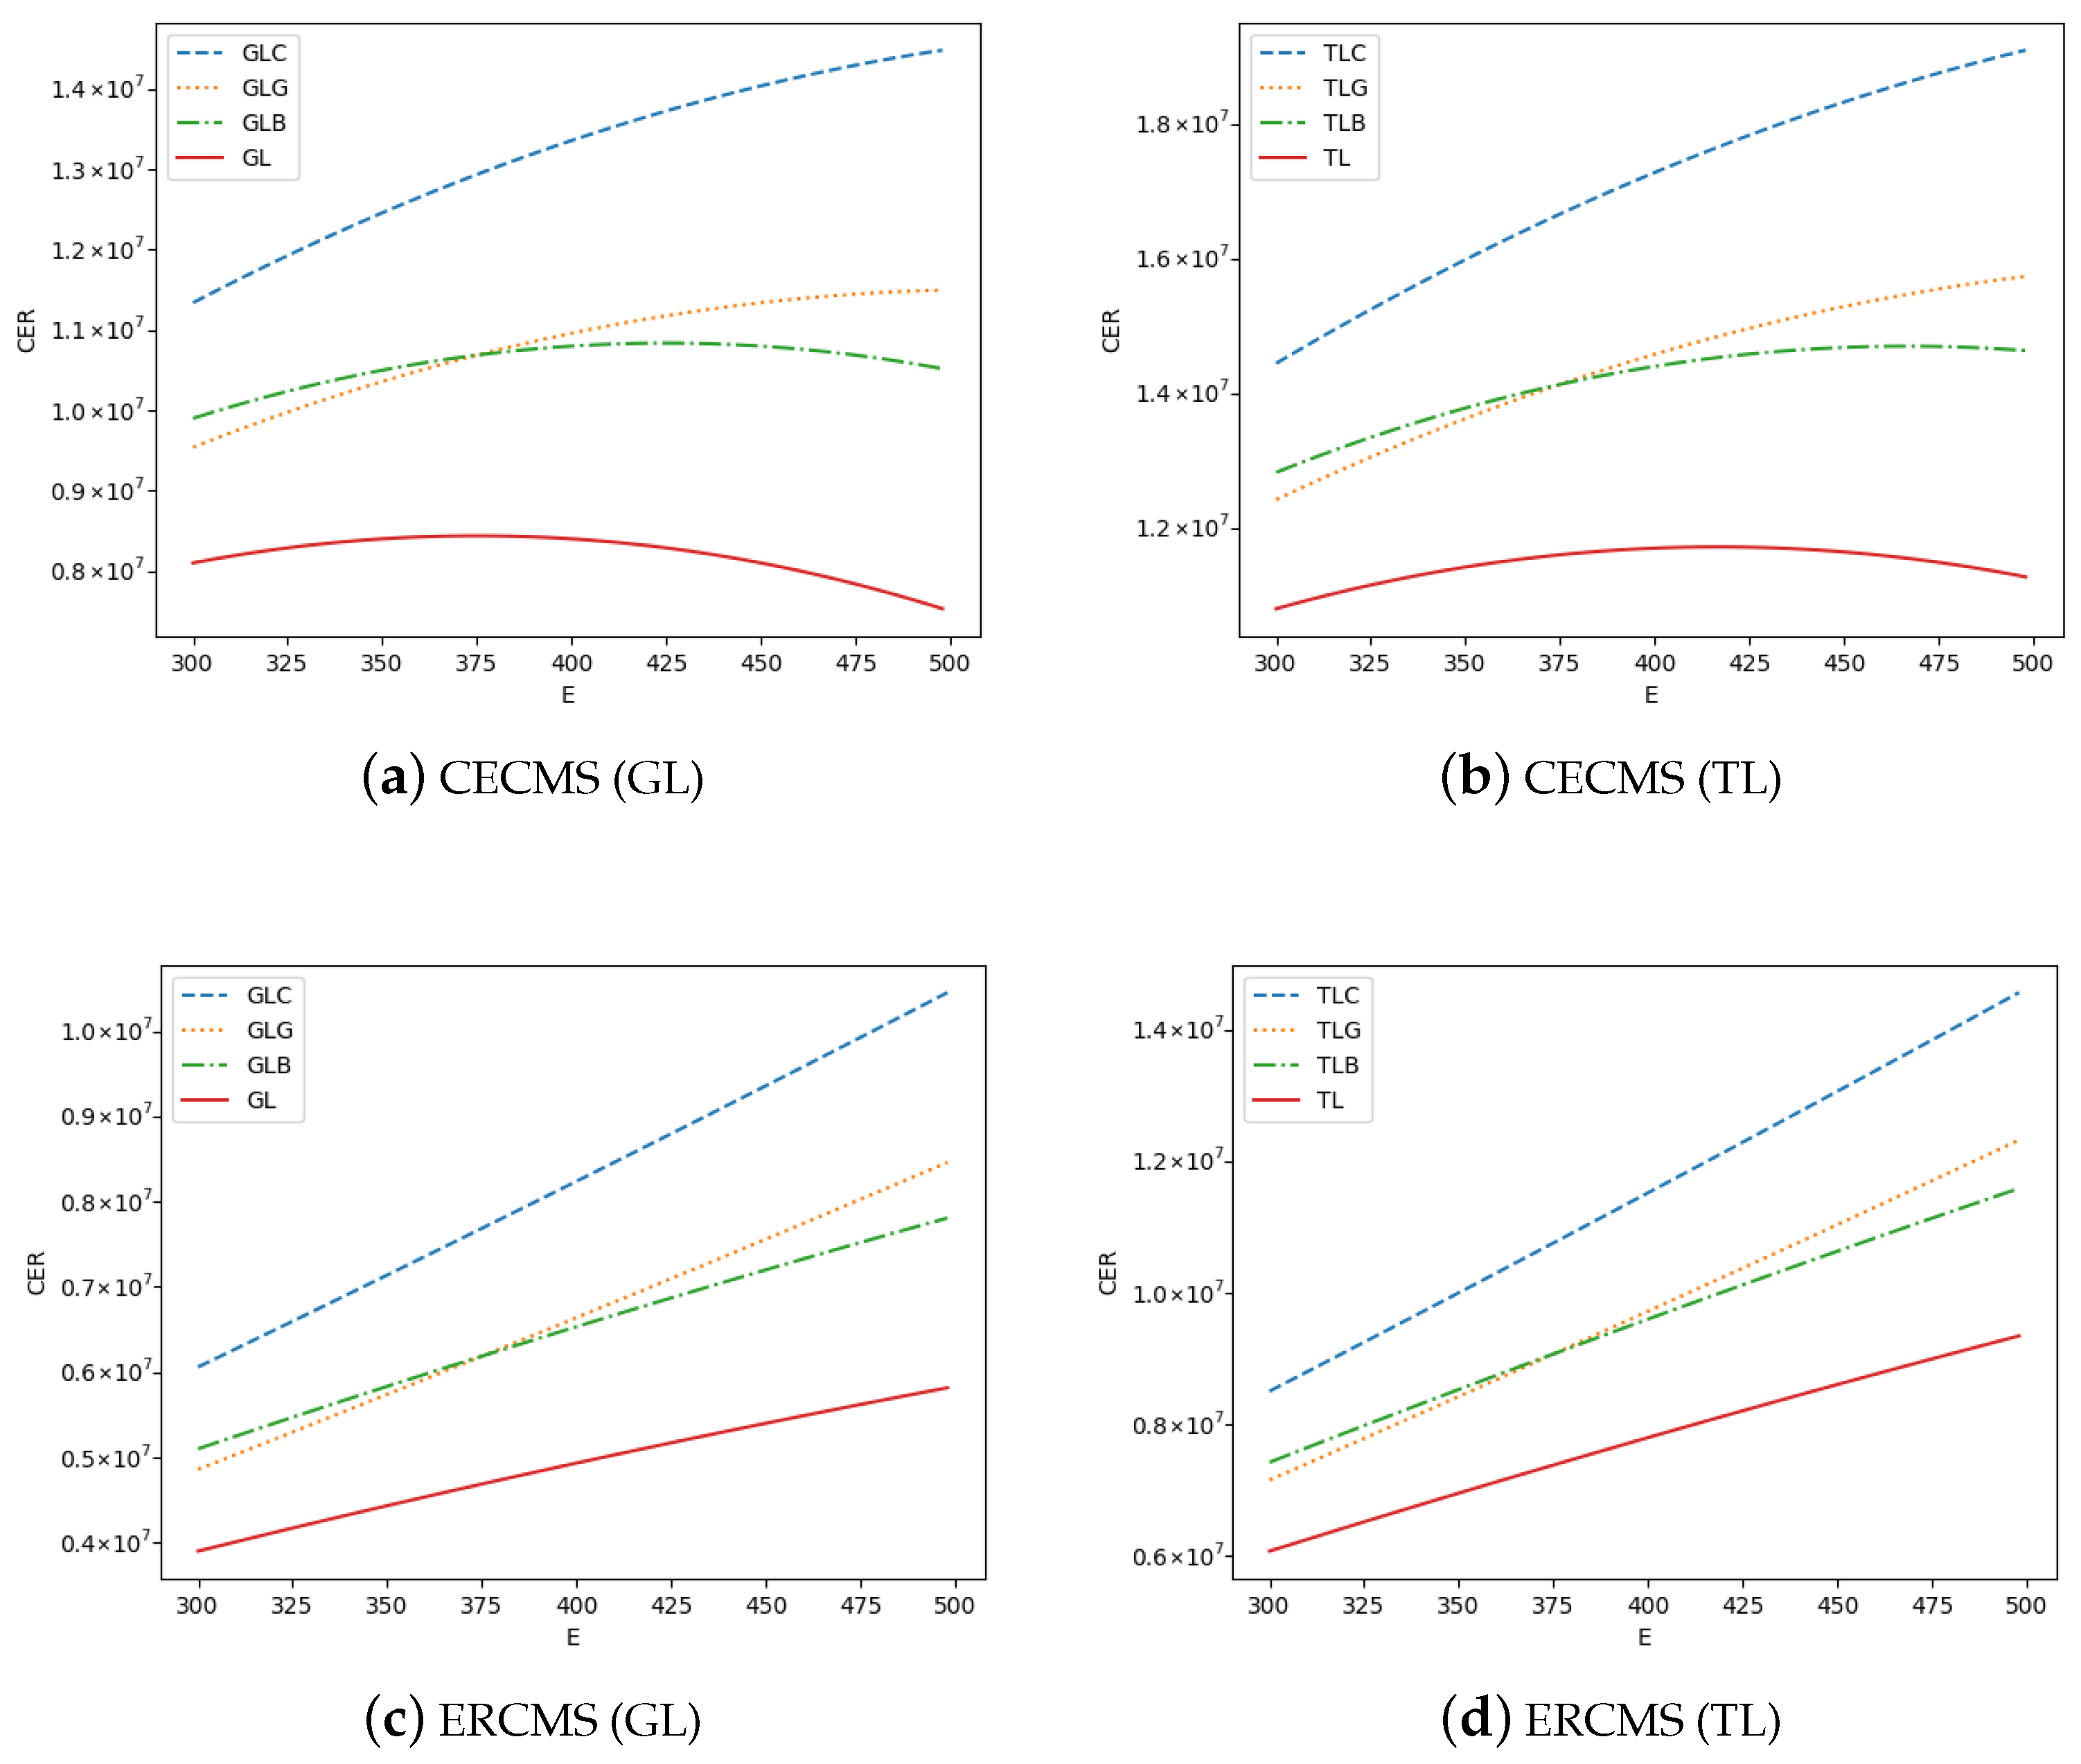
In addition to analyzing the impact of mandatory green standards on market share, we also analyze how mandatory green standards affect carbon emission reduction and GD’s profits in different situations. Due to the complexity of the analytical solutions, we demonstrate results through a series of numerical experiments. Figure 1 provides the carbon emission reduction in four models, where we assume that , in CECM (Figure 1a), , in ERCM (Figure 1b), , , , and E in the range of . Here, we define the carbon emission reduction as product of emission reduction per unit area (E) and market demand (), which is
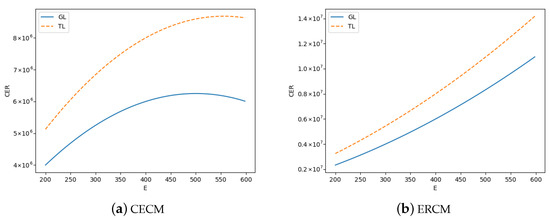
Figure 1.
Carbon emission reduction by green housing.
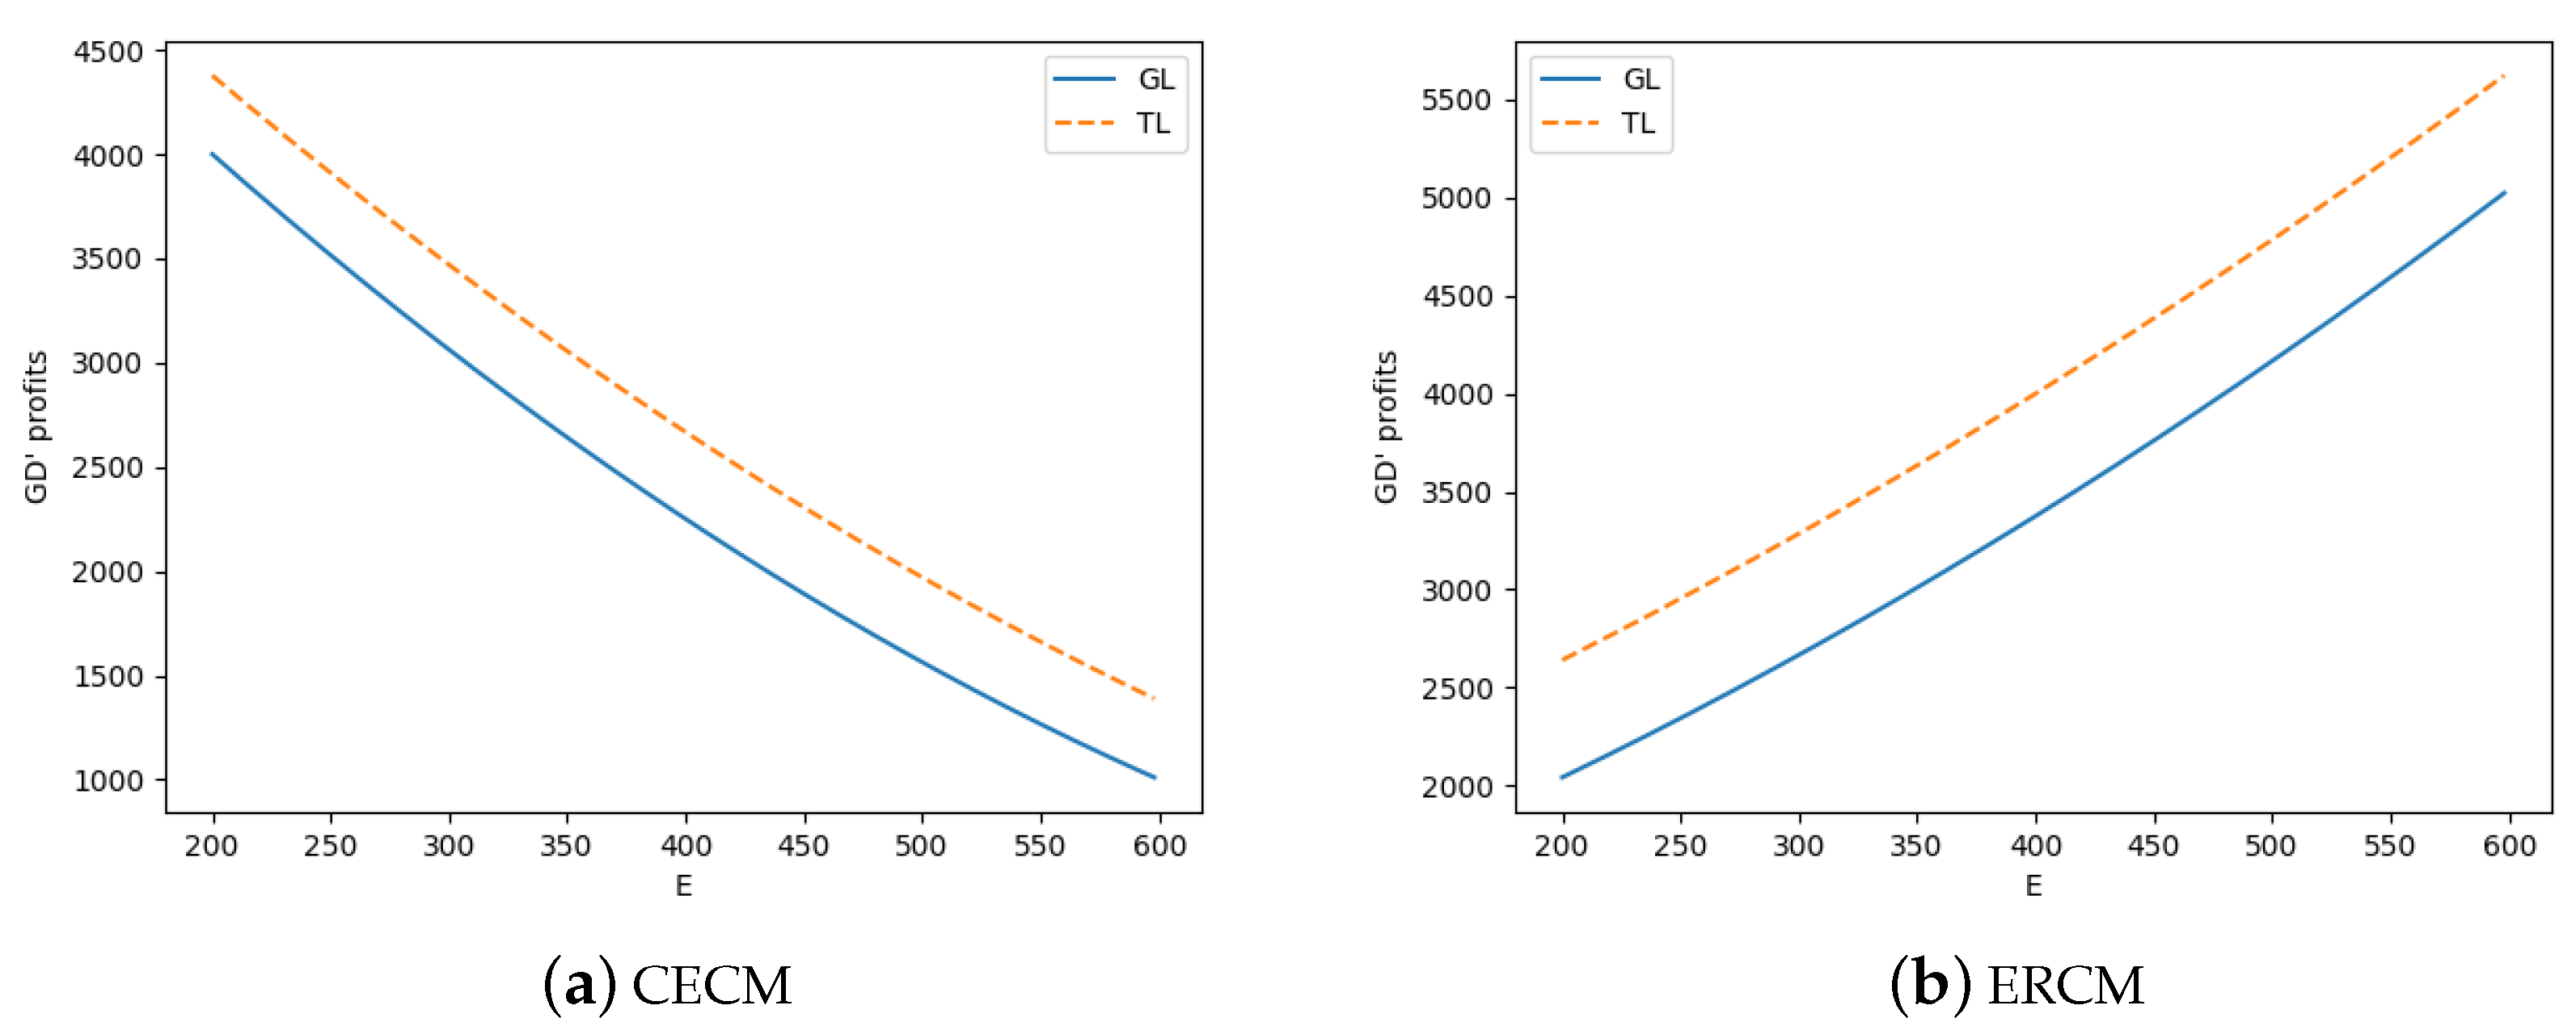
As shown in Figure 1a, when the marginal cost of green technology is high , raising green standards will cause green housing to lose the market. When the greenness of the green housing is at a low level, the market share declines more slowly. At this time, carbon emissions can be reduced by raising the green standards of the green housing. In this case, as shown in Figure 2a, the profits of the green developer decrease as the greenness increases. If carbon emissions are reduced only through non-subsidy green standards, it may harm the profits of the green developer, which may be resisted by GD. Government subsidies should be considered in this case.
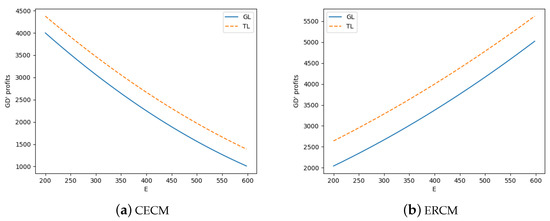
Figure 2.
GD’s profits.
Corollary 1.
When , raising the green standards of the green housing is conducive to reducing carbon emissions.
As shown in Figure 1b, when the green housing is more concerned and the marginal cost of green technology is low, as the government raises green standards, the green housing can provide consumers with more additional utility. Consumers can accept higher premiums. At this time, the market share of the green housing continues to increase. Therefore, with the improvement of green standards, the carbon emission reduction brought by the green housing is increasing.
Corollary 2.
When , GD‘s profit increases as the green standards E increases.
As shown in Figure 2b, when the green housing is more concerned and the marginal cost of green technology is low, as the government raises green standards, the green housing can provide consumers with more additional utility. Consumers can accept a higher price. The market share and price of the green housing are increasing, but the cost burden brought by green technology is low at this time. The green developer’s profit increases with the improvement of green standards. At this time, the government can achieve a win-win situation for promoting the green housing and promoting emission reduction by raising green standards.
5. Analysis in the Presence of the Government Subsidies
It is proved that mandatory green standards alone cannot balance carbon emission reduction with GD’s profits in many cases. In such cases, financial subsidies for the green housing should be considered. Similar to Section 4, we study GL mode and TL mode with three kinds of government subsidies in CECM and ERCM. We study the impact of different policies (including green standards and government subsidies) on carbon emission reduction and GD’s profits.
In this paper, we study the government’s subsidies to GD and consumers of the green housing and temporarily ignore the government’s carbon tax on TD or consumers of the traditional housing. The government can adopt the following subsidy methods:
(i) Subsidies to consumers of the green housing: The government adopts a certain percentage s of subsidies based on the sales price of the green housing. The actual price paid by consumers is . For consumers, each unit area is subsidized by . Thus, compared with the situation without subsidies, green consumers can obtain more utility and accept higher price of the green housing. The green consumer’s utility function is as follows,
(ii) Subsidies for green cost of the green housing: The government provides a certain percentage s of subsidies based on the cost of green technologies of the green housing, in order to reduce the burden of green incremental costs. GD’s marginal profit increases by . GD’s profit function is as follows,
(iii) Subsidies for basic cost of the green housing: The government provides a certain percentage s of subsidies based on the basic cost of the green housing. GD’s marginal profit increases by . GD’s profit function is as follows,
In order to quantitatively study the positive effects of government subsidies on promoting green housing and reducing carbon emissions, the government subsidy effectiveness r is defined as the ratio of the increase in carbon emission reduction to the amount of the subsidy, . We study the impact of subsidies on emissions reduction and the green developer’s profits in the Carbon Emission Concern Model and Emission Reduction Concern Model, respectively. We study the effect of subsidies on carbon emission reduction in the green housing, green housing’s prices and GD’s profits with the same subsidy rate. A series of numerical experiments are carried out and some consistent conclusions are obtained. We further study the mixed policy effects of government subsidies and mandatory green standards.
5.1. Carbon Emission Concern Model with Subsidies
Similar to Section 4.1, Carbon Emission Concern Model with Subsidies (CECMS) includes GD leading mode and TD leading mode. Due to the implementation of three kinds of subsidies, we divide each model into three situations, which are respectively denoted as GD leading mode with subsidies to consumers (GLC), with subsidies for green costs of developer (GLG) and with subsidies for basic costs of developer (GLB). For TD leading mode, there are TLC, TLG and TLB in the same way.
The backward induction is used to solve the optimal pricing decisions and the corresponding market demand and profit of the two developers. In the GLC mode, the reaction function is . GD’s optimal pricing decision is as follows,
Since subsidies are directly given to GD to reduce its costs, they have no direct impact on consumer utility. Therefore, the reaction function of TD to GD is the same when the government subsidizes the basic cost and green incremental cost of GD. The reaction function of GLG mode and GLB mode is , so GD’s optimal pricing decision of two cases , is as follows,
TD’s optimal pricing decision in GLC, GLG and GLB are given in Appendix B.
Similarly, the optimal price decision and subsidy effectiveness in TD leading mode (including TLC, TLG and TLB) are as follows,
Proposition 3.
Government subsidies can increase the carbon emission reduction in green housing in CECMS.
Through the equilibriums above, the derivatives of carbon emission reduction to the subsidy rate are obtained as follows,
Since , in Equation (16), . As the subsidy rate increases, the carbon emission reduction in green housing increases. For any of any subsidy method, . , when , so , when in CECMS. Meanwhile, when , the subsidy amount ≥ 0, so the subsidy effectiveness in CECMS. Regardless of the subsidy used, the carbon emission reductions in green housing will increase. All three types of subsidies can contribute to increasing the carbon emission reduction in green housing. Guo et al. [23] found that government subsidies can increase the consumption rate of green housing and we achieve similar results.
Corollary 3.
When subsidizing GD, the subsidy effectiveness of subsidizing major costs is lower with the same subsidy rate in CECMS.
Through the equilibriums, we compare the subsidy effectiveness of subsidizing the basic cost and the green cost of GL and TL, respectively, as follows,
In Equation (17),
Meanwhile, , , so there are and in Equation (17). When , and . When the subsidy rate is the same, the subsidy amount paid by subsidizing major costs is higher, which has lower subsidy effectiveness. This reflects the law of diminishing marginal returns.
Proposition 4.
Government subsidies can increase GD’s profits in CECMS
When and ,
- (1)
- , ;
- (2)
- , ;
- (3)
- , .
Proposition 3 shows that government subsidies can increase the carbon emission reduction in green housing, where the carbon reduction . Since subsidies have no impact on E, and . Since and , then and . Since consumers are subsidized according to a certain percentage of the price, even if the price is higher than without subsidies, the demand for green housing is higher than without subsidies. Thus, , . Subsidies to consumers can increase GD’s profits. When subsidizing the cost of GD.
When subsidizing GD, price of the green housing is lower, but GD’s marginal profit is higher. In the same way as when subsidizing consumers, when subsidizing GD, the demand of the green housing is larger than when there is no subsidy. Subsidies for the costs of GD can increase its profits.
Guo et al. [23] found that the price of green housing under the subsidy incentive model is lower than that without the subsidy. We obtain some different results. In Guo’s model, under the subsidy incentive model, both consumers and the green developer are subsidized, which makes the effects of subsidizing consumers and subsidizing the green developer mixed together. We study the effects of subsidizing consumers and subsidizing the green developer separately. We find that when subsidizing the green developer, the price of green housing is lower than when there is no subsidy, which is consistent with the results of Guo et al. [23]. Meanwhile, when subsidizing consumers, the price of green housing is higher than when there is no subsidy.
Corollary 4.
When subsidizing GD, subsidizing its major costs is more beneficial to its profits with the same subsidy rate in CECMS.
- (1)
- , when ;
- (2)
- , when ;
When the subsidy rate is the same, subsidizing a higher proportion of the cost needs more subsidy amounts. GD is more profitable at this time.
5.2. Emission Reduction Concern Model with Subsidies
Similar to Section 4.2, Emission Reduction Concern Model with Subsidies (ERCMS) includes GD leading mode and TD leading mode. Unlike in Section 5.1, since the carbon emission reduction in green housing is more concerned at this time, consumers with lower green expectations can gain more additional utility than CECMS. Each mode is divided into three cases, which represent one of the three kinds of subsidies. In each case, we study the impact of subsidies on the carbon emission reduction in the green housing on the basis of equilibrium.
The backward induction is used to solve the optimal pricing decisions and the corresponding market demand and profit of the two developers. The reaction function is in GLC mode, so GD’s optimal pricing decision is as follows,
Similar to Section 5.1, the policy of subsidizing GD’s costs does not directly affect consumers’ utility and market demand. Therefore, the response function in GLG mode and GLB mode is the same, namely , so GD’s optimal pricing decision of two cases , is as follows,
Using the same method to analyze the three cases of TD leading mode, the optimal price decision is as follows,
Proposition 5.
Government subsidies can increase the carbon emission reduction in green housing in ERCMS.
Through the equilibriums above, the derivatives of carbon emission reduction to the subsidy rate are obtained as follows,
Since , in Equation (18). Similar to Proposition 3, it can be proved that , when in ERCMS. The subsidy effectiveness . All the three subsidies can increase the carbon emissions reduction in green housing.
Corollary 5.
When subsidizing GD, the subsidy effectiveness of subsidizing major costs is lower with the same subsidy rate in ERCMS.
Through the equilibriums, we compare the subsidy effectiveness of subsidizing the basic cost and the green cost of GL and TL, respectively, as follows,
In Equation (19),
and , so there are and in Equation (19). and when . Similar to Corollary 3, subsidizing a higher proportion of costs has lower subsidy effectiveness.
Proposition 6.
Government subsidies can increase GD’s profits in ERCMS.
When and ,
- (1)
- , ;
- (2)
- , ;
- (3)
- , .
Similar to Proposition 4, it can be proved that subsidizing green consumers can increase the price and market demand of the green housing, so and in ERCMS. When subsidizing GD,
Similar to Proposition 4, when subsidizing GD, the price is lower, but both marginal profit and market demand increase. Therefore, subsidizing GD can increase its profits.
Corollary 6.
When subsidizing GD, subsidizing its major costs is more beneficial to its profits with the same subsidy rate in ERCMS.
- (1)
- , when ;
- (2)
- , when ;
When the subsidy rate is the same, subsidizing higher costs requires more subsidy amounts. Although subsidies have lower effectiveness at this time, subsidies are more beneficial to GD’s profits.
The effect of the mixed policy of government subsidies and mandatory green standards is given in Section 5.3.
5.3. Numerical Experiments
Due to the complexity of the analytical solution, a series of numerical experiments are carried out in this subsection to address some of the issues not covered above. We compare subsidized green consumers and subsidized green developers through numerical experiments. In addition, we study the policy impact of government subsidies on mandatory green standards. Part of the result verifies the above conclusions, and some new findings are obtained in Propositions 7 and 8.
Proposition 7.
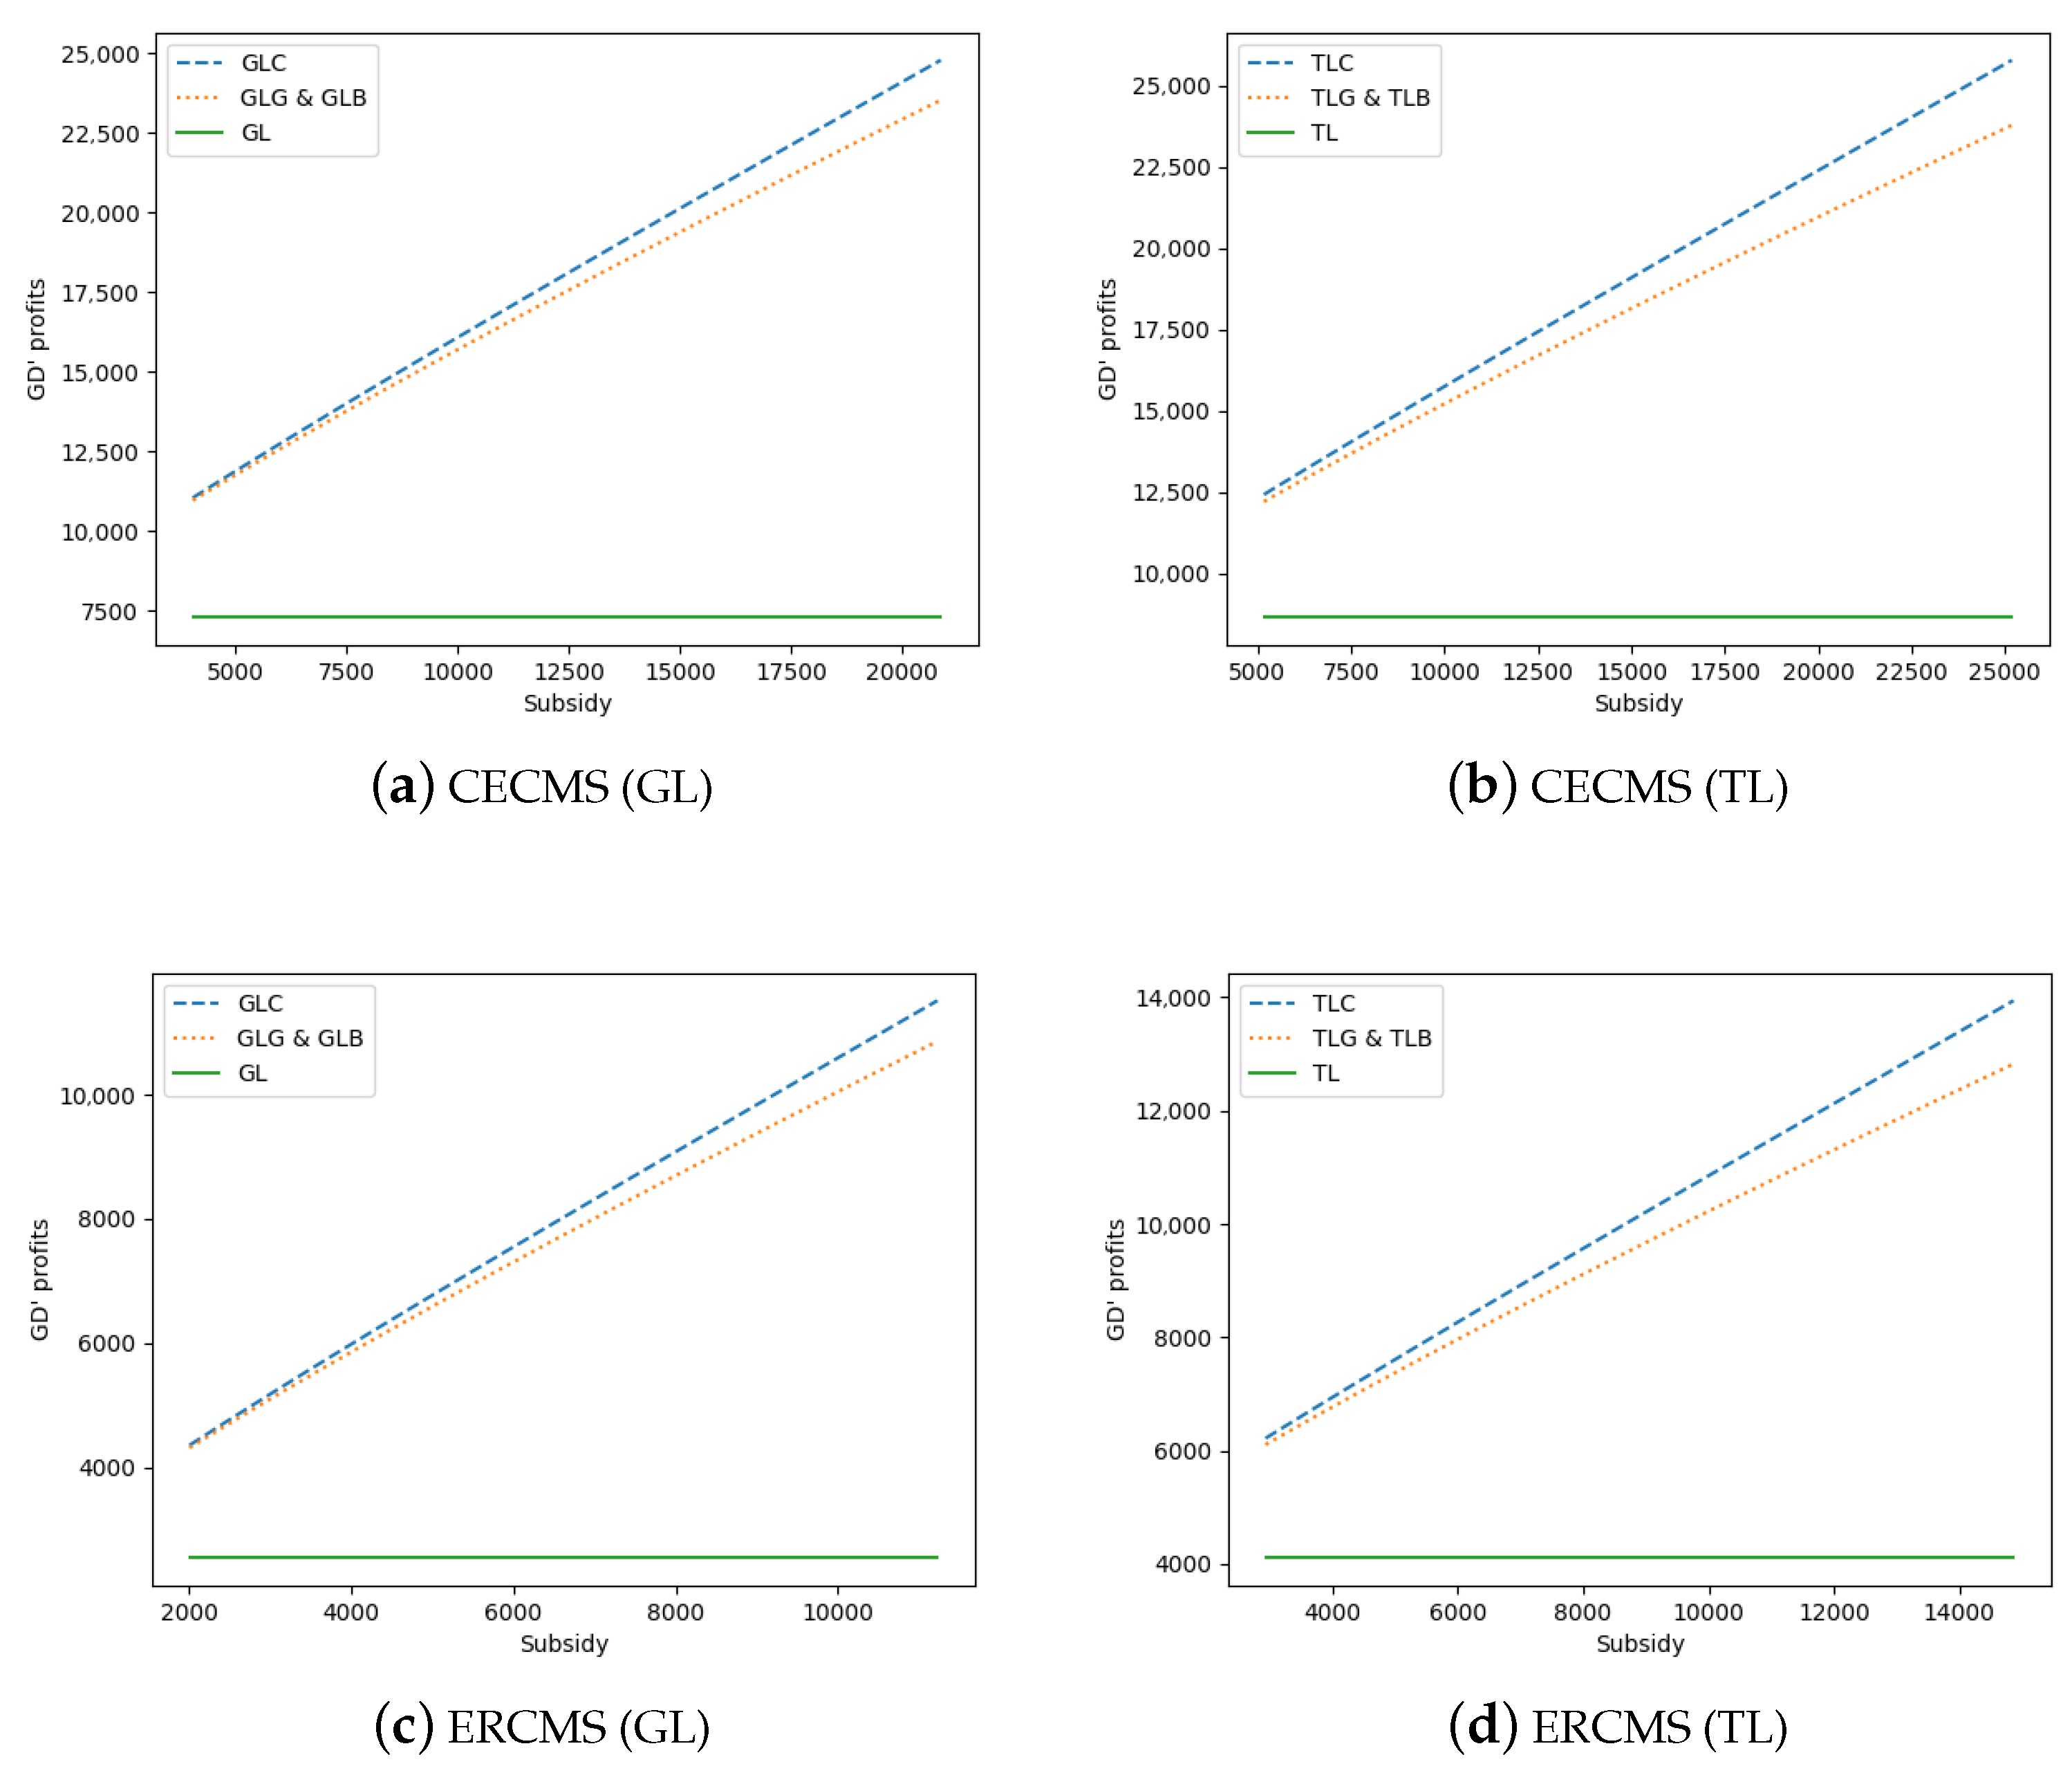
Subsidizing green consumers is more conducive to increasing GD’s profits with the same subsidy amount.
Due to the complexity of the analytical solution, it is difficult to compare directly. We study the effect of subsidizing green consumers and subsidizing GD on GD’s profits with the same subsidy rate through a series of numerical experiments. One of the results is shown in Figure 3, where the parameters are set as , , , , , , in CECMS and , in ERCMS. The subsidy rate range is 10 to , and the result shows that when subsidizing green consumers, GD’s profits are much higher than that when subsidizing its costs with the same subsidy amount. Since the curves of subsidizing GD for the green cost and the basic cost completely overlap, when the subsidy amount is the same, the two subsidy methods of subsidizing GD have exactly the same impact on profits.
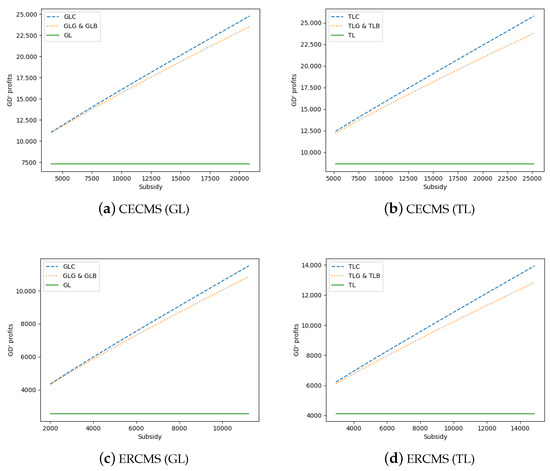
Figure 3.
GD’s profits.
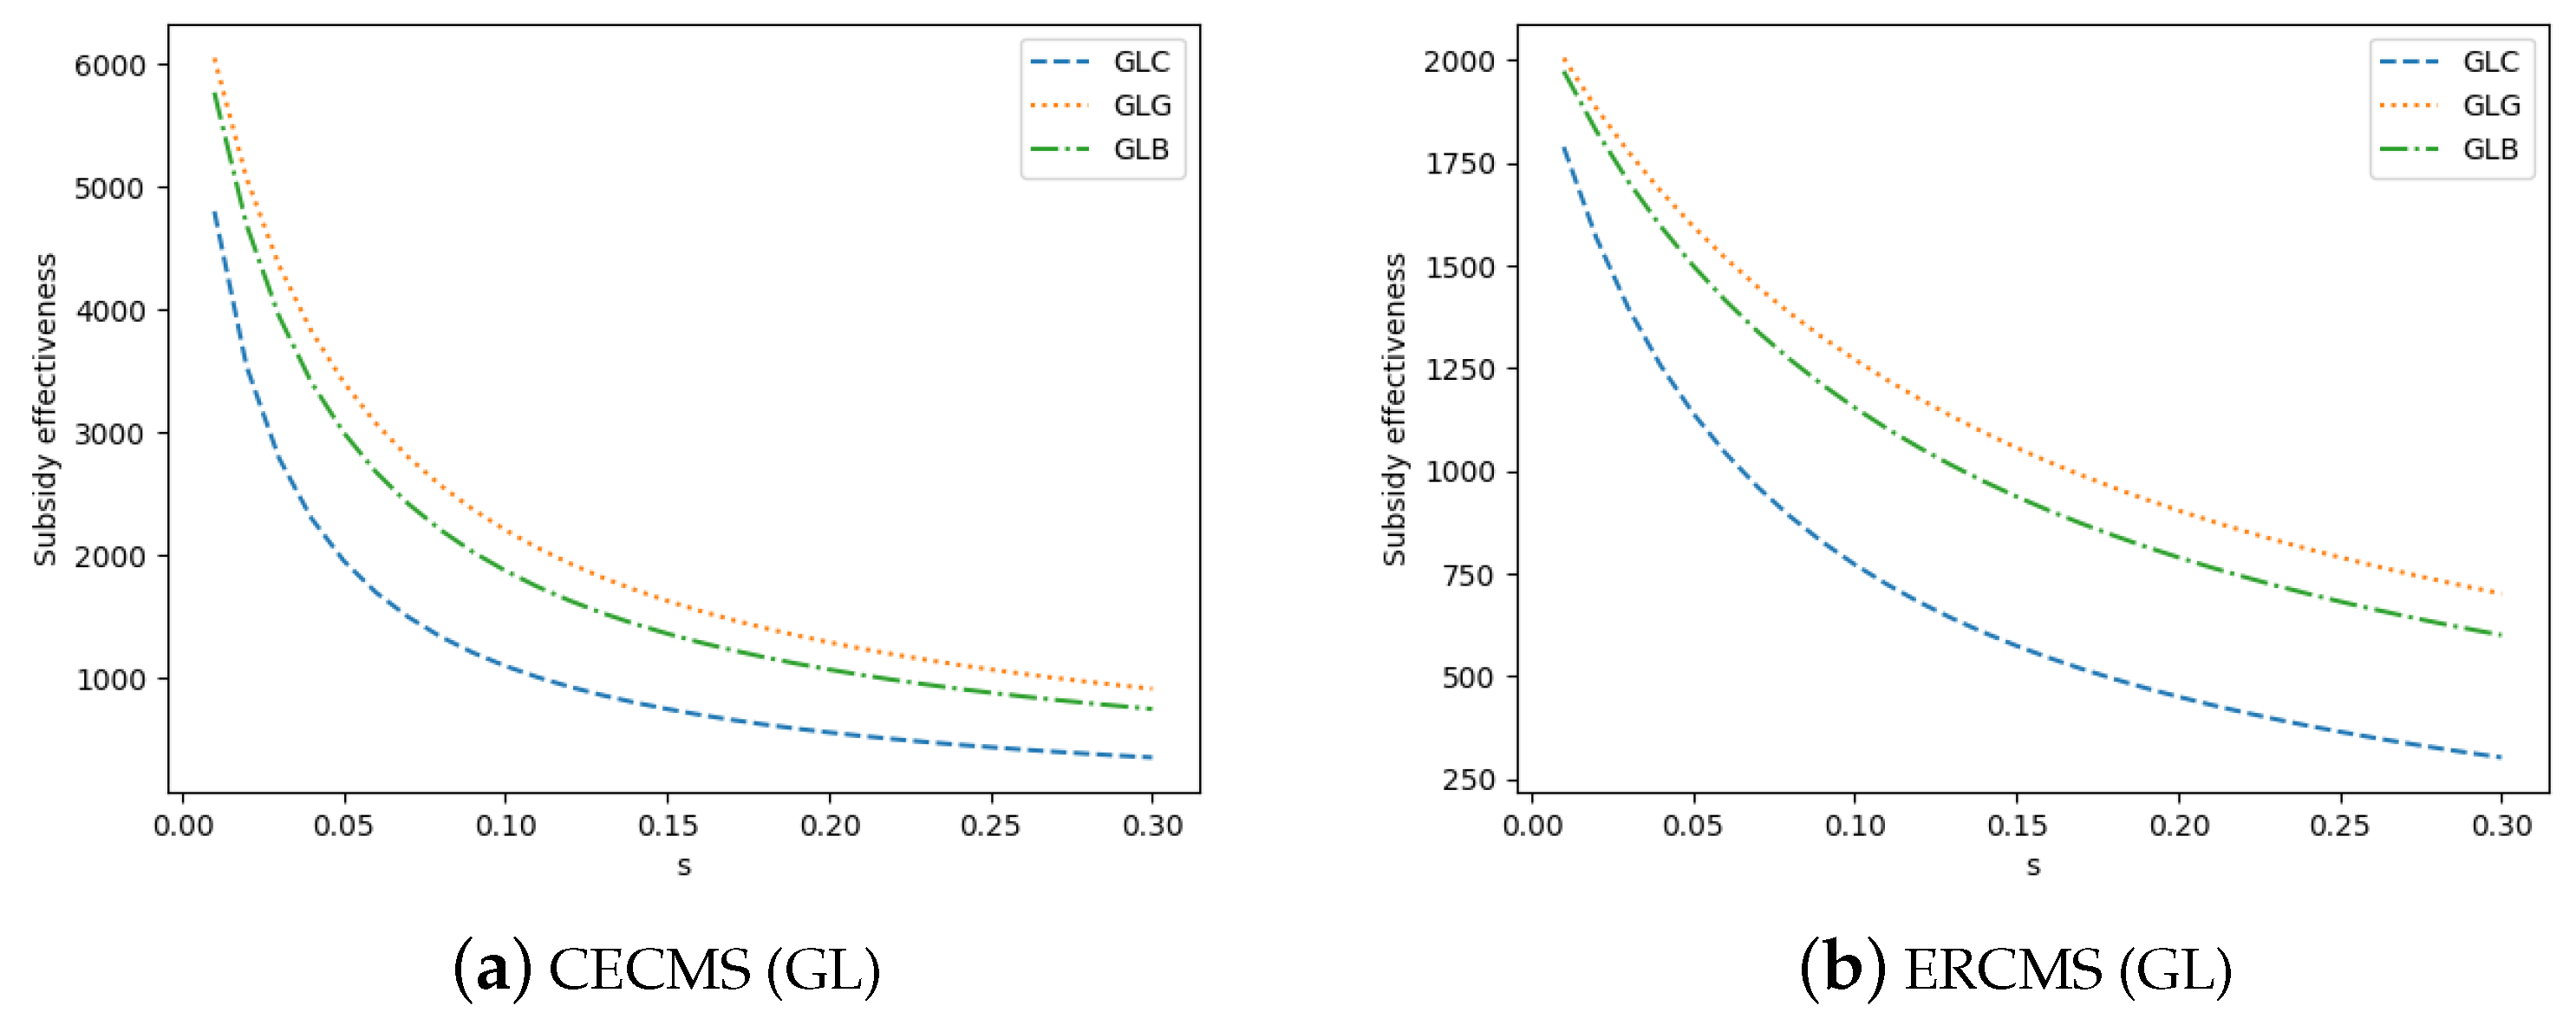
Proposition 8.
Subsidizing GD is more conducive to improving the carbon emission reductions in green housing.
We compare the subsidy effectiveness of subsidizing green consumers and subsidizing GD through numerical experiments. We provide two perspectives: the same subsidy rate and the same subsidy amount. From the perspective of the same subsidy rate, results with the same parameters in Proposition 7 are shown in Figure 4 (taking GL as examples). The results show that the subsidy effectiveness of subsidizing GD is better than that when subsidizing green consumers. At the same time, comparing the two subsidies for GD’s cost provides evidence for Corollaries 3 and 5.
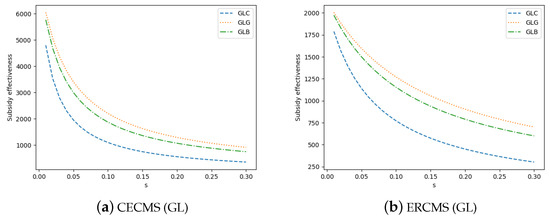
Figure 4.
Carbon emission reduction (same subsidy rate).
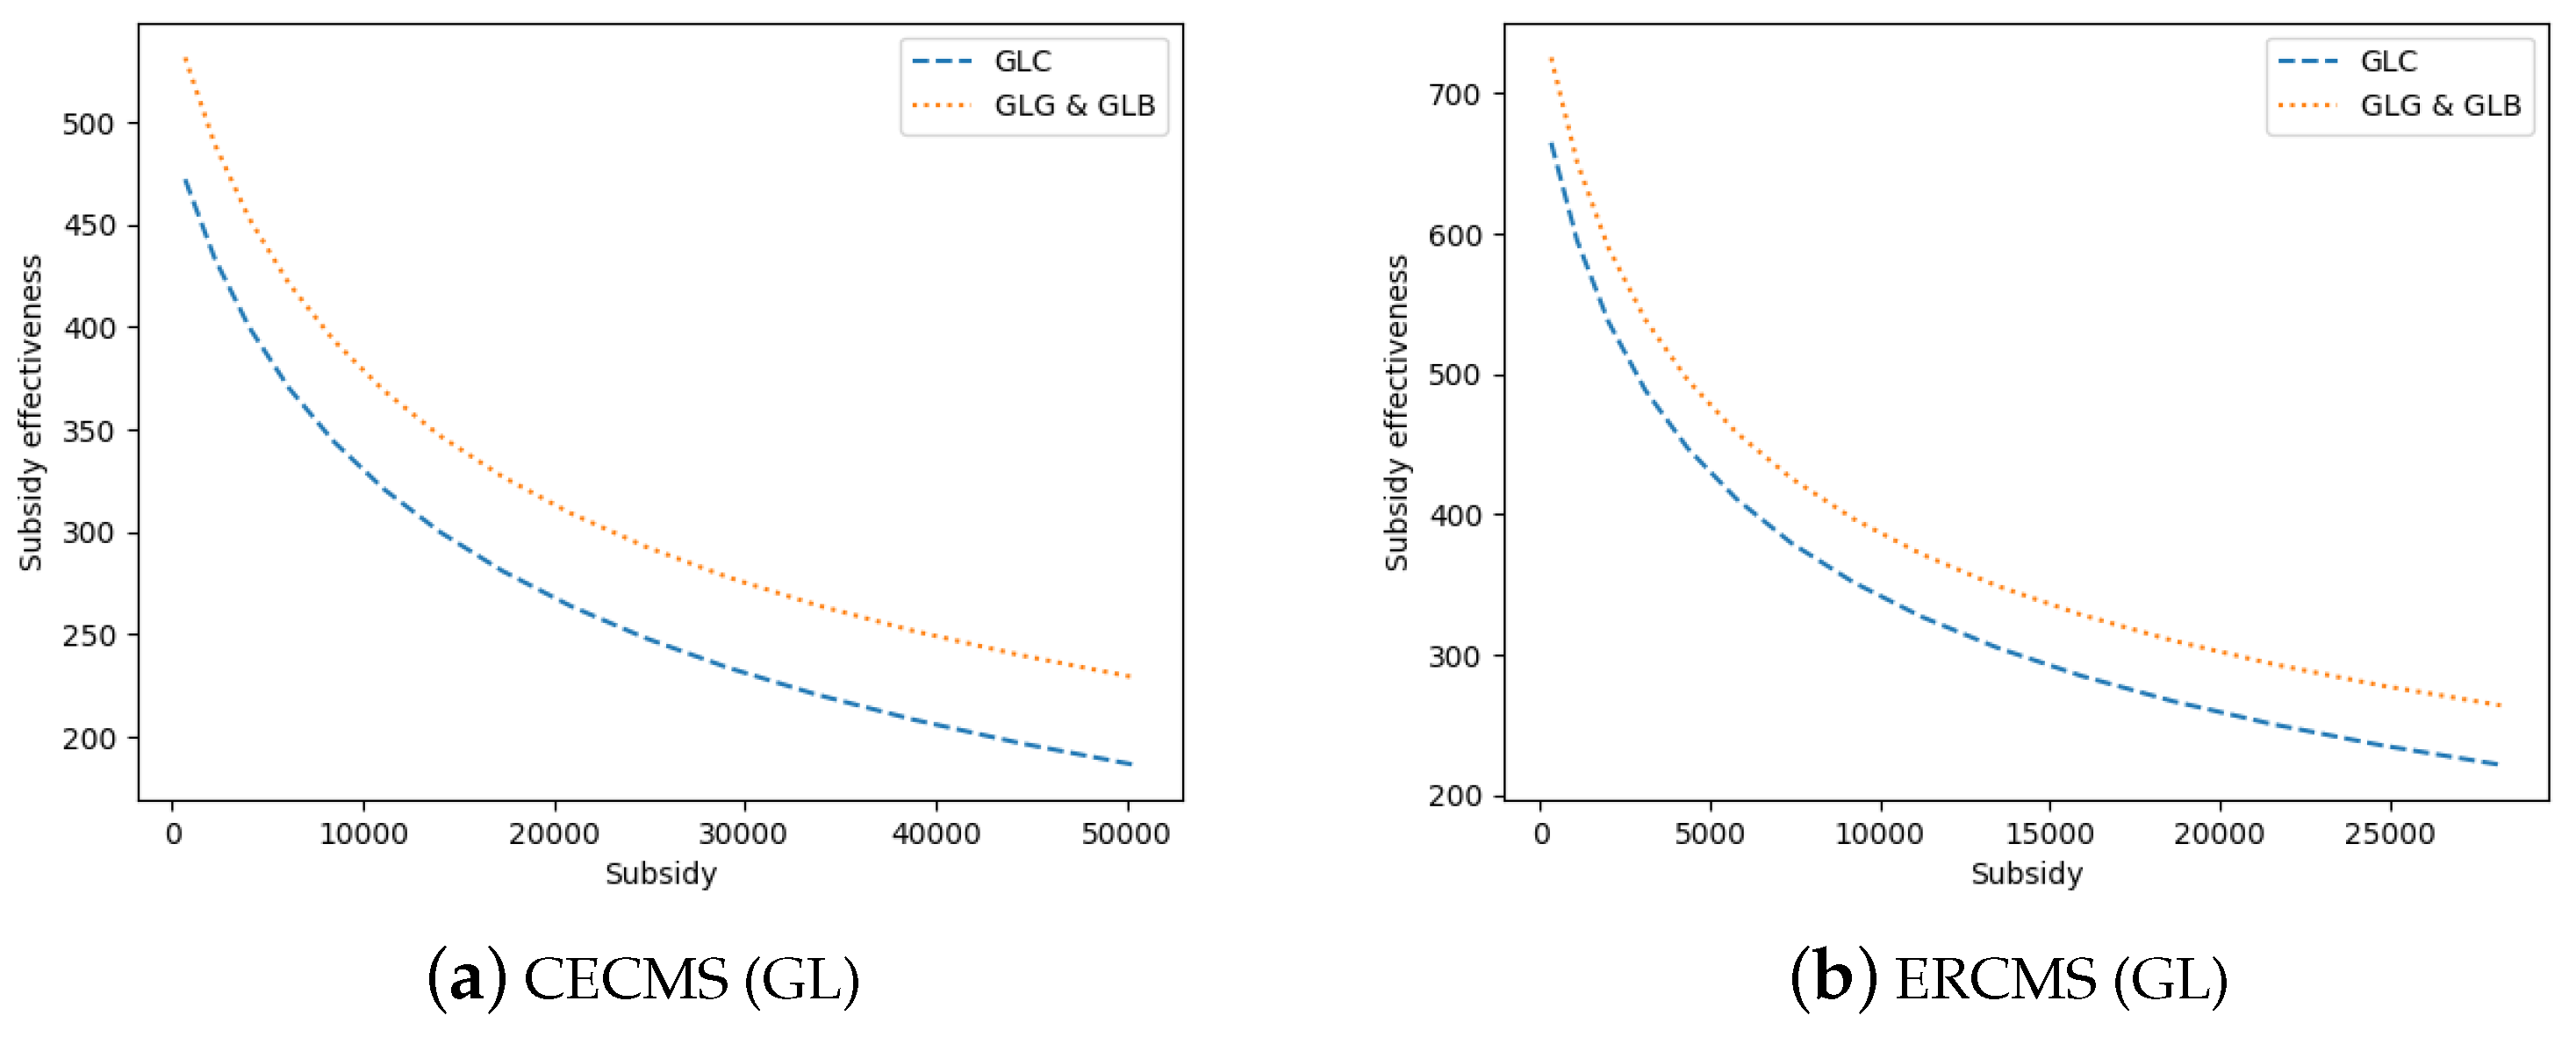
From the perspective of the same subsidy amount, similarly, Figure 5 gives the result of GL mode with the same parameters in Proposition 7. The two curves of subsidies to GD (GLG and GLB) completely overlap, indicating that these two types of subsidies have exactly the same effect on increasing the carbon emission reductions in green housing when the subsidy amounts are the same. Furthermore, the result shows that subsidizing GD has better subsidy effectiveness than subsidizing green consumers. The above conclusions are also valid in TL mode.
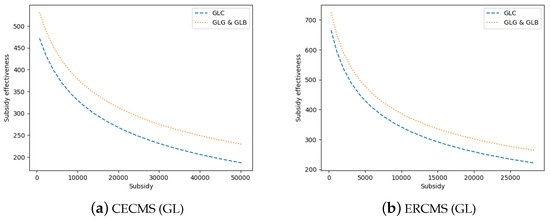
Figure 5.
Carbon emission reduction (same subsidy amount).
Proposition 9.
Subsidizing green consumers and subsidizing green costs can improve the carbon emission reduction in green standards.
From the equilibriums of Section 5.1 and Section 5.2,
- (1)
- ;
- (2)
- ;
, and refer to carbon emission reduction when subsidizing green consumers, subsidizing the green incremental cost of GD and no subsidies, respectively. It is proved in the conclusion of Section 4 that when , government subsidies are required. Therefore, the numerical experiments for CECMS and ERCMS are implemented based on .
We assume that , , and , , in CECMS and , in ERCMS (in order to make sure that ). The result in Figure 6 shows that with the same subsidy rate, when subsidizing green consumers and subsidizing GD’s green incremental cost, the slope of the curve is higher than when there is no subsidy. When the green standard E is raised, the amount of subsidies for green costs is increasing. Meanwhile, subsidizing consumers has an overall impact, and the amount of subsidies will also increase as the green standard increases. These two subsidies can improve the problem mentioned in Section 4 of falling emissions reductions with increasing green standards when the greenness E is high.
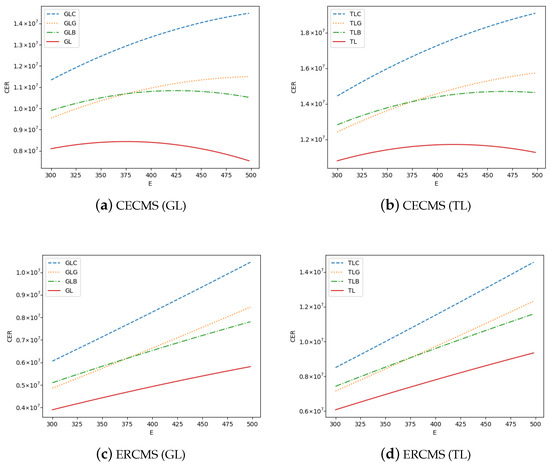
Figure 6.
Carbon emission reduction in mixed policy.
However, subsidizing GD’s basic cost cannot improve this problem. Subsidies for the basic cost can reduce the cost and selling price of the green housing, which will bring more utility to consumers. However, when the greenness E increases, the subsidy for the basic cost will not increase with the increase in greenness. There is no additional increase in the utility to consumers.
6. Conclusions
The green housing is receiving more and more attention as a kind of building that can cope with global warming by reducing energy consumption and carbon emissions. This paper fills the research gap of government subsidies in a duopoly residential housing market considering consumers’ green preferences. We construct an oligopoly market that includes a green developer and a traditional developer. A utility function including internal expectations and external atmosphere (consumers’ concern) is constructed to describe the complex consumers’ buying behavior. By analyzing the results of different market environments and competition structures, suggestions for subsidies are drawn.
First, when the carbon emissions of the green housing are less concerned, but the marginal cost of green technologies is high, with the improvement of green standards, the market share of the green housing declines. Although raising green standards can increase carbon emission reductions in the green housing when the green level is low, the profits of the green developer decline. Policies that only adopt green standards may be resisted.
Second, government financial subsidies can effectively increase carbon emission reduction in the green housing and the green developer’s profit, among which, subsidizing green consumers is more beneficial to the green developer’s profits and subsidizing the green developer is more conducive to improving the carbon emission reduction in green housing. When subsidizing the developer of green housing, the effect of different subsidies depends on the cost structure. Subsidizing the main costs of a green developer has lower subsidy effectiveness.
Third, government subsidies can increase the market share of green housing. When consumers are subsidized, the price of green housing is higher than that without subsidies. When the green developer is subsidized for its costs, the price of green homes is lower than that without subsidies.
Finally, when a mixed policy of mandatory green standards and government subsidies is implemented, both subsidizing green consumers and subsidizing developer’s green incremental cost can improve carbon emission reduction feedback to mandatory green standards. However, subsidizing the base cost of the green developer has no such effect.
Based on the above conclusions, we summarize some managerial insights as follows: (1) When the government subsidizes green consumers, the green developer should increase the selling price to obtain higher profits. (2) When the government subsidizes the green developer for its costs, it should lower the selling price to gain a larger market share and obtain higher profits. (3) Even if the subsidy amount is the same, subsidizing consumers is more beneficial to the green developer’s profits, so the green developer should strive for policies that subsidize consumers.
We make some recommendations for policymakers as follows: (1) When financial subsidies are not available, raise the green standard only when the green housing is highly concerned. (2) If the main goal of the policy is to increase the green developer’s profits, green consumers should be subsidized, and a mix policy of subsidies and green standards can be implemented, which can have a better effect of carbon emission reduction than that without subsidies. (3) If the main goal of the policy is to increase carbon emission reductions, the green developer should be subsidized. When subsidizing minor costs, the subsidy efficiency is higher. (4) A mixed policy of subsidized green incremental cost and green standards should be implemented when the green incremental cost is low and a single policy of subsidizing the basic cost should be implemented when the green incremental cost is high.
In spite of some suggestions about subsidizing the green housing market obtained in this paper, there are still some limitations, which indicate some future research directions for us. Our research only involves an oligopoly market with a green housing developer and a traditional housing developer, but in reality, there may be multiple developers competing. Therefore, we will study the issue of subsidies for the green housing in a more complex and realistic market. When modeling, we assume that consumers’ green preferences obey uniform distribution, which may be too idealistic and inconsistent with reality. We construct a Stackelberg game model, which is a dynamic game of complete information whose conditions may be difficult to satisfy in real business activities. We ignore the R&D cost of the green developer, which in reality may greatly influence the green developer’s decision making. Many conclusions are based on the assumption that the green housing and the traditional housing have the same basic cost and basic performance, which makes these two kinds of housing completely homogeneous except for greenness. In fact, many green residential buildings are also high-end buildings except for the greenness, so there may be more differences between the two kinds of housing.
Author Contributions
Conceptualization, W.M., Z.R. and H.K.; methodology, Z.R. and H.K.; software, Z.R.; validation, W.M., Z.R. and H.K.; writing—original draft preparation, Z.R.; writing—review and editing, W.M., Z.R. and H.K.; visualization, Z.R.; supervision, W.M. and H.K.; project administration, W.M.; funding acquisition, W.M. All authors have read and agreed to the published version of the manuscript.
Funding
This research was funded by the National Social Science Foundation of China (Grant NO. 20BGL115).
Institutional Review Board Statement
Not applicable.
Informed Consent Statement
Not applicable.
Data Availability Statement
Not applicable.
Conflicts of Interest
The authors declare no conflict of interest.
Appendix A. Equilibriums of TD in CECM and ERCM
Appendix A.1. Equilibriums in CECM
Appendix A.2. Equilibriums in ERCM
Appendix B. Equilibriums of TD in CECMS and ERCMS
Appendix B.1. Equilibriums in CECMS
Appendix B.2. Equilibriums in ERCMS
References
- Ma, M.; Yan, R.; Cai, W. A STIRPAT model-based methodology for calculating energy savings in China’s existing civil buildings from 2001 to 2015. Nat. Hazards 2017, 87, 1765–1781. [Google Scholar] [CrossRef]
- Yide, B. Technical Guidelines for Green Buildings; China Architecture & Building Press: Beijing, China, 2008. [Google Scholar]
- Zhang, L.; Liu, H.; Wu, J. The price premium for green-labelled housing: Evidence from China. Urban Stud. 2017, 54, 3524–3541. [Google Scholar] [CrossRef]
- Aroul, R.; Hansz, J.A. The value of Green: Evidence from the first mandatory residential green building program. J. Real Estate Res. 2012, 34, 27–50. [Google Scholar] [CrossRef]
- Eichholtz, P.; Kok, N.; Quigley, J. The economics of green building. Rev. Econ. Stat. 2013, 95, 50–63. [Google Scholar] [CrossRef]
- Hu, H.; Geertman, S.; Hooimeijer, P. The willingness to pay for green apartments: The case of Nanjing, China. Urban Stud. 2014, 51, 3459–3478. [Google Scholar] [CrossRef]
- Zhang, L.; Sun, C.; Liu, H.; Zheng, S. The role of public information in increasing homebuyers’ willingness-to-pay for green housing: Evidence from Beijing. Ecol. Econ. 2016, 129, 40–49. [Google Scholar] [CrossRef]
- Feng, Z.; Wu, Z. ESG Disclosure, REIT Debt Financing and Firm Value. J. Real Estate Financ. Econ. 2021, 1–35. [Google Scholar] [CrossRef]
- Silva, D.G.D.; Pownall, R.A.J. Going green: Does it depend on education, gender or income? Appl. Econ. 2014, 46, 573–586. [Google Scholar] [CrossRef] [Green Version]
- Dippold, T.; Mutl, J.; Zietz, J. Opting for a Green Certificate: The Impact of Local Attitudes and Economic Conditions. J. Real Estate Res. 2014, 36, 435–474. [Google Scholar] [CrossRef]
- Chan, E.H.; Qian, Q.K.; Lam, P.T. The market for green building in developed Asian cities—The perspectives of building designers. Energy Policy 2009, 37, 3061–3070. [Google Scholar] [CrossRef]
- Qi, G.; Shen, L.; Zeng, S.; Jorge, O.J. The drivers for contractors’ green innovation: An industry perspective. J. Clean. Prod. 2010, 18, 1358–1365. [Google Scholar] [CrossRef]
- Cidell, J.; Cope, M.A. Factors explaining the adoption and impact of LEED-based green building policies at the municipal level. J. Environ. Plan. Manag. 2014, 57, 1763–1781. [Google Scholar] [CrossRef]
- Fuerst, F.; Kontokosta, C.; McAllister, P. Determinants of Green Building Adoption. Environ. Plan. B Plan. Des. 2014, 41, 551–570. [Google Scholar] [CrossRef]
- Wiley, J.A.; Benefield, J.D.; Johnson, K.H. Green design and the market for commercial office space. J. Real Estate Financ. Econ. 2010, 41, 228–243. [Google Scholar] [CrossRef]
- Reichardt, A.; Fuerst, F.; Rottke, N.; Zietz, J. Sustainable building certification and the rent premium: A panel data approach. J. Real Estate Res. 2012, 34, 99–126. [Google Scholar] [CrossRef]
- Kim, K.H.; Jeon, S.S.; Irakoze, A.; Son, K.Y. A study of the green building benefits in apartment buildings according to real estate prices: Case of non-capital areas in South Korea. Sustainability 2020, 12, 2206. [Google Scholar] [CrossRef] [Green Version]
- Plebankiewicz, E.; Juszczyk, M.; Kozik, R. Trends, costs, and benefits of green certification of office buildings: A Polish perspective. Sustainability 2019, 11, 2359. [Google Scholar] [CrossRef] [Green Version]
- Takada, H.; Yoshida, Y.; Kawakubo, S.; Yamaguchi, A. Economic impact of environmental efficiency on sales price and used transaction price of apartment buildings empirical analysis using the assessment data of CASBEE Yokohama. Jpn. Archit. Rev. 2021, 4, 313–319. [Google Scholar] [CrossRef]
- Tleuken, A.; Tokazhanov, G.; Guney, M.; Turkyilmaz, A.; Karaca, F. Readiness assessment of green building certification systems for residential buildings during pandemics. Sustainability 2021, 13, 460. [Google Scholar] [CrossRef]
- Zou, Y.; Zhao, W.; Zhong, R. The spatial distribution of green buildings in China: Regional imbalance, economic fundamentals, and policy incentives. Appl. Geogr. 2017, 88, 38–47. [Google Scholar] [CrossRef]
- Zhang, L.; Wu, J.; Liu, H. Policies to enhance the drivers of green housing development in China. Energy Policy 2018, 121, 225–235. [Google Scholar] [CrossRef]
- Guo, B.; Feng, Z. Selective Preference of Incentive Modes toward Green Residential Housing from the Dynamic Game Perspective. Ecol. Econ. 2018, 34, 83–88. [Google Scholar]
- MacAskill, S.; Stewart, R.A.; Roca, E.; Liu, B.; Sahin, O. Green building, split-incentives and affordable rental housing policy. Hous. Stud. 2021, 36, 23–45. [Google Scholar] [CrossRef]
- Lai, Y.; Li, Y.; Feng, X.; Ma, T. Green retrofit of existing residential buildings in China: An investigation on residents’ perceptions. Energy Environ. 2021. [Google Scholar] [CrossRef]
- Zhou, Y. State power and environmental initiatives in China: Analyzing China’s green building program through an ecological modernization perspective. Geoforum 2015, 61, 1–12. [Google Scholar] [CrossRef] [Green Version]
- Huang, B.; Kanie, N.; Suzuki, M.; Jiang, P. Analysis of Economic Incentive Policies for Improving a Low Carbon Society—Case Study of the Building Industry in China and Japan. Urban Policy Res. 2015, 33, 233–246. [Google Scholar] [CrossRef]
- Li, J.; Shui, B. A comprehensive analysis of building energy efficiency policies in China: Status quo and development perspective. J. Clean. Prod. 2015, 90, 326–344. [Google Scholar] [CrossRef]
- Lai, C.; Chen, X. Complex dynamic analysis for a real-estate oligopoly game model with bounded rationality. J. Syst. Eng. 2013, 28, 285–296. [Google Scholar]
- Gao, Y.; Wang, Y. A Research on supply-locked market structure of real estate. Reform Econ. Syst. 2011, 1, 131–135. [Google Scholar]
- Hines, J.M.; Hungerford, H.R.; Tomera, A.N. Analysis and synthesis of research on responsible environmental behavior: A meta-analysis. J. Environ. Educ. 1987, 18, 1–8. [Google Scholar] [CrossRef]
- Li, Q.; Long, R.; Chen, H. Influencing factors of urban residents’ willingness to pay for green housings from the perspective of generalized trust: Evidence from some first-tier cities in China. Syst. Eng.-Theory Pract. 2021, 41, 58–76. [Google Scholar]
- Jaffe, A.B.; Stavins, R.N. The energy paradox and the diffusion of conservation technology. Resour. Energy Econ. 1994, 16, 91–122. [Google Scholar] [CrossRef]
Publisher’s Note: MDPI stays neutral with regard to jurisdictional claims in published maps and institutional affiliations. |
© 2022 by the authors. Licensee MDPI, Basel, Switzerland. This article is an open access article distributed under the terms and conditions of the Creative Commons Attribution (CC BY) license (https://creativecommons.org/licenses/by/4.0/).