Abstract
This research investigates the impact of the COVID-19 pandemic on foreign direct investment. This research also studies the impact of the COVID-19 pandemic on the relationship between foreign direct investment (FDI) and the gross domestic product (GDP). This research employs a local projection estimation to calculate the effect of the COVID-19 pandemic on foreign direct investment. The panel vector autoregression is applied to estimate the impact of the COVID-19 pandemic on the relationship between FDI and GDP. This research finds variations in the impacts of the COVID-19 pandemic on FDI among economic sectors in Indonesia. Moreover, the relationship between FDI and GDP is affected by the COVID-19 pandemic.
1. Introduction
Foreign direct investment (FDI) plays an important role in the Indonesian economy. FDI supports the Indonesian economy by introducing new technologies, creating jobs, and raising salaries [1]. To sustain Indonesia’s GDP, FDI is critical not only for investment, but also for technology and knowledge spillovers to the rest of the Indonesian economy. Indonesia’s current development is not sustainable without these inputs. Despite the importance of the FDI, the contribution of the FDI has approximately been only 2% to the gross domestic product in the Indonesian economy since 2010 [2]. In 2020, the total realized FDI in Indonesia amounted to USD 28.67 billion, which is a 1.62% increase compared to USD 28.21 billion in 2019 [2]. The low FDI growth can limit the economic growth in Indonesia. Furthermore, the COVID-19 pandemic, which has been ongoing since 2020, may impede FDI expansion in Indonesia. Moreover, the end of the COVID-19 pandemic is still unknown.
There is a small body of literature investigating the impact of the COVID-19 pandemic on FDI. For example, using cross-country data, the OECD [3] investigated the impact of the COVID-19 pandemic on FDI in the early stages of the pandemic. Camino-Mogro and Armijos [4] investigated the impact of the activity restriction caused by the COVID-19 pandemic on FDI in Ecuador. Chaudary et al. [5] investigated the impact of the COVID-19 pandemic on the FDI in Nepal. Moreover, Ho and Gan [6] also investigated the impact of the COVID-19 pandemic on the FDI using general samples of 142 countries. Furthermore, there is hardly any research investigating the impact of the COVID-19 pandemic on the FDI in the Indonesian economy. Thus, it is relevant to investigate the effect of the COVID-19 pandemic on the FDI in the Indonesia economy.
Moreover, the COVID-19 pandemic has also triggered recessions with varying severity in most countries and sectors. The pandemic impacted the flow of investment to those sectors differently: many were harmed, whereas others were not. This is due to the nature of the pandemic, which mainly restricts human mobility. Thus, the impacts were mostly made to sectors that rely heavily on this, such as transportation and tourism [7,8]. The impact of the pandemic can also be different for the sectors that have productive investment from FDI, such as sectors of manufacture and primary products [3]. Thus, it is crucial to see the effect of the COVID-19 pandemic on the FDI among sectors in Indonesia.
Moreover, Indonesia is a large country, with a population of approximately 270 million people spread across 34 provinces in 2020 [9]. Dana [10], Effendi et al. [11], Setiawan et al. [12] and Setiawan [13]also reported that Indonesia has approximately 13,667 lush islands and that the population of Indonesia is quite diverse. There are approximately six groups of islands or regions, including Java, Bali and Nusa Tenggara, Kalimantan, Sulawesi, Sumatera, and East Indonesia. Each island has a unique culture and different economic potential, which may make the impact of the COVID-19 pandemic different among regions. As a result, it is relevant to investigate the impact of the COVID-19 pandemic on FDI by region.
In terms of FDI’s importance to the Indonesian economy, the COVID-19 pandemic may have an impact on the link between FDI and GDP. There has been past research into the relationship between FDI and GDP. However, the impact of the COVID-19 pandemic on such a relationship has never been studied. Abbes et al. [14], Sengupta and Puri [15], and Owusu-Nantwi and Erickson [16], for example, simply looked at the link between FDI and GDP without taking into account the impact of the pandemic. Investigating the impact of the COVID-19 pandemic on the relationship between FDI and GDP is important in order to see the effectiveness of the impact of the FDI on the GDP or the impact of the GDP on the FDI during the COVID-19 pandemic.
Research investigating the impact of the COVID-19 pandemic on FDI at sectoral and regional levels, as well as the impact of the COVID-19 pandemic on the relationship between FDI and GDP, has not been conducted in the Indonesian economy using a dynamic approach. For example, a previous study by Khaliq and Noy [17] only investigated the relationship between sectoral FDI and GDP in the Indonesian economy using a static approach. In addition, they did not include the impact of the pandemic on the relationship. Applying a dynamic approach in such an investigation is essential, since the COVID-19 pandemic is also dynamic. An investigation using a static approach may mask the short and long-term relationships between the variables because of the pandemic. Thus, research investigating the relationships between the variables using a dynamic approach can contribute to the literature.
From the policymaker’s perspective, the possibility of a negative impact of the COVID-19 pandemic on FDI could lead to significant economic losses. In addition, the possibility of a negative impact of the COVID-19 pandemic on the relationship between GDP and FDI could limit the impact of GDP and FDI in the Indonesian economy. Therefore, the impact of the COVID-19 pandemic should be targeted by policymakers. For example, this investigation would help policymakers to identify sectors that are more likely to be heavily impacted in FDI by the COVID-19 pandemic. Monitoring these sectors more intensively may also improve the effectiveness of the monetary and fiscal policies in the Indonesian economy.
Based on the foregoing context, this paper aims to investigate the effect of the COVID-19 pandemic on FDI at sectoral and regional levels, respectively. In addition, this research studies the impact of the COVID-19 pandemic on the relationship between FDI and GDP using a dynamic approach in the Indonesian economy. The paper is organized as follows. Section 2 provides a literature review. Section 3 describes the modeling approach. The data description follows this in Section 4, and the presentation of the empirical model and results is in Section V. The last section summarizes the results and draws conclusions.
2. Literature Review
The COVID-19 pandemic is not the first or only pandemic to affect foreign direct investment in recent decades. Concerning the impact of other pandemics on FDI, IMF [18] and Ho and Gan [6] discovered that the SARS and Ebola pandemics might reduce FDI and cause major investment to be delayed. In addition, the great influenza pandemic (Spanish flu) in 1918 hit the macroeconomy, including investment, substantially (see [19]). This can be an indication that any pandemic may reduce investment, including FDI.
Regarding the impact of the COVID-19 pandemic on the FDI, Ho and Gan [6] investigated the impact of the COVID-19 pandemic on the FDI using 142 samples of countries. The research applied a world pandemic uncertainty index (WPUI) to measure the pandemics, including the COVID-19 pandemic. The research found that the COVID-19 pandemic harmed the FDI. Camino-Mogro and Armijos [4] investigated the impact of the COVID-19 pandemic on the FDI in Ecuador. The research found that the restriction on mobility caused by COVID-19 reduced the FDI inflow. In addition, Chaudary et al. [5] investigated the impact of the COVID-19 pandemic on the FDI in Nepal. The research found that the COVID-19 pandemic could reduce the FDI commitment in Nepal. The majority of the research, however, was conducted at an earlier stage of the pandemic, and the impact of the COVID-19 pandemic on sectoral FDI was rarely empirically investigated. Since the impact of the COVID-19 pandemic may be different among economic sectors, it is relevant to investigate the effect of the pandemic on the Indonesian economic sectors.
Regarding the impact of the COVID-19 pandemic on FDI at a sectoral level, OECD [3] investigated the foreign direct investment flows during the time of COVID-19 using the world dataset. Using an optimistic scenario, the research predicted that FDI would fall by more than 30% in 2020. The FDI flows to developing countries were expected to drop even more than developed countries, since the sectors that had been severely impacted by the COVID-19 pandemic, including manufacturing and primary sectors, had a larger share of their FDI. In addition, Loayza and Pennings [7] predicted that sectors of airlines, tourism, and hospitality services would collapse if the pandemic was not managed well. Ozili and Arun [8] also suggested that the COVID-19 pandemic might hit the aviation industry and service industry. However, this research was only a projection using historical data before the COVID-19 pandemic. Thus, this might not be too accurate in predicting the current impact of the COVID-19 pandemic on the sectoral FDI, as concluded in the report.
Furthermore, a large body of literature has been devoted to the relationship between foreign direct investment and GDP. Researchers all over the world use a variety of approaches to empirically investigate the relationship between these two variables. However, the impact of the COVID-19 pandemic on such a relationship has never been investigated. During the COVID-19 pandemic, the restriction in mobility may cause a limitation not only on the FDI growth, but also on the impact of FDI on GDP or the impact of GDP on FDI (see [4]). The signal of recession or recovery during the COVID-19 pandemic may also affect the economic variables that will influence the relationship between FDI and GDP (see [20]). However, the previous research never observed how the path of the relationship between FDI and GDP changed before and after the COVID-19 pandemic. For example, a general analysis of the relationship between FDI and GDP was carried out by Abbes et al. [14] using a country-level aggregate of FDI and GDP. They applied cointegration and panel Granger causality tests to investigate the relationship empirically. A unidirectional causality from FDI to GDP was found. A matching finding was also put forward by Owusu-Nantwi and Erickson [16]. They used data from 10 South American countries and employed a panel VECM model. Using the Pedroni cointegration test, a significant impact from FDI on GDP growth was found. Sengupta and Puri [15] estimated the relationship between FDI and GDP in India and its neighborhood. Their research found that the relationship between FDI and GDP varied between countries. Despite this, most of the research found that only FDI affected the GDP. Furthermore, the impact of the COVID-19 pandemic on the relationship between FDI and GDP using sectoral economic level data has not yet been investigated. In spite of this, the COVID-19 pandemic may affect the relationship between GDP and FDI, as has also happened in other pandemics (see [6,18,21]).
Based on previous research, this study hypothesizes that the COVID-19 pandemic has a significant impact on FDI, but the magnitude of the impact varies by sector and region. Moreover, the COVID-19 pandemic can also change the relationship between FDI and GDP.
3. Methods
This research used local projection estimation (LPE) to investigate the effect of the COVID-19 pandemic on the FDI for each sector and each region. The uncorrected local projection estimation (LPE) was applied using the Teulings and Zubanov [22] approach, since the corrected LPE model may not be applied because of the perfect multicollinearity problem. The perfect multicollinearity may be sourced from the perfect correlation between period dummies of the COVID-19 pandemic and their corrected dummy variables. The corrected dummy variables represent the intermediate COVID-19 pandemic between t and t + k, which also contains the period dummies. Since the corrected dummies do not vary in this research, it may create the perfect correlation between the two variables. Thus, the LPE was modeled as follows:
where yt is the vector of FDI variable at quarter t, d is the dummy variable that takes the value 1 for the period of COVID-19 pandemic and 0 otherwise, m is number lag of y, l is number lag of d, and k is the time horizon of the impact of the COVID-19 pandemic. The time horizon is limited only for 6 periods, since COVID-19 affected Indonesian economy from quarter 1 of 2020 until quarter 2 of 2021, when this research was conducted. Although the time horizon of the pandemic only includes 6 periods and becomes the limitation of this research, the use of the impulse response from the model might still represent the direct impact of the COVID-19 pandemic on the FDI. Moreover, this research still had more than 30 periods of observation for each sector investigated, which was expected to fit with the model.Since the time horizon for k is not long enough, it was expected to create less bias in the LPE estimation (see Teulings and Zubanov [22]). Moreover, this research has a long enough period to estimate robust coefficients to predict the impact of the COVID-19 pandemic on the FDI using the local projection estimation (LPE), since the estimation does not only include the observation during the COVID-19 pandemic. To obtain the impulse response, this LPE can treat the impact of the COVID-19 pandemic specifically using the coefficients (including the dummy of COVID-19 pandemic) in the LPE model.
Furthermore, the impact of the shock from the COVID-19 pandemic on the relationship between FDI and GDP is estimated using the model as follows:
where j is the sector, t is the quarter period, and p is the number of lags. Equations (2) and (3) are estimated using a panel vector autoregression (PVAR) using three groups of the periods, including all periods, periods before the COVID-19 pandemic, and periods after the COVID-19 pandemic. The impact of the COVID-19 pandemic on the relationship between the variables is evaluated through the differences in impulse responses between the period of the COVID-19 pandemic and other periods. The estimation for each sector using groups of periods, as applied in Equation (1), can not be applied because of the insufficient observation after the COVID-19 pandemic. Equations (2) and (3) are estimated using the Arrelano–Bond estimator to control the endogeneity problem by applying the generalized method of moment (GMM). The error terms in these two equations are uncorrelated with past values of the regressors, and the estimator exploits additional moment conditions by using a list of instruments that vary with t (see [23]). Thus, the model uses instrumental variables to represent the lags of the endogenous variables, assuming that these are uncorrelated with the error terms. The number of appropriate lags in the PVAR model is determined using the coefficient criteria of the modified Akaike information criterion, as proposed by Andrew and Lu [24]. Due to the fact that this research uses an unbalanced panel dataset, a Fisher-type test of augmented Dickey–Fuller (ADF) [25] is applied to test whether the null hypothesis of a unit root (non-stationary) for all panels of each variable in Equations (1) and (2) is rejected in the level form. A panel cointegration test and a panel error correction model are applied if one or more variables are not stationary at the level form (see [26,27,28]).
4. Data
The FDI is a foreign capital inflow sourced from the Indonesian Investment Board (BKPM). This research uses the quarterly period of data from 2000Q1 to 2021Q2. This research is conducted in quarter 3 of 2021. Thus, it is not possible to add more quarters. The COVID-19 pandemic period runs from the first quarter of 2020 to the second quarter of 2021. The gross domestic product (GDP) is taken from the Indonesian Central Statistics Agency (BPS). The GDP and FDI are deflated by the consumer price index. The FDI variable applied in the model is measured by the ratio between FDI inflows and GDP [29]. The GDP is transformed into the natural logarithm as the final variable applied in the model.
Formally, Indonesia has 17 economic sectors, which can be classified into the primary sector, manufacturing sector, utility, and service sector. Each economic sector is divided into subsectors. This research uses 19 subsectors of the 17 sectors in which FDI has been reported and matched with sectoral data of GDP from the Indonesian Bureau of Central Statistics (BPS). Table 1 shows the descriptive statistics of the GDP and FDI variables across sectors and periods. The GDP and FDI variables had a high variation across sectors and periods (larger than 1). The GDP and FDI had coefficients of variation of 1.373 and 1.849, respectively. There were subsectors that had zero FDI inflow in one of the quarters during the period 2000Q1-2021Q2. For example, the subsector of the fishery had zero FDI inflow in some of the quarters during the period 2000–2004.

Table 1.
Descriptive statistics of the variables (Billion Rupiah), Indonesian Economic Sectors (19 subsectors), 2000Q1–2021Q2.
5. Results
Table 2 shows the average variables based on the groups of the two-year interval period. Average GDP and FDI were calculated across sectors. The average gross domestic product increased from the period interval of 2000Q1–2001Q4 to the period interval of 2020Q1–2021Q1. The average GDP decreased in the period interval of 2020Q1–2021Q2 compared to the period interval of 2018Q1–2019Q4. This indicates that the average GDP during the COVID-19 pandemic declined. From Table 2, it is seen that the average FDI fluctuated in the period interval from 2000Q1–2001Q4 to 2020Q1–2021Q2. Based on the groups of periods, the average FDI during the COVID-19 pandemic (2020Q1–2021Q2) was larger compared to the average FDI in the period interval of 2018Q1–2019Q4. This condition indicates that the impact of FDI may not be the same for all economic sectors in Indonesia as suggested by the OECD [3]. FDI in a few sectors might decrease, but FDI in other sectors might increase. Moreover, the introduction of Law No. 11 in the year 2020 could make investment easier in Indonesia and might attract FDI even in the COVID-19 pandemic.
Table 2.
Average GDP and FDI, Indonesian economic sectors (19 subsectors), 2000Q1–2021Q2.
Table 3 shows the average GDP and average FDI variables for primary, manufacturing, and utility and service sectors using the two-year interval period. Before the COVID-19 pandemic, the average GDP increased for all sectors, including the primary sector, manufacturing sector, and utility and service sector. The average GDP of all sectors decreased during the COVID-19 pandemic. The largest decrease in average GDP occurred in the utility and service sector. The average GDP decreased by approximately −0.27% (the decline in GDP from 695,380 to 693,504.4), −0.39% (the decline in GDP from 599,113.1 to 596,759.3), and −2.69% (the decline in GDP from 1,418,040 to 1,379,880) for the primary sector, manufacturing sector, and utility and service sector during the COVID-19 pandemic compared to the period of 2018Q1–2019Q4, respectively. This supported the prediction by Loayza and Pennings [7] and Ozili and Arun [8], who suggested that the service sector would be hit the most by the COVID-19 pandemic.
Table 3.
Average GDP and FDI (Billions IDR), Indonesian economic sectors (19 subsectors), 2000Q1–2021Q2.
From Table 3, it is also seen that the average FDI increased only in the manufacturing sector during the COVID-19 pandemic of 2020Q1–2021Q2. The primary sector and utility and service sector had a significant reduction in the average FDI during the COVID-19 pandemic. For example, average FDIs in the primary sector and utility and service sector fell by approximately 14.17% (the decline in FDI from 12,901.93 to 11,074.23) and 20.86% (the decline in FDI from 46,674.01 to 36,938.63), respectively, during the COVID-19 pandemic compared to the period 2018Q1–2019Q4. In the manufacturing sector, there was an increase in the average FDI from 31444.28 to 45082.65, or there was an increase of 43.37% during the COVID-19 pandemic period compared to the period of 2018Q1–2019Q4. This could be an indication that the manufacturing sector had a better performance during the COVID-19 pandemic compared to other sectors. The manufacturing sector has also been included in the priority sectors that received incentives during the COVID-19 pandemic, such as tax holidays or other support from the National Economic Recovery Program. This finding does not support the projection by the OECD [3], which suggested that the FDI in the manufacturing sector would decline significantly during the COVID-19 pandemic.
The impulse responses from the local projection estimation (LPE) to evaluate the sectoral impact of the COVID-19 pandemic on FDI are shown in Table 4, Table 5 and Table 6. The corrected LPE model could not be applied because of the perfect multicollinearity problem, as explained in the section of methodology. Table 7 estimates the impact of the COVID-19 pandemic on foreign direct investment in Indonesian regions, such as Java, Bali and Nusa Tenggara, Sumatera, Kalimantan, Sulawesi, and East Indonesia. The LPE models were estimated using a one-year lag based on the least coefficient value of the modified Akaike information criterion. Moreover, the FDI variable was stationary at the 1% critical level based on the Fisher-type test of ADF. The stationary condition indicated that modeling the dependence structure in the LPE models was valid using the variables at the level form.
Table 4.
Impulse responses of FDI to COVID-19 pandemic in primary sector.
Table 5.
Impulse responses of FDI to COVID-19 pandemic in manufacturing sector.
Table 6.
Impulse responses of FDI to COVID-19 pandemic in utility and service sector.
Table 7.
Impulse responses of FDI to COVID-19 pandemic in Indonesian regions.
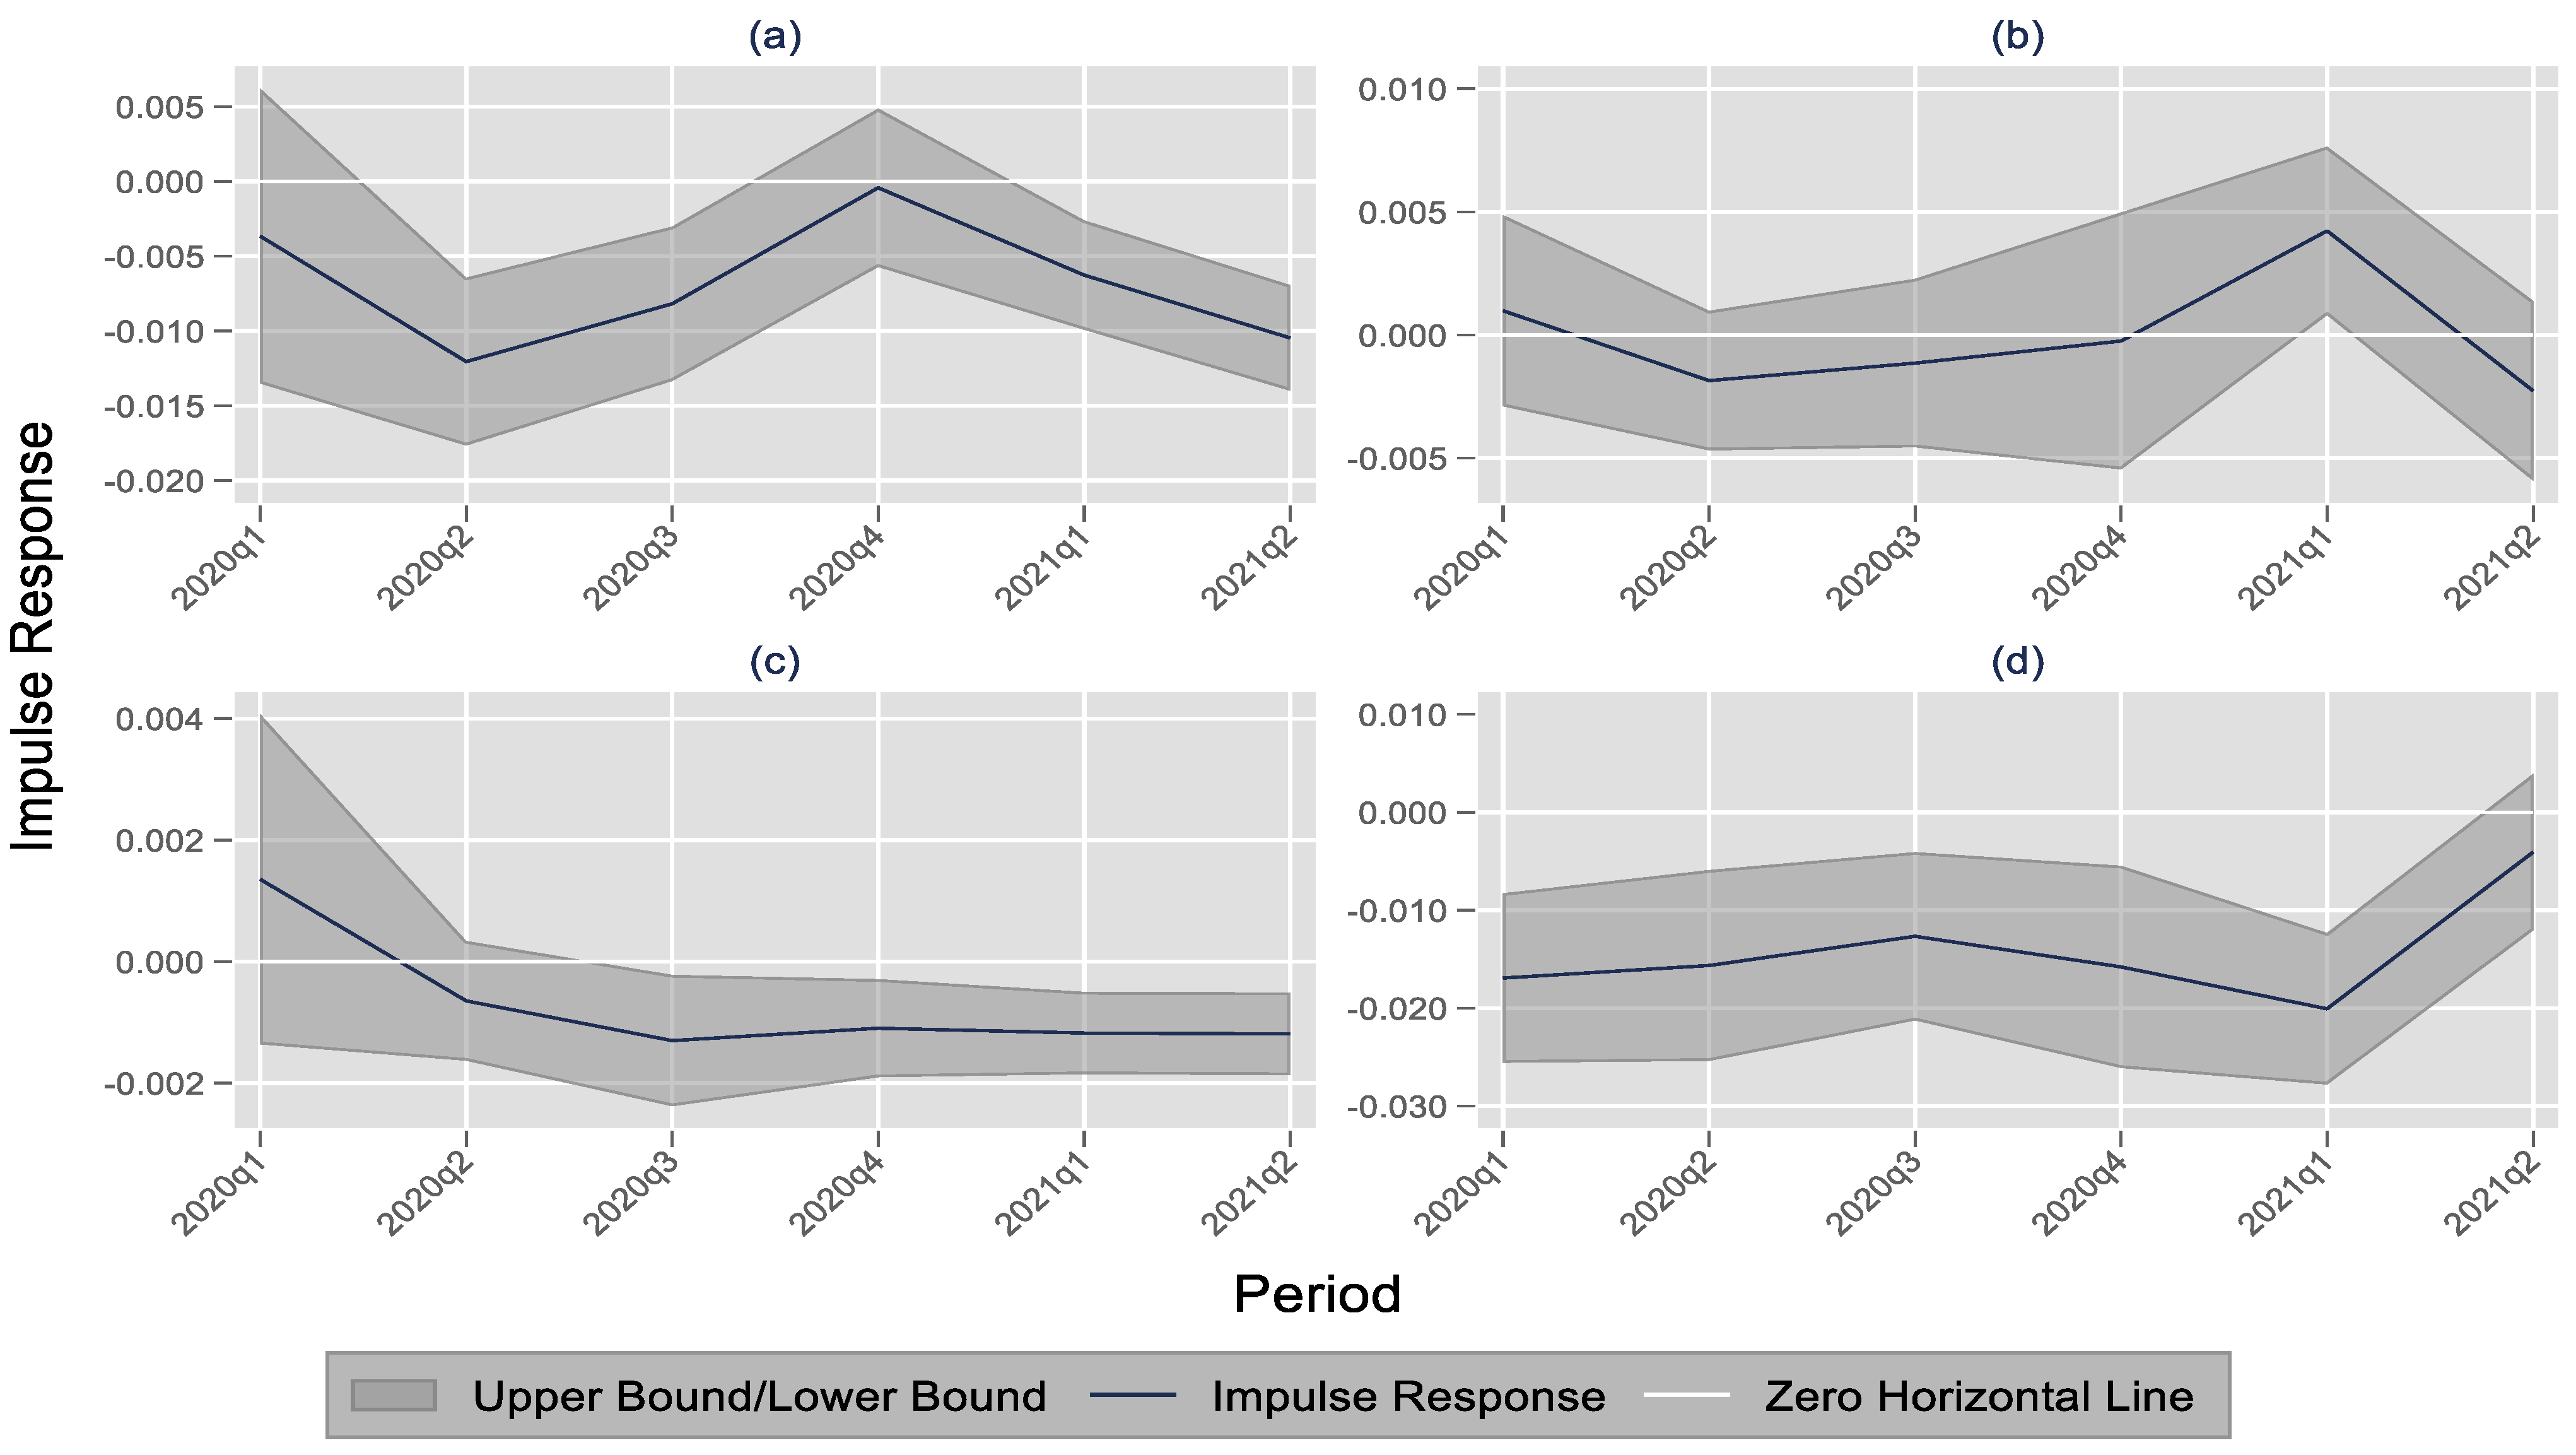
Table 4 shows the impulse responses from the local projection estimation (LPE) to evaluate the sectoral impact of the COVID-19 pandemic on the FDI in the primary sector, including subsectors of food crops, plantations, and livestock; forestry; fishery; and mining. From Table 4 and Figure 1, it can be seen that the COVID-19 pandemic significantly reduced the FDI for most of the subsectors in the primary sector, except for the forestry subsector. The forestry subsector had insignificant FDI losses for most of the quarters, reaching 0.02% losses during four quarters in 2020. The FDI in the forestry subsector recovered by 0.42% in quarter 1 of 2021 after a shock due to the COVID-19 pandemic. Furthermore, the shock due to the COVID-19 pandemic was projected to decrease the FDI in the subsector of food crops, plantations, and live stocks in quarter 2 and quarter 3 of 2020 and quarters 1–2 of 2021. Until quarter 2 of 2021, an average COVID-19 pandemic led to FDI losses in the tune of 1.05% in the subsector. The decrease in FDI caused by the impact of the COVID-19 pandemic also occured in quarters 3–4 of 2020 and quarters 1–2 of 2021 for the fishery subsector. The FDI in the mining subsector also decreased in quarters 1–4 of 2020 and quarter 1 of 2021 after the shock due to the COVID-19 pandemic. The mining subsector was seen to be hit the most by the COVID-19 pandemic compared to the other subsectors in the primary sector. The FDI losses reached approximately 2% until quarter 1 of 2021, after the pandemic in the mining subsector. From the results, it can be concluded that the impact of the COVID-19 pandemic could be different among the subsectors of the primary sector, as suggested by the OECD [3]. However, the impacts were mostly negative for all subsectors of the primary sector.
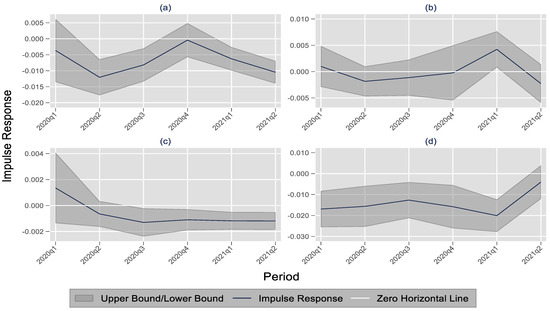
Figure 1.
Impulse responses of FDI to COVID-19 pandemic in primary sector. Notes: (a) = food crops, plantation, and livestock. (b) = forestry. (c) = fishery. (d) = mining. Source: BKPM and authors’ calculation.
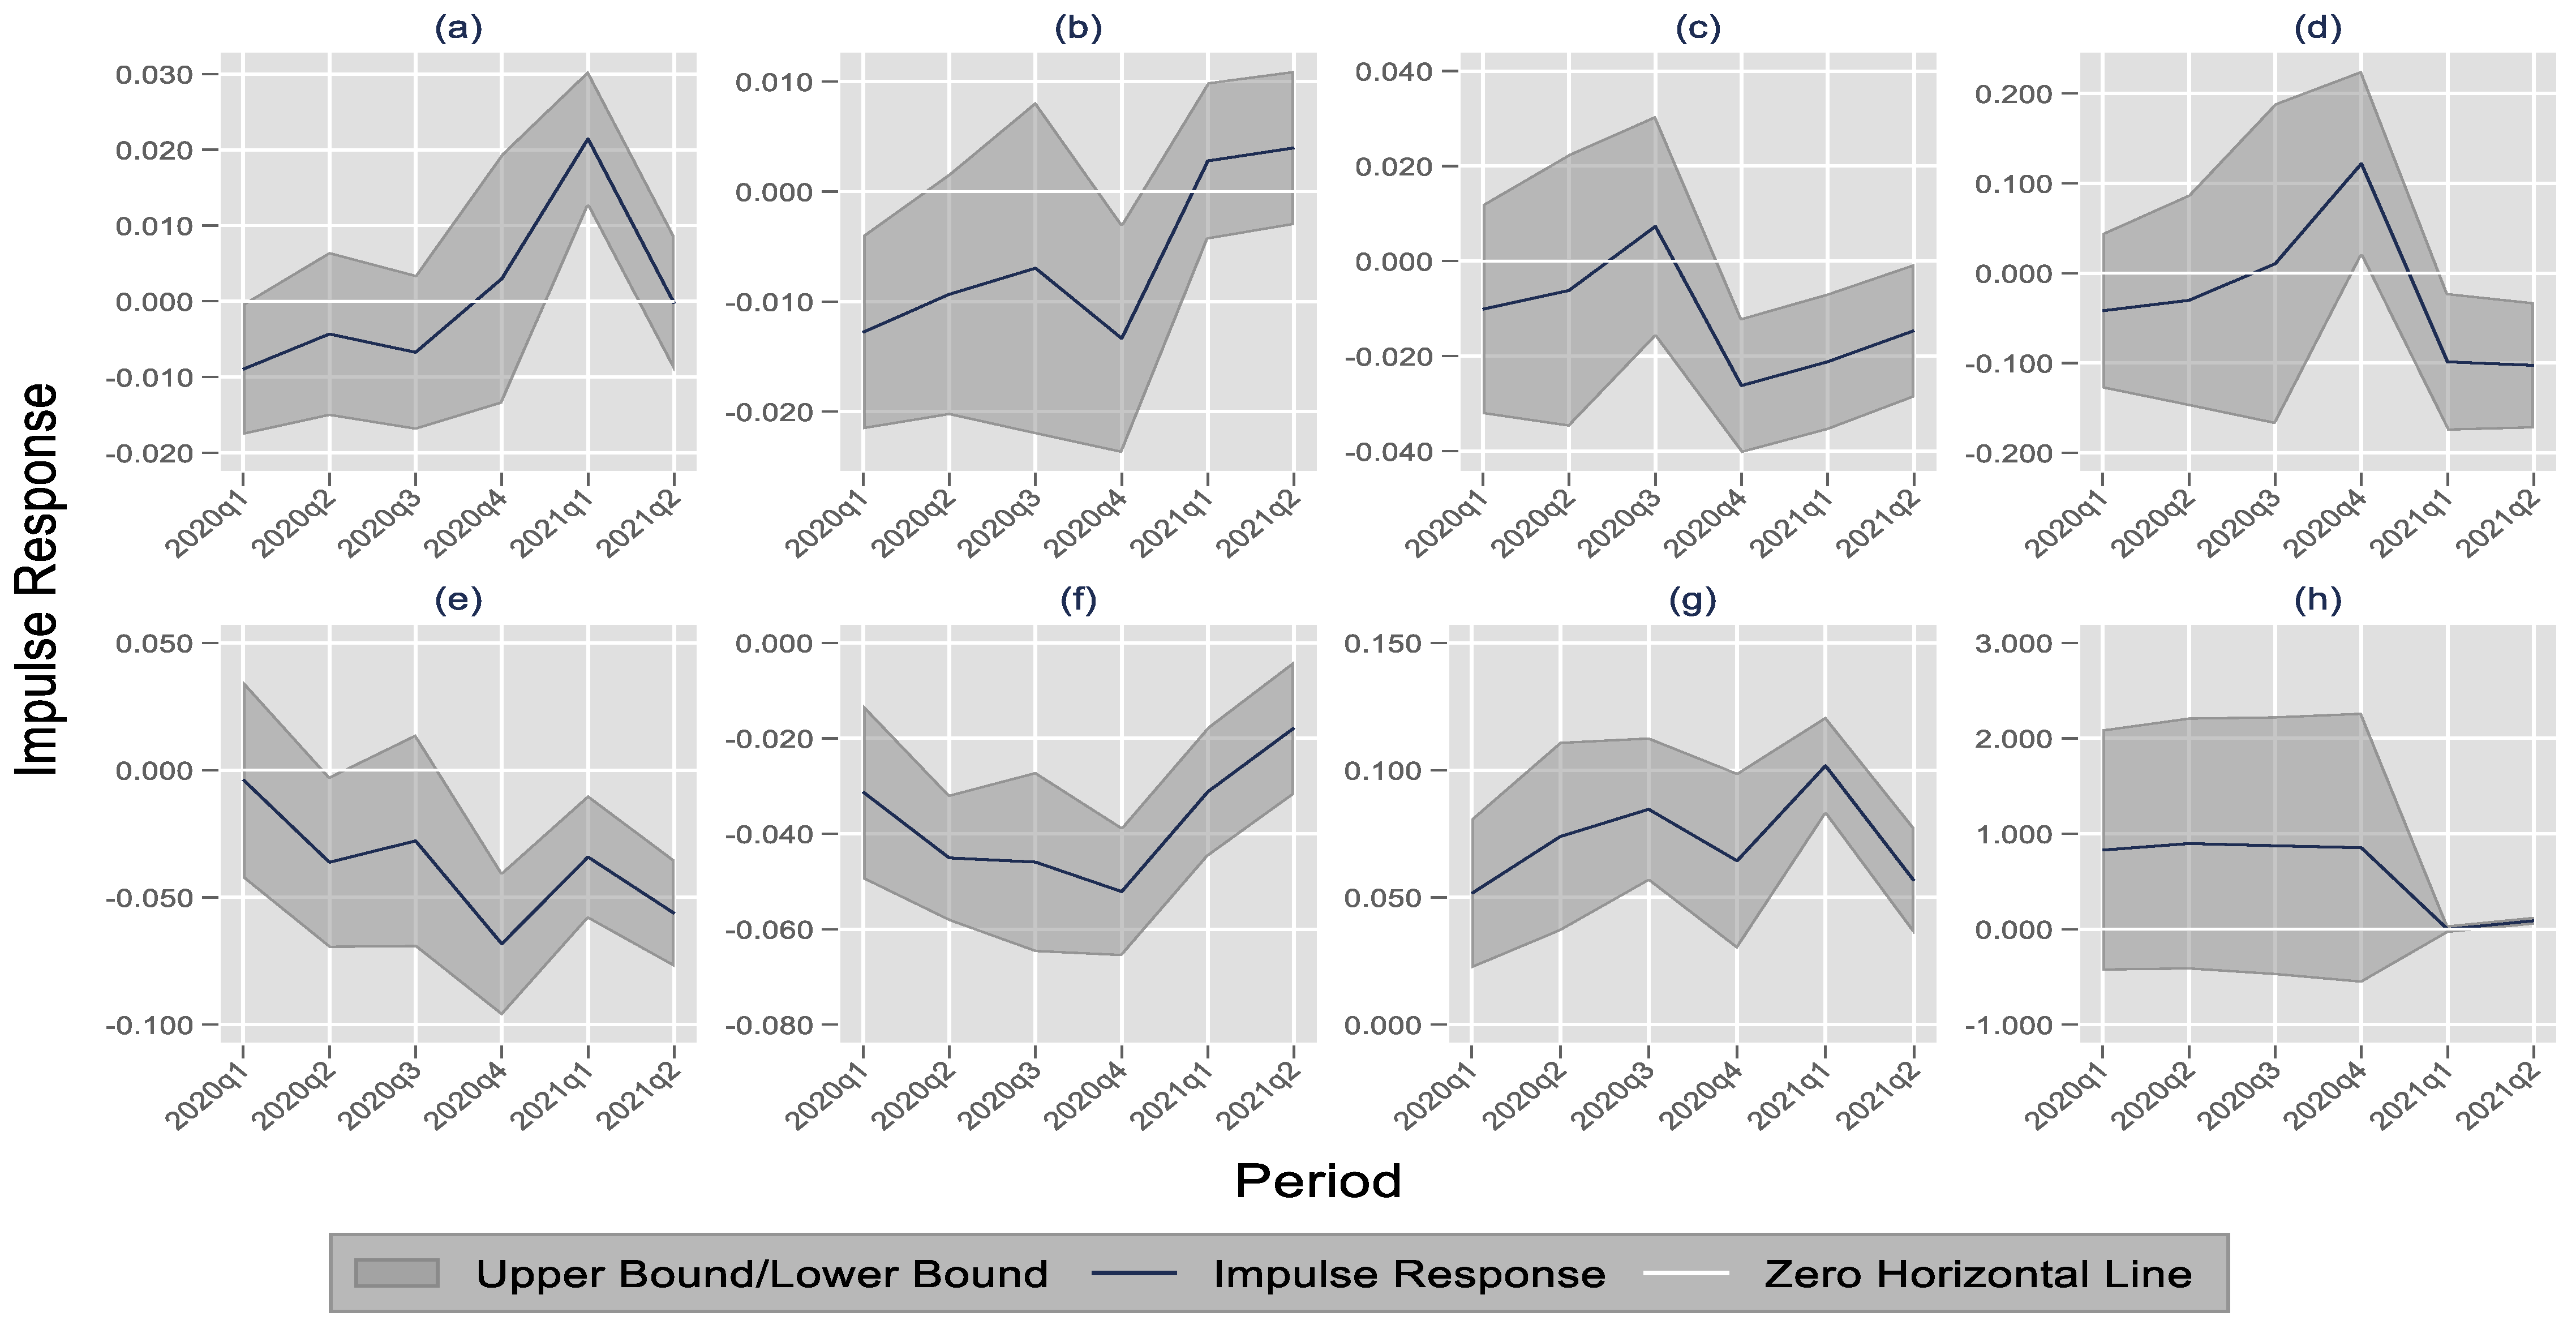
Table 5 and Figure 2 show the impulse responses of the FDI to the shocks due to the COVID-19 pandemic in the manufacturing sector. The COVID-19 pandemic significantly reduced FDI in six subsectors: the textile, leather goods, and footwear industry; wood industry; paper and printing industry; chemical and pharmaceutical industry; rubber and plastic industry; and non-metallic mineral industry. The FDI of other industries was not significantly affected by the shock of the COVID-19 pandemic. The FDI in the subsectors of the metal industry—machinery, electronics, and equipment—had a positive relationship with the COVID-19 pandemic in the six quarters ahead after the shock of the COVID-19 pandemic. The effects were significant at the 1% critical level, leading to the FDI increasing by 5.67% for the six quarters. The positive effect of the COVID-19 pandemic also occurred in the food subsector in one of the quarters. Other industries tended to have a weak positive relationship with the COVID-19 pandemic (all impulse responses were positive for the six quarters ahead, although those responses were not significant).
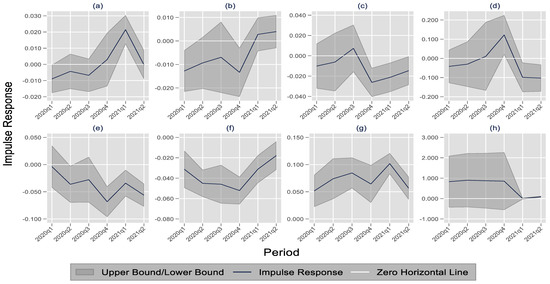
Figure 2.
Impulse responses of FDI to COVID-19 pandemic in manufacturing sector. Notes: (a) = food industry. (b) = textile, leather goods, and footwear industry. (c) = wood. (d) = paper and printing industry. (e) = chemical and pharmaceutical industry, rubber and plastic industry. (f) = non-metallic mineral industry. (g) = metal industry, machinery, electronic, and equipment. (h) = other industries. Source: BKPM and authors’ calculation.
From Figure 2, it is shown that the shock of the COVID-19 pandemic decreased the FDI in the subsector of the non-metallic mineral industry for all quarters during the 2020–2021 period. Furthermore, the shock of the COVID-19 pandemic reduced FDI in the textile, leather goods, and footwear industry in quarter 1 and quarter 4 of 2020; in the wood industry in quarter 4 of 2020 and quarters 1–2 of 2021; in the paper and printing industry in quarters 1–2 of 2021; and in the chemical and pharmaceutical industry, as well as the rubber and plastic industry, in quarter 2 and quarter 4 of 2020 and quarters 1–2 of 2021.The results indicate that the impact of the COVID-19 pandemic on FDI was not the same for each subsector in the manufacturing sector.
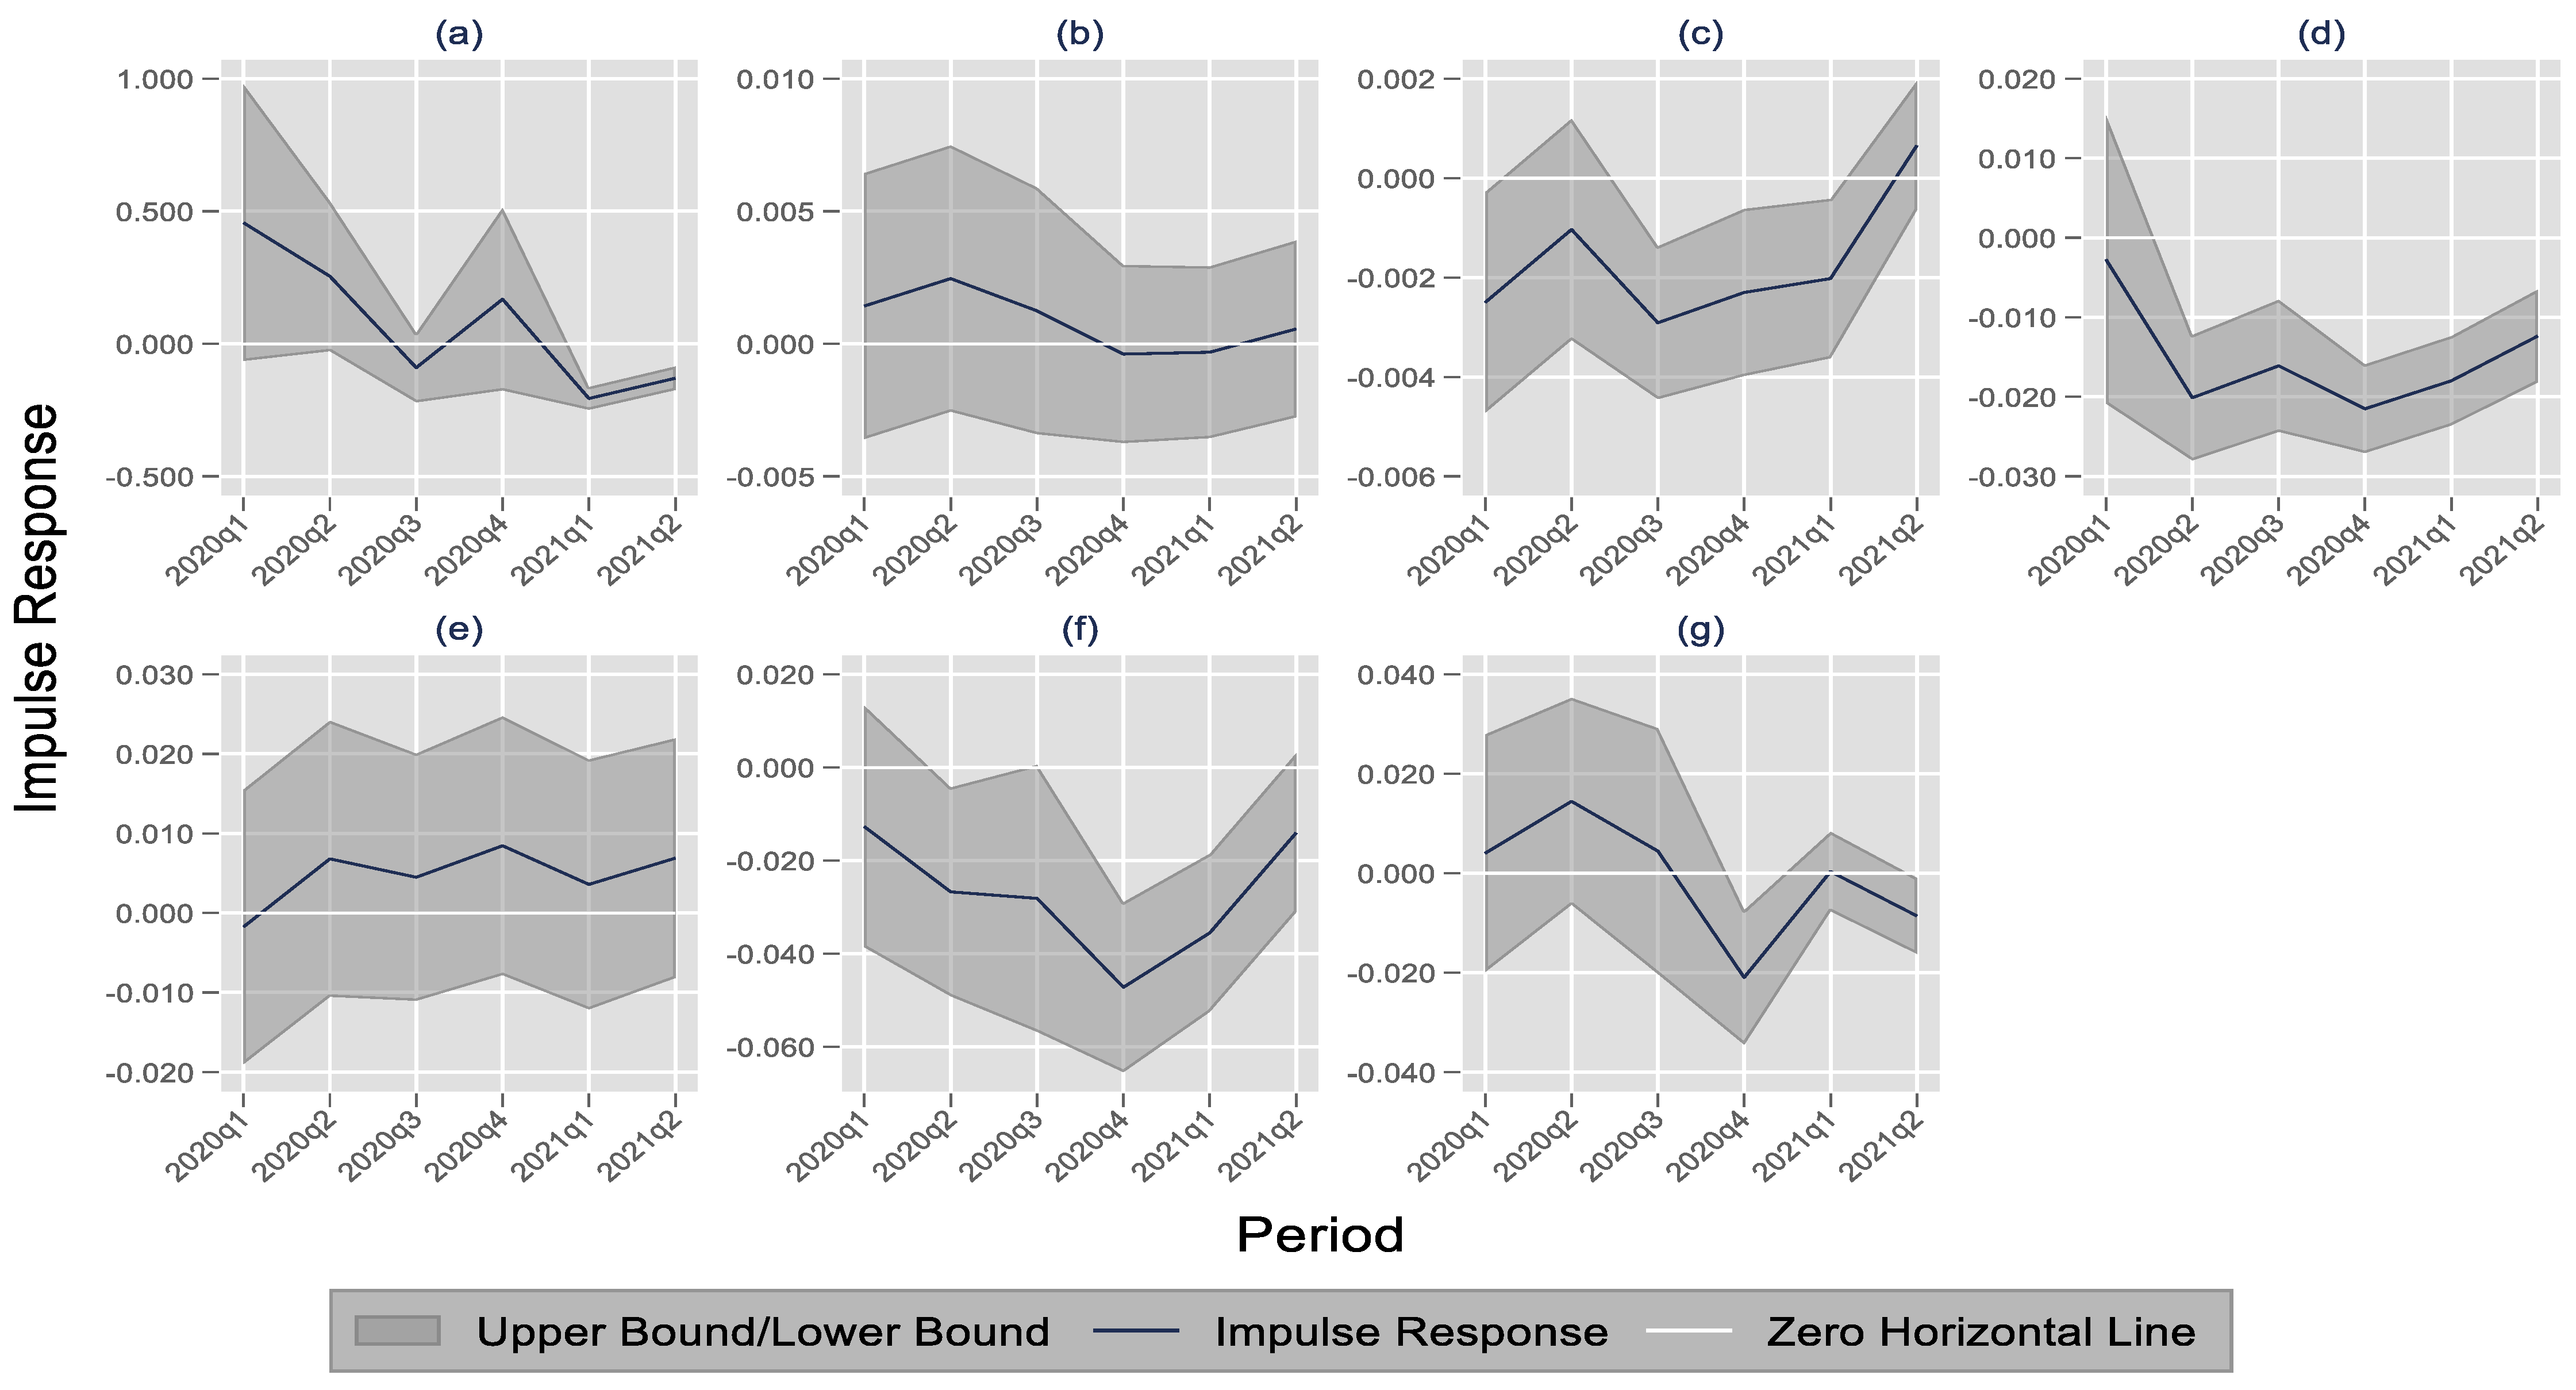
Table 6 and Figure 3 show the impulse responses of FDI to the COVID-19 pandemic in the utility and service sector for five quarters ahead after the shock from the pandemic. The COVID-19 pandemic primarily reduced FDI in the utility and service sector, including the electricity, gas, and water supply; construction; trade and repair industry; hotels and restaurants; real estate, industrial estate, and business activities; and other services. The FDI in the subsectors of construction and transport, storage, and communication was not significantly affected by the COVID-19 pandemic. Although it was not significant, the weak impacts were positive. While the COVID-19 pandemic had a detrimental influence on the transport subsector, the positive impact might be attributed to the communication subsector’s good performance during the pandemic. The findings indicate that the impact of the COVID-19 pandemic on FDI may differ depending on the subsectors of the utility and service sector. For example, the shock of the COVID-19 pandemic negatively affected the FDI in the subsector of hotels and restaurants for all six quarters ahead. However, the shock from the COVID-19 pandemic affected FDI only in the first two quarters of 2021 for the subsector of the electric, gas, and water supply; the first, third and fourth quarters of 2020 and the first quarter of 2021 for the subsector of the trade and repair industry; the second quarter of 2020, the fourth quarter of 2020, and the first quarter of 2021 for real estate, industrial estate, and business activities; and the fourth quarter of 2020 and the second quarter of 2021 for other services. This is in line with the predictions by Loayza and Pennings [7] and Ozili and Arun [8], who suggested that the COVID-19 pandemic may hit the sectors of airlines and services.
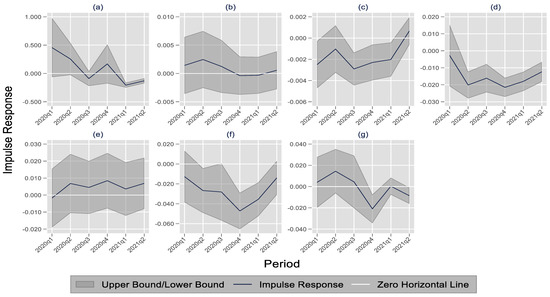
Figure 3.
Impulse responses of FDI to COVID-19 Pandemic in utility and service sector. Notes: (a) = electric, gas, and water supply. (b) = construction. (c) = trade and repair industry. (d) = hotel and restaurant. (e) = transport, storage, and communication. (f) = real estate, industrial estate, and business activities. (g) = other services. Source: BKPM and authors’ calculation.
The results from Table 1, Table 2, Table 3, Table 4, Table 5 and Table 6 or Figure 1, Figure 2 and Figure 3 indicate that the impact of the COVID-19 pandemic on the FDI was not the same for all sectors. This might support the projection of the OECD [3], which suggested that the impact of the COVID-19 pandemic could be different among countries and sectors. In addition, the results indicated that the impact of the COVID-19 pandemic on FDI was not the same between quarters for the impacted sectors. These impact differences might be caused by how vital FDI is to the economic sectors and how a country could deal with the COVID-19 pandemic over time.
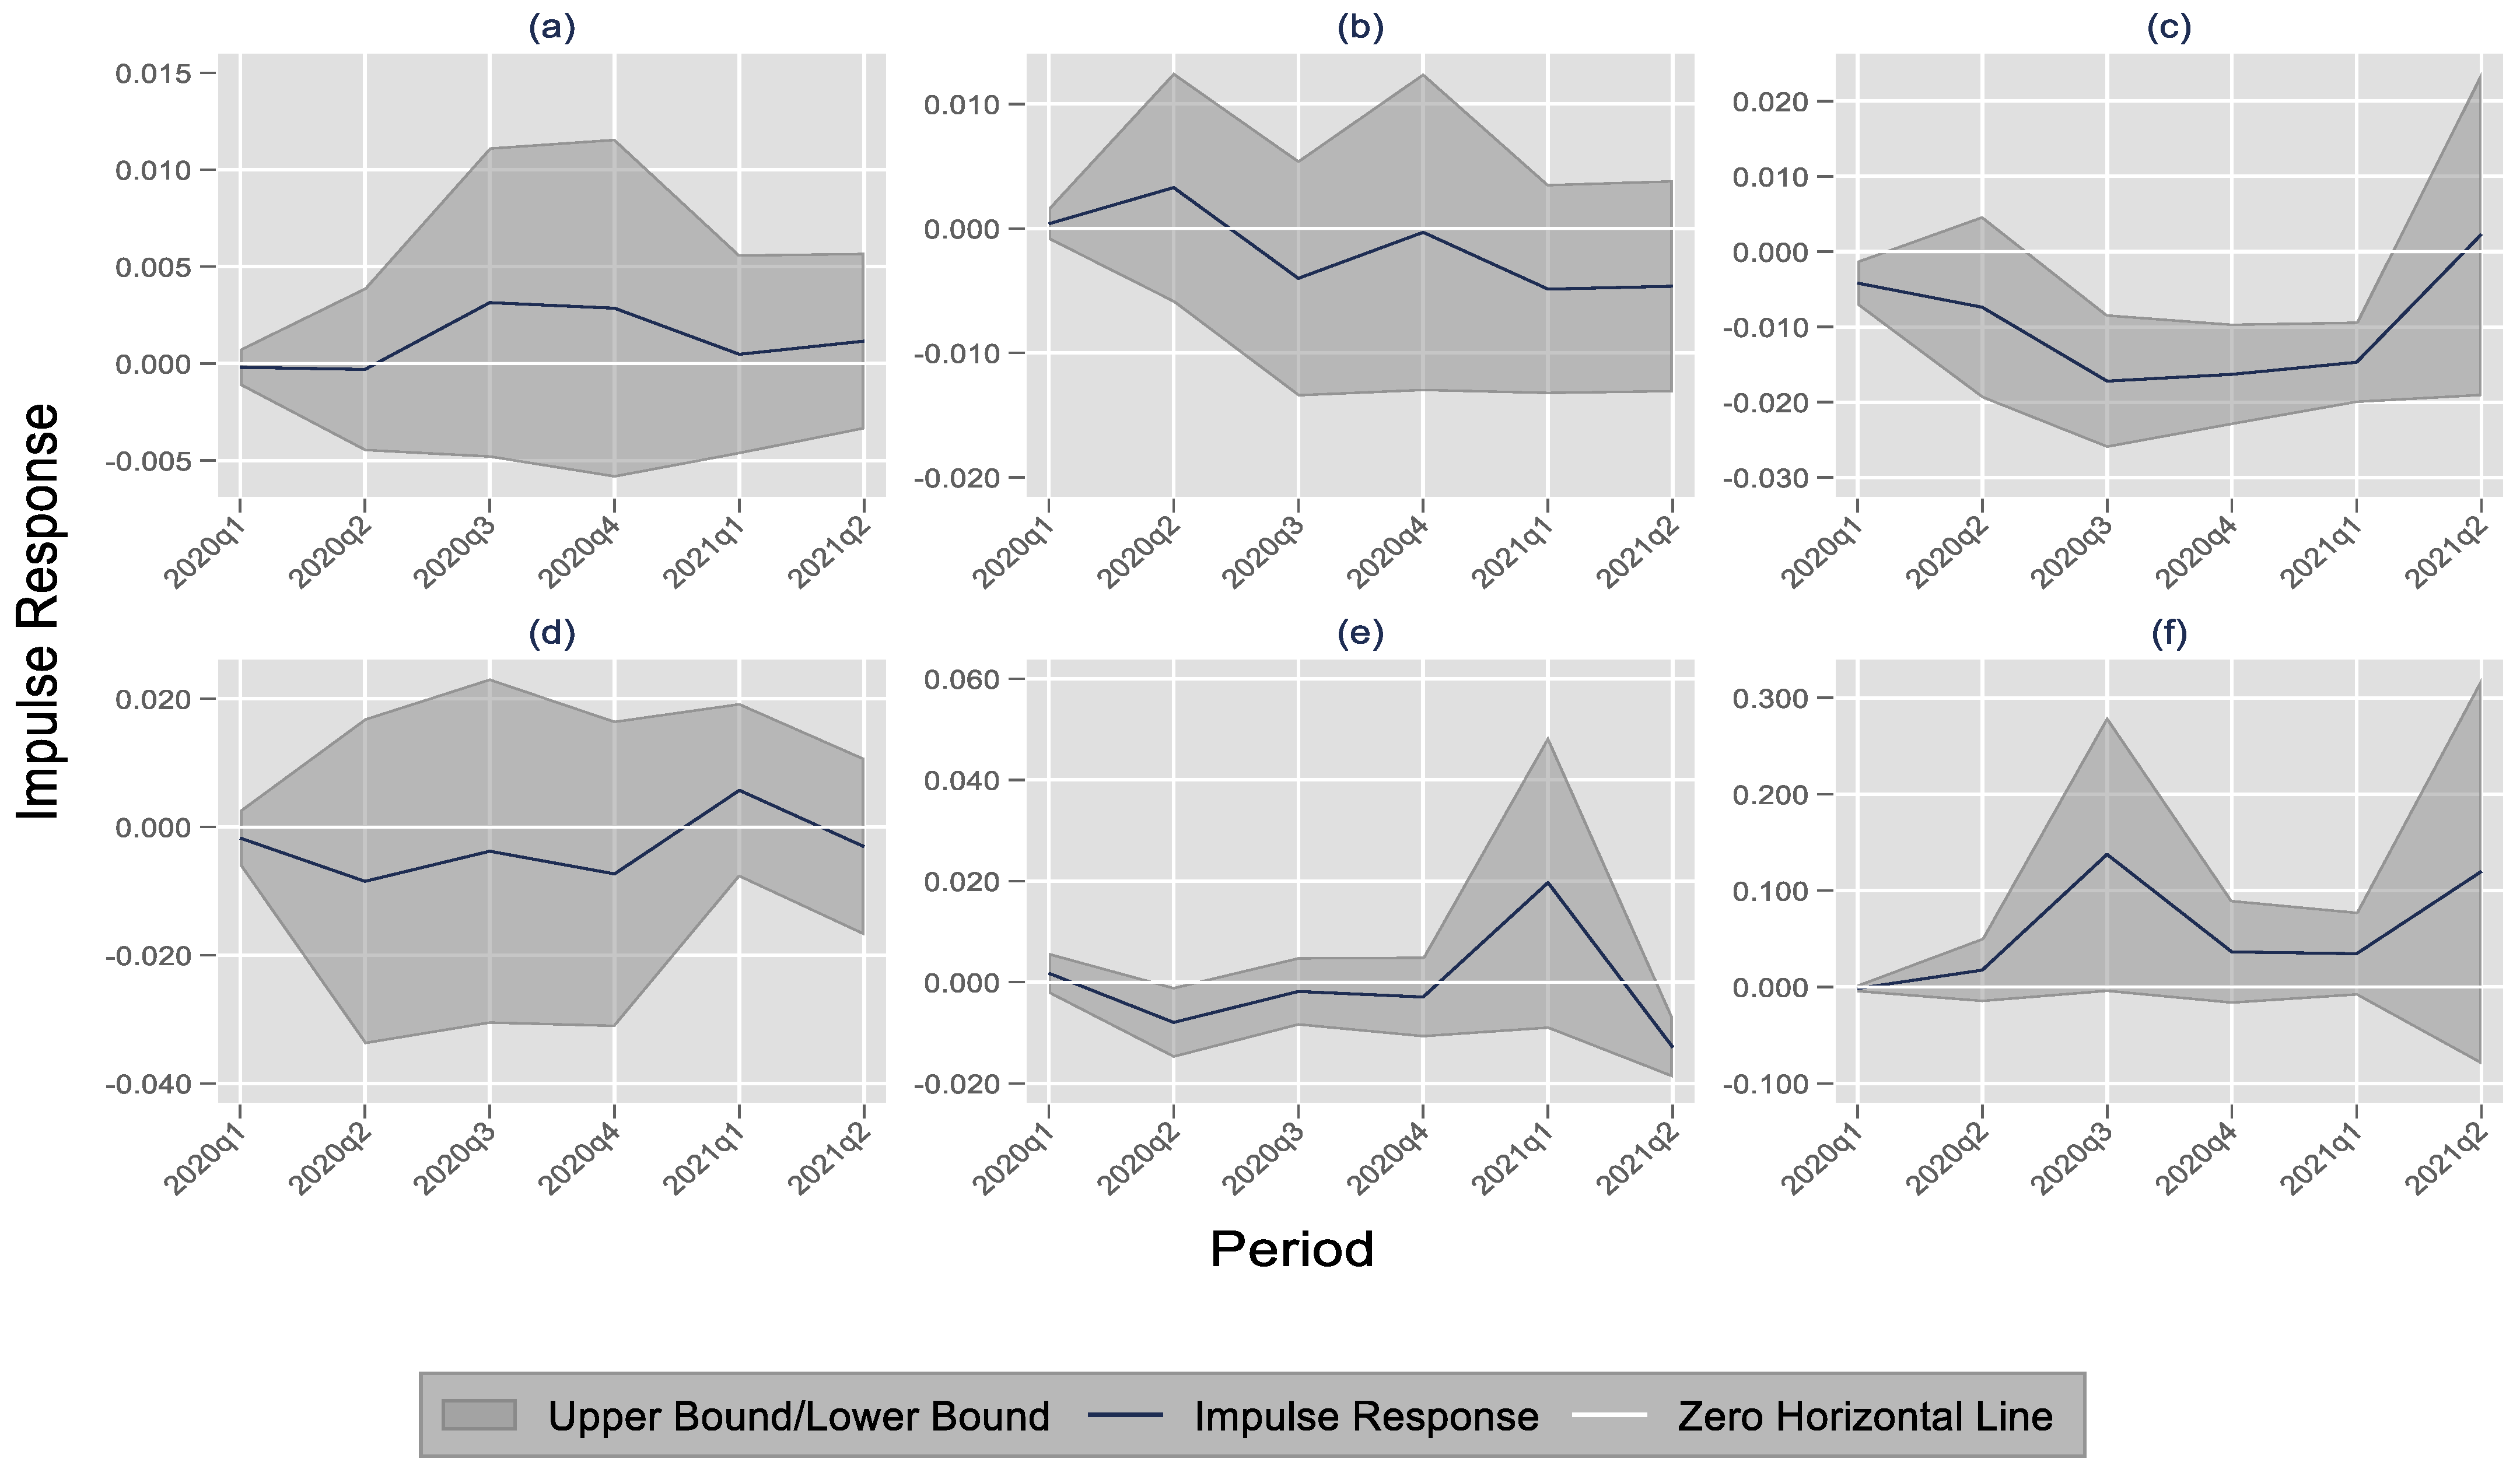
Table 7 and Figure 4 depict the impulse responses of FDI to the COVID-19 pandemic in Indonesian regions, such as Java, Bali and Nusa Tenggara, Sumatera, Kalimantan, Sulawesi, and East Indonesia. The COVID-19 pandemic in most regions in Indonesia did not have a significant effect on FDI, except in Kalimantan and Sulawesi. The COVID-19 pandemic had a significant effect on the FDI in quarter 1, quarter 3, and quarter 4 of 2020 and quarter 1 of 2021 in Kalimantan. FDI in Sulawesi was also impacted by the COVID-19 pandemic in quarter 2 of 2020 and quarter 2 of 2021 after the shock from the COVID-19 pandemic. The COVID-19 pandemic reduced FDI in two regions, since the regions had limited sectors of the economy. The sectors of coal and plantation also contribute significantly to the economies of Sulawesi and Kalimantan. Since the price of commodities fell deeply in the pandemic period, investment might have also fallen in those two regions. This also supports the finding of this research that suggests that the FDI in the mining sector was negatively impacted in all quarters by the shock of the COVID-19 pandemic. Although the COVID-19 pandemic did not significantly affect the FDI in most regions, the effect of the COVID-19 pandemic on the FDI could vary between regions. For example, the COVID-19 pandemic impacted the FDI positively in most of the quarters after a shock from the COVID-19 pandemic in Java and East Indonesia. Other regions, including Sumatera, Bali and Nusa Tenggara, Sulawesi, and Kalimantan, saw a negative impact on FDI in most of the quarters as a result of the COVID-19 pandemic. The insignificant effect of the COVID-19 pandemic on FDI in most regions might be caused by incentives given by the government to the economic sectors in the regions during the pandemic. The establishment of the regulation of Law No. 11 in the year 2020 might accelerate more capital inflow, including FDI, even during the COVID-19 pandemic, especially for the priority sectors, such as the manufacturing sector, which is heavily established in Java island. As a result, the COVID-19 pandemic had little impact on FDI in most regions.
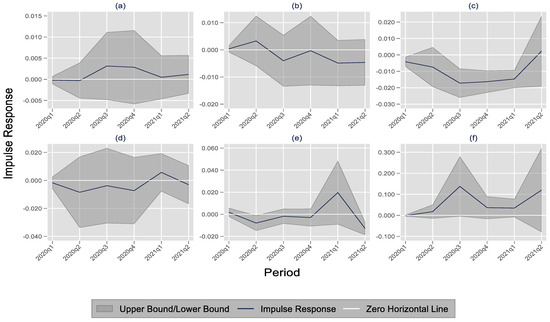
Figure 4.
Impulse responses of FDI to COVID-19 pandemic in Indonesian regions. Notes: (a) = Java. (b) = Sumatera. (c) = Kalimantan. (d) = Bali and Nusa Tenggara. (e) = Sulawesi. (f) = East Indonesia.
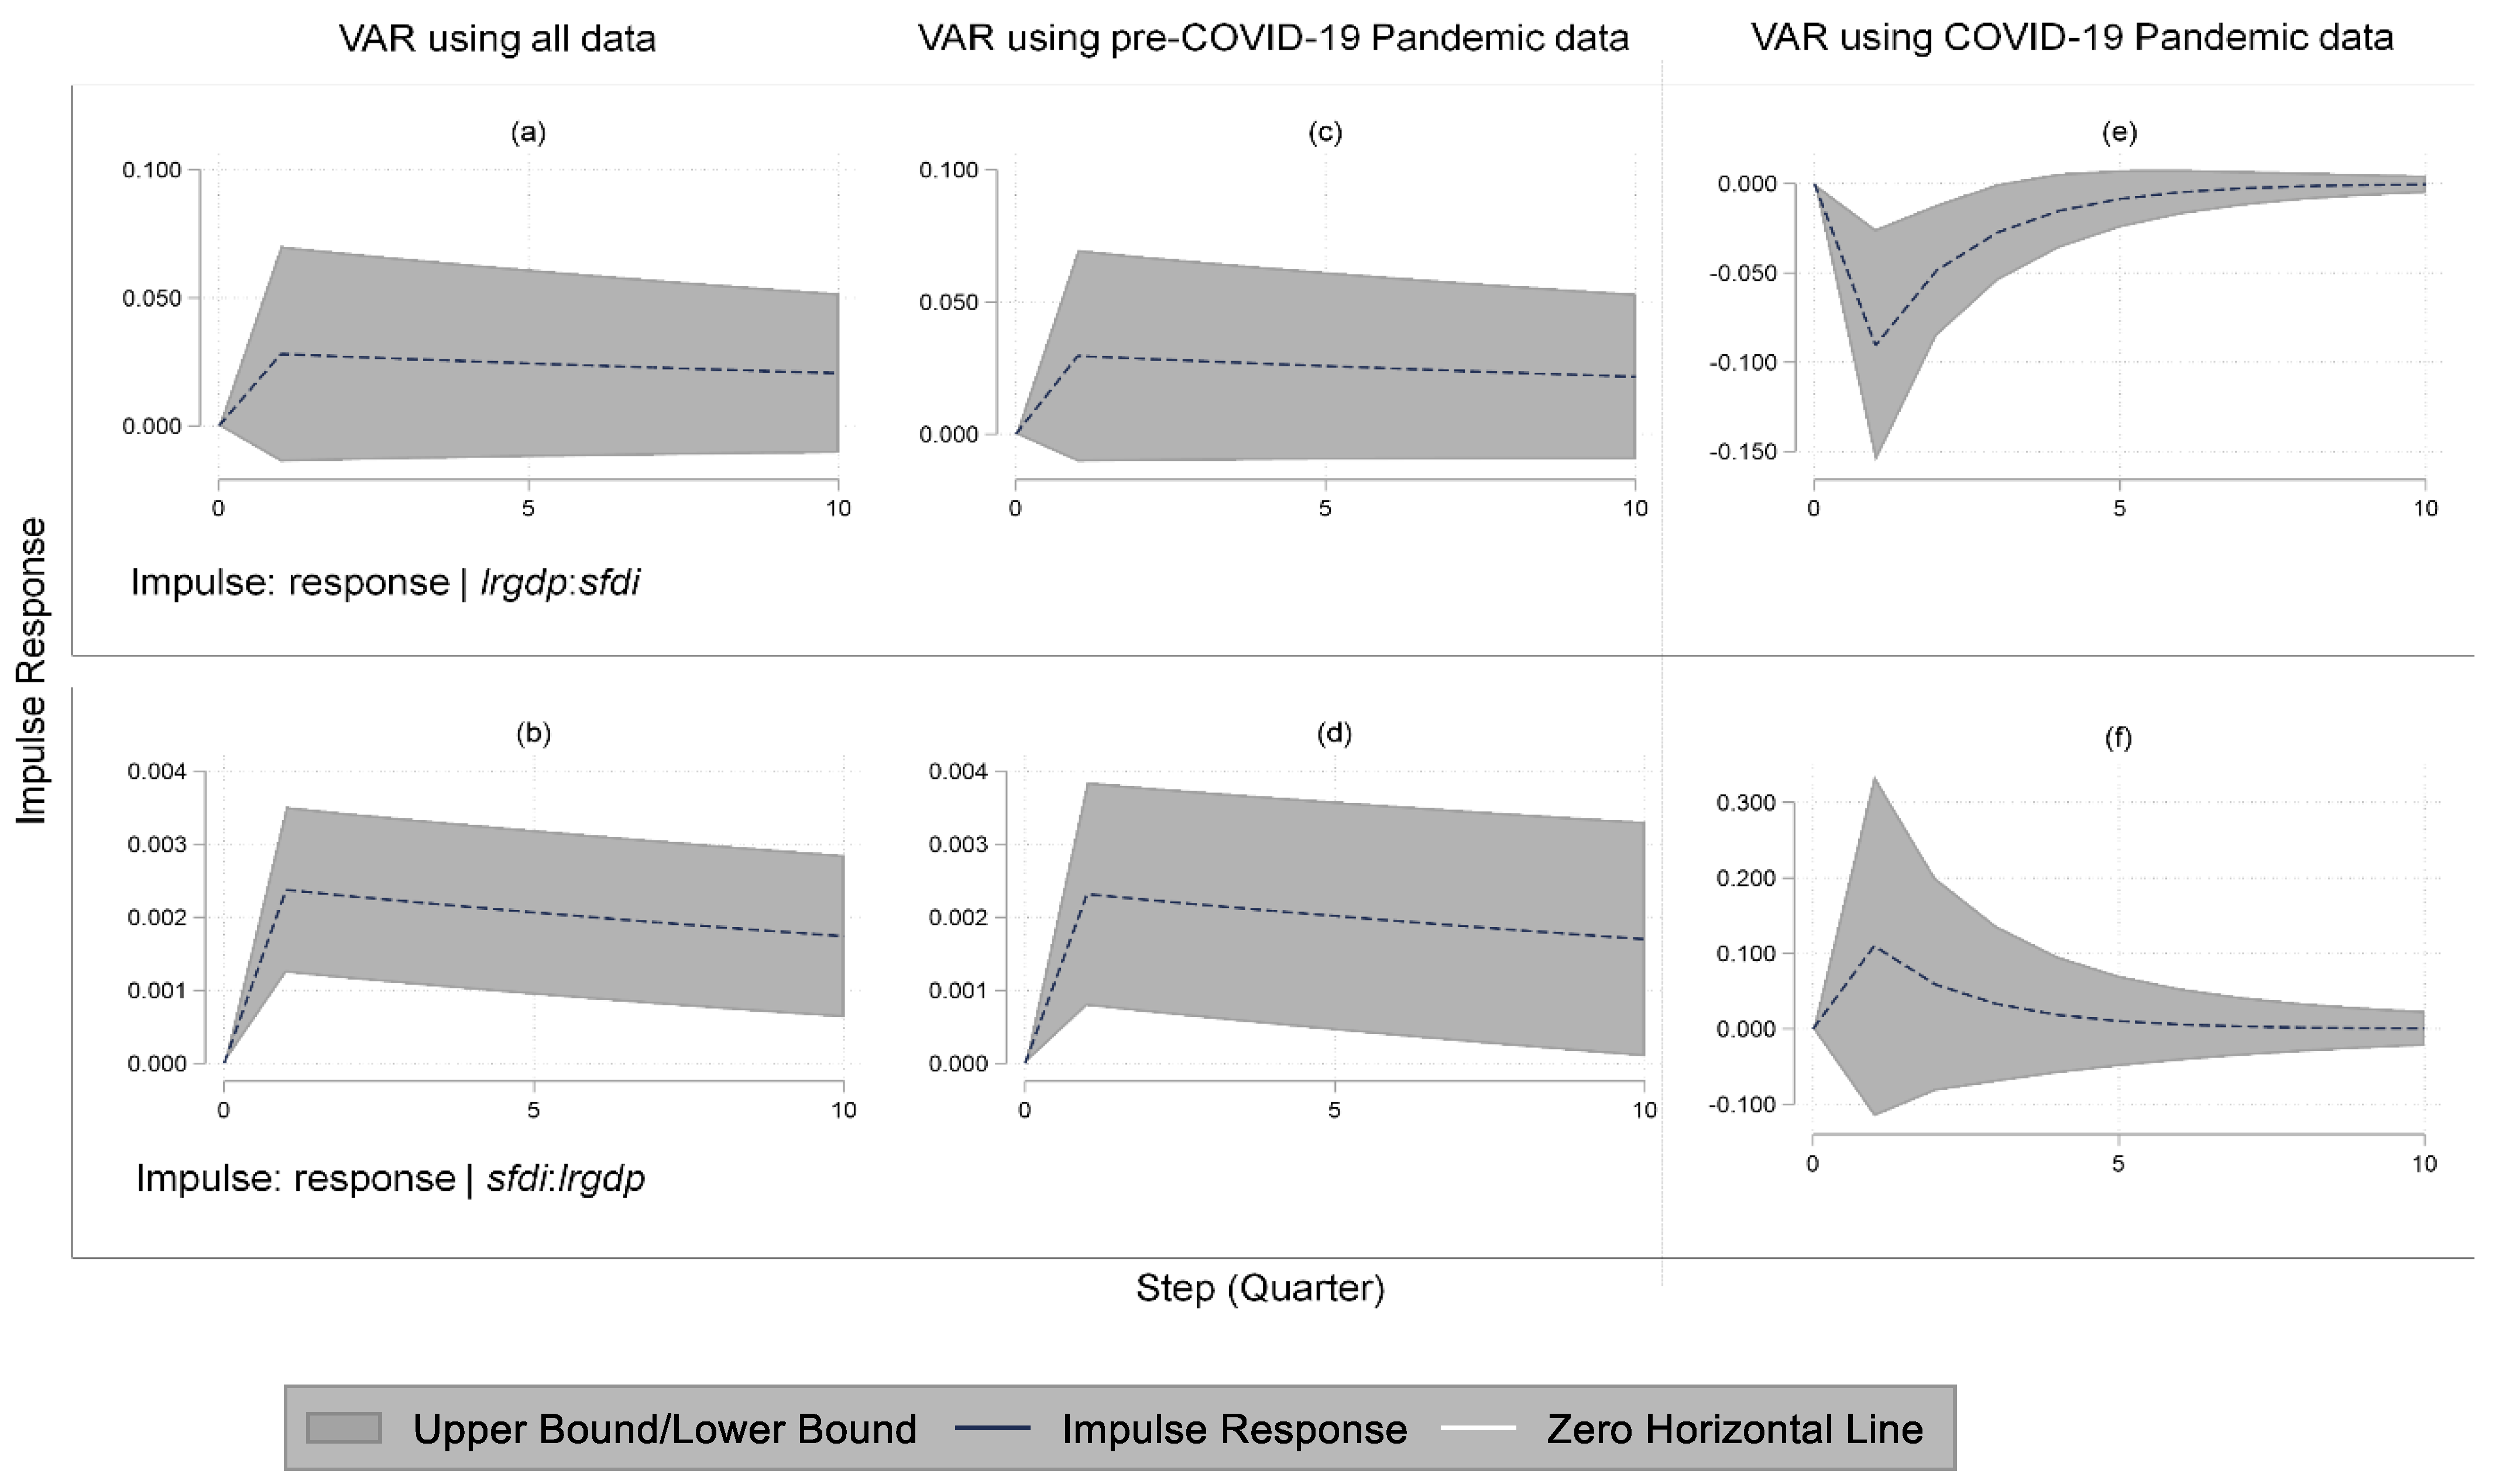
Figure 5 shows the impulse responses of the relationship between FDI and GDP using the groups of periods, which include all periods, the COVID-19 pandemic period, and the period preceding the COVID-19 pandemic era. As shown in Table 8, the impulse response function was estimated based on the panel vector autoregression. All models’ panel vector autoregression (PVAR) were estimated using a one-year lag based on the least coefficient of the modified Akaike information criterion. The Hansen J-test did not reject the orthogonality conditions at the 10% critical level for the GDP and FDI models. Moreover, all variables in Equations (1) and (2) were stationary at the level of the 1% critical level based on the Fisher-type test of ADF. These results indicate that modeling the dependence structure between the variables in PVAR was valid using the variables at the level form. The results of the panel VAR were stable since the modulus of all roots was less than 1.

Figure 5.
Impulse responses function of GDP and FDI. Notes: (a) and (b) = Impulse response using all data; (c) and (d) = impulse response using pre-COVID-19 pandemic data; (e) and (f) = impulse response using COVID-19 Pandemic Data.
Table 8.
Dynamic relationship between GDP and FDI using PVAR.
From Table 8, it is seen that FDI had a significant effect on the GDP in all periods and the pre-COVID-19 pandemic at a 1% critical level, respectively. FDI did not significantly affect the GDP during the COVID-19 pandemic at the 10% critical level. Moreover, GDP had no significant effect on FDI in all periods and the pre-COVID-19 pandemic at a 10% critical level, respectively. The GDP had a significant effect on the FDI at a 1% critical level during the COVID-19 pandemic. In the groups of all periods and the pre-COVID-19 pandemic period, a unidirectional causality from FDI to GDP was also found, supporting the findings of Abbes et al. [14], Owusu-Nantwi and Erickson [16], and Sengupta and Puri [15].
Figure 5 shows the impulse responses function on the relationship between GDP and FDI using the PVAR estimation in Table 8. The PVAR can project the forecast horizon up to 10 periods, since PVAR applies a different model compared to LPE. The PVAR did not include the dummy of the COVID-19 pandemic. From Figure 5, it is shown that the shock of GDP affected foreign direct investment significantly only during the COVID-19 pandemic (right graph of Figure 5). During the COVID-19 pandemic, GDP had a significant negative impact on FDI until four quarters. This indicates that the COVID-19 pandemic might create a signal of crisis for the economy, causing the GDP’s impotence in attracting FDI. Furthermore, FDI had a significant positive impact on the GDP before the COVID-19 pandemic and all other periods. During the COVID-19 pandemic, the positive shock from the FDI did not impact the GDP significantly. Besides a signal of crisis, this also might indicate that there was still high uncertainty during the COVID-19 pandemic, reducing the impact of the FDI in the short- and long-term. The COVID-19 pandemic may restrict people’s mobility, which impacts the economy as a whole (see [4,20]).
According to the findings, the Indonesian average GDP fell in all economic sectors during the COVID-19 pandemic. Except for the manufacturing sector, average FDI fell during the pandemic for all economic sectors. Furthermore, the COVID-19 pandemic hampered FDI and weakened its favorable impact on economic growth, according to this study. In addition, the impact of the COVID-19 pandemic on FDI was not uniform across all economic sectors. During the COVID-19 pandemic, for example, whereas other subsectors in the manufacturing sector had negative FDI shocks in some or all of the quarters, two subsectors in the manufacturing sector did not. The subsector of metal, machinery, electronic, and equipment, and subsector of other industries, were among the two subsectors. Before and throughout the pandemic, both subsectors performed well in terms of export. As a result, FDI in those subsectors was nevertheless tempted by the performance. With the manufacturing sector’s strong FDI performance in response to the pandemic, the Indonesian government should restructure its economic growth plans to emphasize industrialization. The manufacturing sector contributed significantly to the labor absorption (see [30,31]). Also, the manufacturing sector contributes the most to the Indonesian economy (approximately 20% of GDP). In spite of this, its contribution has decreased in the last five years. Indonesia’s industrialization agenda is intended to result in more sustainable economic development and an increased pandemic resilience. In terms of other sectors, the policymaker might design a policy that helps other sectors achieve the same performance characteristics as the manufacturing sector; for example, by allowing more access to the worldwide market to obtain sufficient inputs and export products. More thoroughly introducing the international market to other sectors will result in additional sustainable growth for those sectors and may attract more FDI.
In terms of the various effects of the COVID-19 pandemic on FDI at the sectoral level, the findings of this study advise that policymakers keep an eye on the sectors that were badly affected by the pandemic. Investor incentives should be structured to boost FDI in the most affected sectors. The National Recovery Program for the COVID-19 pandemic, as well as Law No. 11 Year 2020, should be maximized in their implementation. The Law No. 11 Year 2020’s principal goals are to attract investment, expedite economic transformation, unify central-regional policies, improve the ease of carrying out business, resolve overlapping regulatory issues, and eradicate sectoral egos. As a result, even during the pandemic, the law may attract additional FDI to Indonesia. Furthermore, the National Economic Recovery Program strives to resurrect the economy on both demand (consumer) and supply (producer) sides. The Indonesian government budgeted IDR 1439.9 trillion to help the economy rebound between 2020 and 2021 [32]. The money was distributed to maintain people’s consumption, as well as to assist corporations, particularly micro, small, and medium-sized enterprises, in continuing to operate. Credit and tax incentives were among the benefits provided to the company. As a result, this might send a favorable signal to investors about the Indonesian economy’s ability to weather the pandemic. Due to the fact that Law No. 11 Year 2020 and the National Economic Recovery Program may have the ability to limit the negative impact of the COVID-19 pandemic on FDI, this study recommends that policymakers implement them aggressively, particularly in the impacted sectors. This will help the impacted sectors to expand more quickly and will send a more favorable signal to investors.
Furthermore, the COVID-19 pandemic, which caused havoc on FDI in Kalimantan and Sulawesi, may signal to the government that those areas’ investment climate and pandemic resilience need to be enhanced. Providing fiscal incentives and infrastructure development outside of Java island could help to improve the investment climate and the pandemic resilience. Increasing local and foreign investment in particular locations may help to ensure the economy’s long-term viability. To encourage more investors to invest outside of Java Island, Law 11 No. 2020 and other fiscal incentives should be heavily pushed and executed. As a result, investors will be enticed to invest in those regions, making the investment more effective in supporting the regions’ economic growth.
6. Conclusions
This research investigates the impact of the COVID-19 pandemic on foreign direct investment in the Indonesian economy at the sectoral and regional levels. The influence of the COVID-19 pandemic on the relationship between foreign direct investment (FDI) and the gross domestic product (GDP) is also examined.
This research finds that the impact of the COVID-19 pandemic on FDI varies between economic sectors in Indonesia. The impact of the COVID-19 pandemic on FDI is also different between quarters in the economic sectors. The shock of the COVID-19 pandemic has considerably reduced FDI in a few manufacturing subsectors. Moreover, the shock of the COVID-19 pandemic lowers FDI in most subsectors in the primary sector, as well as the utility and service sector. Furthermore, the COVID-19 pandemic has a significant impact on FDI only in Kalimantan and Sulawesi regions.
Furthermore, the COVID-19 pandemic affects the relationship between FDI and GDP. The COVID-19 pandemic may cause FDI to be impotent in affecting the GDP. Moreover, the signaling of the possibility of economic crises caused by the COVID-19 pandemic masks the effect of the GDP on FDI.
In addition, this research also proposes policy implications based on the empirical results. Overall, policymakers should devise a strategy that will help to sustain the Indonesian economy in the long-term while also sending a positive signal to investors.
Author Contributions
Writing the draft of paper, F.S and M.S..; literature review and conceptual framework, M.S.; data cleaning and analysis, M.S.; resources and reading, M.S.; supervision and editing, F.S.; project administration, F.S. All authors have read and agreed to the published version of the manuscript.
Funding
This research received funding from BI Institute. This research was also supported by PDUPT-Dikti 2022.
Institutional Review Board Statement
Ethical review and approval were waived for this study, due to “Not applicable” for studies not involving humans or animals.
Informed Consent Statement
Not applicable for studies not involving humans.
Data Availability Statement
Not applicable.
Acknowledgments
The authors extend their appreciation to Militcyano Samuel Sapulette for his assistance with data analysis in this paper. Also, thank you to all of the reviewers for the thoughtful comments.
Conflicts of Interest
The authors declare no conflict of interest.
References
- OECD. OECD Investment Policy Reviews: Indonesia 2020; OECD: Paris, France, 2020. [Google Scholar] [CrossRef]
- Badan Pusat Statistik. Neraca Arus Dana Indonesia Triwulanan 2017—2020; Badan Pusat Statistik: Central Jakarta, Indonesia, 2021.
- OECD. Foreign Direct Investment Flows in the Time of COVID-19, Tackling CoronaVirus (COVID-19): Contributing to a Global Effort Report; OECD: Paris, France, 2020. [Google Scholar]
- Camino-Mogro, S.; Armijos, M. The Effects of COVID-19 Lock down on Foreign Direct Investment: Evidence from Ecuadorian Firms. MPRA Pap. No. 104821;. 2020. Available online: https://mpra.ub.uni-muenchen.de/104821/1/MPRA_paper_104821.pdf (accessed on 15 January 2022).
- Chaudhary, M.K.; Ghimire, R.P.; Ghimire, D.M. Impact of COVID-19 Pandemic on the Foreign Direct Investment in Nepal From South Asian Perspectives. J. Dev. Econ. 2020, 5, 137–146. [Google Scholar]
- Ho, L.T.; Gan, C. Foreign Direct Investment and World Pandemic Uncertainty Index: Do Health Pandemic Matters. J. Risk Financ. Manag. 2021, 14, 107. [Google Scholar] [CrossRef]
- Loayza, N.V.; Pennings, S. Macroeconomic Policy in the Time of COVID-19: A Primer for Developing Countries; World Bank: Washington, DC, USA, 2020. [Google Scholar]
- Ozili, P.K.; Arun, T. Spillover of COVID-19: Impact on the Global Economy. SSRN Electron. J. 2020. [Google Scholar] [CrossRef] [Green Version]
- Badan Pusat Statistik. Social and Demography; Badan Pusat Statistik: Central Jakarta, Indonesia, 2021. Available online: https://www.bps.go.id/indicator/12/1975/1/jumlah-penduduk-pertengahan-tahun.html (accessed on 13 January 2022).
- Dana, L.P. Asian Models of Entrepreneurship: From the Indian Union and Nepal to the Japanese Archipelago: Context, Policy and Practice, 2nd ed.; World Scientific: Singapore, 2014. [Google Scholar]
- Effendi, N.; Setiawan, M.; Indiastuti, R. Technical efficiencies of Indonesian regional and non-regional banks pre- and post-financial crisis. Int. J. Econ. Bus. Res. 2018, 16, 355–366. [Google Scholar] [CrossRef]
- Setiawan, M.; Indiastuti, R.; Destevanie, P. Information Technology and Competitiveness of Small and Medium Enterprises in Cimahi. Int. J. Entrep. Small Bus. 2015, 25, 475–493. [Google Scholar]
- Setiawan, M. Technical Efficiency and Decision to Exit: Evidence from the Dariry Farms in Sukabumi. World Rev. Entrep. Manag. Sustain. Dev. 2019, 15, 428–440. [Google Scholar]
- Abbes, S.M.; Mostéfa, B.; Seghir, G.; Zakarya, G.Y. Causal Interactions between FDI, and Economic Growth: Evidence from Dynamic Panel Co-integration. Procedia Econ. Financ. 2015, 23, 276–290. [Google Scholar] [CrossRef] [Green Version]
- Sengupta, P.; Puri, R. Exploration of Relationship between FDI and GDP: A Comparison between India and Its Neighbouring Countries. Glob. Bus. Rev. 2018, 21, 473–489. [Google Scholar] [CrossRef]
- Owusu-Nantwi, V.; Erickson, C. Foreign direct investment and economic growth in South America. J. Econ. Stud. 2019, 46, 383–398. [Google Scholar] [CrossRef]
- Khaliq, A.; Noy, I. Foreign Direct Investment and Economic Growth: Empirical Evidence from Sectoral Data in Indonesia Foreign Direct Investment and Economic Growth: Empirical Evidence from Sectoral Data in Indonesia Department of Economics University of Hawai i at Manoa. J. Econ. Lit. 2007, 45, 313–325. [Google Scholar]
- IMF. The Global Economic and Financial Impact of An Avian Flu Pandemic and the Role of the IMF; IMF: Washington, DC, USA, 2006. [Google Scholar]
- Barro, R.J.; Ursua, J.F.; Weng, J. The Coronavirus and The Great Influenza Pandemic: Lessons from the “Spanish Flu” for the Coronavirus’s Potential Effects on Mortality and Economic Activity, NBER Working Paper Series No. 26866, Cambridge, USA. 2020. Available online: https://www.nber.org/system/files/working_papers/w26866/w26866.pdf (accessed on 13 January 2022).
- IMF. World Economic Outlook: Recovery During a Pandemic; IMF: Washington, DC, USA, 2021. [Google Scholar]
- Barro, R.J.; Ursúa, J.F. Macroeconomic Crises since 1870. Brook. Pap. Econ. Act. 2008, 39, 255–350. [Google Scholar] [CrossRef] [Green Version]
- Teulings, C.N.; Zubanov, N. Is Economic Recovery a Myth? Robust Estimation of Impulse Responses. J. Appl. Econom. 2014, 29, 497–514. [Google Scholar]
- Setiawan, M.; Emvalomatis, G.; Oude Lansink, A. The Relationship Between Technical Efficiency and Industrial Concentration: Evidence from the Indonesian Food and Beverages Industry. J. Asian Econ. 2012, 23, 466–475. [Google Scholar] [CrossRef]
- Andrews, D.; Lu, B. Consistent model and moment selection procedures for GMM estimation with application to dynamic panel data models. J. Econom. 2001, 101, 123–164. [Google Scholar] [CrossRef]
- Maddala, G.S.; Wu, S. A comparative study of unit root tests with panel data and a new simple test. Oxf. Bull. Econ. Stat. 1999, 61, 631–652. [Google Scholar] [CrossRef]
- Pedroni, P. Critical Values for Cointegration Tests in Heterogenous Panels With Multiple Regressors. Oxf. Bull. Econ. Stat. 1999, 61, 653–670. [Google Scholar] [CrossRef]
- Kao, C. Spurious Regression and Residual_Based Tests for Cointegration in Panel Data. J. Econom. 1999, 90, 1–44. [Google Scholar] [CrossRef]
- Shin, Y.; Pesaran, M.H.; Smith, R.P. Pooled Mean Group Estimation of Dynamic Heterogeneous Panels. J. Am. Stat. Assoc. 1999, 94, 621–634. [Google Scholar]
- Wang, M. Manufacturing FDI and economic growth: Evidence from Asian economies. Appl. Econ. 2009, 41, 991–1002. [Google Scholar] [CrossRef]
- Setiawan, M.; Effendi, N. Survey of Industrial Concentration and Price-cost Margin of the Indonesian Manufacturing Industry. Int. Econ. J. 2016, 30, 123–146. [Google Scholar] [CrossRef]
- Setiawan, M. Persistence of Price-Cost Margin and Technical Efficiency in the Indonesian Food and Beverages Industry. Int. J. Econ. Bus. 2019, 26, 315–326. [Google Scholar] [CrossRef]
- Kementerian Koordinator Bidang Perekonomian RI. Optimalisasi Pemanfaatan Anggaran Program PEN Untuk Mendorong Akselerasi Pemulihan Ekonomi Nasional. Press Released HM.4.6/358/SET.M.EKON.3/10/2021. 2021. Available online: https://www.ekon.go.id/publikasi/detail/3400/optimalisasi-pemanfaatan-anggaran-program-pen-untuk-mendorong-akselerasi-pemulihan-ekonomi-nasional (accessed on 23 January 2022).
Publisher’s Note: MDPI stays neutral with regard to jurisdictional claims in published maps and institutional affiliations. |
© 2022 by the authors. Licensee MDPI, Basel, Switzerland. This article is an open access article distributed under the terms and conditions of the Creative Commons Attribution (CC BY) license (https://creativecommons.org/licenses/by/4.0/).