Article

Relationship between the Degree of Internationalization and Greenwashing of Environmental Responsibilities in China-Based on the Legitimacy Perspective

1
Business School, Nanjing Normal University, Nanjing 210046, China
2
School of Engineering, University of Leicester, Leicester LE17RH, UK
*
Authors to whom correspondence should be addressed.
Sustainability 2022, 14(5), 2794; https://doi.org/10.3390/su14052794
Submission received: 20 January 2022 / Revised: 17 February 2022 / Accepted: 24 February 2022 / Published: 27 February 2022

Abstract

:
Based on the legitimacy theory, A-share-listed companies in the Shanghai and Shenzhen Stock Exchanges from 2007 to 2018 are taken as the research sample. This paper explores the internal mechanism of how internationalization degree affects the greenwashing behavior of Chinese multinational enterprises, and tests the moderating mechanism of legitimacy pressures from the home country. The findings are as follows: First, under the background of internationalization, enterprises are more inclined to greenwash, and this tendency is more obvious with the increase in internationalization degree. Second, in the full sample analysis, the moderating effects of environmental regulation, public pressure, and industry pressure are not statistically significant. Third, the moderating effect of legitimacy pressures varies due to the heterogeneity of regions and property rights of the enterprises. The statistical significance of the moderating effect is affected by the diversity of environmental regulation measures, but it can be roughly concluded that the eastern and western regions show a negative moderating effect, and the central region shows a positive moderating effect. The current moderating effect of public pressure is much stronger than the lagging moderating effect, and it shows obvious regional and property rights differences. The moderating effect of industry pressure also shows obvious regional and property rights differences.

1. Introduction

With the increasing impact of Chinese multinational corporations (CMCs) on global economic and social development, stakeholders continue to pay attention to the social and environmental responsibilities of CMCs. To satisfy the legitimacy requirements of domestic regulators, the greenwashing phenomenon of social responsibility and environmental responsibility of multinational corporations occurs [1]. Greenwashing is considered to be a kind of pseudosocial responsibility [2]. Enterprises make use of the advantage of information asymmetry to release beneficial information to the outside and hide harmful environmental information to gain the favor of stakeholders [3].
Although previous works have paid attention to issues relevant to greenwashing, few empirical studies have researched CMCs’ greenwashing behavior from the perspective of China institutional environment, which seems to limit attention in the broader international business literature. This is a research gap worth addressing. If we want to understand the legitimacy and greenwashing of MNCs in the context of globalization, we need to understand whether the degree to which MNCs’ activities are internationalized leads to more complex disclosures of environmental responsibility, since greenwashing is essentially a selective environmental information disclosure act [4]. In this paper, we aim to shed light on these questions by investigating the relationship between firm internationalization degree and greenwashing. The two specific questions are as follows:
  • How will internationalization degree affect the greenwashing of CMCs?
  • What are the effects of different isomorphic pressures or legitimacy pressures of the home country institutions on the greenwashing behavior of MNCs in the process of internationalization?
The relationship between these variables can theoretically be demonstrated. When companies from home countries with relatively strict standards and high public pressure undertake environmentally sustainable internationalization, they may “escape” the public eye, stop or reduce environmental responsibility disclosures, and do more greenwashing. This paper argues that the relationship between internationalization degree and greenwashing is essentially a balancing act under the pressure of different isomorphic institutions. We hold the opinion that home country institutional pressures have made the relationship between internationalization degree and greenwashing stronger and more pronounced. The sheer pressure of domestic institutions can make it more difficult to escape the public eye. In this case, the likelihood of legitimacy overflow increases.
Compared with the existing research, the contributions of this paper are as follows: First, the environmental performance of CMCs is studied from the perspective of greenwashing, which enriches research on the environmental performance of MNCs from the emerging market. Second, starting from the driving factors of greenwashing, a framework of action mechanism that affects the greenwashing behavior of CMC is constructed. Finally, it expands and enriches the research results of legitimacy theory and environmental responsibility theory.
The next section introduces theoretical analysis and hypotheses. Section 3 outlines the methodology of this work, followed by Section 4, which includes results and supplementary analysis. Finally, the findings of the study are concluded in Section 5 along with future research directions.

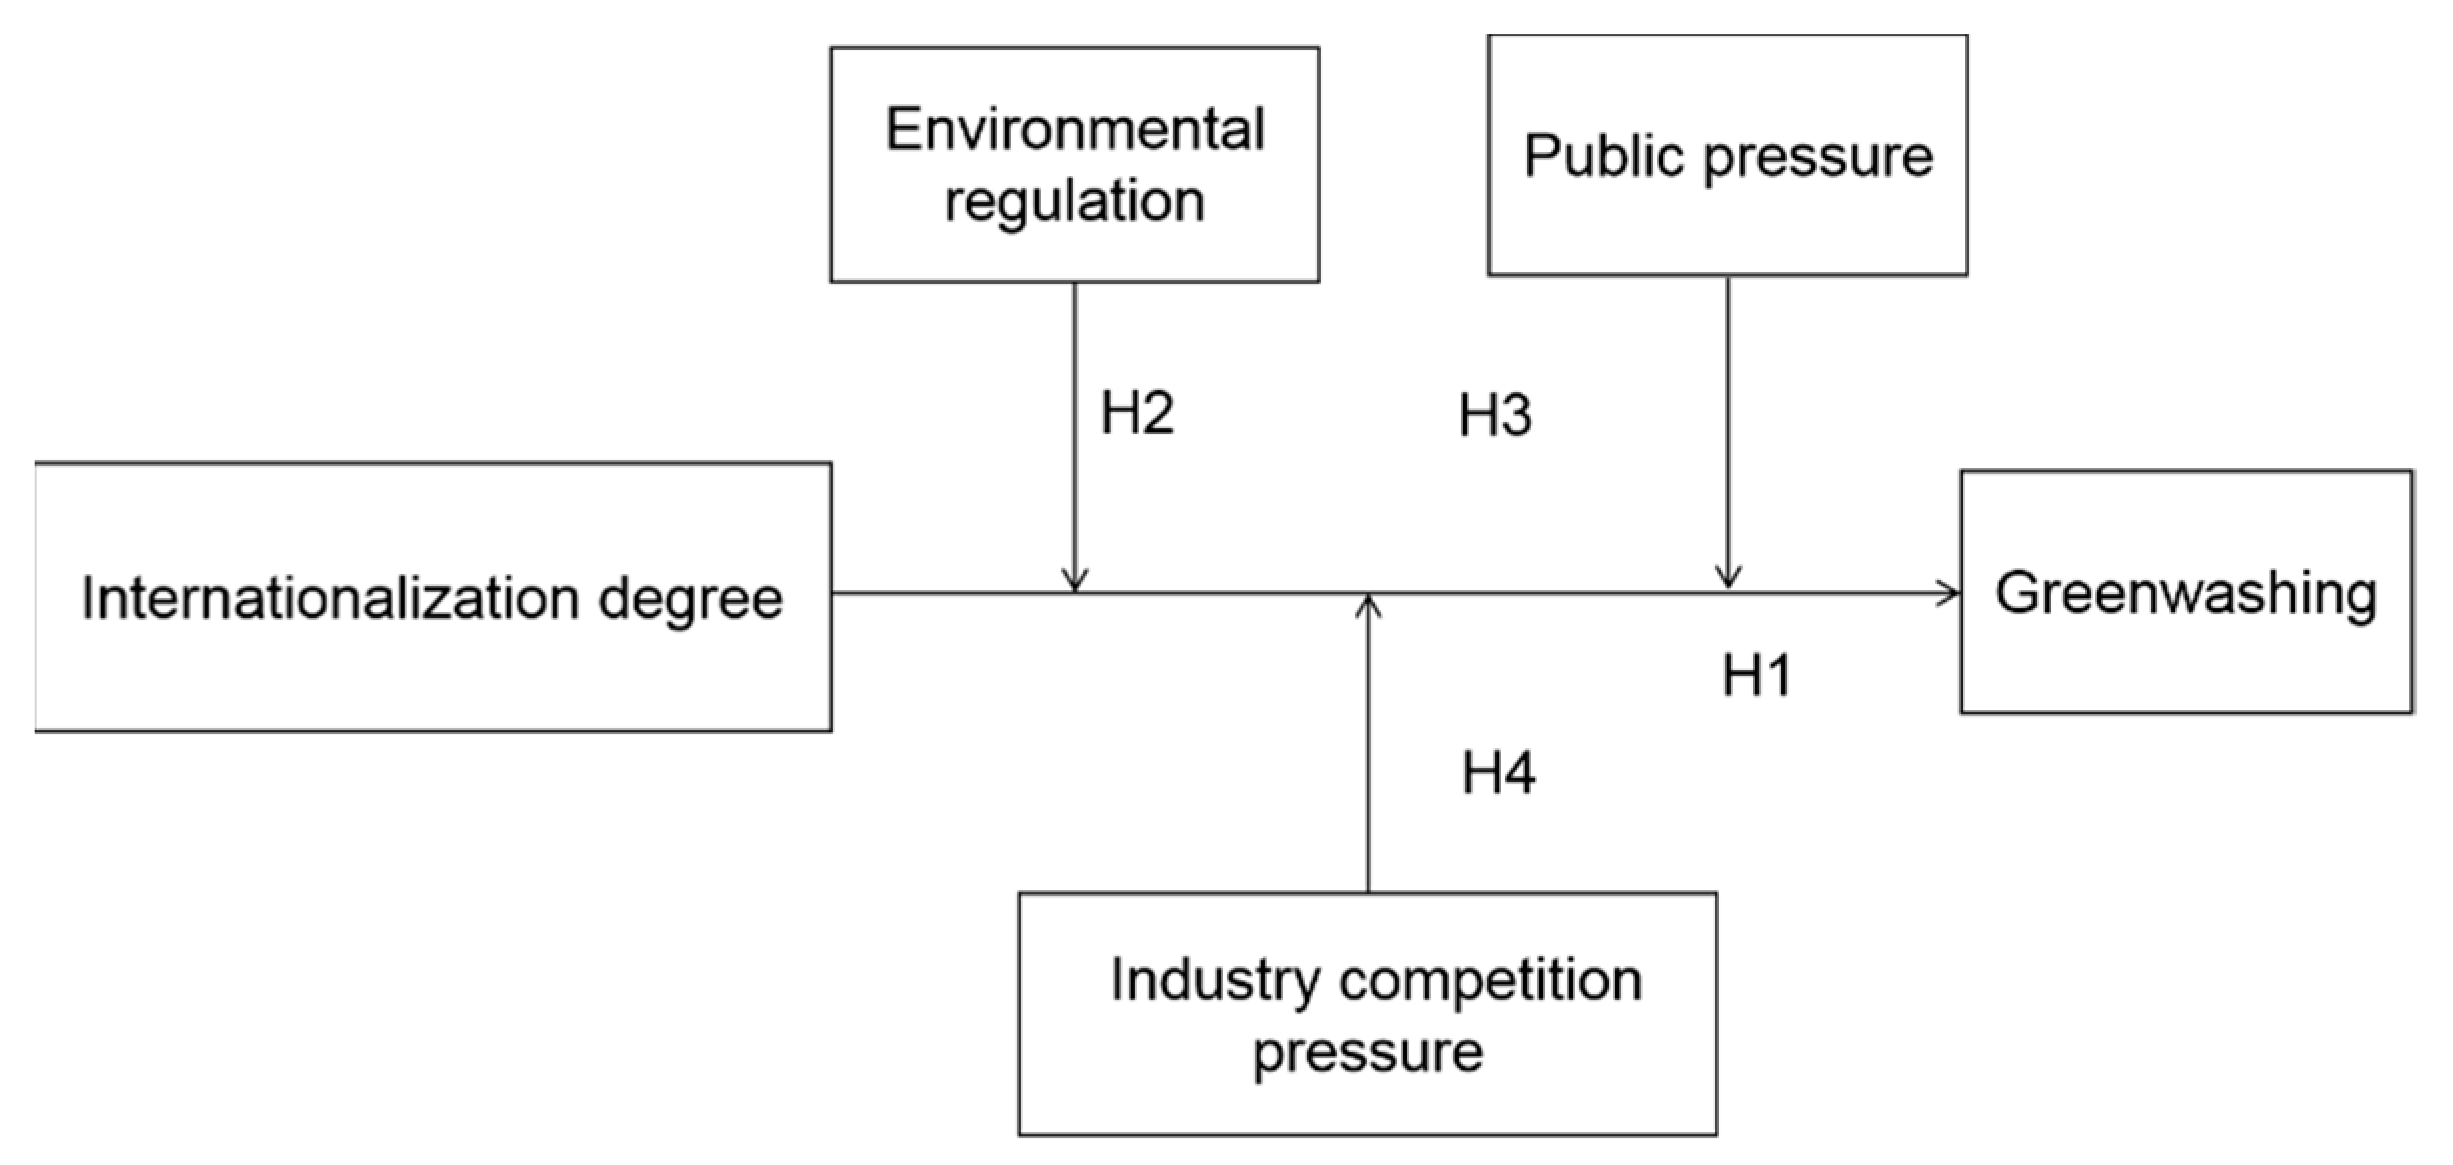
2. Theoretical Analysis and Hypotheses

This section mainly discusses the proposed hypotheses: the first one is the relationship between degree of internationalization and corporate greenwashing, and the remaining ones are the moderating effects of legitimacy pressures, including environmental regulation, public pressure, and industry competition pressure.
According to institutional theory, what can bring legitimacy to organizations is an institutional environment and institutional isomorphism. This institutional environment is called organizational field [5], which is an identifiable institutional field composed of key suppliers, resource and product consumers, regulatory agencies, and other organizations producing similar products and services. They identify institutional isomorphism in an organizational field as three mechanisms: The first mechanism is coercive isomorphism, which mainly comes from governmental control, laws and regulations, and social and cultural expectations in organizational operation and other formal pressures. The second mechanism is mimetic isomorphism, which mainly occurs in response to uncertainty, or a vague organizational strategy and a lack of technology. In this case, enterprises are likely to imitate the practices of peers, especially the leaders in the industry. The third mechanism, normative isomorphism, is generated by occupational norms and professional networks, such as the NGOs and news media, which has a strong binding effect on corporate behavior. These three forces will exert isomorphic effects on enterprises in the organizational field, making enterprises obtain legitimacy through isomorphic behaviors. This paper will focus on the role of three isomorphic forces in the greenwashing behavior of multinational corporations. Environmental regulation, public pressure, and industry competition pressure correspond to coercive isomorphism, normative isomorphism, and mimetic isomorphism, respectively.

2.1. Degree of Internationalization and Corporate Greenwashing

Institutional theory points out that individuals or organizations wanting to have legitimacy must abide by certain legal behavior standards and social ethics, and be accepted by communities that hold common social norms and values [6]. Individuals or organizations can be recognized by their surrounding environment and groups in a certain way, and they can easily obtain positive feedback, which can bring more competitive resources and stronger competitiveness to legal organizations [7]. Legitimacy also affects other aspects of organizations, such as organizational structure, organizational performance, and organizational strategy [1]. The choice of corporate strategy is closely related to institutional theory, and the strategic management theory holds that organization and strategy are mutually promoting development. It means that companies have a positive attitude in responding to the pressure of the institutional environment. Therefore, it is inferred that the corporate performance of multinational companies is affected by legitimacy.
Greenwashing is regarded as a strategic response to the uncertainty of the external environment. The environmental responsibility strategy can absorb more perfect components of the host country’s institutional logic into the home country’s institutional logic, which lays a solid strategic foundation for enterprises to enter the overseas market. There are two reasons: First, to embed global institutions during the process of internationalization, enterprises must overcome the potential legitimacy challenges caused by the unfavorable logic of the home country institutions. Stakeholders in host countries participate in corporate management decisions in the acquisition of institutional legitimacy, question and challenge the environmental responsibility practices of multinational enterprises, and exert unknown institutional pressure. In this context, greenwashing can meet the requirements of multiple interests of stakeholders in the home country and host country, and its low cost and high degree of secrecy determine that this strategy has a strong sustainability, which is more conducive to the enterprise to obtain institutional legitimacy [8]. Second, transnational economic activities expose enterprises to the knowledge of social and environmental practices existing in host countries but lacking in domestic markets [1]. These “exchanges” bring new institutional pressures on environmental responsibility practices, prompting enterprises to find the “best way” (e.g., greenwashing) to meet the requirements of multiple institutional legitimacy. Greenwashing is a practice of environmental responsibility recognized by stakeholders in the host country in response to institutional pressure [9].
Low-cost greenwashing is the best strategy for MNCs to gain a “reputation”, win the goodwill of relevant stakeholders, reduce transaction costs, and avoid moral hazard. Greenwashing is more conducive for multinational companies to enter overseas markets and expand overseas business. Accordingly, the following hypothesis is proposed:
Hypothesis 1 (H1):
The degree of internationalization is positively correlated with the greenwashing of multinational companies.

2.2. The Influence of Domestic Pressure on International Greenwashing

This section will research the domestic pressures faced by multinational enterprises, including the impact of mandatory environmental regulations, public pressures, and industrial pressures on the relationship between internationalization degree and greenwashing. The structure is as follows: First, based on the legitimacy theory and the current research status of greenwashing in China, the problems studied in this part are proposed. Second, the influence of internationalization degree on greenwashing under different legitimacy pressures is discussed, and corresponding hypotheses are proposed. Finally, the empirical results are analyzed and discussed.
Legitimacy pressure is generally divided into regulatory pressure, normative pressure, and cognitive pressure [5]. For enterprises, regulatory pressure mainly comes from government agencies, normative pressure generally comes from customers and nongovernmental organizations, and cognitive pressure mainly comes from competitors and industry associations [10,11]. Previous studies believe that an important motivation for enterprises to adopt green behavior is to gain recognition from stakeholders [10]. Studies have shown that stakeholders can influence enterprises’ environmental behavior through various channels, including environmental regulations, environmental reports published by nongovernmental organizations, social media supervision, and resistance of customers and suppliers to nonenvironmental products [12]. Generally, green behavior becomes an important strategy for enterprises to deal with external pressure [10]. The more legitimacy recognition companies gain from stakeholders, the more likely they are to adopt green strategies [13]. Therefore, this section studies the moderating effect of regulatory pressure from formal environmental regulation, normative pressure from social media supervision, and cognitive pressure from industry competition on greenwashing from the perspective of internationalization [5].

2.2.1. Environmental Regulation and Greenwashing Behavior of Multinational Corporations

To achieve sustainable and healthy development in daily operation, enterprises must abide by the standards and regulations set by society [6]. If the enterprise is in a strong institutional atmosphere, it will legitimize and legalize its environmental performance through environmental disclosure [14]. Corporate environmental information disclosure behavior is affected by government regulations [15].
Chinese regulatory authorities have issued a series of environmental regulations and laws since 2008. In February 2008, the State Environmental Protection Administration of China issued “The Guidance on Strengthening the Supervision and Management of Environmental Protection of Listed Companies”. In May 2008, the Shanghai Stock Exchange issued “The Guidance on Environmental Information Disclosure of Listed Companies of Shanghai Stock Exchange”. In 2010, the Ministry of Environmental Protection issued “The Guidelines on Listed Companies’ Environmental Information Disclosure”, while a new landmark environmental law, “The Revised Environmental Protection Law”, came into force in 2015.
As China’s ecological and environmental constraints become tighter, enterprises adopt internationalization strategies to evade domestic environmental regulations, and attach importance to introducing foreign green and clean production technology and advanced management experience to further improve their environmental performance. Relevant studies show that internationalization strategies can bring productivity improvements and advanced technology to home countries [16,17]. Internationalization strategy would indeed bring green spillovers to China, but due to the impact of foreign investment scale and regional heterogeneity, appropriate policies are needed to guide MNCs [18].
There are two effects of environmental regulation, innovation compensation effect (Porter hypothesis) and compliance cost effect [19]. When the benefits of the innovation compensation mechanism for enterprises are greater than the environmental governance costs caused by environmental regulations, MNCs have the motivation to improve their environmental performance and reduce greenwashing when facing the strong institutional pressure formed by environmental regulations. The strong constraint logic of environmental regulation of the home country will prompt MNCs to introduce more green and clean production methods and technologies to improve their environmental performance. The MNCs with higher degree of internationalization are more experienced in introducing green and clean production methods and technologies and do better, which is more conducive to reducing greenwashing.
Therefore, this paper believes that mandatory institutional pressure can promote enterprises to implement more substantive environmental behavior, improve corporate environmental performance, and effectively reduce “greenwashing” behavior.
Hypothesis 2 (H2):
Environmental regulation plays a negative moderating role between internationalization degree and greenwashing.

2.2.2. Public Pressure and International Greenwashing

As regards enterprises’ environmental governance behaviors, a lot of literature focuses on the influence of media reports, public pressure, ethics, hometown identity, managers’ ideology, and other factors on environmental governance [20]. Public pressure can be transmitted to corporate managers and influence corporate decisions. Shareholders are willing to pursue high-risk and high-yield opportunities, but enterprise managers, motivated by self-interest and considering performance appraisal and personal reputation, will prioritize resource allocation in projects with a short investment cycle and easy recovery of investment costs and returns [21]. Enterprise environmental capital expenditure has the characteristics of high investment cost, long cycle, and low income, which may make the enterprise’s short-term financial situation worse. Based on this, managers are likely to cut environmental capital expenditures and engage in trench behavior and short-sighted behavior. The existence of information asymmetry provides time and space for managers to hide their selfish behaviors. To cope with the external public pressure of the home country and the host country, and to achieve the dual purposes of “deceiving” relevant stakeholders and reducing environmental capital costs, enterprises will make more symbolic environmental protection behaviors and reduce substantive environmental behavior [22]. Therefore, we predict:
Hypothesis 3a (H3a):
External pressure plays a positive moderating role between international experience and greenwashing.
Another point of view is that enterprises with a higher degree of internationalization have stronger motivation to improve their environmental governance performance for two reasons: First, based on the stakeholder theory, enterprises need recognition and support from the public and other stakeholders in order to occupy domestic and foreign markets. Improving the environmental protection management level and establishing brand image are more effective ways to make it [23]. Second, based on the theory of organizational legitimacy, external public pressure can form stable and influential social implicit contract norms, urging enterprises, the public, and government departments to actively fulfill their environmental protection responsibilities. In order to cope with the public pressure of implicit contracts between enterprises and consumers, enterprises will actively release environmental management information to obtain environmental legitimacy recognition [24].
Hypothesis 3b (H3b):
External pressure plays a negative moderating role between internationalization experience and greenwashing.

2.2.3. Industrial Competition Pressure and Greenwashing Behavior of MNCs

As the industry competition intensifies, enterprises need to attach importance to the social responsibility logic and legitimacy requirements led by the home country government and deal with the industry “crowding out” effect caused by the lack of institution [22].
First, the uncertainty and institutional pressures generated by industry competition reinforce companies’ reliance on the legitimacy of home governments. Due to the long-term institutional transition, the home country government has shaped the logic of corporate social responsibility to a certain extent and strengthened the “government–enterprise reciprocity” relationship between enterprises and the home country government [25]. Enterprises with higher institutional relevance tend to obtain government policy and resource support through social responsibility [26]. Due to the lack of capacity and resources, enterprises respond to the political arrangement of the home country government through environmental responsibility decoupling in the process of internationalization. This could help them to obtain a certain political legitimacy, by virtue of the institutional association with the government, and then they can deliver certain home-country-specific advantages to stakeholders in the host country [27].
Second, the time effect caused by industry competition may induce the negative spillover of the legitimacy of CMCs from the home country. Industry competition has a certain “crowding out” effect on the internationalization of enterprises from the home market, and induces the negative stereotype of host country stakeholders on the social responsibility logic of enterprises’ home country. Faced with new institutional arrangements and marginalized disadvantages, driven by the basic “survival instinct”, enterprises may “whitewash” the absence of industry norms in their home countries by decoupling environmental villains to alleviate external institutional barriers. From this viewpoint, we propose the following hypothesis:
Hypothesis 4a (H4a):
Industry competitive pressure strengthens the positive relationship between internationalization degree and greenwashing.
As a specific external institutional pressure, industry competition strengthens firms’ motivation to seek strategic deviation, alleviate external uncertainty, and demand for legitimacy [28,29,30]. Industry competition means that enterprises need to adapt to higher self-regulation and industry norms. In the face of the social responsibility consensus and standards within the host country industry, it is necessary to effectively balance corporate efficiency and legitimacy. Enterprises need to pay attention to the social responsibility practices of competitors in the same industry to maintain their differentiated competitive advantages [31]. Environmental responsibility provides a differentiating tool for enterprises to gain competitive advantages and respond to stakeholders’ legitimacy requirements. In other words, as a strategic buffer, environmental responsibility decoupling in the home country helps enterprises to seek overseas markets with similar institutional logic to the home country. MNCs will achieve legitimacy embedding and diffusion in the local market by relying on the advantage of internationalization of “near neighbors”.
In addition, the industry competition will strengthen the power of MNCs for the embedding of new institutional arrangements, and balance the institutional logic between the home country and the host country through greenwashing, and then provide the institutional logic “autonomy”. To some extent, it will promote the transfer and absorption of a different regional institutional logic and lead to the industry “bandwagon effect” of the internal environmental responsibility. To effectively respond to the strategic choice of legitimacy and competitive differentiation, enterprises will make use of environmental responsibility decoupling. From this level, the following hypothesis is proposed:
Hypothesis 4b (H4b):
Industry competitive pressure weakens the positive relationship between internationalization degree and greenwashing of MNCs.
Based on the theory analysis, the research framework of the paper is shown in Figure 1. Legitimacy pressure is generally divided into regulatory pressure, normative pressure, and cognitive pressure [32]. For enterprises, regulatory pressure mainly comes from government agencies (environmental regulation), normative pressure generally comes from customers and nongovernmental organizations (public pressure), and cognitive pressure mainly comes from competitors (industry competition pressure) [10,33].

3. Methodology

This part mainly includes sample acquisition in Section 3.1, variable measurements in Section 3.2, and empirical model setting in Section 3.3.

3.1. Sample

To test the proposed hypotheses, A-share-listed companies in the Shanghai Stock Exchange and Shenzhen Stock Exchange in 2007–2018 were selected as the research objects. The reason for choosing 2007 as the starting year was that the Shenzhen Stock Exchange issued “The Guidelines on Environmental Information Disclosure of Listed Companies on the Shenzhen Stock Exchange” in 2006, which required listed companies to disclose information related to their environmental responsibilities by following the document. Especially after 2010, the Ministry of Environmental Protection of China issued the “The Guidelines for the Disclosure of Environmental Information of Listed Companies”, which made mandatory disclosure of environmental responsibility information of listed companies, and Chinese enterprises entered the formal disclosure stage of environmental responsibility information. In this study, companies with ST, ST*, AB, and AH cross-listed shares were excluded. ST and ST* represent companies that have been delisted and are about to be delisted, AB represents companies that are listed on both the A-share market and the B-share market, and AH represents companies that are simultaneously listed on the A-share market and the H-share market. Listed companies with ST and ST* marks have suffered heavy losses. However, companies listed in the two markets at the same time are prone to extreme value samples and estimation bias due to their large scale of general production, so the above samples are excluded. The data were mostly from the CSMAR and WIND databases.
The sample of CMCs was obtained from the List of Overseas Investment Enterprises of the Ministry of Commerce of China, CSMAR Overseas Affiliated Subsidiary Database, Wind Database, and Annual Report of Listed Companies. The List of Overseas Investment Enterprises contains the relevant information of OFDI enterprises, which includes the name of their overseas affiliated subsidiaries and the scope of business. After combining the samples of CMCs with the financial data of listed companies, the unbalanced panel data of 2693 firm-year observations from 454 firms over an 11-year period were constructed. All samples are shown in Table 1. Panel A is the number of all samples obtained, Panel B is the sample number of listed companies with overseas subsidiaries in the current year, and Panel C is the number of listed companies without overseas subsidiaries in the current year. Appendix A shows the industry distribution of the company, with a total of 49 industries.

3.2. Variables and Measurements

This section contains measurements of four types of variables: dependent variable, independent variables, moderating variables, control variables.

3.2.1. Dependent Variable

Dependent variable is greenwa, which represents greenwashing. The term “greenwashing” is a mixture of “bleaching” and “green”, which is used to reflect the false publicity and whitewashing of enterprises in environmental protection [34]. Greenwashing is an important manifestation of corporate pseudosocial responsibility, often with a strong “camouflage”, so it is difficult to be effectively identified by the public, which also leads to great difficulty in the measurement of this index in academic research. There are mainly two subindexes of “greenwashing”. The environmental practices of enterprises are divided into symbolic and substantive actions based on measurement from different perspectives of environmental practices. Symbolic actions mainly refer to symbolic practice activities with no substantive content that enterprises convey environmental protection ideas to the outside world and build an environmental image through slogans and propaganda. Substantive behavior refers to the environmental protection carried out by enterprises through practical actions, and the deviation between symbolic and substantive actions is taken as the proxy variable for the degree of greenwashing of enterprises shown in Formula (3) [4,35]. This measurement method is widely used in the study of greenwashing, mainly because the Asset4 database developed by Thomson Reuters (https://my.refinitiv.com/content/dam/myrefinitiv/productdoc/Asset4ESGProfessional_Guide.pdf (accessed on 20 January 2022)) contains ratings and scores on the environmental behavior of enterprises [36]. In research on Chinese corporate greenwashing, there is no such database as Asset4 that specifically studies Chinese corporate greenwashing. This requires text analysis and manual sorting to obtain the greenwashing data of Chinese listed companies. Chinese scholars have concluded a relatively complete greenwashing evaluation using grounded theory through previous research on greenwashing indicators combined with the Chinese institutional background [35,37]. This evaluation system is also adopted in this paper. Please see Appendix B for the greenwashing evaluation system. On the basis of this evaluation system, these authors further improve and form evaluation indexes in Table 2.
The evaluation index framework of greenwashing adopted in this paper is shown in Table 2, with a total of 19 subindexes and scoring rules for related indexes [4,35]. The collection of greenwashing indicators is based on the sustainable development reports, green development reports, social responsibility reports, and environment-related information in corporate official websites. The research team used the text analysis method to score the environmental information disclosed by listed companies, with “yes” assigned to 1 and “no” assigned to 0. Each member of the research team arranges the same batch of samples in advance for scoring and then discusses the judgment indicators with great differences. All samples will not be formally graded until the consistency of the raters of each team member reaches more than 90% in the trial evaluation stage.
Substantive behavior (STS1), which is shown in Formula (1), means “what concrete actions, or steps, they have taken to care for the natural environment”.
S T S 1 k = i = 1 19 x k i
  x k i represents the score of enterprise k on the i index. When the enterprise has substantial action on the i indicator, the value is 1; otherwise, it is 0.
Symbolic environmental management (STS2), which is shown in Formula (2), means “how firms only discuss their environmental commitment and self-compliment, without any proof”.
S T S 2 k = i = 1 19 x k i
  x k i represents the score of enterprise k on the i index. When the enterprise has symbolic behavior on the i indicator, the value is 1, otherwise, 0.
G r e e n w a = S T S 2 S T S 1
In Equation (3), STS1 represents the total score of all symbolic indicators, while STS2 represents the total score of all substantive indicators. Greenwa is the difference between the total symbolic score and the total substantive score. Symbolic indicators and substantive indicators have common measurement indicators.

3.2.2. Independent Variables

The degree of internationalization is represented by lnArea, which is expressed by the total number of surviving overseas subsidiaries of CMCs in the current year [38,39] There are also other indicators to measure the degree of internationalization, such as the proportion of overseas business revenue or overseas profit [22]. Considering the availability of data and the sample size that can match the data studied in this paper, the number of overseas subsidiaries is adopted in this paper to measure the degree of internationalization. The measurement of enterprise internationalization mainly includes the depth index of internationalization, the international breadth index, and two kinds of composite index [27,40,41]. In this paper, the authors study the influence of the number of overseas subsidiaries, which is one of the international characteristic of greenwashing. Therefore, this paper specifically uses the number of overseas subsidiaries to represent the internationalization degree [40,41], and this definition applies to the full text, because different internationalization characteristic indexes have significantly different effects on the performance of multinational corporations.

3.2.3. Moderating Variables

lnp25m represents PM2.5 concentration in logarithm. Many scholars use a single pollutant discharge as a proxy variable for environmental regulation [42,43,44,45,46]. Pollutant emissions often have obvious correlations with environmental regulation [47], and this paper draws on this idea. PM2.5 concentration in Chinese cities is used as the proxy variable of environmental regulation. PM2.5 affects the health of the Chinese people and has received wide attention from government agencies and all sectors of society [48]. The reason why PM2.5 is adopted as the proxy variable of environmental regulation in this paper is that PM2.5 is due to various pollution-related diseases of Chinese citizens [49] and the concentration of PM2.5 mainly depends on the discharge degree of three industrial wastes (industrial waste water, industrial sulfur dioxide, and industrial dust) [50]. Some scholars have adopted the industrial waste and entropy method to construct environmental regulation indicators [51]. PM2.5 can also be used as a proxy variable of environmental regulation, and the environmental regulation indicators constructed by industrial waste are used to test the robustness of the empirical model. media stands for public pressure, and the Baidu search index of listed companies is adopted as a measure of external public pressure faced by listed companies [52]. HHI_A is the Herfindahl index, indicating competitive pressure in the industry. The calculation formula is:
HHI = sum [ ( X i X ) 2 ]
The prime operating revenue of a single company is used to calculate its industry market share, where Xi is the prime operating revenue of a single company, X is the total prime operating revenue of the industry to which the company belongs, and (Xi/X) is the industry market share of the company. It is the sum of the square of the ratio of the prime operating revenue of each company in the industry to the total prime operating revenue of the industry.

3.2.4. Control Variables

Country-level variables include Inst, Culture, Economic, and Distance. Inst is used to represent the legal institutional distance, and the data are obtained from the Worldwide Governance Indicators [53]. The Worldwide Governance Indicators (WGI) project reports aggregate and individual governance indicators for over 200 countries and territories over the period of 1996–2019 for six dimensions of governance: voice and accountability, regulatory quality, political stability and absence of violence, rule of law, government effectiveness, and control of corruption. Culture is measured using the Hofstede cultural index [54]. The index quantifies the cultural characteristics of various countries from the six dimensions of power distance, individualism and collectivism, masculinity/femininity, uncertainty avoidance, long-term orientation, and indulgence versus restraint. Economic measures economic institutional distance by using the Index of Economic Freedom (hereinafter referred to as IEF) published by the Wall Street Journal and the Heritage Foundation. As a comprehensive indicator, IEF covers 10 categories: business freedom, trade freedom, currency freedom, government scale, financial freedom, property rights, fiscal freedom, investment freedom, corruption prevention, and labor freedom. Distance stands for geographical distance, which can be obtained by searching the linear distance between Beijing, the capital of China, and the capital of the host country on the Google map. With the increase in geographical distance, the cost of information search for MNCs to implement the internationalization strategy is constantly increasing.
In this paper, the number of subsidiaries in different host countries is used as the weight of the institutional quality, and the institutional quality of MNCs in the host country is replaced by the weighted summation of different host country institutional qualities. Finally, the difference between the quality of the home country institution and the host country institution is used as the institutional distance [27]. The specific calculation Formula (5) of institutional distance (Inst, Culture and Economic) between China and other countries are as follows: after obtaining the institutional dimension values of the home country and host country, the institutional distance is constructed by a distance index formula [55].
Institution it = d = 1 n ( I dh I dc ) 2 / nV d
I dh is the institutional score of h of the home country (China) in d dimension, I dc is the institutional score of the host country c in dimension d, n is the number of dimensions contained in the institutional distance, and V d is the variance of the scores of each country in dimension d.
Firm-level variables include fapatent, top1, SharStock, ROAA, and itang. ManFee is resources slack, which is measured by the ratio of management expenses to operating income [56]; AmountCOST is the ratio of government subsidies to operating costs. Government subsidies include tax incentives for enterprises, environmental protection subsidies, special funds for energy conservation and emission reduction, special funds for technical cooperation, discount interest on loans, and other government subsidies in a broad sense; lnTA is the total assets of the company, which stands for enterprise-size, which is taken as the logarithm of the assets; fapatent is the logarithm of the number of green patents plus one; top1 is the shareholding ratio of the largest shareholder and represents the shareholding concentration; SharStock is the number of shares held by an executive at the end of the year, which is used to indicate the executive incentive index; ROAA is the return on assets, a measure of a company’s earnings; and itang stands for intangible asset ratio.
The time dummy Year variable and the industry dummy variable Ind are also set. According to “The Guidelines on Environmental Information Disclosure of Listed Companies” published by the Ministry of Environmental Protection of China in 2010, the industry of heavy pollution is defined as Ind = 1 for heavy polluting enterprises, and otherwise Ind = 0 [57]. To reduce the influence of extreme values, tailing treatment on all continuous variables at the levels of 1% and 99% are carried out. In terms of the descriptive statistics of samples, the mean value (5.403) of Greenwa in the sample of international enterprises is higher than that (5.288) of the noninternational sample. The standard deviation of Greenwa in the international sample is 0.062 larger than that of the noninternational sample, indicating that the greenwashing performance is significantly different. The mean value of Area of the international sample is 4.175, and the standard deviation is 4.667, indicating that the internationalization level of different enterprises is greatly different.

3.3. Model Setting

The econometric model is set as follows. Equation (6) is the benchmark regression model, and Equation (7) is the interaction effect model after adding moderator variables.
Y it = α 1 + β 11 X it + β 12 M it + β 13 Control it + δ 1 t + ε it
Y it = α 2 + β 21 X it + β 22 M t + β 23 X it × M t + β 24 Control it + δ 2 t + ε it
where Y it is the explained variable and represents the greenwashing behavior of i listed company in t year; X it is the explanatory variable and internationalization experience and represents the number of overseas subsidiaries of i listed company at the end of t year; M t It is a moderating variable, including environmental regulation, public pressure, and industry competition pressure; X it × M t is the interaction term of the explanatory variable and the moderating variable; Control it is the control variable set; δ t is the time fixed effect parameter, α is constant; β is the coefficient to be estimated; and ε it is the random disturbance term. Unbalanced panel data were used for regression. To overcome the possible cross-section correlation, time series correlation, and heteroscedasticity problems of panel data, the D–K (Driscoll–Kraay) standard error method was used for estimation.

4. Empirical Analysis

This part mainly includes multicollinearity analysis, results of regressions, and robustness test. ***, ** and ** appear in the regression result tables in the following sections, which correspond to the significance of 1%, 5% and 10% respectively and are marked as: *** p < 0.01, ** p < 0.05 and * p < 0.1. In order to save space, this paper will not repeat them one by one in the following tables.

4.1. Multicollinearity Analysis

To ensure the validity of the estimated value, before the empirical analysis, the correlation coefficient method and variance inflation factor (VIF) are used to test the multicollinearity among independent variables, respectively. The mean of VIF value is 1.33, which is much less than the critical value of 10. The maximum moment of correlation coefficient (0.630) is the correlation coefficient between Culture and Distance, less than 0.8, and the left ones are less than 0.5, which indicate that there is no serious multicollinearity problem. The correlation between variables is below the cut-off of 0.80.

4.2. Regression Results

This part mainly includes three sections: endogeneity test, regression results of domestic pressures, and robustness test of the regression.

4.2.1. Endogeneity Test

Considering the endogenous problems and reverse causality, in this study, the two-stage least square method (2SLS) is used to solve the endogeneity problem. The internationalization degree (lnArea) lagging one stage is used as an instrumental variable (IV) to perform regression on Equation (6) [58]. Since the number of IVs is the same as the number of endogenous variables, there is no problem of over identification. The Hausman value is 24.03, and the corresponding p-value is 0.6286, which cannot reject the null hypothesis that the explanatory variable is exogenous.

4.2.2. Full-Sample Regression of Domestic Pressures

Table 3 shows the full-sample regression results. The coefficients of lnArea are all positive and significant, supporting the H1 hypothesis. Models 2 to 4 show the analysis results of the moderating effect. In model 2, the coefficient of lnp25m_lnArea is negative and significant at 1% level (β = −0.0697, p < 0.05). It shows that environmental regulation weakens the impact of internationalization degree on greenwashing, and hypothesis H2 is supported. In model 3, the coefficient of media_lnArea is negative but not significant (β = −0.0130, p > 0.1). The reason for this phenomenon may be that different regions of China and different types of enterprises have different reactions to news media, resulting in an overall nonsignificant phenomenon, which will be explained in the heterogeneity analysis of public pressure later. In model 3, the coefficient of HHI_A_lnArea is positive but not significant (β = −0.0291, p > 0.1). The industry competition level in different regions varies greatly. The average value of competitive pressure in the eastern, central, and western regions is 0.1764, 0.1456, and 0.1619, respectively. The average industrial pressure of state-owned enterprises (SOES) and non-state-owned enterprises (NSOES) is 0.1818 and 0.1505, respectively. Compared with NSOES, SOES have certain industry monopoly advantages and stronger risk resistance in the face of fierce industry competition. Therefore, due to the heterogeneity of different regions and property rights, the moderating effects of industry pressure on the relationship between degree of internationalization and greenwashing are different.
Environmental regulation adopts city-level data, instead of adopting environmental regulation indicators for each enterprise, and only regional heterogeneity analysis is conducted here. Table 4 shows the heterogeneity regression results of environmental regulations. The coefficients of lnArea are significant except for the eastern region.
In the analysis of regional heterogeneity, the regression coefficient of lnp25m_lnArea in eastern China is positive and not significant (β = 0.0133, p > 0.1). Theoretically, the environmental regulation in eastern China should have a negative moderating effect which can be explained from the following reasons: Eastern China is an economically developed region with a large amount of GDP, energy consumption, and pollution. The central government of China first encourages the eastern region to carry out economic transformation and implements a series of strict environmental regulation measures so that the environmental regulation negatively moderates the relationship between the degree of internationalization and greenwashing. However, the environmental regulation data adopted at the municipal level do not match the data at the enterprise level, and the environmental regulation data for each enterprise cannot be obtained. Therefore, there is a certain deviation between the sample regression results and the theoretical analysis results. In the follow-up robustness analysis, the moderating effect of environmental regulation in eastern China will be discussed. In the western region, the coefficient of lnp25m_lnArea is negative and significant at 5% level (β = −0.445, p < 0.05). Western China is a key ecological protection area in China. In 2015, Guizhou, Jiangxi, and other western provinces were first designated as national ecological experimental areas. It is self-evident that their environmental regulations are more stringent, and their environmental regulations show a weakened moderating effect. In general, the weakening effect of environmental regulations on international greenwashing behavior in western China is stronger than that in eastern China. The regression coefficient of lnp25m_lnArea in central China is positive and significant at a 10% level (β = 0.381, p < 0.1). The economic development and technological level of central China lag behind that of eastern China, which does not have the conditions for economic transformation. It is necessary to take into account the livelihood indicators of employment, tax revenue, and economic development. Environmental regulation plays a positive moderating effect between internationalization degree and greenwashing, which indirectly proves the “cost of compliance” hypothesis.
Table 5 shows the heterogeneous regression results of public pressure faced by listed companies. The coefficients of lnArea are significant except for those in the eastern region. In the analysis of regional heterogeneity, the regression result of media_lnArea in eastern China is negative, which is significant at a 1% level (β = −0.0477, p < 0.5). The development level of news media and networks in eastern China is in a leading position in China, which can timely and efficiently supervise and correct enterprises’ environmental damage behaviors.
Regression results of media_lnArea in western China show positive coefficient, but not significant (β = 0.00640, p > 0.1). The reason may be that the western region is dominated by plateau and mountainous areas, resulting in inconvenient transportation and underdeveloped network, and the public pressure has not formed effective supervision and binding force. Regression results of media_lnArea in central China show a positive coefficient (β = 0.123, p < 0.1), indicating that public pressure des not play an effective role. Public pressure in central China is not enough to restrain the greenwashing behavior of enterprises.
In the heterogeneity analysis of SOES and NSOES, the media_lnArea coefficient of the regression result of SOES is positive but not significant (β = 0.0193, p > 0.1). However, to some extent, it indicates that public pressure strengthens the greenwashing behavior of SOES during the process of exerting the internationalization strategy. SOES has strong political connections, which are commonly given China’s political environment. Therefore, the tendency of SOES to greenwash may also be politically motivated. They may spend a lot of money on media operations to reduce the reporting of negative news. As a result, public pressure may lead to politically motivated greenwashing of SOES [59]. Second, public participation can affect the scale of enterprise environmental protection investment. When the cost of environmental protection investment exceeds the income, public participation cannot promote the growth of enterprise environmental protection investment [59]. The media_lnArea coefficient of the regression results of NSOES is negative and significant at the 5% level (β = −0.0581, p < 0.05), indicating that public pressure has a weakened moderating effect, and NSOES do not have the natural political advantages, which are owed by SOES. When NSOES face public pressure, positive environmental strategies are usually adopted, so the public pressure shows a negative regulatory effect.
Table 6 shows the heterogeneity regression results of industry pressure. The main effect of lnArea is significant in the eastern region, but it is not significant in other regressions, and the coefficient of HHI_A_lnArea is positive or negative. As analyzed above (Table 5), this is caused by different levels of industry competition in different regions and different types of enterprises. The following regression will be carried out under the two conditions of restraining region and property rights at the same time to discuss the moderating effect of industry pressure.
In the analysis in Table 6, a subsample regression analysis is conducted for restraining regions and enterprise types to discuss the moderating effect of industry pressure. The coefficient of HHI_A_lnArea in the regression results of eastern SOES is positive and significant at the 1% level (β = 0.647, p < 0.01). The coefficient of HHI_A_lnArea in the regression results of NSOES in central China is positive and significant at the 1% level (β = 3.368, p < 0.01). The above regression results show that industry competition pressure has strengthened the positive relationship between the degree of internationalization and the greenwashing of the home country’s strategic environmental responsibilities, which proves H4a. The coefficient of the regression result HHI_A_lnArea in the eastern NSOES is positive and negative, and it is significant at the level of 10% (β = −0.399, p < 0.1). The above regression results show that industry competition pressure weakens the positive relationship between lnArea and the greenwashing of the home country’s environmental responsibility, which proves H4b.

4.3. Robustness Test

This part is to test the robustness of domestic pressures faced by the company. First, the Heckman two-step method is adopted to test the robustness to overcome the deviation caused by sample selection. Second, based on Heckman’s test, the two-stage least square method (2SLS) is used to overcome reverse causality and endogeneity. Finally, the robustness test is carried out based on changing the measurement method of moderating variables.

4.3.1. Robustness Test of Full-Sample Regression Results

Table 7 is the first-stage regression result of Heckman. The variables except for Culture, Distance, Inst, and Economic are chosen as the control variables; the Earth that represents the company has overseas subsidiaries or does not; and 1 means one company has overseas subsidiaries, otherwise, 0. The probit model is used to estimate imr.
Table 8 show the regression results of the moderating effects of environmental regulation, public pressure, and industry pressure under the Heckman method and 2SLS. The direction of moderating effect coefficients is consistent with previous results. Although the coefficient of lnp25m_lnArea is not significant, it will not ignore the conclusion that the whole environmental regulation level of China has improved a lot.

4.3.2. Robustness Test of Heterogeneity Analysis under the 2SLS Method

Table 9 and Table 10 test the heterogeneity robustness of environmental regulation, public pressure, and industry pressure under the 2SLS method. The conclusions of environmental regulation are consistent with the previous ones. However the coefficient of media_lnArea is not significant in the heterogeneity analysis of public pressure, indicating that the supervision effect of news media lagging one period is not significant, which further indicates that news media has a fast propagation speed and strong timeliness, and can get feedback at that time after the disclosure of relevant events. Table 10 shows the heterogeneity regression results of industry pressure. The HHI_A_lnArea coefficient of western SOES is more significant (β = −2.005, p < 0.05) compared with above (Table 8), indicating that the industry pressure lagging one stage has a more obvious moderating effect on the relationship between internationalization degree and greenwashing of western SOES, and the negative moderating effect is weak in the current period. The HHI_A_lnArea coefficient of eastern NSOES is weaker (β = −0.399, p > 0.1) than that above (Table 8), indicating that industrial pressure has a stronger negative moderating effect on the international greenwashing behavior of eastern NSOES in the current period. The HHI_A_lnArea coefficient of central NSOES is weaker (β = 3.886, p > 0.1) than that above (Table 8), indicating that industrial pressure has a stronger positive moderating effect on the international greenwashing behavior of eastern NSOES in the current period.

4.3.3. Robustness Test of Heterogeneity Analysis by Changing Variables

According to the availability of data, the environmental regulation index is calculated as the environmental composite index (ECI) based on the data of various pollutants including industrial waste water emissions, industrial sulfur dioxide emissions, and industrial soot emissions on provincial panels from 2007 to 2018 by entropy method. This part draws on the ideas and methods of the construction of a comprehensive environmental regulation index [51,60,61,62]. Public pressure adopts the logarithm of the number of newspaper reports of paper edition (lnNumPress) (full-text database of important Chinese newspapers, http://cn.oversea.cnki.net/kns55/brief/result.aspx?dbPrefix=CCND (accessed on 20 January 2022)), and the Baidu search index (media) is used in the previous chapter. Industry pressure adopts HHI_C, which uses the total assets of a single company to calculate its market share in the industry, and then calculates it according to Formula (5). Resources slack (ManFee3) uses the ratio of management expenses to operating costs. Scarce resource uses the ratio of government subsidies to operating income (AmountIn). Table 11 shows the full-sample regression results. The significance and sign direction of other moderating effects are basically consistent with the previous conclusions, except that the ECI_lnArea coefficient of the environmental regulation moderating effect is no longer significant (β = −0.0133, p > 0.1). This confirms the reason mentioned above that different environmental regulation indicators affect the significance of empirical regression results, thus deviating from the theoretical analysis conclusion that environmental regulation plays a negative moderating effect. In this paper, it is difficult to obtain the environmental regulation data accurate to the enterprise level, and the environmental regulation data at the provincial level is used in this paper to replace the environmental regulation data at the enterprise level. Therefore, it is reasonable for the significance of the moderating effect coefficient of environmental regulation to change a little. This severely constrains the research conclusion of this paper. Table 12 is an analysis of the heterogeneity of environmental regulations. It is approximately consistent with the results shown in a previous section. At this time, the environmental regulation in eastern China shows a significant negative regulatory effect, which is different from the insignificant results mentioned in Table 4. The environmental regulations in the eastern and western regions have a negative moderating effect. This proves that the environmental moderating effect in eastern China is greatly affected by different types of environmental regulation variables; the regression result of the central region has a positive coefficient of ECI_lnArea and is significant at the level of 5%. The heterogeneity analysis of public pressure is shown in Table 12, which is approximately consistent with the previous conclusions. Table 13 uses provincial PM2.5 instead of municipal PM2.5 to participate in the regression. It can be seen that both the eastern and western environmental regulations show a significant negative moderating effect, while the central region shows a significant positive moderating effect, which supports the conclusions of this paper about environmental regulation. lnNumPress_lnArea’s coefficients are negative except for the regression result of SOES, which is positive and significant at the 1% level. Table 14 shows the heterogeneity analysis of industry pressure. The results show that the signs and significance of the coefficient of the industry pressure moderating effect (HHI_C_lnArea) are approximately the same with previous conclusions.

5. Discussion and Conclusions

The contributions of this paper are reflected in the following aspects: First, in previous studies, environmental responsibility is seldom carried out from the perspective of greenwashing under the background of internationalization of Chinese listed companies, which is a useful supplement to existing research [30,63,64] Second, diving factors of greenwashing from host countries are usually considered, such as institutional distance, which is used for researching the internationalization issues of an emerging market [1]. Compared with the above research, the driving factors of legitimacy pressures of a home country, including environmental regulation, public pressure, and industry pressure, are included in the scope of our research, and the theoretical mechanism is constructed. Third, the regression result shows that internationalization degree “improves” greenwashing, which is quite different from the conclusion that it has a negative relationship [1].
This study was motivated by the growing expectations of stakeholders for emerging market MNCs to address social and environmental issues related to their global operations [65]. However, there is no specific discussion about the impact of the legitimacy factors of the home country institution on the greenwashing of MNCs. The conclusions of this paper are different from those of previous studies. The institutional factors of the home country can also restrain the phenomenon of greenwashing in the process of internationalization of MNCs under some conditions. For example, environmental regulation, public pressure, and industry pressure in this paper show the inhibitory effect (moderating effect) in the heterogeneity analysis.
The level of internationalization generally weakens the greenwashing of social responsibility [1]. but the environmental responsibility studied in this paper has the characteristics of large investment, large risk, and long income cycle [66]. Perhaps for this reason, the degree of internationalization increases the dependence of Chinese MNCs on global stakeholders and improves the greenwashing level of their environmental responsibility. If these companies engage in corporate environmental responsibility greenwashing, global stakeholders will not recognize their status of legitimacy in the long run.
In view of the different economic developments in different regions of China and the influence of industry pressures, the greenwashing behavior of MNCs has been greatly affected. MNCs are suggested to implement diversified business strategies and make diversified transnational investments, which can avoid homogenization competition with increasing domestic industry pressure and reduce the effect of industry pressure on greenwashing isomorphism [67].
This paper studied the role of environmental regulation, public pressure, and industry pressure in the relationship between internationalization degree and greenwashing. The main conclusions are as follows: First, the results of baseline regression and robustness tests are compared of the full samples, the moderating effect of environmental regulation has different regression results depending on different environmental regulation varibles. However, one thing we have to admit is that environmental regulation has encouraged Chinese multinationals to inter-nationalize in a greener way. The moderating effects of public pressure and industrial pressure are not significant. Second, the heterogeneity analysis of environmental regulation shows that environmental regulation can weaken the positive relationship between the degree of internationalization and greenwashing in the eastern and western regions, but strengthen the connection in the central region. Third, in the heterogeneity analysis of public pressure, public pressure can effectively weaken the positive relationship between degree of internationalization and greenwashing of the eastern region and NSOES and strengthen the relationship of SOES; however, public pressure has little effect in central and western China. Through 2SLS regression analysis of the explanatory variable lag period as an instrumental variable, the moderating effect of the lag regression is not significant, indicating that public pressure has a strong timeliness, and the moderating effect is significant in the current period. Fourth, the degree of industry competition is related to the level of regional economic development and the nature of enterprise property rights, so the heterogeneity analysis is carried out by constraining both region and enterprise types. The regression results show that industrial pressure has strengthened the positive relationship between degree of internationalization and greenwashing of the eastern SOES and the central NSOES, and weakened the relationship of the central SOES and the eastern and western NSOES. The relationship between degree of internationalization and greenwashing of western SOES is sensitive to the negative moderating effect of the industry pressure lagging one stage.
The limitations and future prospects discussed below are for Chinese multinationals, not for companies from other countries. The influence of internationalization degree on greenwashing is based on the sample of Chinese enterprises. Due to the differences in institution in different countries, the moderating effect of legitimacy driving factors may only apply to emerging economies with similar institutions in China. It has been confirmed that the degree of internationalization has a similar effect on greenwashing in countries with similar systems [1]. Internationalization degree is only one of the characteristics of the internationalization of MNCs [27]. The samples studied in this paper do not distinguish between institutional deficit and institutional surplus [68,69] The sample contains a large number of multinational companies that invest in developing countries with inferior institutional quality to China, which may also contribute to the fact that internationalization degree promotes greenwashing. In terms of selecting core explanatory variable indicators, this paper selects the number of subsidiaries of multinational companies as the measurement index of internationalization degree [27]. which represents the depth of internationalization. However, the overseas operating revenue, the profit ratio, and the number of host countries (the width or breadth of internationalization) could also be chosen as proxy variables [1], and the characteristics of internationalization above may lead to different conclusions. In addition to the home country institutional pressure as the motivation variable, the resource-based theory can be used to study the impact of corporate resources on the greenwashing behavior of Chinese multinational corporations, such as resources slack, political connection, government subsidies, and green loans [70,71,72].

Author Contributions

Conceptualization, Z.P. and K.Z.; methodology, K.Z.; software, K.Z.; validation, K.Z., Z.P. and M.J.; formal analysis, M.J.; investigation, K.Z.; resources, K.Z.; data curation, K.Z.; writing—original draft preparation, K.Z.; writing—review and editing, M.J.; visualization, K.Z.; supervision, M.J. and Z.P.; project administration, Z.P.; funding acquisition, Z.P. All authors have read and agreed to the published version of the manuscript.

Funding

This research was funded by National Natural Science Foundation of China (Grant No.71972104).

Institutional Review Board Statement

Not applicable.

Informed Consent Statement

Not applicable.

Data Availability Statement

Data sharing not applicable.

Acknowledgments

This research has also been supported by the China Scholarship Council (202006860022) and the academic programme of the 20+20 Alliance of Jiangsu-UK High Level Universities. The authors thank the reviewers and editors for their comments.

Conflicts of Interest

The authors declare no conflict of interest.

Appendix A. Industry composition of international firms

IndustryFirms
Professional technical service industry2
Special equipment manufacturing industry23
Internet and related services11
Instrumentation manufacturing4
Insurance2
Other manufacturing4
Other financial industry6
Agriculture, animal husbandry, and fishery3
Agricultural and sideline food processing industry4
Chemical raw materials and chemical products manufacturing26
Pharmaceutical manufacturing22
Health industry2
Business service industry11
Civil engineering construction industry18
Building decoration and other construction industry2
Mining support activities2
Real estate industry20
Wholesale industry12
News and publishing industry4
Nonferrous metal smelting and rolling processing industry21
Nonferrous metal mining and dressing industry6
Rubber and plastic products industry6
Transportation17
Automotive manufacturing15
Coal mining and washing industry4
Water and gas production and supply industry5
Ecological protection and environmental governance industry5
Telecommunications, radio, and television and satellite transmission services3
Electricity and heat production and supply industry7
Electrical machinery and equipment manufacturing23
Oil and gas extraction industry4
Research and experimental development1
Textile industry4
Textile and apparel, apparel industry7
Comprehensive industry2
Computer, communications, and other electronic equipment manufacturing43
Monetary and financial services6
Capital market services12
Software and information technology service industry18
General equipment manufacturing12
Paper and paper products industry3
Postal industry2
Liquor, beverage, and refined tea manufacturing5
Metal products industry4
Railway, shipbuilding, aerospace, and other transportation equipment manufacturing4
Retail8
Nonmetallic mineral products industry14
Food manufacturing7
Ferrous metal smelting and rolling processing industry8
Total firms454

Appendix B. Evaluation index of greenwashing behavior of Chinese companies

Input managementDedicated funds
Green supplier
Environmental cost
Green materials
Production processGreen process
Green research
Use of clean energy
Products and businessGreen business development
Green market
Output controlRisk analysis
Waste reduction
Pollution monitoring
Recycling
Ecological restoration
Resources efficiency
Environmental governance structureEnvironmental department
Programs and certificationCertification
Appraisal and reward
Staff managementStaff training
Green working
Planning and rules
Image managementMission statement
Environmental coalition
Environmental charity

References

  1. Tashman, P.; Marano, V.; Kostova, T. Walking the walk or talking the talk? Corporate social responsibility decoupling in emerging market multinationals. J. Int. Bus. Stud. 2019, 50, 153–171. [Google Scholar] [CrossRef]
  2. Leonidou, L.C.; Leonidou, C.N.; Fotiadis, T.A.; Zeriti, A. Resources and capabilities as drivers of hotel environmental marketing strategy: Implications for competitive advantage and performance. Tour. Manag. 2013, 35, 94–110. [Google Scholar] [CrossRef]
  3. Delmas, M.A.; Burbano, V.C. The Drivers of Greenwashing. Calif. Manag. Rev. 2011, 54, 64–87. [Google Scholar] [CrossRef] [Green Version]
  4. Walker, K.; Wan, F. The Harm of Symbolic Actions and Green-Washing: Corporate Actions and Communications on Environmental Performance and Their Financial Implications. J. Bus. Ethics 2012, 109, 227–242. [Google Scholar] [CrossRef] [Green Version]
  5. DiMaggio, P.J.; Powell, W.W. The iron cage revisited: Institutional isomorphism and collective rationality in organizational fields. Am. Sociol. Rev. 1983, 48, 147–160. [Google Scholar] [CrossRef] [Green Version]
  6. Suchman, M.C. Managing legitimacy: Strategic and institutional approaches. Acad. Manag. Rev. 1995, 20, 571–610. [Google Scholar] [CrossRef]
  7. Meyer, J.W.; Rowan, B. Institutionalized organizations: Formal structure as myth and ceremony. Am. J. Sociol. 1977, 83, 340–363. [Google Scholar] [CrossRef] [Green Version]
  8. Xu, D.; Meyer, K.E. Linking theory and context: ‘Strategy research in emerging economies’ after Wright et al. (2005). J. Manag. Stud. 2013, 50, 1322–1346. [Google Scholar] [CrossRef]
  9. Morgeson, F.P.; Aguinis, H.; Waldman, D.A.; Siegel, D.S. Extending corporate social responsibility research to the human resource management and organizational behavior domains: A look to the future. Pers. Psychol. 2013, 66, 805–824. [Google Scholar] [CrossRef]
  10. Berrone, P.; Fosfuri, A.; Gelabert, L.; Gomez Mejia, L.R. Necessity as the mother of ‘green’ inventions: Institutional pressures and environmental innovations. Strateg. Manag. J. 2013, 34, 891–909. [Google Scholar] [CrossRef]
  11. Li, J.; Xie, Z. Examining the cross-border acquisition strategy of Chinese companies: The moderating roles of state ownership and institutional transition. J. Leadersh. Organ. Stud. 2013, 20, 436–447. [Google Scholar] [CrossRef]
  12. Delgado-Ceballos, J.; Aragón-Correa, J.A.; Ortiz-de-Mandojana, N.; Rueda-Manzanares, A. The effect of internal barriers on the connection between stakeholder integration and proactive environmental strategies. J. Bus. Ethics 2012, 107, 281–293. [Google Scholar] [CrossRef]
  13. Murillo Luna, J.L.; Garcés Ayerbe, C.; Rivera Torres, P. Why do patterns of environmental response differ? A stakeholders’ pressure approach. Strateg. Manag. J. 2008, 29, 1225–1240. [Google Scholar] [CrossRef]
  14. Chelli, M.; Durocher, S.; Richard, J. France’s new economic regulations: Insights from institutional legitimacy theory. Account. Audit. Account. J. 2014, 27, 283–316. [Google Scholar] [CrossRef]
  15. De Villiers, C.; Rinaldi, L.; Unerman, J. Integrated Reporting: Insights, gaps and an agenda for future research. Account. Audit. Account. J. 2014, 27, 1042–1067. [Google Scholar] [CrossRef] [Green Version]
  16. Cozza, C.; Rabellotti, R.; Sanfilippo, M. The impact of outward FDI on the performance of Chinese firms. China Econ. Rev. 2015, 36, 42–57. [Google Scholar] [CrossRef]
  17. Piperopoulos, P.; Wu, J.; Wang, C. Outward FDI, location choices and innovation performance of emerging market enterprises. Res. Policy 2018, 47, 232–240. [Google Scholar] [CrossRef]
  18. Hao, Y.; Guo, Y.; Guo, Y.; Wu, H.; Ren, S. Does outward foreign direct investment (OFDI) affect the home country’s environmental quality? The case of China. Struct. Chang. Econ. Dyn. 2020, 52, 109–119. [Google Scholar] [CrossRef]
  19. Jude, C.; Levieuge, G. Growth effect of foreign direct investment in developing economies: The role of institutional quality. World Econ. 2017, 40, 715–742. [Google Scholar] [CrossRef]
  20. Boiral, O.; Raineri, N.; Talbot, D. Managers’ citizenship behaviors for the environment: A developmental perspective. J. Bus. Ethics 2018, 149, 395–409. [Google Scholar] [CrossRef]
  21. Campbell, T.C.; Gallmeyer, M.; Johnson, S.A.; Rutherford, J.; Stanley, B.W. CEO optimism and forced turnover. J. Financ. Econ. 2011, 101, 695–712. [Google Scholar] [CrossRef]
  22. Marquis, C.; Toffel, M.W.; Zhou, Y. Scrutiny, norms, and selective disclosure: A global study of greenwashing. Organ. Sci. 2016, 27, 483–504. [Google Scholar] [CrossRef]
  23. Brammer, S.; Millington, A. Corporate reputation and philanthropy: An empirical analysis. J. Bus. Ethics 2005, 61, 29–44. [Google Scholar] [CrossRef]
  24. Zeng, S.X.; Xu, X.D.; Dong, Z.Y.; Tam, V.W. Towards corporate environmental information disclosure: An empirical study in China. J. Clean. Prod. 2010, 18, 1142–1148. [Google Scholar] [CrossRef]
  25. Marquis, C.; Qian, C. Corporate social responsibility reporting in China: Symbol or substance? Organ. Sci. 2014, 25, 127–148. [Google Scholar] [CrossRef] [Green Version]
  26. Brown, W.O.; Helland, E.; Smith, J.K. Corporate philanthropic practices. J. Corp. Financ. 2006, 12, 855–877. [Google Scholar] [CrossRef] [Green Version]
  27. Attig, N.; Boubakri, N.; El Ghoul, S.; Guedhami, O. Firm internationalization and corporate social responsibility. J. Bus. Ethics 2016, 134, 171–197. [Google Scholar] [CrossRef]
  28. Guo, R.; Tao, L.; Li, C.B.; Wang, T. A path analysis of greenwashing in a trust crisis among Chinese energy companies: The role of brand legitimacy and brand loyalty. J. Bus. Ethics 2017, 140, 523–536. [Google Scholar] [CrossRef]
  29. Testa, F.; Boiral, O.; Iraldo, F. Internalization of environmental practices and institutional complexity: Can stakeholders pressures encourage greenwashing? J. Bus. Ethics 2018, 147, 287–307. [Google Scholar]
  30. Yang, Z.; Nguyen, T.T.H.; Nguyen, H.N.; Nguyen, T.T.N.; Cao, T.T. Greenwashing behaviours: Causes, taxonomy and consequences based on a systematic literature review. J. Bus. Econ. Manag. 2020, 21, 1486–1507. [Google Scholar] [CrossRef]
  31. Bondy, K.; Moon, J.; Matten, D. An institution of corporate social responsibility (CSR) in multi-national corporations (MNCs): Form and implications. J. Bus. Ethics 2012, 111, 281–299. [Google Scholar] [CrossRef] [Green Version]
  32. DiMaggio, P. Interest and agency in institutional theory. In Institutional Patterns and Organizations Culture and Environment; Ballinger Publishing Company: Pensacola, FL, USA, 1988; pp. 3–21. [Google Scholar]
  33. Li, F.; Ding, D.Z. The effect of institutional isomorphic pressure on the internationalization of firms in an emerging economy: Evidence from China. Asia Pac. Bus. Rev. 2013, 19, 506–525. [Google Scholar] [CrossRef]
  34. Bowen, F.; Aragon-Correa, J.A. Greenwashing in Corporate Environmentalism Research and Practice: The Importance of What We Say and Do. Organ. Environ. 2014, 27, 107–112. [Google Scholar] [CrossRef] [Green Version]
  35. Gou, Q.W. Can Both Substantive and Symbolic Environmental Management get Paid?—An Empirical Study Based on China Listing Corporation. In Advanced Materials Research; Trans Tech Publications, 2013; pp. 760–763. Available online: https://doi.org/10.4028/www.scientific.net/AMR.807-809.760 (accessed on 20 January 2022).
  36. Roulet, T.J.; Touboul, S. The intentions with which the road is paved: Attitudes to liberalism as determinants of greenwashing. J. Bus. Ethics 2015, 128, 305–320. [Google Scholar] [CrossRef] [Green Version]
  37. Jin, Y. Research on Environmental Regulation, Greenwashing Behavior and Enterprise R&D Investment. 2018. Available online: https://cdmd.cnki.com.cn/Article/CDMD-10070-1019094657.htm (accessed on 20 January 2022).
  38. Lu, J.W.; Beamish, P.W. International diversification and firm performance: The S-curve hypothesis. Acad. Manag. J. 2004, 47, 598–609. [Google Scholar]
  39. Morck, R.; Yeung, B. Why investors value multinationality. J. Bus. 1991, 64, 165–187. [Google Scholar] [CrossRef]
  40. Chen, L.; Liu, J.; Zhang, S. Influence of mimetic isomorphism on firms’ internationalization-performance relationship—an empirical study based on legitimacy perspective in institutional theory. China Industrial Economics 2016, 9, 127–143. [Google Scholar]
  41. Zhen, P.; Yang, L.; Yin, H. The Effect of Chinese Enterprises Internationalization on Corporate Social Responsibility. Bus. Manag. J. 2020, 42, 27–48. (In Chinese) [Google Scholar]
  42. Becker, R.; Henderson, V. Effects of air quality regulations on polluting industries. J. Politi. Econ. 2000, 108, 379–421. [Google Scholar] [CrossRef]
  43. Xing, Y.; Kolstad, C.D. Do lax environmental regulations attract foreign investment? Environ. Resour. Econ. 2002, 21, 1–22. [Google Scholar] [CrossRef]
  44. Zhang, P. End-of-pipe or process-integrated: Evidence from LMDI decomposition of China’s SO2 emission density reduction. Front. Environ. Sci. Eng. 2013, 7, 867–874. [Google Scholar] [CrossRef]
  45. Wang, C.; Wu, J.; Zhang, B. Environmental regulation, emissions and productivity: Evidence from Chinese COD-emitting manufacturers. J. Environ. Econ. Manag. 2018, 92, 54–73. [Google Scholar] [CrossRef]
  46. Zhou, Y.; Jiang, J.; Ye, B.; Hou, B. Green spillovers of outward foreign direct investment on home countries: Evidence from China’s province-level data. J. Clean. Prod. 2019, 215, 829–844. [Google Scholar] [CrossRef]
  47. Copeland, B.R.; Taylor, M.S. Trade, growth, and the environment. J. Econ. Lit. 2004, 42, 7–71. [Google Scholar] [CrossRef]
  48. Huang, G. PM2. 5 opened a door to public participation addressing environmental challenges in China. Environ. Pollut. 2015, 197, 313–315. [Google Scholar] [CrossRef] [PubMed]
  49. Luo, G.; Zhang, L.; Hu, X.; Qiu, R. Quantifying public health benefits of PM2.5 reduction and spatial distribution analysis in China. Sci. Total Environ. 2020, 719, 137445. [Google Scholar] [CrossRef] [PubMed]
  50. Tucker, W.G. An overview of PM2. 5 sources and control strategies. Fuel Process. Technol. 2000, 65, 379–392. [Google Scholar] [CrossRef]
  51. Liu, A.; Gu, X. Environmental regulation, technological progress and corporate profit: Empirical research based on the threshold panel regression. Sustainability 2020, 12, 1416. [Google Scholar] [CrossRef] [Green Version]
  52. Clarkson, P.M.; Li, Y.; Richardson, G.D.; Vasvari, F.P. Revisiting the relation between environmental performance and environmental disclosure: An empirical analysis. Account. Organ. Soc. 2008, 33, 303–327. [Google Scholar] [CrossRef]
  53. Schwens, C.; Eiche, J.; Kabst, R. The moderating impact of informal institutional distance and formal institutional risk on SME entry mode choice. J. Manag. Stud. 2011, 48, 330–351. [Google Scholar] [CrossRef]
  54. Hofstede, G. Dimensionalizing cultures: The Hofstede model in context. Online Read. Psychol. Cult. 2011, 2. [Google Scholar] [CrossRef]
  55. Kogut, B.; Singh, H. The effect of national culture on the choice of entry mode. J. Int. Bus. Stud. 1988, 19, 411–432. [Google Scholar] [CrossRef]
  56. 1Cheng, J.L.; Kesner, I.F. Organizational slack and response to environmental shifts: The impact of resource allocation patterns. J. Manag. 1997, 23, 1–18. [Google Scholar] [CrossRef]
  57. Yu, H.; Liao, L.; Qu, S.; Fang, D.; Luo, L.; Xiong, G. Environmental regulation and corporate tax avoidance: A quasi-natural experiments study based on China’s new environmental protection law. J. Environ. Manag. 2021, 296, 113160. [Google Scholar] [CrossRef] [PubMed]
  58. Groves, T.; Hong, Y.; McMillan, J.; Naughton, B. Autonomy and incentives in Chinese state enterprises. Q. J. Econ. 1994, 109, 183–209. [Google Scholar] [CrossRef]
  59. Bose, S.; Khan, H.Z.; Monem, R.M. Does green banking performance pay off? Evidence from a unique regulatory setting in Bangladesh. Corp. Gov. Int. Rev. 2021, 29, 162–187. [Google Scholar]
  60. Dam, L.; Scholtens, B. The curse of the haven: The impact of multinational enterprise on environmental regulation. Ecol. Econ. 2012, 78, 148–156. [Google Scholar] [CrossRef]
  61. Albrizio, S.; Kozluk, T.; Zipperer, V. Environmental policies and productivity growth: Evidence across industries and firms. J. Environ. Econ. Manag. 2017, 81, 209–226. [Google Scholar] [CrossRef]
  62. Liao, X. Public appeal, environmental regulation and green investment: Evidence from China. Energy Policy 2018, 119, 554–562. [Google Scholar] [CrossRef]
  63. Zhang, Q.; Cai, L.; Sun, X. Green Resource Integration Capacity, Greenwashing Behavior and Enterprise Performance—The Moderated Mediation Role of Dysfunctional Competition. J. Ind. Technol. Econ. 2017, 35, 141–145. [Google Scholar]
  64. Du, X.; Zeng, Q.; Zhang, Y. Talk the talk, but walk the walk: What do we know about marital demography and corporate greenwashing? J. Manag. Organ. 2021, 1–42. [Google Scholar] [CrossRef]
  65. Buckley, P.J.; Doh, J.P.; Benischke, M.H. Towards a renaissance in international business research? Big questions, grand challenges, and the future of IB scholarship. J. Int. Bus. Stud. 2017, 48, 1045–1064. [Google Scholar] [CrossRef] [Green Version]
  66. Ren, S.; He, D.; Zhang, T.; Chen, X. Symbolic reactions or substantive pro-environmental behaviour? An empirical study of corporate environmental performance under the government’s environmental subsidy scheme. Bus. Strategy Environ. 2019, 28, 1148–1165. [Google Scholar] [CrossRef]
  67. Vayssières, J.F.; Korie, S.; Coulibaly, O.; Van Melle, C.; Temple, L.; Arinloye, D. The mango tree in central and northern Benin damage caused by fruit flies (Diptera Tephritidae) and computation of economic injury level. Fruits 2009, 64, 207–220. [Google Scholar] [CrossRef]
  68. De Freitas Netto, S.V.; Sobral, M.F.F.; Ribeiro, A.R.B.; Da Luz Soares, G.R. Concepts and forms of greenwashing: A systematic review. Environ. Sci. Eur. 2020, 32, 19. [Google Scholar] [CrossRef] [Green Version]
  69. Harlan, T. Green development or greenwashing? A political ecology perspective on China’s green Belt and Road. Eurasian Geogr. Econ. 2021, 62, 202–226. [Google Scholar] [CrossRef]
  70. Conner, K.R.; Prahalad, C.K. A resource-based theory of the firm: Knowledge versus opportunism. Organ. Sci. 1996, 7, 477–501. [Google Scholar] [CrossRef]
  71. Du, M.; Boateng, A.; Newton, D. The impact of state ownership, formal institutions and resource seeking on acquirers’ returns of Chinese M&A. Rev. Quant. Financ. Account. 2016, 47, 159–178. [Google Scholar]
  72. Xiao, C.; Wang, Q.; van Donk, D.P.; van der Vaart, T. When are stakeholder pressures effective? An extension of slack resources theory. Int. J. Prod. Econ. 2018, 199, 138–149. [Google Scholar] [CrossRef]
Figure 1. Research framework.
Sustainability 14 02794 g001
Table 1. Distribution of firms by year.
YearPanel A: All the FirmsPanel B: Internationalized FirmsPanel C: Noninternationalized Firms
200710010
2008512110402
2009547127420
2010621133488
2011683179504
2012706210496
2013719234485
2014735266469
2015760309451
2016793346447
2017807383424
2018786396390
Total samples767926934986
Table 2. Greenwashing indicators.
CodeEnvironmental ItemsDefinition or Explanations
1Environmental strategy and planningCompany environmental protection plan or system construction
2Staff trainingTraining activities to enhance staff’s environmental awareness
3Special fund planFuture investment in environmental protection
4Establishment of the environmental protection departmentThe company establishes an independent environmental protection department
5Environmental risk analysisConsider possible environmental hazards in production and operation
6Environmental auditing Evaluate, punish, or reward projects
7Participation of environmental organizationsCooperation with environmental organizations
8Environmental charityEnvironmental charity donation or charity activity
9Green business developmentExpand the company’s green business
10Process improvementImprovement of production process and other aspects
11Industrial waste discharge managementThe company’s efforts in reducing and managing industrial waste
12Energy saving and efficiency increasingSave energy and improve production efficiency
13Technological developmentClean technology research and development
14Pollution monitoring and control Monitoring of pollutant concentration
15Green workingElectronic administration
16Ecological restorationEcological restoration of land, water, mines, and other damages
17Green marketProducts are certified green
18Environmental cost accountingFinancial accounting after environmental management
19Use of clean energyUse wind, water, solar power, and so on.
Table 3. Full-sample regression of domestic driving factors.
(1)(2)(3)
Model 2Model 3Model 4
VariablesGreenwaGreenwaGreenwa
H1lnArea0.0819 ***0.0804 ***0.0810 ***
(0.0232)(0.0251)(0.0215)
H2lnp25m_lnArea−0.0697 **
(0.0286)
lnp25m0.04410.04720.0492
(0.0604)(0.0554)(0.0597)
H3media_lnArea −0.0130
(0.0181)
media−0.172 ***−0.168 ***−0.168 ***
(0.0238)(0.0238)(0.0246)
H4HHI_A_lnArea −0.0291
(0.112)
HHI_A−0.173−0.183−0.186
(0.165)(0.163)(0.164)
ControlsYESYESYES
Observations251225122512
R-squared0.0660.0650.065
Note: D–K standard errors in parentheses, *** p < 0.01, ** p < 0.05. “Yes” means that regression results of control variables including year and industry are omitted because of limited space.
Table 4. Heterogeneity regression of moderating effects of environmental regulations.
(1)(2)(3)
EastCentralWest
Model 2Model 2Model 2
VariablesGreenwaGreenwaGreenwa
H1lnArea0.02850.204 ***0.108 **
(0.0242)(0.0551)(0.0414)
H2lnp25m_lnArea0.01330.381 *−0.445 ***
(0.0465)(0.186)(0.0943)
lnp25m0.0441−0.08100.597 ***
0.02850.204 ***0.108 **
ControlsYESYESYES
Observations1476349687
R-squared0.0840.2020.109
Note: D–K standard errors in parentheses, *** p < 0.01, ** p < 0.05, * p < 0.1. “Yes” means that regression results of control variables including year and industry are omitted because of limited space.
Table 5. Heterogeneous regression of the moderating effects of public pressure.
(1)(2)(3)(5)(6)
EastCentralWestSOESNSOES
Model 3Model 3Model 3Model 3Model 3
VariablesGreenwaGreenwaGreenwaGreenwaGreenwa
H1lnArea0.02410.282 ***0.150 ***0.0731 ***0.0762 **
(0.0361)(0.0573)(0.0263)(0.0229)(0.0320)
H3media_lnArea−0.0477 **0.123 *0.006400.0193−0.0581 **
(0.0155)(0.0601)(0.0438)(0.0117)(0.0211)
media−0.141 ***−0.227 *−0.148 ***−0.0996 ***−0.225 ***
(0.0255)(0.111)(0.0421)(0.0312)(0.0430)
ControlsYESYESYESYESYES
Observations147634968713861126
R-squared0.0850.1960.0950.0710.100
Note: D–K standard errors in parentheses, *** p < 0.01, ** p < 0.05, * p < 0.1. “Yes” means that regression results of control variables including year and industry are omitted because of limited space.
Table 6. Heterogeneity regression of industry pressure moderating effect by region and property rights.
(1)(2)(3)(4)(5)(6)
Eastern SOESCentral SOESWestern SOESEastern NSOESCentral NSOESWestern NSOES
Model 4Model 4Model 4Model 4Model 4Model 4
VariablesGreenwaGreenwaGreenwaGreenwaGreenwaGreenwa
H1lnArea0.04400.180 *−0.00702−0.02850.285 **0.344 ***
(0.0374)(0.0950)(0.0598)(0.0203)(0.113)(0.101)
H4HHI_A_lnArea0.647 ***−0.512−0.747−0.399 **3.368 ***−0.248
(0.0932)(0.408)(0.514)(0.155)(0.903)(0.333)
HHI_A0.0188−1.459 **1.051 ***0.0103−1.984 **−1.778 ***
(0.170)(0.618)(0.231)(0.187)(0.684)(0.230)
ControlsYESYESYESYESYESYES
Observations823210353653139334
R-squared0.1420.2630.0980.1110.3670.270
Note: D–K standard errors in parentheses, *** p < 0.01, ** p < 0.05, * p < 0.1. “Yes” means that regression results of control variables including year and industry are omitted because of limited space.
Table 7. Heckman first-stage results.
(1)(2)(3)(4)(5)(6)
All SampleSOESNSOESEastMiddleWest
VariablesEarthEarthEarthEarthEarthEarth
lnp25m−0.0324−0.08320.09290.1050.00232−0.108
(0.0445)(0.0598)(0.0693)(0.0655)(0.0953)(0.0994)
AmountCOST−0.0561−0.0271−0.418−0.703−1.9574.634 ***
(0.200)(0.744)(0.633)(0.583)(1.640)(1.112)
HHI_A−0.0545−0.08040.01280.0895−0.776 **−0.297
(0.0989)(0.132)(0.154)(0.121)(0.336)(0.219)
media0.222 ***0.216 ***0.149 ***0.168 ***0.531 ***0.200 ***
(0.0313)(0.0447)(0.0462)(0.0401)(0.0989)(0.0622)
ManFee−0.05080.618 ***−0.1400.0653−0.519−0.0700
(0.0456)(0.180)(0.101)(0.0887)(0.334)(0.0799)
lnTA0.272 ***0.323 ***0.306 ***0.233 ***0.240 ***0.404 ***
(0.0130)(0.0178)(0.0243)(0.0165)(0.0360)(0.0296)
fapatent0.000526−0.0001640.0628 ***−0.0004680.008100.0977 ***
(0.00136)(0.00130)(0.0168)(0.00128)(0.0108)(0.0230)
top1−0.00675 ***−0.00786 ***−0.00148−0.00410 ***−0.0148 ***−0.00808 ***
(0.00104)(0.00142)(0.00160)(0.00143)(0.00272)(0.00201)
SharStock0.0122 ***0.0307 **0.00608 ***0.0128 ***0.00002 ***0.0177 ***
(0.00183)(0.0150)(0.00203)(0.00258)(0.00563)(0.00342)
itang−0.573 ***−0.709 ***0.200−0.0153−0.769−1.278 ***
(0.207)(0.241)(0.440)(0.290)(0.567)(0.380)
ROAA0.272 **0.1140.3790.299 *−0.7460.135
(0.138)(0.0873)(0.246)(0.166)(0.583)(0.450)
Observations758344143169414614172020
Prob>chi20.00000.00000.00000.00000.00000.0000
Pseudo R20.11580.12900.12690.09790.14830.2030
LR chi21114.97708.37523.53528.76234.68525.78
Note: *** p < 0.01, ** p < 0.05, * p< 0.1.
Table 8. Robustness test of the Heckman method and 2SLS for the full sample of domestic driving factors.
(1)(2)(3)(4)(5)(6)
Heckman2SLS
Model 2Model 3Model 4Model 2Model 3Model 4
VariablesGreenwaGreenwaGreenwaGreenwaGreenwaGreenwa
H1lnArea0.0798 ***0.0787 ***0.0791 ***0.083 **0.076 **0.082 **
(0.0222)(0.0232)(0.0204)(0.034)(0.034)(0.034)
H2lnp25m_lnArea−0.0747 ** −0.161
(0.0310) (0.113)
lnp25m0.05730.05960.06150.1190.1210.101
(0.0562)(0.0514)(0.0550)(0.077)(0.077)(0.077)
H3media_lnArea −0.0104 −0.007
(0.0188) (0.046)
media−0.254 **−0.243 **−0.245 **−0.234 ***−0.219 **−0.223 ***
(0.0824)(0.0842)(0.0826)(0.087)(0.088)(0.086)
H4HHI_A_lnArea −0.0237 0.191
(0.111) (0.205)
HHI_A−0.148−0.162−0.164−0.206−0.206−0.257
(0.181)(0.180)(0.181)(0.156)(0.156)(0.156)
imr−0.659−0.603−0.618−0.455−0.384−0.387
(0.525)(0.539)(0.520)(0.610)(0.614)(0.609)
ControlsYESYESYESYESYESYES
Observations251225122512204920342050
R-squared0.0730.0720.0720.0760.0720.073
Underidentification test 811875.21216
p-Value 000
Weak identification test 661.7757.21474
Note: D–K standard errors in parentheses, *** p < 0.01, ** p < 0.05. “Yes” means that regression results of control variables including year and industry are omitted because of limited space.
Table 9. Heterogeneity robustness test of environmental regulation and public pressure under the 2SLS method.
(1)(2)(3)(4)(5)(6)(7)(8)
Environmental RegulationPublic Pressure
EastCentralWestEastCentralWestSOESNSOES
Model 2Model 2Model 2Model 3Model 3Model 3Model 3Model 3
VariablesGreenwaGreenwaGreenwaGreenwaGreenwaGreenwaGreenwaGreenwa
H1lnArea0.0200.1650.1150.0100.239 *0.188 **0.0560.062
(0.042)(0.116)(0.080)(0.042)(0.135)(0.079)(0.040)(0.064)
H2/H3lnp25m_lnArea/media_lnArea0.0150.741 **−0.867 ***−0.0360.0020.0110.045−0.112
(0.141)(0.298)(0.249)(0.048)(0.180)(0.094)(0.052)(0.094)
lnp25m0.157−0.1350.833 ***−0.267 **−0.276−0.206−0.359 ***−0.126
(0.104)(0.181)(0.179)(0.108)(0.366)(0.186)(0.118)(0.147)
imr−0.9270.154−1.571−1.045−0.057−0.551−1.992 **0.533
(0.756)(2.471)(1.233)(0.756)(2.482)(1.261)(0.860)(1.032)
ControlsYESYESYESYESYESYESYESYES
Observations121027556411962765621138896
R-squared0.1020.2050.1170.1000.1960.0930.0850.122
Underidentification test155.1133.6193.8136.387.04268567.1267.1
p-Value00000000
Weak identification test185.2116.214013456.89243550.7184.2
Note: Robust standard errors in parentheses, *** p < 0.01, ** p < 0.05, * p < 0.1. “Yes” means that regression results of control variables including year and industry are omitted because of limited space.
Table 10. Heterogeneity robustness test of industrial pressure under the 2SLS method by regions and property rights.
(1)(2)(3)(4)(5)(6)
Eastern SOESCentral SOESWestern SOESEastern NSOESCentral NSOESWestern NSOES
Model 4Model 4Model 4Model 4Model 4Model 4
VariablesGreenwaGreenwaGreenwaGreenwaGreenwaGreenwa
H1lnArea0.0250.181−0.064−0.0240.464 **0.525 ***
(0.045)(0.169)(0.101)(0.076)(0.215)(0.136)
H4HHI_A_lnArea0.860 ***0.530−2.005 **−0.3993.8860.615
(0.274)(1.075)(0.826)(0.409)(2.429)(0.778)
HHI_A0.060−2.428 **0.562−0.034−2.334 *−2.005 ***
(0.230)(1.195)(0.519)(0.337)(1.289)(0.408)
imr−2.529 **−1.180−3.988 **0.122−4.5610.958
(1.085)(4.145)(2.007)(1.268)(4.718)(2.077)
ControlsYESYESYESYESYESYES
Observations680170294530106270
R-squared0.1660.2770.1150.1360.3310.286
Underidentification test4168.76429.47279.259.02134.8
p-Value00.003070.0000.0000.0000.000
Weak identification test512.913.3821.99278.948.37120.2
Note: Robust standard errors in parentheses, *** p < 0.01, ** p < 0.05, * p < 0.1. “Yes” means that regression results of control variables including year and industry are omitted because of limited space.
Table 11. Full-sample regression robustness test of changing moderating variables.
(1)(2)(3)
Model 2Model 3Model 4
VariablesGreenwaGreenwaGreenwa
H1lnArea0.0820 ***0.0814 ***0.0821 ***
(0.0168)(0.0207)(0.0172)
H2ECI_lnArea−0.0133
(0.0448)
ECI−0.0103−0.0119−0.0108
(0.0326)(0.0358)(0.0356)
H3lnNumPress_lnArea −0.0106
(0.0214)
lnNumPress−0.254 ***−0.250 **−0.254 ***
(0.0774)(0.0835)(0.0792)
H4HHI_C_lnArea 0.0275
(0.201)
HHI_C−0.0428−0.0423−0.0360
(0.116)(0.115)(0.154)
imr−0.553−0.538−0.559
(0.482)(0.506)(0.476)
ControlsYESYESYES
Observations251225122512
R-squared0.0650.0650.065
Note: D–K standard errors in parentheses, *** p < 0.01, ** p < 0.05. “Yes” means that regression results of control variables including year and industry are omitted because of limited space.
Table 12. Heterogeneity robustness test of environmental regulations and public pressure for changing moderating variables.
(1)(2)(3)(4)(5)(6)(7)(8)
Environmental RegulationPublic Pressure
EastCentralWestEastCentralWestSOESNSOES
Model 2Model 2Model 2Model 3Model 3Model 3Model 3Model 3
VariablesGreenwaGreenwaGreenwaGreenwaGreenwaGreenwaGreenwaGreenwa
H1lnArea0.01250.370 ***0.185 ***0.02360.281 ***0.140 ***0.0603 ***0.0796 **
(0.0192)(0.105)(0.0432)(0.0321)(0.0651)(0.0246)(0.0172)(0.0327)
H2/H3ECI_lnArea/lnNumPress_lnArea−0.0914 **0.899 **−0.0977−0.0510 **0.1020.02070.0316 **−0.0704 ***
(0.0337)(0.285)(0.0611)(0.0176)(0.0597)(0.0483)(0.0105)(0.0211)
ECI−0.134 ***0.2060.148−0.253 *−0.548 **−0.264 **−0.352 **−0.191 **
(0.0201)(0.214)(0.0909)(0.114)(0.230)(0.0939)(0.157)(0.0638)
imr−0.875−2.262−0.469147634968713861126
(0.616)(1.558)(0.500)0.0900.1870.0850.0720.084
ControlsYESYESYESYESYESYESYESYES
Observations1476349687147634968713861126
R-squared0.0900.2160.0860.0900.1870.0850.0720.084
Note: *** p < 0.01, ** p < 0.05, * p< 0.1.
Table 13. Heterogeneity robustness test of environmental regulation.
(1)(2)(3)(4)
EastCentralWestAll Sample
Model 2Model 2Model 2Model 2
VariablesGreenwaGreenwaGreenwaGreenwa
H1lnArea0.0596 **0.216 ***0.113 **0.0844 ***
(0.0255)(0.0585)(0.0421)(0.0235)
H2Prov_lnArea−0.146 ***0.312 *−0.308 ***−0.0709 *
(0.0374)(0.170)(0.0368)(0.0338)
Prov0.0251−0.1420.433 **−0.0589
(0.0270)(0.236)(0.142)(0.0511)
ControlsYESYESYES
Observations14763566882520
R-squared0.0850.2090.0920.066
Note: D–K standard errors in parentheses, *** p < 0.01, ** p < 0.05, * p < 0.1. “Yes” means that regression results of control variables including year and industry are omitted because of limited space.
Table 14. Heterogeneity robustness test of industry pressure for changing moderating variables by regions and property rights.
(1)(2)(3)(4)(5)(6)
Eastern SOESCentral SOESWestern SOESEastern NSOESCentral NSOESWestern NSOES
Model 4Model 4Model 4Model 4Model 4Model 4
VariablesGreenwaGreenwaGreenwaGreenwaGreenwaGreenwa
H1lnArea0.02200.157−0.0232−0.02410.302 **0.297 ***
(0.0303)(0.112)(0.0707)(0.0212)(0.103)(0.0868)
H4HHI_C_lnArea1.033 ***−1.107 *−0.465−0.820 ***5.736 ***−0.702 *
(0.195)(0.553)(0.433)(0.186)(1.474)(0.345)
HHI_C0.0629−2.028 **1.685 ***−0.0257−2.450 **−2.204 ***
(0.149)(0.826)(0.381)(0.342)(0.908)(0.349)
imr−2.214 **0.484−2.723−0.132−2.3732.354 **
(0.867)(2.022)(3.012)(0.488)(3.385)(0.806)
ControlsYESYESYESYESYESYES
Observations823210353653139334
R-squared0.1570.2460.1260.1110.3900.207
Note: D–K standard errors in parentheses, *** p < 0.01, ** p < 0.05, * p < 0.1. “Yes” means that regression results of control variables including year and industry are omitted because of limited space.
Publisher’s Note: MDPI stays neutral with regard to jurisdictional claims in published maps and institutional affiliations.

