Article

Random Vibration Analysis of a Coupled Aircraft/Runway Modeled System for Runway Evaluation

1
Key Laboratory of Road and Traffic Engineering of the Ministry of Education, Tongji University, Shanghai 201804, China
2
Key Laboratory of Infrastructure Durability and Operation Safety in Airfield of CAAC, Tongji University, Shanghai 201804, China
*
Author to whom correspondence should be addressed.
Sustainability 2022, 14(5), 2815; https://doi.org/10.3390/su14052815
Submission received: 10 February 2022 / Revised: 25 February 2022 / Accepted: 25 February 2022 / Published: 28 February 2022

Abstract

:
Runway roughness is one of the most critical performance factors for runway evaluation, which directly impacts airport operation safety and pavement preservation cost. Properly evaluated runway roughness could optimize the decision-making process for runway preservation and therefore reduce the life cycle cost of the runway pavement asset. In this paper, the excitation effect of runway roughness is analyzed using a coupled aircraft/runway system. The coupled system is composed of a two degrees-of-freedom (2-DOF) aircraft model and a typical asphalt runway structure model established under runway roughness random excitation in this work. The dynamic differential equations for the coupled system are derived based on D’Alembert’s principle. The system’s vibration responses are determined via the pseudo excitation method and three response laws, i.e., the center of gravity acceleration (CGA), the dynamic load coefficient (DLC) of the landing gear, and the runway structural displacement, which are investigated under different modes. The results show that the first-order mode of the runway structure, vertical deformation, is the most significant of the four modes. Moreover, uneven excitation has a significant effect on the distribution of the aircraft’s vibration response. Compared with a single aircraft system, the developed coupled aircraft/runway system has different dynamic responses, and the degree of difference depends on the taxiing speed. The coupled effect on the CGA increases significantly with an increase in speed, with up to a 7.3% percentage difference. The coupled effect on the DLC first increases and then decreases as the aircraft speed increases, reaching a maximum of about 6% percentage difference at 120 km/h.

1. Introduction

Runway pavement is a civil structure that allows an aircraft to taxi, take off, and land. Runway roughness is one of the most critical performance indicators for runway evaluation, which directly impacts airport operation safety and pavement preservation cost [1]. Properly evaluated runway roughness could optimize the decision-making process inside APMS and therefore reduce the life cycle cost of the runway pavement asset [2]. Airport authorities, aircraft manufacturers, airlines, etc., are all rightly concerned about the effects of runway roughness on safety, operations, and the service life of both aircraft and runways [3].
Most scholars have researched single aircraft vibration systems and runway structure vibration systems separately, that is, in terms of the vibration response of a single system. Typically, researchers have used runway surface roughness as the model input and investigated only the response output of the single aircraft system, without considering the dynamic effect of the runway system’s vibration on the aircraft system. For example, Durán and Júnior developed an airport pavement roughness evaluation method based on cockpit acceleration and center of gravity vertical acceleration [4]. Using a B727 simulator, Kuncas proposed a new evaluation runway roughness index based on aircraft vibration data [5]. Gerardi and McNerney took the temporary construction of ramps as an uneven excitation input and evaluated the effect on aircraft ride quality [6]. Major et al. identified pavement roughness using aircraft vibration response data [7]. Sivakumar and Haran researched the response laws of active landing gear under random uneven excitation [8]. Liu et al. established and validated a B737-800 virtual prototype model under runway unevenness and developed a new runway roughness evaluation index that is superior to both the International Roughness Index (IRI) and the Boeing Bump Index [9]. Based on aircraft vibration response spectra, Ling et al. demonstrated that the IRI is not applicable to runway roughness evaluations [10]. Tian et al. optimized IRI model parameters for sustainable runways [11]. In addition, researchers have simplified the aircraft model as an external excitation load on the runway system to analyze the vibration response and deformation characteristics of the runway structure. For example, Ruan and Lü analyzed the stress distribution law of the airport runway subgrade under dynamic aircraft loading [12]. Focusing their research on unsaturated runways, Tang et al. researched vibration characteristics under moving aircraft loads [13].
Pavement roughness excitation applied to the aircraft tire is actually a combination of the actual roughness sequence at that point and the vertical displacement of that point under the aircraft load. The aircraft vibrates after being excited by the uneven sequence of the runway. Simultaneously, the surface layer of the runway pavement structure is subjected to the corresponding dynamic load, thus causing a vibration response from the runway structure, which in turn affects the vibration of the aircraft. Therefore, the aircraft and runway structure form a mutually coupled dynamical system. Given the operational considerations of new-generation large aircraft, the weight borne by the aircraft landing gear has increased, which in turn has intensified the dynamic interaction between the aircraft and runway, thereby making the coupled aircraft/runway effect increasingly more significant.
In order to quantify the effect of the coupled aircraft/runway system on vibration responses, first, the aircraft mechanical model and runway structure mechanical model are established in this paper, and then, based on the displacement compatibility principle, the coupled aircraft/runway system is established. Second, using the derived system vibration equation, the system’s vibration response is quantified by means of the pseudo excitation method (PEM). Finally, the response laws of the coupled aircraft/runway system in terms of displacement, acceleration, and dynamic load coefficient (DLC) are used to analyze the effects of the different excitation parameters and pavement structures. The results of this work are significant for runway roughness evaluation and runway structure design.

2. Methodology

2.1. Two Degrees-of-Freedom Aircraft Model

Figure 1 presents the two degrees-of-freedom (2-DOF) aircraft model with the main landing gear. M s is the sprung mass, which is the mass distributed from the fuselage to the main landing gear; M t is the unsprung mass, which is the mass of the tire and the landing gear’s outer cylinder; k s and c s are the stiffness coefficient and the damping coefficient of the landing gear, respectively; k t and c t are the stiffness coefficient and the damping coefficient of the tire, respectively; Z s and Z t are the vertical displacements of the sprung and unsprung mass, respectively; q t is the runway unevenness excitation at the point where the tire touches the ground; and F s is the lift force of the aircraft while taxiing on the runway.
Based on D’Alembert’s principle, the dynamic differential equation for the 2-DOF model of the aircraft under uneven excitation is described in the form of a matrix, as shown in Equation (1):
M Z ¨ + C Z ˙ + K Z = P
where the mass matrix M =   M s 0 0 M t ; the damping matrix C =   c s c s c s c s + c t ; the stiffness matrix K =   k s k s k s k s + k t ; the displacement array Z =   Z s Z t ; and the excitation matrix P =   F s k t q t + c t q ˙ t .

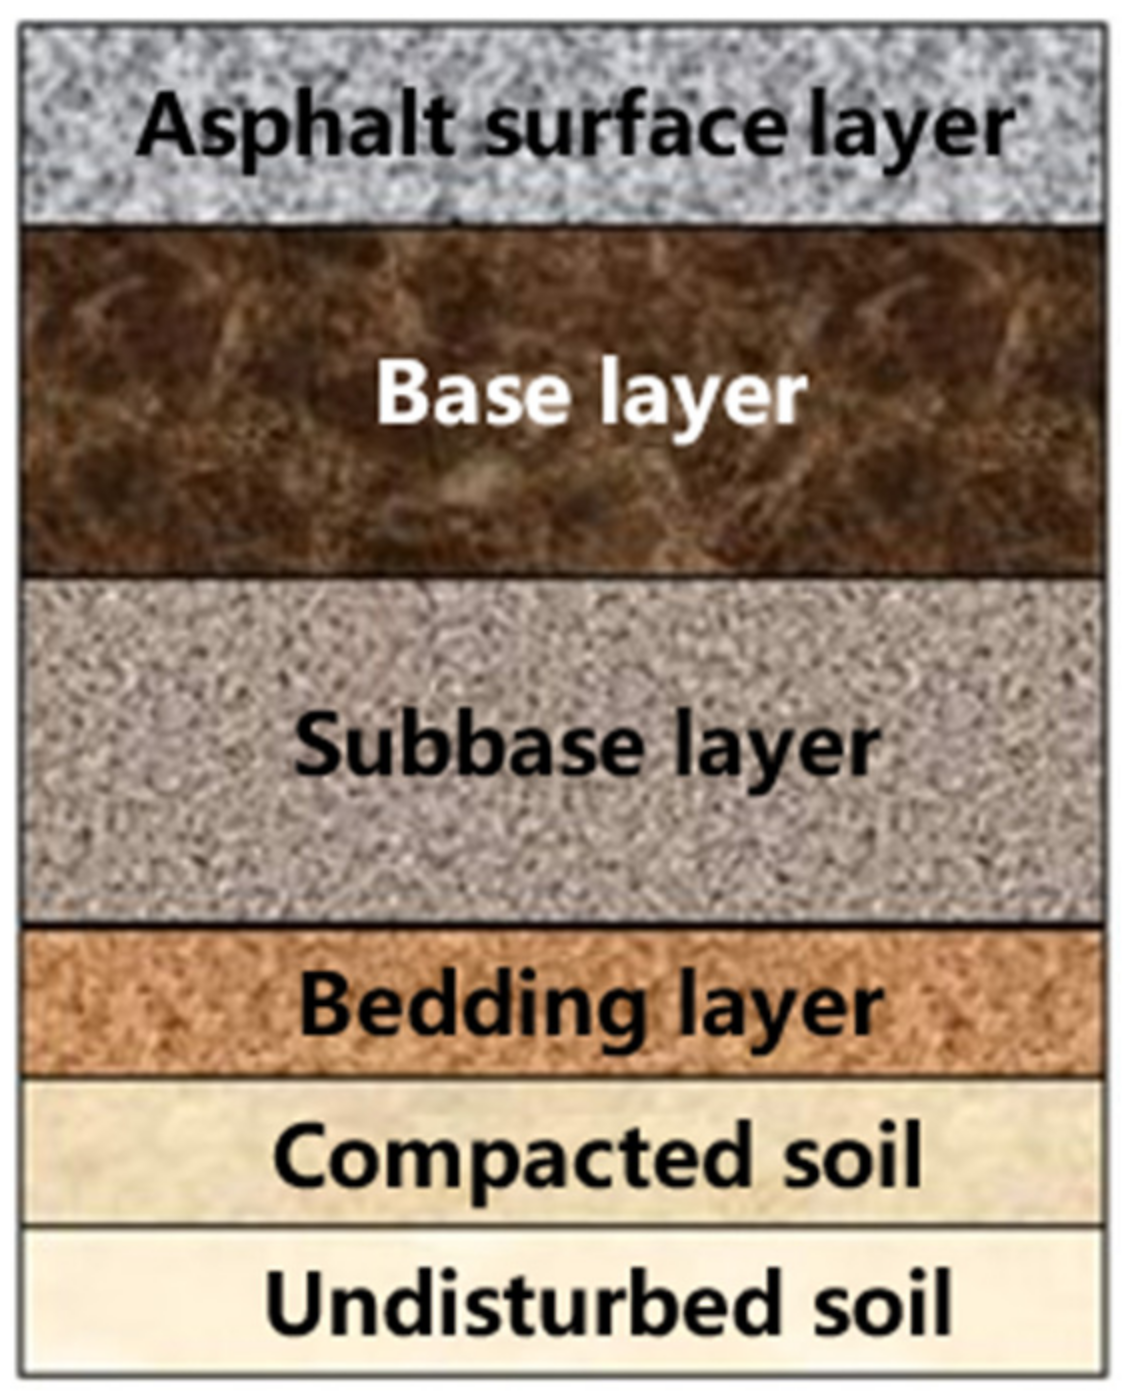
2.2. Vibration Model of Asphalt Runway Structural System

The structure of an asphalt runway generally includes a surface layer, semi-rigid base layer, sub-base layer, bedding layer, soil base, etc., and typically is simplified as an elastic layered system, as shown in Figure 2.
Owing to the effects of aircraft loading and the complexity of boundary conditions, deriving a dynamic analytical solution of the structural system using elastic layered system theory is very difficult, and currently, most pavement analysis is undertaken using finite element software. In this paper, the runway structure is discretized into a multiple degrees-of-freedom system via finite elements, and the vibration model of the asphalt pavement structural system is established using the vibration superposition method. The differential equation for the motion for the discretized runway structure is established as Equation (2):
M δ ¨ + C δ ˙ + K δ = P
where δ , { δ ˙ } , and { δ ¨ } are the displacement, velocity, and acceleration response vectors of the structural model, respectively. These three response vectors can be generated at any point based on the vibration superposition of the structure, as shown in Equations (3)–(5):
δ = ϕ A
δ ˙ = ϕ A ˙
δ ¨ = ϕ A ¨
where ϕ is the matrix that is composed of each vibration order of the pavement structure system; and A , { A ˙ } , and { A ¨ } are the corresponding generalized coordinates, respectively.
By multiplying the transposition { ϕ n } T of the nth vibration mode vector, Equation (6) is obtained.
ϕ n T m ϕ n { A ¨ } + ϕ n T c ϕ n { A ˙ } + ϕ n T k ϕ n A   = ϕ n T p
According to the orthogonal properties of the vibration modes, the direct multiplication of the vibration modes for different orders is 0, and the multiplication of the vibration mode for the same order is the generalized physical quantity, which can be obtained as shown in Equations (7) and (8).
ϕ m T m ϕ n   = 0 ,   m n
ϕ n T m ϕ n   = M n
Similarly, Equations (9) and (10) are obtained.
ϕ n T c ϕ n   = C n
ϕ n T k ϕ n   = K n
The modal equation of the nth-order vibration mode of the structural system is shown in Equation (11).
M n A ¨ + C n A ˙ + K n A = P n
where M n , C n , and K n represent the generalized mass, generalized damping, and generalized stiffness of the nth-order vibration mode, respectively; P n is the generalized force that corresponds to the nth-order vibration mode.
Via orthogonal regularization of the modes of each order, Equation (12) can be obtained:
A ¨ n + 2 ξ n ω n A n + ω n 2 A n = P n / M n       n = 1 , 2 , , N
where ω n is the inherent frequency of the nth-order vibration mode; ξ n is the damping ratio of the nth-order vibration mode; and A n is the corresponding nth-order generalized coordinate.
Using the vibration superposition method, an equation with multiple freedom degrees in the finite element can be realized. Practice has shown that, because the response of an asphalt runway structure to aircraft loading is controlled mainly by a low-order vibration mode, the vibration equation that is established using the superposition of the first N-order vibration mode can achieve engineering accuracy.

2.3. Dynamics Analysis of Coupled Aircraft/Runway System

2.3.1. Vertical Displacement of Coupled System

Uneven excitation applied to the coupled system includes the uneven sequence of the runway itself and the vertical displacement of the asphalt surface layer under aircraft loading. According to the displacement compatibility principle, the vertical vibration displacement at any point x in the longitudinal direction of the runway can be expressed as Equation (13):
y x   = n = 1 N A n ϕ n x
where x is longitudinal location; y is vertical vibration displacement at any point x.
The corresponding generalized force P n can be expressed as Equation (14).
P n = ϕ n x p t   = ϕ n x k t Z t q t + c t Z ˙ t q ˙ t
It can be further expressed as Equation (15).
P n = ϕ n x k t Z t q x n = 1 N A n ϕ n x + c t Z ˙ t q ˙ x n = 1 N A ˙ n ϕ n x

2.3.2. Interaction Equilibrium Equations

The interaction equilibrium equation set for the coupled system with two degrees-of-freedom is shown here as Equation (16).
M s 0 0 M t Z ¨ s Z ¨ t + c s c s c s c s + c t Z ˙ s Z ˙ t + k s k s k s k s + k t Z s Z t = F s [ k t ( Z t q ( x ) n = 1 N A n ϕ n ( x ) ) + c t ( Z ˙ t q ˙ ( x ) n = 1 N A ˙ n ϕ n ( x ) ) ] A ¨ n + 2 ξ n ω n A n + ω n 2 A n         = 1 M n { ϕ n x [ k t ( Z t q ( x ) n = 1 N A n ϕ n x ) + c t ( Z ˙ t q ˙ ( x )         n = 1 N A ˙ n ϕ n x ) ] }
Equation (16) has N + 2 equations, n = 1, 2, 3, …, N, and only uses the superposition of the first few modes for the control effect. For programming convenience, the standard form of the dynamic balance equation is obtained after collation, shown as Equation (17).
M U ¨ + C U ˙ + K U = P M = M 1 M 2 M n M s M t     C = C 11 C 12 C 1 n 0 ϕ 1 ( x ) c t C 22 C 2 n 0 ϕ 2 ( x ) c t C n n 0 ϕ n ( x ) c t c s c s c s c s + c t C i j = 2 ξ i ω i M i + ϕ i x c t ϕ i x     i = j ϕ i x c t ϕ j x                                       i j     i , j = 1 , 2 , , n K = K 11 K 12 K 1 n 0 ϕ 1 ( x ) k t K 22 K 2 n 0 ϕ 2 ( x ) k t K n n 0 ϕ n ( x ) k t k s k s k s k s + k t K i j = ω i 2 M i + ϕ i x k t ϕ i x               i = j ϕ i x k t ϕ j x                                         i j     i , j = 1 , 2 , , n P = ϕ 1 ( x ) [ k t q ( x ) + c t q ˙ ( x ) ] ϕ 2 ( x ) [ k t q ( x ) + c t q ˙ ( x ) ] ϕ n ( x ) [ k t q ( x ) + c t q ˙ ( x ) ] F s k t q ( x ) + c t q ˙ ( x )     U = A 1 A 2 A n Z s Z t

2.3.3. Response Output

The uneven excitation of the runway affects both the vibration of the aircraft and the vibration of the runway structure. Therefore, the vibration responses that are output by the aircraft/runway coupled system include the center of gravity acceleration (CGA) where CGA = Z s ¨ , the dynamic load coefficient (DLC) of the landing gear where DLC = Z t q t k t + Z ˙ t q ˙ t c t M t g , and the runway structural displacement (RSD) where R S D = ϕ A .

2.3.4. Pseudo Excitation Method Used for Calculations

The stochastic vibration responses of the system under uneven excitation can be found via numerical simulation [14]. The PEM is adopted in this paper, which is an exact and efficient random vibration method developed by Lin et al. [15]. The PEM converts stationary random vibrations into simple harmonic vibrations, as shown in Equation (18) [16]. Preserving the theoretical accuracy and significantly simplifying the calculation steps are the most important advantages of this method:
q ˜ f , t = e i 2 π f t G q f
where   q ˜ f , t is virtual excitation; and G q f is the power spectral density (PSD) model for asphalt runway roughness; e is a constant of nature; i is an imaginary number; and f is the frequency.
Under virtual excitation, the virtual response of the whole system is calculated according to Equation (19):
y ˜ f , t = H f q ˜ f , t
where y ˜ f , t is the virtual response and H f is the frequency response function.
Therefore, based on the relationship between the actual response excitation and the virtual response excitation, the PSD function of the actual response is derived as Equation (20):
S y f = y ˜ f , t y ˜ f , t
where S y f is PSD function of the actual response and y ˜ f , t is the conjugate function of y ˜ f , t .
The corresponding variance is calculated using Equation (21):
δ p 2 = f 1 f 2 S y f d f
where δ p 2 is variance and f 1 , f 2 are the upper and lower frequencies of the integral.

3. Application Scenarios

3.1. Aircraft Model Parameters

Upon the retirement of A380, the B747 becomes the mainstream F-class aircraft. Therefore, taking the B747 as the aircraft model case, the main landing gear parameters of the aircraft used in the 2-DOF model are selected as shown in Table 1.

3.2. Asphalt Pavement Runway Model Parameters

Based on the selected aircraft, a matching 4F airport runway should be adopted. With the development of the aviation industry, the 4F runway becomes the construction trend, so a 4F runway in North China is selected as the runway case. The parameters of the pavement structure are shown in Table 2.

3.3. Runway Uneven Excitation Input

Because an aircraft is sensitive to both long- and short-wave unevenness of the runway, the excitation form of the unevenness of the runway should be different from that of a road surface [17]. Qian et al. proposed spectrum parameters for runway roughness evaluation via measurements of full-width band data obtained for a Chinese airport runway [18,19]. Adopting the Sussman model as the PSD model for asphalt runway roughness, the power spectrum for runway roughness is shown in Equation (22):
G q n   = C α ω + n ω ,   0 < n < +
where n is the spatial frequency of runway roughness; G q n is the power spectrum function of runway roughness; and α , C, and ω are the model parameters, which are taken initially as C = 0.1, α   = 0.0009, and ω   = 2.24.

4. Results and Discussion

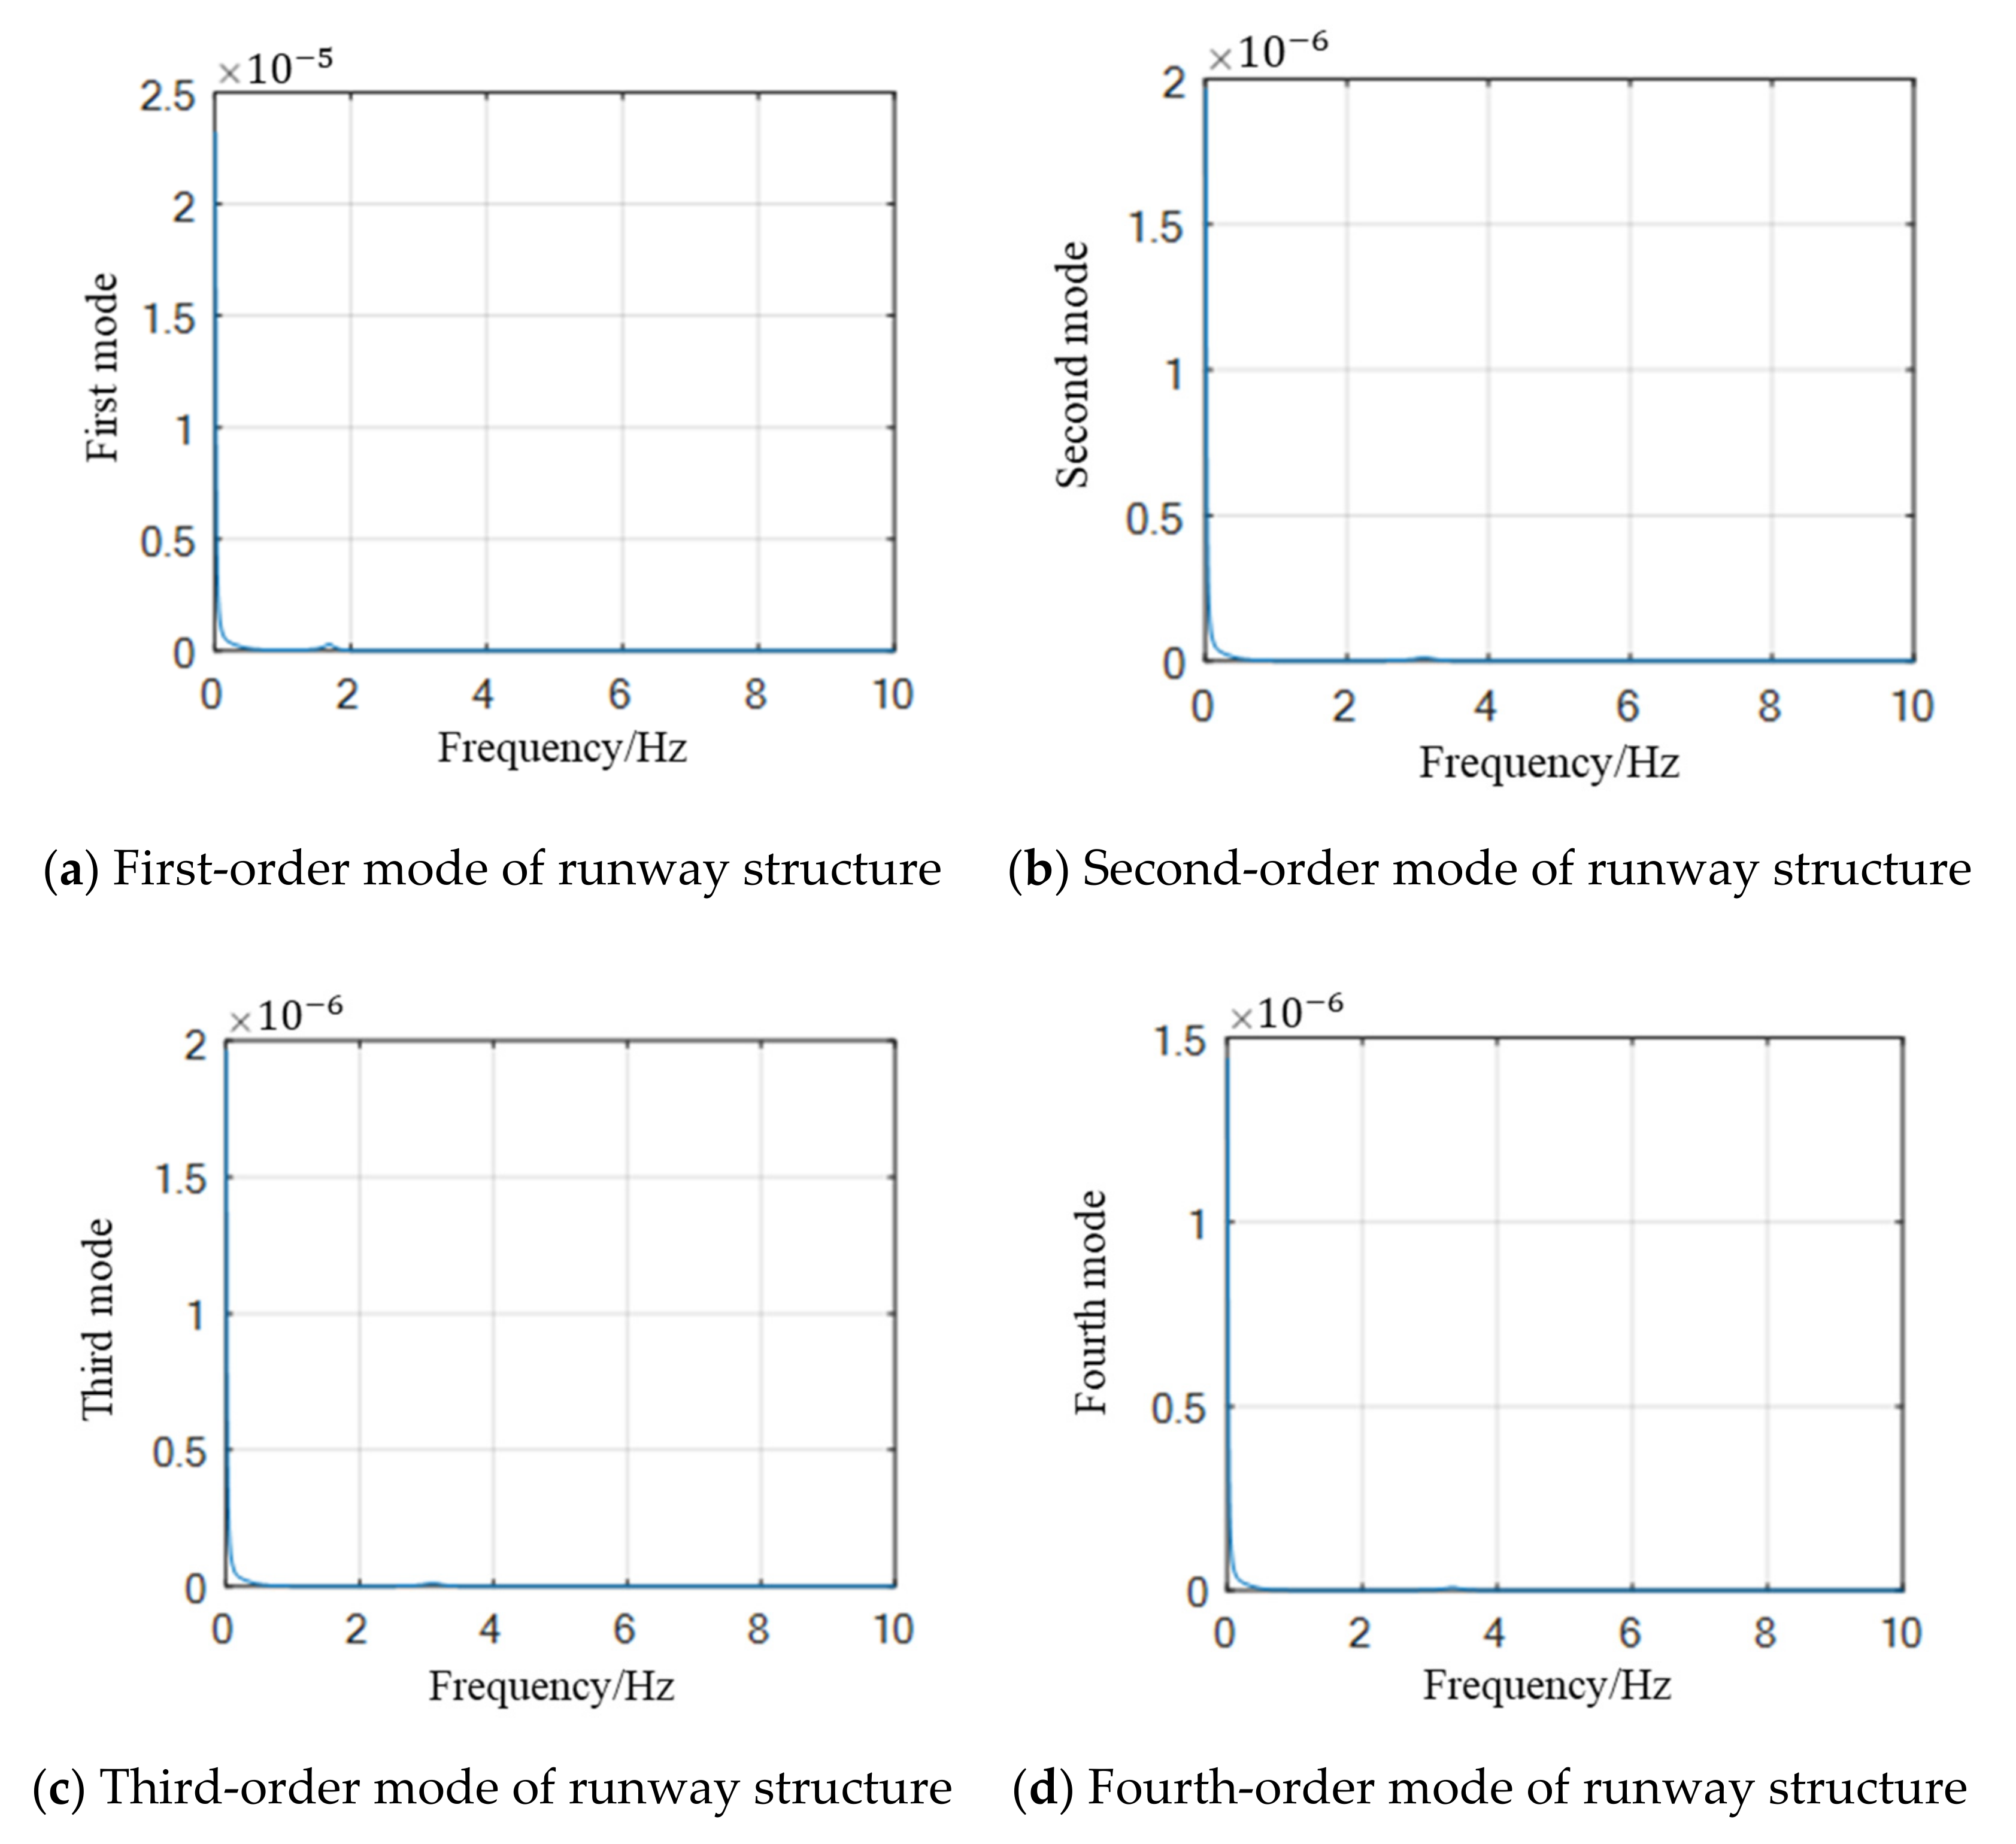
4.1. Calculation of Runway Structural Vibration Modes

The modal analysis of the finite element model is performed using ABAQUS software to establish a three-dimensional finite element model. Each layer of the structure is composed of homogeneous and isotropic elastic material, the interlayer contact is a continuous condition, the bottom is fixed, the constraints in the x-direction are applied at the longitudinal ends, the constraints in the z-direction are applied at the transverse ends, and the three-dimensional solid element, C3D8R, is adopted to divide the mesh.
Figure 3a–d present the top four vibration modes of a typical runway structure; the corresponding frequencies are 10.671 Hz, 19.54 Hz, 19.54 Hz, and 21.05 Hz, respectively.

4.2. Deformation of Runway Structure

Figure 4a–d show the displacements of the coupled aircraft/runway system for an aircraft taxiing at 120 km/h on a typical asphalt pavement structure for each of the four modes, respectively. As shown in Figure 4a, the PSD value of the first-order vertical displacement is larger than that of the other three modes, which indicates that the runway deformation is dominated by vertical displacement under the aircraft load. However, the PSD values of the displacements for all four vibration modes are low, and the magnitudes are distributed around 10−6. The standard deviations of the four displacements are calculated to be 0.78 mm, 0.22 mm, 0.22 mm, and 1.92 mm, respectively, which indicates that the deformation of the runway structure is minimal in the aircraft/asphalt runway coupled system.

4.3. Effects of Uneven Excitation Parameters on Aircraft Vibration

Figure 5a–c respectively show the effects of the three parameters, α , w, and C, on the vertical acceleration PSD of the aircraft/runway coupled system in the PSD model of uneven excitation. The results show that none of the three parameters affects the sensitive frequency of the PSD of the vibration response. Parameter α has a significant effect on the distribution of the vibration response because α serves as the cumulative term of the denominator in the fitting formula in the form of multiple squares, which contributes more than the overall numerical variation. The roughness index value w has little effect on the PSD of the aircraft’s CGA, and the shape of the curve remains essentially unchanged. As the roughness coefficient C increases, the PSD of the aircraft’s CGA also increases, and when C increases linearly, the corresponding PSD presents a linear variation regularity as well.

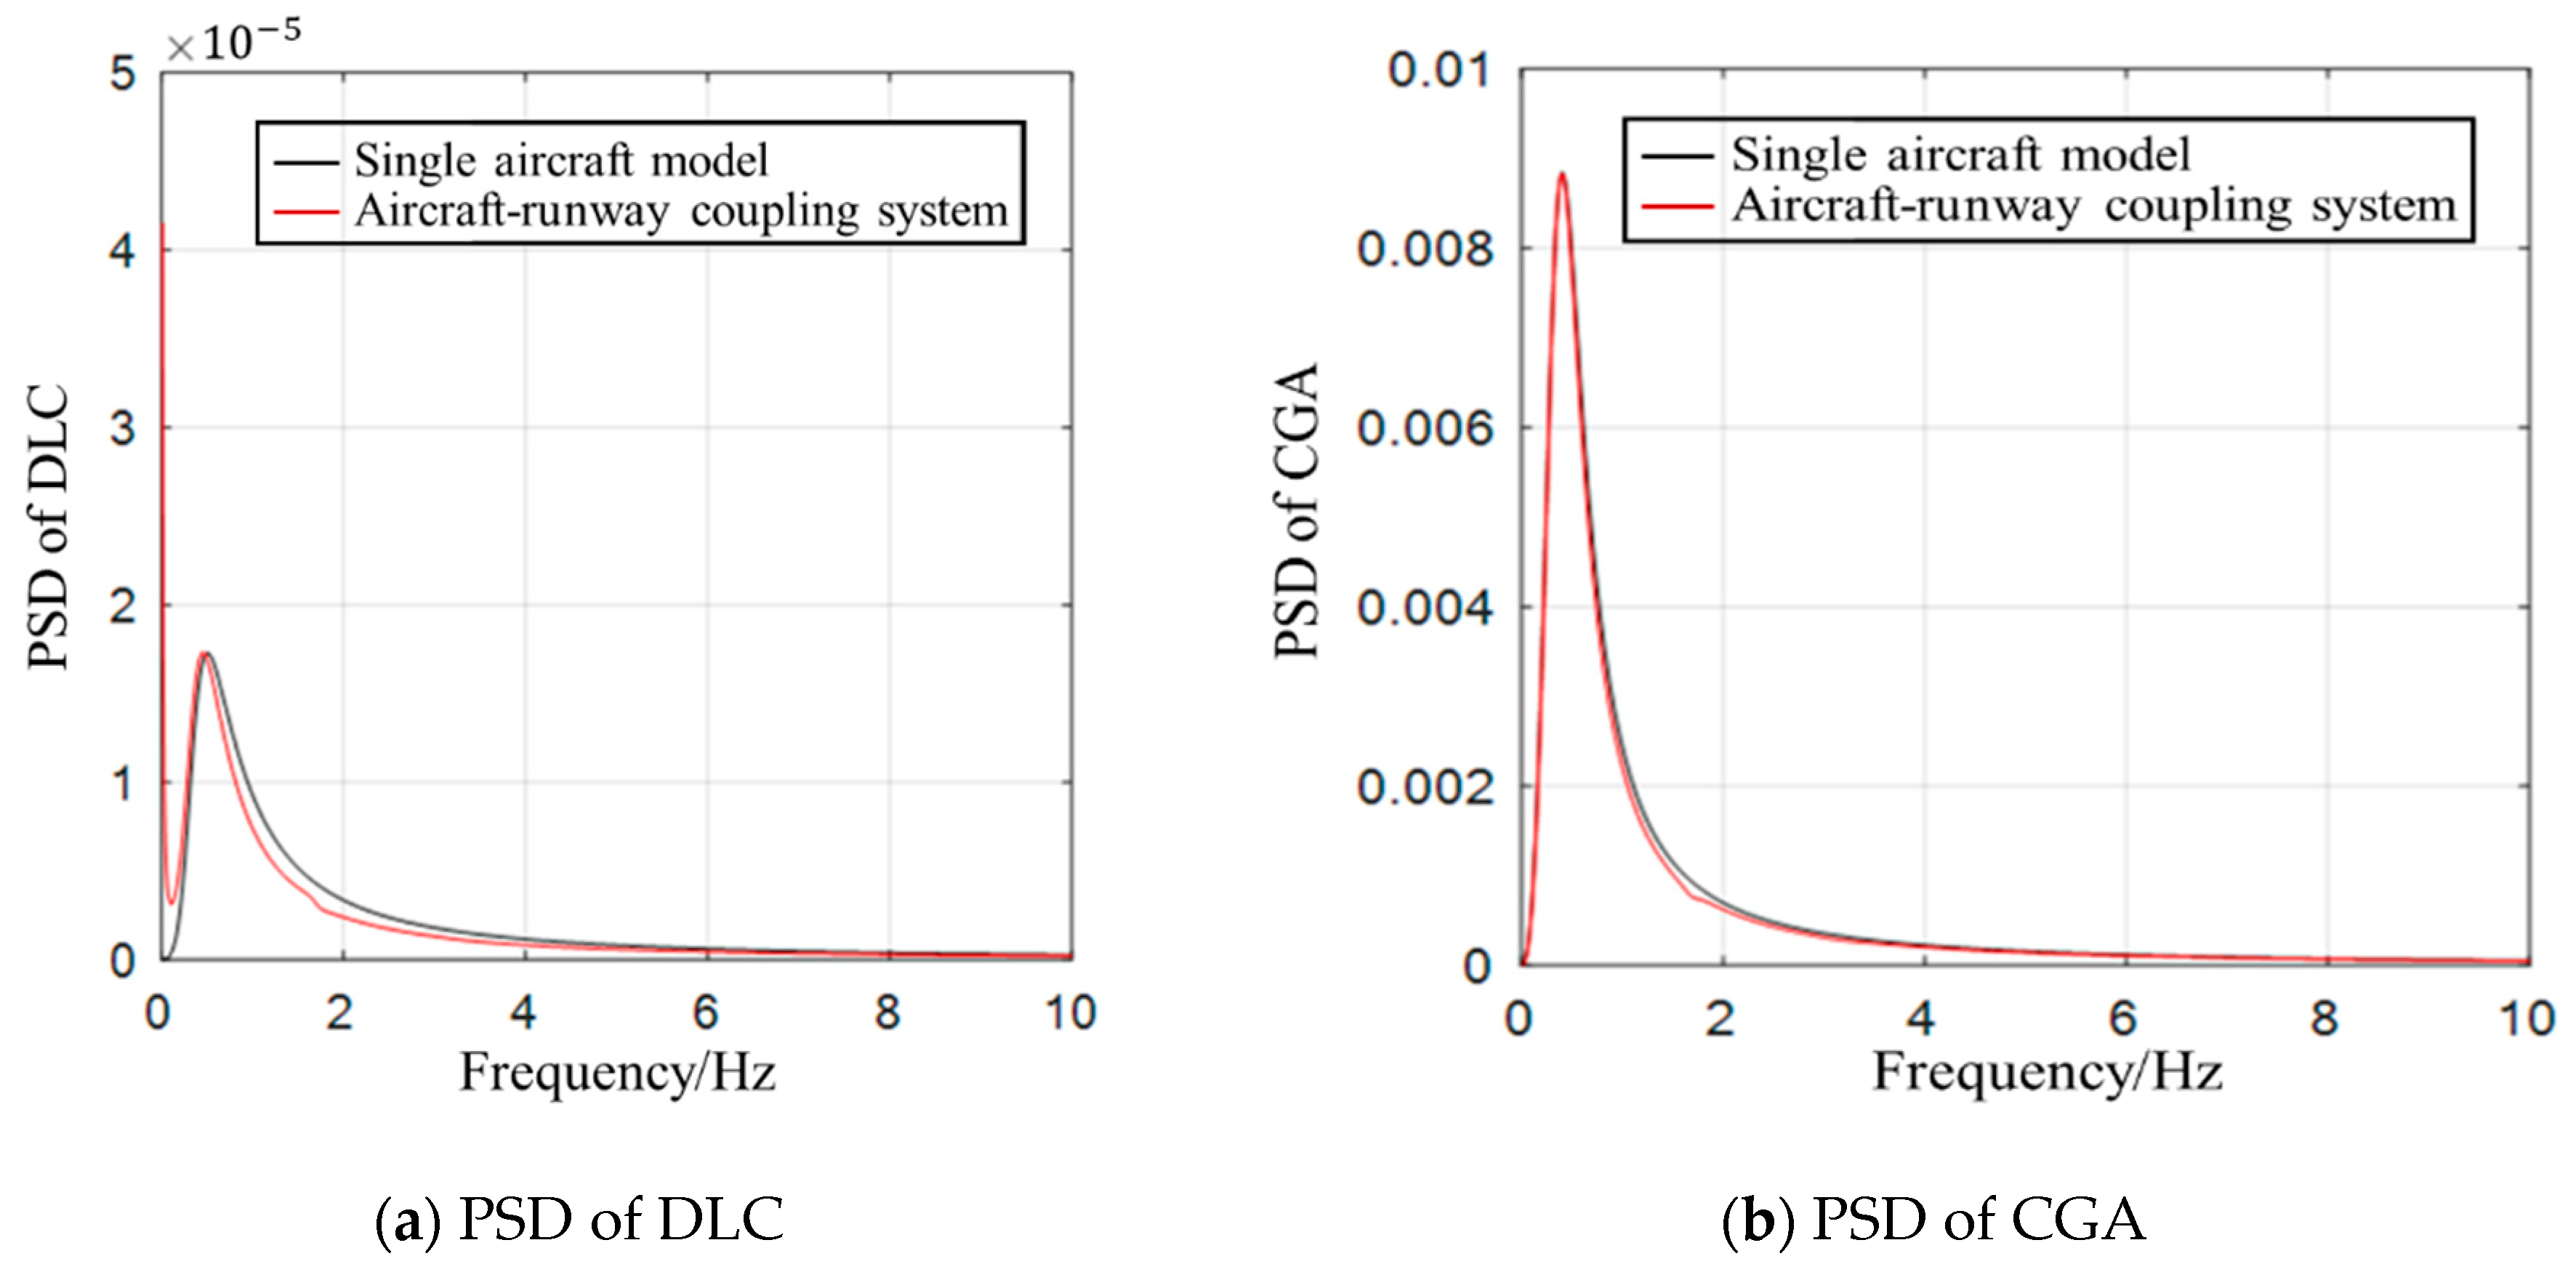
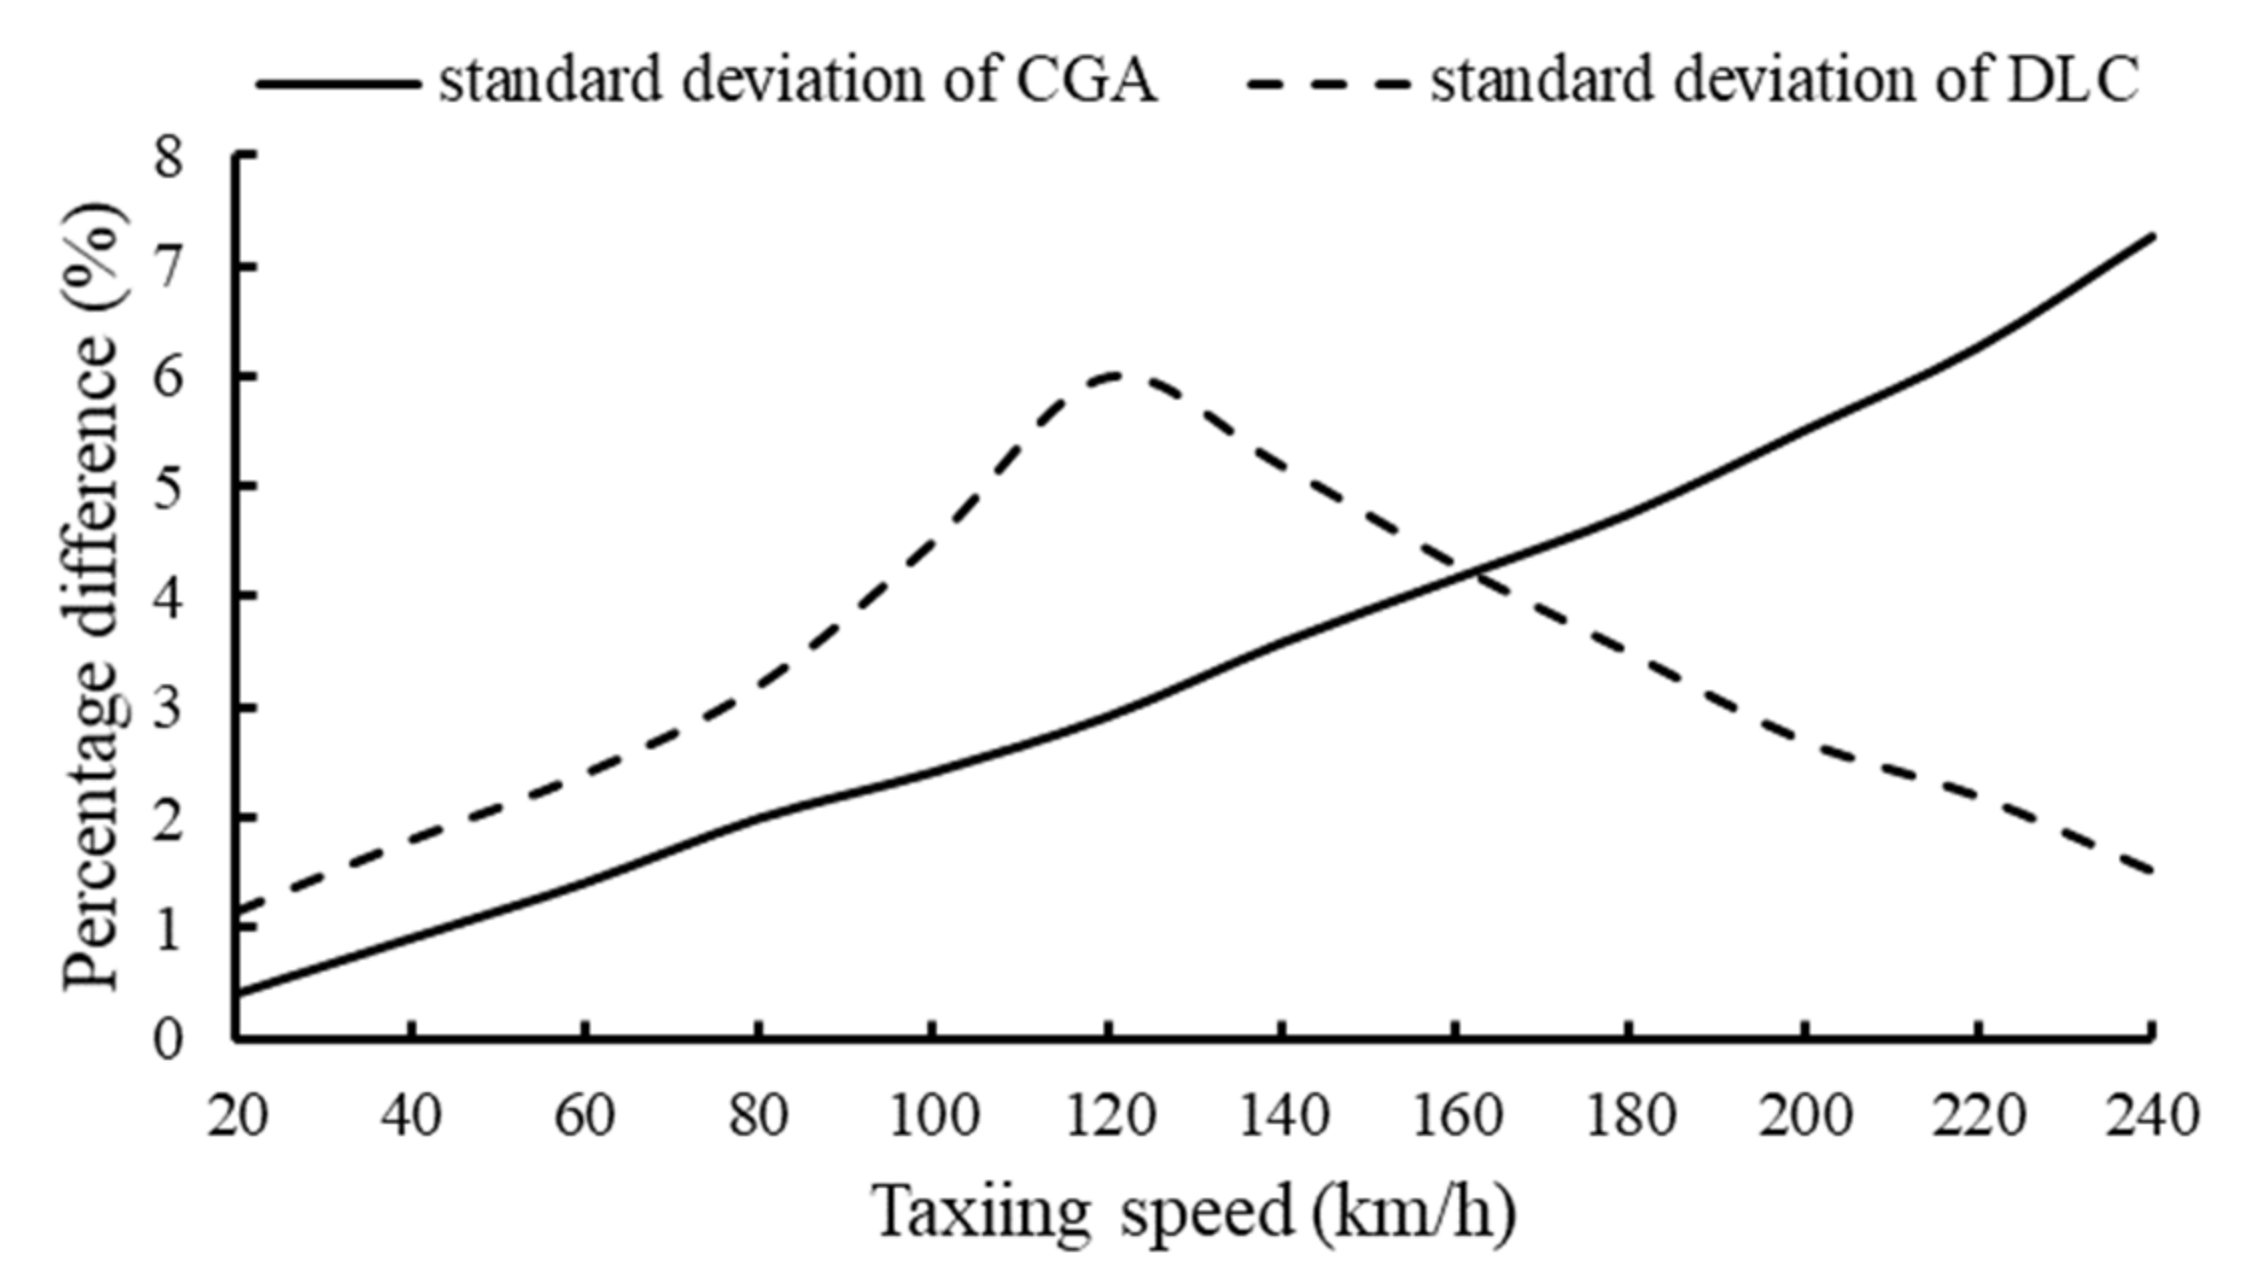
4.4. Effects of Coupled Effect on Aircraft Vibration

Figure 6a,b present a comparison of the vibration responses of a single aircraft system with that of the developed aircraft/asphalt runway coupled system under the taxiing speed of 20 km/h for DLC and CGA, respectively. The PSD values of the DLC show relatively large differences, whereas the PSD values of the CGA show subtle differences. According to Equation (21), the variances of the two vibration responses are 1.2% and 0.5%, respectively.
Figure 7 presents the distribution of the percentage differences at different taxiing speeds. With an increase in speed, the difference percentage for CGA shows a trend of gradual increase, and the overall trend is accelerated. This result suggests that the coupled effect on the CGA becomes increasingly more significant with an increase in speed, with up to 7.3% percentage difference. The more intense the vibration of the aircraft, the stronger the dynamic feedback of the whole coupled system. In contrast, the coupled effect in terms of percentage difference on the DLC increases first and then decreases as the aircraft speed increases, reaching a maximum of about 6% percentage difference at 120 km/h. This trend is caused by the aircraft’s lift. With an increase in speed, the increase in the aircraft’s lift results in a decrease in the DLC.

5. Conclusions

In this paper, a new coupled aircraft/runway system is established, and equations for vibration for the system under uneven excitation are derived. The system is determined using the PEM. The response laws for the CGA, runway structural displacement, and DLC of the coupled airplane/runway system under different excitation parameters and taxiing speeds are investigated. The main conclusions drawn from this study are as follows.
(1)
A 2-DOF B747 aircraft model and typical asphalt pavement runway structure model are established and their parameters are selected reasonably.
(2)
The top four modes of a runway structure, vertical deformation, bending along the longitudinal direction, bending along the transverse direction, and distortion were analyzed and the first-order mode of vertical deformation was found to be the most significant of the four modes.
(3)
The uneven excitation parameters for aircraft vibration have a significant effect on the distribution of the vibration responses.
(4)
Compared with a single aircraft system, the developed coupled aircraft/asphalt runway system exhibits obvious differences in terms of its dynamic responses, and these differences depend substantially on taxiing speed.
(5)
Aircraft lift will affect the DLC. Thus, with an increase in the taxiing speed, the CGA increases gradually, but the DLC increases first and then decreases.

Author Contributions

Conceptualization, S.L. and Y.T.; methodology, S.L. and Y.T.; validation, S.L. and Y.T.; formal analysis, S.L. and J.L.; investigation, S.L. and Y.T.; resources, S.L. and Y.T.; data curation, S.L. and Y.T.; writing—original draft preparation, S.L. and Y.T.; writing—review and editing, S.L., Y.T., J.L., T.H. and X.Z.; visualization, S.L. and Y.T.; supervision, S.L. and Y.T.; project administration, S.L. and Y.T.; funding acquisition, S.L. and Y.T. All authors have read and agreed to the published version of the manuscript.

Funding

This study was supported by the National Natural Science Foundation of China (grant no. U1833123 and no. U1933113) and the China Postdoctoral Science Foundation funded project (no. 2020M681392).

Institutional Review Board Statement

Not applicable.

Informed Consent Statement

Not applicable.

Data Availability Statement

All the data in this article can be found in the article.

Conflicts of Interest

The authors declare no conflict of interest.

References

  1. Gervais, E.L. Runway Roughness Measurement, Quantification and Application: The Boeing Approach; ASCE: Reston, WI, USA, 1991; pp. 121–131. [Google Scholar]
  2. Loprencipe, G.; Zoccali, P. Comparison of methods for evaluating airport pavement roughness. Int. J. Pavement Eng. 2017, 20, 1–10. [Google Scholar] [CrossRef]
  3. Emery, S.; Hefer, A.; Horak, E. Roughness of runways and significance of appropriate specifications and measurement. In Proceedings of the 11th Conference on Asphalt Pavements for Southern Africa, Sun City, South Africa, 16–19 August 2015. [Google Scholar]
  4. Durán, J.B.C.; Júnior, J.L.F. Airport pavement roughness evaluation based on cockpit and center of gravity vertical accelerations. Transportes 2020, 28, 147–159. [Google Scholar] [CrossRef]
  5. Kuncas, A. New Index Testing and Verification: Runway Roughness Index; Report No. DOT/FAA/TC-21/32, 2021; General Dynamics Information Technology: Egg Harbor Township, NJ, USA, 2021. [Google Scholar]
  6. Gerardi, M.A.; McNerney, M.T. Temporary construction of ramps and their effect on aircraft ride quality. In Proceedings of the International Conference on Transportation and Development, Pittsburg, PA, USA, 15–18 July 2018; pp. 36–44. [Google Scholar]
  7. Major, W.; Matthew, J.; Hubbard, S.; Bullock, D. Evaluation of Opportunities for Connected Aircraft Data to Identify Pavement Roughness at Airports. Coll. Aviat. Rev. Int. 2018, 36, 6–20. [Google Scholar] [CrossRef] [Green Version]
  8. Sivakumar, S.; Haran, A.P. Mathematical model and vibration analysis of aircraft with active landing gears. J. Vib. Control 2015, 21, 229–245. [Google Scholar] [CrossRef]
  9. Liu, S.; Ling, J.; Tian, Y.; Qian, J. Assessment of aircraft landing gear cumulative stroke to develop a new runway roughness evaluation index. Int. J. Pavement Eng. 2021, 22, 1–12. [Google Scholar] [CrossRef]
  10. Ling, J.M.; Liu, S.F.; Yuan, J. Applicability of IRI based evaluation of airport pavement roughness. J. Traffic Transp. Eng. 2017, 1, 20–27. [Google Scholar]
  11. Tian, Y.; Liu, S.; Liu, L.; Xiang, P. Optimization of international roughness index model parameters for sustainable runways. Sustainability 2021, 13, 2184. [Google Scholar] [CrossRef]
  12. Ruan, F.; Lü, X.L. The stress distribution in airport runway subgrade subjected to airplane moving loads. In Proceedings of the GeoShanghai 2018 International Conference: Transportation Geotechnics and Pavement Engineering, Shanghai, China, 27–30 May 2018; Springer: Singapore, 2018; pp. 262–269. [Google Scholar]
  13. Tang, C.; Lu, Z.; Yao, H.; Guo, S.; Han, Y. Vibration Characteristics of Unsaturated Runways Under Moving Aircraft Loads. Int. J. Struct. Stab. Dyn. 2021, 21, 2150065. [Google Scholar] [CrossRef]
  14. Wu, W.; Jia, T.; Xiong, F. Numerical simulation and statistical analysis of random response of the landing gear at taxiing. In Proceedings of the 3rd International Conference on Material, Mechanical and Manufacturing Engineering (IC3ME 2015), Guangzhou, China, 27–28 June 2015; Atlantis Press: Dordrecht, The Netherlands, 2015; pp. 1391–1397. [Google Scholar]
  15. Lin, J.H.; Zhang, Y.H.; Zhao, Y. Pseudo excitation method and some recent developments. Procedia Eng. 2011, 14, 2453–2458. [Google Scholar] [CrossRef] [Green Version]
  16. Lin, J.H.; Zhang, W.S.; Williams, F.W. Pseudo-excitation algorithm for nonstationary random seismic responses. Eng. Struct. 1994, 16, 270–276. [Google Scholar] [CrossRef]
  17. Ling, J.; Liu, S.; Li, M.; Yuan, J. Application limitation of Boeing Bump to evaluation runway roughness. J. Tongji Univ. Nat. Sci. 2017, 45, 23–30. [Google Scholar]
  18. Qian, J.; Cen, Y.; Liu, D.; Li, J.; Liu, S. Measurement method of all-wave airport runway roughness. J. Traffic Transp. Eng. 2021, 5, 84–93. [Google Scholar]
  19. Qian, J.; Cen, Y.; Pan, X.; Tian, Y.; Liu, S. Spectrum parameters for runway roughness based on statistical and vibration analysis. Int. J. Pavement Eng. 2021, 22, 1–13. [Google Scholar] [CrossRef]
Figure 1. Two degrees-of-freedom aircraft model.
Sustainability 14 02815 g001
Figure 2. Typical asphalt pavement layer structure.
Sustainability 14 02815 g002
Figure 3. Top four modes of a runway structure.
Sustainability 14 02815 g003
Figure 4. Power spectral density values of vibration displacement in runway pavement structure.
Sustainability 14 02815 g004
Figure 5. Power spectral density of vertical acceleration.
Sustainability 14 02815 g005
Figure 6. Comparisons of single aircraft model and coupled system on the power spectral density of vibration response.
Sustainability 14 02815 g006
Figure 7. Distribution of percentage difference at different taxiing speeds.
Sustainability 14 02815 g007
Table 1. Aircraft Model: Main Landing Gear Parameters.
ParametersValuesParametersValues
M s 181,080 kg c s 572,500 N·s/m
M t 1300 kg k t 2,633,277 N/m
k s 632,913 N/m c t 4066 N·s/m
Table 2. Runway Model: Structural Parameters.
Structural LayerThickness (cm)Resilient Modulus (MPa)Poisson’s RatioDensity (km/m3)
Asphalt surface1618000.32400
Semi-rigid base2020000.22300
Sub-base2015000.22300
Bedding layer342000.352000
Soil base910600.401800
Publisher’s Note: MDPI stays neutral with regard to jurisdictional claims in published maps and institutional affiliations.

