Abstract
From an ecosystem perspective, mergers and acquisitions (M&A) are one of the key paths for firms to foster complementary sectors and gain complementary assets. From the perspective of sustainable development, M&A can reallocate resources from target to asset to achieve better synergy and prolong the operation of a merged firm. However, M&A activities are characterized by high risk due to the high cost and uncertainty. Thus, a prediction model of M&A decisions is valuable for firms’ strategy design from an ecosystem and sustainable development perspective. By adopting a machine learning technique, this study measured the cross-border M&A decisions by analyzing firm-level cross-sectional data of the global financial marketplace under ecosystem mapping for the application of various country, deal and firm-level indicators related to sustainable development. Our paper can support the hypotheses of corporate governance, ecosystem stakeholder theory, ecosystem risk and institution theory in explaining that firms can increase their success rate of M&A to achieve sustainable development. Methodologically, we used AdaBoost to train several weak classifiers (decision trees) to achieve a strong decision-making model with a large financial transaction database of 215,160 deal activities. Results achieved 80.1% prediction accuracy by using the AdaBoost model through 10-fold cross validation. We found that differences exist on prediction features of M&A with different characteristics of sustainable development. For a robustness check, comparable results were obtained with a support vector machine (SVM) model. By analyses of the features during the cross-border M&A decision-making processing, this study is expected to contribute to the utilization of machine learning in ecosystem studies.
1. Introduction
The ecosystem perspective has become increasingly important as the boundary of firms has become blurry [1]. From an ecosystem perspective, the value creation and appropriation for sustainable development require a group of interconnected organizations, including a focal firm and several related complementary asset providers [2,3]. One of the core issues in the research of ecosystems is that focal firms should select appropriate complementors for leveraging and acquiring key complementary assets by collaborative arrangements [2,4]. Ecosystem actors can align through different arrangements [1,2], among which mergers and acquisitions are regarded as an important form, especially for business ecosystems [3,5,6].
The strategy of mergers and acquisitions (M&A) helps firms to control ownership of other organizations by combining or gaining their property rights under certain conditions [7]. This key business activity supports complementarity between firms in terms of resources and technologies [8]. Thus, M&A are considered to be an important strategy for ecosystems to gain competitive advantages in sustainable development. By adopting M&A, ecosystem focal firms, normally as acquirer firms in M&A, on the one hand, can control and internalize the required complementary assets more accurately and efficiently for entering or extending the targeted fields [5,9,10]. On the other hand, the complementors, normally as target firms in M&A for sustainable development, can extend their business scopes in the emerging ecosystems. Therefore, focal firms can take advantage of the complementarities in the ecosystems to provide the necessary capabilities for the facilitation on the health of their ecosystems through M&A [6].
However, M&A activities are characterized by high risk due to the high cost and uncertainty [8]. Extensive studies have indicated that the failure rates for the future sustainable development of M&A activities are between 70% and 90% [11]. The success or failure for the future sustainable development of M&A can be determined by a variety of internal and external reasons, from the motive of M&A to the creation of synergy after M&A [12,13]. Prior research suggests that the most important aspect, as well as the first step in increasing the success probability of M&A, is to select the appropriate target firms that match the strategic objectives of M&A [7,8,11]. The appropriate target firms for sustainable development should have complementary resources required by focal firms of ecosystems, and matching capabilities which can help to facilitate acquisition performance through resource redeployment [12]. This selection process is also defined as M&A prediction, and inappropriate M&A targets’ selection may lead to the failure of M&A activities [7,8]. For firms which seek the opportunities to be acquired or merged, the M&A predictions are also important [7].
Currently, increasing studies have paid attention to M&A predictions [7,8,14]. Several limitations still exist for the predictions of M&A, especially from an ecosystem and sustainable development perspective. First, most existing research develops M&A prediction models based solely on information from candidate target firms, regardless of the discussion of the acquirer firms [7]. Second, most of the extensive prediction studies focus on firm-level factors, but lacking the analysis on multi-level indicators, namely the country-level and transaction-level factors, which are also important for the sustainable development and ecosystem building under globalization [5,15]. Third, very few studies have compared the differences between factors which affect the M&A predictions of different types of M&A. This is especially important for M&A activities from an ecosystem and the sustainable development perspective, as the factors influencing M&A decisions may differ according to different strategic objectives [7,10]. For example, due to different degrees of technological familiarity and market uncertainty, horizontal and cross-industry M&A may have different emphasis in the considerations on selecting the target firms. Furthermore, from an ecosystem perspective, the main target for the sustainable development of horizontal M&A is to achieve more scale and density economies by acquiring resources and complementary assets, while the quick acquisition of key complementary assets to enter new technological fields to gain important scope economies is the main target of sustainable development of cross-industry M&A. Thus, it is important to compare and discuss the differences on M&A predictions between horizontal and cross-industry M&A. In addition, most extant studies adopt traditional analysis methods for the development of M&A prediction models, in which logistic regression is the most common [16]. With the rise of related prediction methods on the basis of big data, the application of novel methods, such as machine learning on the M&A prediction, have gradually become more important [7,17]. However, related research is still scarce.
In response to these limitations, in this study, we measure the characteristics of sustainable development related with cross-border M&A decisions by environment, social and governance (ESG) score of the acquirer and target firm, obtained from MSCI ESG KLD datasets, and the geography characteristic of the agriculture, forest and natural resource and climate pollution for the country of acquirer and targets from the world bank ESG data and Sustainable Development Goals (SDGs) data. We further identify different affecting factors under ecosystem mapping by analyzing firm-level cross-sectional data of the global financial marketplace. Recent literature has raised the hypotheses of corporate governance, ecosystem stakeholder theory, ecosystem risk and institution theory to interpret how a firm’s success rate of M&A is influenced by the ESG investing to achieve sustainable development. Our paper can confirm that the completion of M&A is impacted by different characteristics of internationalization advantage of macroeconomics, geographical endowment, climate impact, culture and law, corporate governance regarding a deal, ESG score and different financial risk factors. We have used AdaBoost to train several weak classifiers to achieve a strong decision-making model [18]. We use several country, deal and firm-level indicators and financial features (including size, growth, profitability, cash flow, leverage, investment and valuation factors), especially M&A behavior, financial index and stock market index associated with sustainable development (including M&A behavior, financial index and stock market index) to train our model and compare results with support vector machine (SVM) on the world’s foremost financial transactions database of 215,160 deal activities from the Thomson Reuters SDC Platinum database. Our sample covers 58 countries from 1973–2018. The features we use in our machine learning models reflect the most relevant information that could provide the best prediction model of the outputs. We further classify the M&A data into two sub-groups by the criterion that the M&A takes place in the same industry or another industry, namely horizontal and cross-industry M&A. After training the sub-group data based on machine learning techniques, we find that differences exist on prediction features of M&A with different characteristics of sustainable development under the ecosystem perspective. We also provide analyses of the features during the cross-border M&A decision-making processing. This study is expected to contribute to the utilization of machine learning in studies focused on an ecosystem perspective.
The rest of this paper is structured as follows. The next section lays out the literature review, followed by the methodology in which we elaborate the details about the machine learning design. Further, the results and related analyses are presented. The concluding remarks and future research directions will be presented in the final section.
2. Literature Review
From an ecosystem perspective, a group of firms can be agglomerated by ecosystem focal firms through M&A activities [6]. By adopting the strategy of M&A, focal firms can directly gain necessary complementary assets for the improvement of their own capabilities and offerings [5,8]. At the same time, the overall health of the ecosystem can be promoted as well [5,10]. To achieve the focal firms’ internal growth and the competitive advantages of external ecosystems, the M&A target firms’ potential of co-evolution and co-development with focal firms should be stressed [5]. The matching of firms’ capabilities, financial and technological indicators may affect the co-evolution in the ecosystems and thereby affect the performance after the M&A [5,10]. Thus, from the ecosystem perspective, it is necessary to consider the information from both target and acquirer firms.
At the same time, the ecosystem perspective also emphasizes the interactions between the target and acquirer firms, which is beyond the sole focus of M&A firms themselves. Thus, the transaction-level factors, such as the value of control right, payment methods and M&A objectives based on the ecosystem perspective, may have different effects on M&A decisions [7,10,19,20,21]. For example, the factors influencing M&A decisions may differ according to different strategic objectives based on the ecosystem perspective [7,10].
Additionally, with the increasing degrees of globalization, ecosystem establishment by the cross-border M&A has become more prevailing. The differences between the countries of acquirer and target firms, such as development degrees, culture similarity and geographic proximity, may potentially affect the decision and success of M&A [22,23,24].
In recent years, various machine learning methods have been used for analyzing M&A activities. Logit analysis has been used in predicting a model for horizontal and vertical mergers [25]. Patent analysis has used in both target and acquirer companies together with an ensemble machine learning method [26]. They have achieved a true positive (TP) of 46.43% on 2394 companies, 61 of which were actually acquired. Different from the patent features, factual and topic features using profiles and news articles on the Tech Cruch database have been developed [27]. They proposed to use Bayesian Network as the primary learning algorithm, which makes inferences based on a directed acyclic graph (DAG) approach. The achieved resultant M&A predictions achieved TP between 60% to 79.8% and false positive (FP) between 0% and 8.3%. Yang et al. [7] proposed a technology for a M&A prediction technique by adopting machine learning by considering the technological variables as well as technological profiles of both acquirer and target firms.
Apart from direct relation to the M&A, the machine learning methods have also been used in other financial activities. Random forest and k-nearest neighbor (KNN) methods have been used in the prediction of companies’ business success for start-ups [28]. AdaBoost models was developed for bankruptcy prediction with missing data [29]. The same method was also compared with a neural network approach in bankruptcy forecasting across European firms [30]. SVM is another powerful classification tool for a binary task [31]. Its performance was better than the neural network approach in predicting bankruptcy prediction [32].
From the literature, although various machine learning methods have been applied in the financial-related fields, we have not seen many attempts in modeling the M&A activities, especially the predictions of sustainable development from the ecosystem perspective, by using AdaBoost and SVM. Therefore, in this paper, we adopt these two methods and evaluate the performance based on various metrics stemming from an ecosystem perspective.
3. Theoretical Analysis and Hypotheses Development
Motives of a firms’ M&A associated with sustainable development can be related to the firms’ consideration of corporate governance, stakeholders’ interest, risk and institution in the ecosystem. Among them, it is worthwhile to explore what the most important influential factors are for the success of the M&A and its performance.
3.1. Corporate Governance Hypothesis
Previous literature has put increasingly more emphasis on considering how the factors related to sustainable development can affect a firm’s decisions related to M&A, and its impacts from the perspectives of ESG (environmental, social and governance) or CSR (corporate social responsibility) investment.
On one hand, the firm has the motivation to apply the idea of ESG/CSR investment to improve the corporate governance level by the mergers. Corporate governance plays an important role in advancing environmental sustainability [33]. Sustainable development requires the firm to mitigate agency problems. However, spending on ESG/CSR can also form a new manifestation of agency problems. One way to curb the discretionary spending of ESG/CSR is disciplining managers with the acquirer’s threat by M&A and other market participants, such as analysts [34]. From the internal governance perspective, corporate leadership characteristics such as boards and management can increase the return of the ESG investment [35]. Owners, boards of directors, top management teams and employees are important corporate governance actors in achieving environmental sustainability outcomes [36]. Firstly, U.S. directors who serve on the boards of international firms are exposed to changes in environmental and social regulations and reporting requirements [37]. Firms with these directors exposed to the changes in regulations and reporting requirements experience an increase in ESG/CSR performance. Secondly, CEO age and CEO confidence levels are also linked to ESG/CSR profiles [38,39]. Landier et al. [40] provides evidence that managers become more employee-friendly when the employees are in close geographic proximity. Lastly, political stance of the corporate leaders also matters in ESG/CSR scores. Di Guili and Kostovetsky [41] provides evidence that U.S. firms with CEOs, directors and founders that make larger donations to Democratic (rather than Republican) candidates tend to have higher ESG/CSR scores. Meanwhile, one way to improve the corporate governance is through mergers and acquisitions. M&A triggers company reorganization and optimizes firm structure, resulting in better corporate governance, ultimately leading to better environmental sustainability [33]. Furthermore, green M&A can increase the environment protection investment by improving corporate reputation and environmental awareness, enhancing financing ability and subsidies [42]. M&A with the sustainability operation concept considers the social care and environmental commitment of social responsibility further increases the growth rate, firm size and return on equity [43]. Merger-driven growth of the business will lead to long-term sustainable development, by changing the incentives, goals, strategy, plan and the actual process of unification [44].
On the other hand, the shareholders are more likely to face the agency problem when the firm engages on ESG investment through M&A. Firstly, ESG/CSR activities are not in the interests of shareholders, but rather an outcome of agency problems. According to shareholder expense view, if firms adopt pollution control standards that are too stringent with those implemented by competitors, these standards can put the firms at a competitive disadvantage by forcing them to spend too many resources on nonproductive CSR projects, reducing firms’ profitability and shareholder wealth. ESG/CSR activities also indicate the wealth is transferred from shareholders to other stakeholders. The short announcement return will decrease, and the shareholder can vote against the merger proposal. Buchanan et al. [45] finds during the financial crisis, agency conflicts become more severe, and the consequent cost of ESG/CSR over-investment causes higher-scoring ESG/CSR firms to experience greater declines in firm values. Secondly, managers will engage in socially responsible activities to help other stakeholders at the expense of shareholders. CEOs obtain non-pecuniary benefits from corporate spending on ESG/CSR activities and do so at the expense of shareholders. However, if boards reduce the CEO’s pay accordingly, spending on ESG/CSR activities might be consistent with optimal contracting, or good governance, and not a manifestation of agency problems. Gillan et al. [46] finds that CEOs at firms with higher ESG/CSR performance have lower salaries. Jian and Lee [47] finds that CEOs are rewarded for “normal” levels of ESG/CSR investment, but penalized when ESG/CSR investment deviates from the expected amount. Ferrell et al. [48] supports the good governance view that CEOs with high pay that is unrelated to performance invest less in ESG/CSR activities. Ikram et al. [49] finds relatively few firms tied pay to sustainability or corporate responsibility. Health and safety concerns or customer satisfaction might reflect regulatory requirements or a recognition of firm value drivers as opposed to a commitment to ESG/CSR performance. The higher ESG/CSR performance can prosper high success rate of the M&A and characterize sustainable development and corporate governance to be the important influencing factors of M&A.
To balance the two contradictory perspectives, we can find the corporate governance still plays an important role in how a firm’s ESG/CSR activities and characteristics of sustainable development will impact the decision of the M&A and its performance. We can put forward the hypotheses that:
H1.
Different characteristics of sustainable development and degree of corporate governance are core influencing factors of the success rate of M&A.
3.2. Ecosystem’s Stakeholder Theory Hypothesis
The decision of M&A is strongly hinged on interests of different stakeholders in the ecosystem. According to the stakeholder value maximization view, ESG/CSR activities have a positive effect on shareholder wealth because focusing on the interests of other stakeholders increases their willingness to support a firm’s operation. The view is in line with Coase [50], Alchian and Demsetz [51], Jensen and Meckling [52], Cornell and Shapiro [53] and Hill and Jones [54].
Firstly, the firms are a nexus of contracts between shareholders and other stakeholders. Each group of stakeholders’ supplies the firm with critical resources or effort in exchange for claims outlined in explicit contracts (wage contracts and product warranties) or suggested in implicit contracts (promises of job security to employees and continued service to customers). Implicit contracts are nebulous and have little legal standing. The value of implicit contracts depends on other stakeholders’ expectations about a firm honoring its commitments [53]. Firms that invest more in ESG/CSR tend to have a stronger reputation for keeping their commitments associated with the implicit contracts. Therefore, stakeholders of these firms are likely to have stronger incentives to contribute resources and effort to the firm and accept less favorable explicit contracts than stakeholders of low ESG/CSR firms. The interests of shareholders and other stakeholders in high ESG/CSR firms are in greater alignment. They are more likely to contribute to firms’ long-term profitability and efficiency [55,56,57].
Secondly, the vertical integration enhances innovation within the open ecosystem, benefiting consumers when it softens intra-ecosystem competition [58]. Mergers are likely to unsettle key stakeholders in a firm because they put the continuity of existing long-term relations between the firm and its stakeholders at stake and sometimes force stakeholders to renegotiate their contracts with the new combined firm. Thus, a firm’s reputation for fulfilling its implicit contracts with relevant stakeholders and maintaining continued relations with them are crucial to a merger’s success, suggesting that mergers are an important channel through which ESG/CSR investment can have a significant effect on shareholder wealth. During a merger’s transition period, key employees or customers could leave if the management team fails to effectively handle stakeholder relations. The combined firm could suffer a reduction in firm value. High ESG/CSR acquirers undertake mergers that benefit firm stakeholders, then their mergers are likely to lead to greater stakeholder satisfaction than mergers by low CSR acquirers.
Thirdly, the firm with higher ESG/CSR investment can help the M&A increase firm value, supporting the stakeholder value maximization view of stakeholder theory. Deng et al. [59] supports that ESG/CSR creates value for acquiring firms’ shareholders. High ESG/CSR acquirers realize higher merger announcement returns, and larger increases in post-merger long-term operating performance. The market does not fully value the benefits of ESG/CSR immediately. Mergers by high ESG/CSR acquirers take less time to complete and are less likely to fail. Edmans [60] supports the view that ESG/CSR actions create value. ESG/CSR firms have high stock returns that slowly diminish over time as intangibles (specifically, good treatment of employees), which are initially mispriced but become correctly priced as the intangibles transfer into tangible benefits (earnings surprises). Flammer [61] concludes that shareholder proposals for ESG/CSR activities create value through their effects on labor productivity and sales. Tang and Zhang [62] finds positive stock market reactions for firms that announce they are issuing green bonds; these firms exhibit increased stock liquidity and increased institutional ownership. Flammer [63] concludes that the issuance of green bonds is associated with positive stock market reactions and changes in the real ESG/CSR activities of firms.
In sum, a firm can increase their social impact by undertaking increasingly more social responsibility. High ESG/CSR acquirers and targets realize higher merger announcement returns and better post-merger operating performance of the combined firms, thus leading to a higher success rate of M&A. We can put forward the associated hypothesis as follows:
H2.
High ESG/CSR firms can achieve a higher success rate of M&A.
3.3. Ecosystem Risk Hypothesis
ESG/CSR activities can affect many types of risk in the ecosystem, including systematic risk, regulatory risk, supply chain risk, product and technology risk, litigation risk, reputational risk and physical risk [64]. The firm-level risk in the ecosystem can be related to the firm’s size and stability of cash flow. Benabou and Tirole [35] observes firms with stronger ESG/CSR profiles could have different systematic risk exposures because of their resilience during crisis periods or because there exists a specific ESG/CSR risk factor. EI Ghoul et al. [65] and Hong and Kacperczyk [66] hypothesize that responsible firms will have lower risk because they have a wider investor base and face lower litigation risk, ultimately leading to a lower cost of capital. Ilhan et al. [67] shows that a firm’s equity downside risk, as reflected in option prices, increases the firm’s carbon intensity. The cost of protecting against this downside risk dropped after the election of Donald Trump, which has lowered uncertainty in climate policy. ESG/CSR practices can act as insurance against firm-specific legal risk [68]. Firms with higher ESG/CSR ratings receive more lenient settlements from prosecutors and have higher resulting market valuations.
Moreover, the firm with higher potential of growth and profitability can have lower systematic risk too. Due to a product differentiation strategy, the strong ESG/CSR firms face a relatively lower price elastic demand, resulting in lower systematic risk. The effect of ESG/CSR on systematic risk is stronger for firms with high product differentiation [69]. Schiller [70] finds suppliers face a lower likelihood of environmental- and social-related lawsuits when their corporate customers have better environmental and social policies. EI Ghoul et al. [65] and Hong and Kacperczyk [66] show that negative screening leads polluting firms to be held by fewer investors, in turn leading to lower stock prices and higher costs of capital for these firms. Becchetti et al. [71] supports that ESG/CSR increases the idiosyncratic risk of firms due to a loss of flexibility in responding to negative productivity shocks caused by firms’ ESG/CSR activities.
Furthermore, the debt risk caused by the leverage is also well noted. The risk reduced by the ESG/CSR investment can further impact the cost of capital. Baker et al. [72] shows that the special conditions must exist for green firms to have lower costs of capital, otherwise some investors will want to hedge against high pollution states, which will drive up the interest in the brown firms as a hedge and drive down the cost of capital for the brown firms. The special conditions are either the existence of investor coordination in investment strategies for green firms or the presence of investors that have non-pecuniary disutility for investing in brown firms. Chava [73] finds the cost of capital is higher for firms with poor environmental profiles. Ng and Rezaee [74] conclude that a negative relationship exists between ESG/CSR performance and the cost of equity capital. Breuer et al. [75] found that a firm’s cost of capital is conditional on the investor protection laws in the country in which the firm is located. Higher ESG/CSR performance reduces the cost of capital in countries with strong investor protection.
Lastly, investment and valuation in the financial market become the market risk of the firm in the ecosystem. ESG/CSR investment can affect the risk of the firm through the bond market. Seltzer et al. [76] provides evidence that a firm’s bond credit ratings and yield spread are related to environmental scores and climate regulatory risk. Firms with poor environmental performance tend to have lower credit ratings and higher yield spreads, particularly if they are located in states with more stringent environmental regulations. Zerbib [77] concludes that green bonds are issued at a negative premium, suggesting that issuing bonds to fund projects with environmental benefits lowers the cost of capital for the projects. Hong et al. [78] argues that selection effects are likely to be larger than direct effects from CSR. They attribute this to the manager’s marginal return being small when conducting activities in order to improve the ESG/CSR ratings and lower their cost of capita, under conditions in which the firm has access to finance and investors’ appetite for risk is high.
We can thus come up with the hypothesis:
H3.
The risk factors can be important drivers for ESG/CSR investment and further affect the success rate of M&A.
4. Institutional Theory Hypothesis
Traditionally, the institution plays an important role in shaping the environment of the M&A, which can form the foundation of the ESG/CSR investment and deeply prohibit the firm’s financial and operational performance.
The institution can be related to different country characteristics and prosper sustainable development through ESG/CSR activities. Liang and Renneboog [79] provides evidence that country characteristics appear to be quite important in explaining a firm’s ESG/CSR activities. Cai et al. [80] states that economic development, culture and law are the important components of an institution. Firstly, it is of great importance to bring into full play the role of green finance in environmental protection by the development of a market mechanism and formulation of policies [81]. Secondly, the effect of cultural distance on cross-border acquisition performance depends on the acquisition experience of the acquirer. More internationally experienced acquirers can be aware of cross-border acquisition pitfalls and be more skilled at resolving acquisition-related conflicts, leading to higher acquisition performance [82]. Thirdly, Liang and Renneboog [79] concludes that legal origin is the strongest predictor of a firm’s ESG/CSR adoption and performance, more than political institutions, regulations, social preferences and a firm’s own financial and operational performance. Furthermore, more characteristics related to the institution can affect the firm’s ESG performance, including political leanings of a state’s citizens [80], whether the CEO is a Democrat or Republican [41], and social capital [83].
Therefore, we can put forward the hypothesis as follows:
H4.
The institution of the country such as cultural, law and political regulation can affect the ESG/CSR investment and play an important role in determining the success rate of M&A.
From the theoretical analysis above, we have put forward the theory to explain how the success of M&A is relevant to various ESG characteristics. In the perspective of sustainable development, it is difficult for a firm to tackle the challenges of balancing development and ESG issues such as environment protection, social security and governance effectiveness. The ecosystem provides the solid basis for the firm to grow in a sustainable way through the activities of M&A if it can facilitate the ESG investment as the hypotheses state. Firstly, corporate governance is the interior mechanism for maintaining the control right, compensation for CEOs employee and monitor system. Corporate governance hypothesis can clarify the role of M&A activities in mitigating the agency problem, which is an important issue in sustainable development. Secondly, stakeholders are the important participants whose benefits should be maximized within the ecosystem of the firm. The ecosystem stakeholder theory hypothesis further identifies the objective of ESG investment, by incorporating the broader welfare of all stakeholders into the ecosystem goal. Thirdly, the ecosystem risk hypothesis consolidates various risks regarding financial indicators, such as size, growth, profitability, cash flow, leverage, investment and valuation factors, to be included as external influencing factors of the ecosystem for the M&A activities. Lastly, the institution theory hypothesis can summarize how constituents of the effectiveness of governance along with the important institution factors in the ecosystem can foster the completion of the M&A activities. Therefore, it is necessary to consider all of the four hypotheses in our research.
5. Methodology
The machine learning method categorizes the financial features into complete and non-complete features. As shown in Figure 1, the implemented method contains 4 manifolds: (i) data collection, (ii) data pre-processing, (iii) feature extraction and (iv) classifier training. In this section, details of the implementations are illustrated.
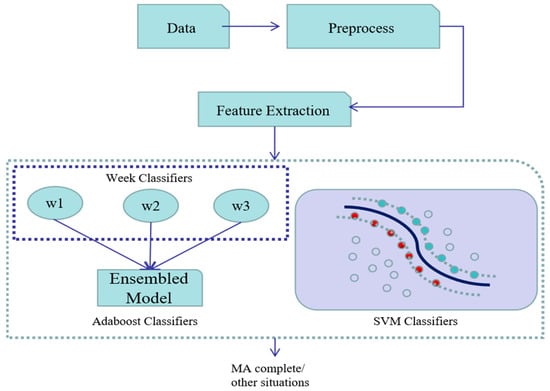
Figure 1.
The method of processing the cross-border M&A dataset.
5.1. Dataset and Features Selection
We used the global cross-border M&A dataset from 1973–2018. We focused on the Tomson Reuters SDC Financial Database’s mergers and acquisition deals. The original dataset contains 53 features of the acquisition company and the target company. There are in total 340,629 cross-border M&A deals recorded. The sample covers the cross-border M&A initiated by 25 developed countries and 26 emerging market countries. The countries’ distribution is shown in Table 1. To further mitigate the impact of the time-variant factors, we simplified our sample to only the recent period transition from 2009 to 2018, with the deal size of 85,189, to avoid the big changes in different periods, the world’s economy following 2008′s financial crisis has experienced steady growth until 2020′s COVID-19 crisis. The original dataset has only been used for a robustness check.

Table 1.
Distribution for countries initiating cross-border M&A.
The data for characteristics of sustainable development related to cross-border M&A decisions was obtained from various global databases. To be specific, country level indicators such as the macroeconomics, geography, climate, culture and law characteristic were obtained from the World Bank open data (https://data.worldbank.org, accessed on 4 February 2022), especially the ESG data and Sustainable Development Goals (SDGs) data. The environment, social and governance (ESG) score of the acquirer and target firm is the firm-level data obtained from MSCI ESG KLD datasets. The annual financial indicators were obtained from the Compustat Database, and the stock valuation data were obtained from CRSP database.
To certify our four hypotheses above, we introduced various characteristics of the indicators for features related to sustainable development. The feature contents include the environmental, social and governance characteristics of the nation of the acquirer and target, financial status of the company, the scale of the companies and some descriptive code of the companies (as shown in Table A1 in Appendix A). The financial statement information for the public firm was also considered. Our variables’ set contains three levels of the variables covering the country-level, deal-level and firm-level indicators to reflect the ecosystem’s complementation and the co-evolution potential of acquirer and target companies.
Firstly, from the perspective of sustainable development, we considered the country-level indicators related to the internationalization advantage factor, geography factor and climate factor.
(1) International Advantage Factor. From the perspective of country-level indicators, the cross-border M&A are driven by the internalization motives to acquire complementary assets globally to allocate profitable resources abroad, we considered the variables related to sustainable development between the countries that the acquirer and target companies come from. They include the GDP, GDP per capital, exchange rate and corporate tax to explore the acquirers’ ability of seeking internationalization advantage [23,84], since sustainable development relies heavily on economics factors.
(2) Geography Factor. To explore the impact of the green development of the firm’s country, we also introduced the geographical characteristics related to the country’s agriculture, forest reserve, nature resource endowment and land area for the country of the acquirer and target. The localized endowment from the perspective of geography determines the future benefit and natural resource for the development of the merged firms after M&A. Moreover, considering the localized specialization of different countries, we also included the geography factors such as whether the acquirer and target countries share the same border of countries [85], and the land area. The neighboring countries can have more advantage for spillover of the localized resource. The M&A transaction should exert the potentials of the resource in both countries for sustainable development.
(3) Climate Factors. Climate factors are the most important and relevant indicators for the sustainable development. The climate-related risk can be divided into two broad areas: physical risk and transition risk. The physical risks are associated with the direct pollution matters, such as the emission of carbon dioxide, nitrous oxide and methane. They can also be represented by the greenhouse gas net emissions/removals by land use change and forestry (LUCF) activities. The impact of the pollution can be directly observed by the concentration of PM 2.5 pollution exposure in both the urban and rural areas of the country for acquirer and target. The transition risk is related to a firm’s ability to transition toward low carbon emission development, which can be measured by the ESG score of the firm, discussed in the later.
Secondly, for the hypothesis of corporate governance hypothesis, we focused on the M&A deal-level indicators, consisting of the deal factors and payment factor.
(4) Deal Factor. The important element of the M&A deal includes the transaction value and control right percentage for acquirer and purpose of M&A. We considered the transaction level indicator, such as the percentage of stake acquired in M&A (sought), implying the value of control right in cross-border acquisition [19]. We also took into account the value of transaction, which is the size of sale acquired in the transaction. A large transaction can pose a threat for the manager in the target firm, forcing them to improve the corporate governance ability. Lastly, the purpose of the M&A was also applied to analyze the mergers’ incentives, such as the technology acquisition, resource preference or business expansion [20]. The M&A with a long-term plan and technology purpose can perform better on sustainable development. The appropriate design of the transition is of vital importance for the long-term development for the acquirers.
(5) Payment Factor. The payment method, namely cash, stock or others, can be related to the shareholder protection in the acquirer’s countries [21].
Thirdly, to confirm the ecosystem stakeholder hypothesis, the ESG score for the acquirer and target was considered.
(6) ESG Factor. The ESG score of the acquirer and target firm is aggregated by the environmental, social and governance indicator score. To begin, the environment performance indicators cover the environmental opportunities, waste management, climate change, environmental management systems, natural resource use, regulatory compliance, toxic emissions and waste, energy and climate change, impact of products and services, biodiversity and land use, operational waste, supply chain management and water stress. In addition, the social performance indicators consist of the community, human rights, employee relations, diversity and product. Lastly, the governance indicators contain the corruption and political instability, financial system instability, governance structures, controversial investments, bribery and fraud and controversial business involvement.
Fourthly, we introduced multiple financial risk factors to verify the ecosystem risk hypothesis, For the public firms, we explored seven factors more deeply, including the size factor, growth factor, profitability factor, cash flow factor, leverage factor, investment factor and valuation factor, including size, grow, profitability, liquidity, credit risk, operation and valuation. We intend to combine the acquirer and target’s firm characteristics together to find better matching complementary factors in the M&A. The ecosystem should take into account both sides’ fundamental indicators. The complementarity for both parties can exert more potentials of synergy, thereby increasing the capacity of the merged firms to develop sustainably.
(7) Size Factor. To be specific, the size factor contains asset, equity, sales and employment, which is considered to affect the stock return of the firms.
(8) Growth Factor. The growth factor includes the market to book ratio (BM) and cash growth rate. It is explored more for the growth versus valuation of the firm in the stock market [86].
(9) Profitability Factor. The profitability factor of the firm covers the factors of net profit, net income, return of asset (ROA), return of equity (ROE) and net profit margin. The profitability is the source of the synergy to guarantee the post-merger efficiency [87,88].
(10) Cash Flow Factor. The cash flow factor of the firm implies the index of cash flow, earnings before interest and tax (EBIT), earnings before interest, tax, depreciation and amortization (EBITDA). The cash-sufficient firm can complete the acquisition and resist from the risk of the financial constraint and liquidity issues during the acquisition [89].
(11) Leverage Factor. The leverage factor ranges from debt to capital expenditure (CapEX). It can reflect the external financing ability of the acquirers and targets to maintain the process of the M&A [90,91].
(12) Investment Factor. The investment factor indicates cost of goods sold and return on investment. A good performance of the investment can provide the acquirer with more experience in identifying the suitable target in the acquisitions [92].
(13) Valuation Factor. The valuation factor consists of the stock price and share outstanding. We further explored the valuation of the deal by the market’s investors. The acquirers can exploit differentials in currency and specialization in stock market valuation [93]. With all the fundamental financial factors of both the acquirer and target firms, we can analyze which factors are the key elements for firms to take advantage of the complementarities in the ecosystems for the facilitation on the health of their ecosystems through M&A.
Lastly, we can also support the institutional theory hypothesis by the institutional indicators, including the culture and law factor, and information factor.
(14) Culture and Law Factor. Culture issues are of great importance in the coordination of the acquirer and target companies to fulfill the post-merger synergy for long-term development. On the one hand, we introduced the country-level indicators of the citizens’ satisfaction rule of the law and the governance effectiveness of the acquirer and target’s country. The efficient institution of the country can provide the solid basis for the merged firm to develop more persistently. On the other hand, we also considered the culture and law system similarity of the two countries, such as whether the language, religion and law system are the same for the acquirer countries and target countries [22,24]. The institution and habit can form the inherent motive for sustainable development.
(15) Information Factor. We considered firms’ basic characteristics related to information, such as public status of firms to explore the going public’s influence on the mergers [94] and industries that the firms engage in to explore the industrial advantages [95].
5.2. Data Pre-Processing
We pre-processed the dataset by firstly deleting the irrelevant feature columns. For instance, we deleted the nations, the start and end acquisition date etc. The remaining features were mainly financial status and company information (i.e., number of employees). Secondly, we reduced the remaining features by maintaining the features that related to the ratios. For example, sought, cash growth of acquisition company and net profit of target company. After the reduction, we were left with 15 features, which are listed in Table 2. Thirdly, we noticed outliers in the dataset. The outliers may exist because of the wrong input of the data or simply too big or too small a value. For the sake of the learning algorithm, it was better to remove them for each considered feature. The technique we used for outlier detection was by fitting the data with normal distributions. In the last step, we subtracted the mean and divided the standard deviation to normalize each column of the feature. This step can be safely carried out only after the outlier removal step as the wrongly estimated mean value leads to a very different normalization result. The process was conducted for all samples and subgroup samples.
Table 2.
Features for M&A completion classification.
5.3. Feature Extraction
The number of features left after data pre-processing was 15. Since the AdaBoost model developed in this paper is based on ensembles of the tree models, we first used predictor importance analysis to quantify the influence of each feature variables for the tree model. The size of the features can be further truncated after this step. Figure 2 shows the results of such analysis of full samples, horizontal M&A and cross-industry M&A, respectively. The horizontal axis represents the 15 features after data pre-processing.
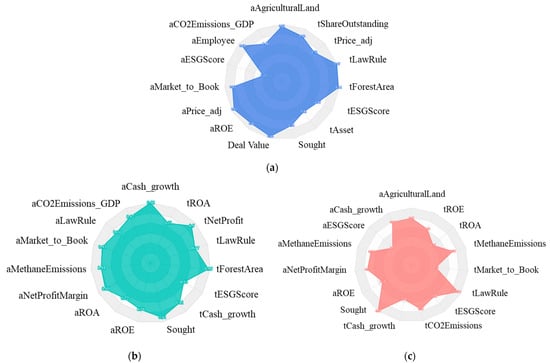
Figure 2.
Features’ importance for the predictors. (a) Predictor importance estimates for all. (b) Predictor importance estimates for same industry (c) Predictor importance estimates for cross-industry.
The vertical axis represents the importance of the feature for the predictive model. For the model built for all samples, the second and the third feature had the least importance, therefore, we can potentially remove them from the feature list. The same process can be carried out for the subgroups. As an example, the resultant features for all samples are listed in Table 2. Then, we used principal component analysis (PCA) to project the raw features into some latent space. PCA is widely used as a dimension reduction method by taking the advantage of the singular value decomposition (SVD) method. The most and the least important features are sorted on the diagonal of the decomposed matrix. In this paper, we used PCA as a projection method that projects the raw feature information into their corresponding latent space where each column of the feature is orthogonal/independent to each other.
5.4. Machine Learning Method
In this paper, the AdaBoost was trained on the cross-border M&A dataset. The feature inputs were processed from Section 5.1. The labels were extracted from the column labeled ”status”. It originally contained more than two statuses. We converted them into complete = 1 and non-complete = 0 cases. For the sub-group of horizontal M&A, the acquirer and target firms are in the same industries. While the sub-groups of cross-industry M&A contains the deals which acquirer and target firms are in the different industries.
Our paper adopted the AdaBoost M1 variant, namely the discrete AdaBoost, to better fit into the prediction of the success rate of the M&A. We only considered the M1 variant for the data structure concerned. The M1 variant can only treat the binary classification problem; our paper’s output variable is the success rate of M&A, which is a binary dummy variable, with the output of 0 or 1. Having prepared the data, we started by inputting the sequence of, say m samples where . We then created the model and initialized the sampling weights () of the training sample set. The created model was put in the AdaBoost classifier M1 variant and finally boosted.
The details of steps for the AdaBoost method is shown in Table 3. First, the sample weights are initialized with uniform distribution. Then, the weak classifiers are trained with those weights. The overall classification error is calculated for updating the weights of the weak classifier. In the end, the sample weights are updated for the next iterations. We used decision tree (DT) as the individual learner.
Table 3.
The AdaBoost method.
To make the results comparable, we also built models with logistic regression and SVM methods. For SVM, radial basis function was used as kernel function. For evaluation of the models, we first randomly shuffled the data into training (80%) and testing sets (20%). Then, we conducted a 10-fold cross validation for both methods on the testing set. The best AdaBoost model was chosen across the number of trees, the tree depth for each DT and the learning rate. The SVM model was chosen across the C parameter (the upper bound). The misclassification rate and the receiver operating characteristic (ROC) curve were used as performance metrics. The ROC curve helps to analyze how well our classifier separates the positive (complete) and negative (non-complete) M&A. The confusion matrix was also used as supportive metric for the learning model.
The advantage of AdaBoost can be identified from its flexible combination of classifier and suitability of the scenario of cross-border M&A. By changing the probability distribution of samples, AdaBoost calls the weak learner to divide and conquer samples with different distributions, and combines the weak classifiers into strong classifiers. From the above principles, the advantages of AdaBoost can be combined with the prediction of M&A as follows.
Firstly, during the procedure of M&A, various factors can affect the final success of the deal. Moreover, each factor can influence the M&A through different ambiguous channels or have mutual effect in determining the M&A’s performance, creating difficulty for estimating the actual impact for each factor. To solve the above problems, AdaBoost provides a framework in which various methods can be used to build sub classifiers. The efficient classifiers can be learned by different algorithm to better select the significant factors for the binary dependent variable (for example, the success rate of M&A). The estimation for the dependent variable with selected factors can help increase the accuracy of the prediction.
Secondly, compared with other investment activities, M&A is a way of industrial integration, which consumes huge human and material resources. Its success requires not only pre-negotiation, but also post-event mutual adjustment in order to form a synergy effect. Therefore, there is a certain threshold for the prior knowledge reserve of the acquirer. If the acquirer’s prior knowledge of M&A is not sufficient, there will be more deviations in the selection of the target party, leading to the failure of the M&A. The AdaBoost algorithm does not need the prior knowledge of weak classifiers. The classification accuracy of the final strong classifier depends on all weak classifiers.
Finally, the endogeneity problem exists in the complex situation of M&A; countless potential factors will affect the ultimate success of M&A. Compared with other machine learning algorithms, such as the bagging algorithm and random forest algorithm, AdaBoost takes into account the different weights of different weak classifiers on the success of M&A and can help mitigate the endogeneity problem better to identify the important influencing factors.
6. Results and Analysis
In this section, the results analysis is first conducted for all samples. The model selections and prediction accuracy analysis are included in this part of analysis. Then, the same process is carried out for the same industry and cross-industry subgroups. The summary of the results are reported at the end.
In order to select the best model, the 10-folds cross validation was used on the hyper parameters for the learning methods. The model selection process is shown in Figure 3. The curve is calculated by increasing the depth of the tree model and evaluating its misclassification rate at a specific learning rate. The results are shown in Table 4.
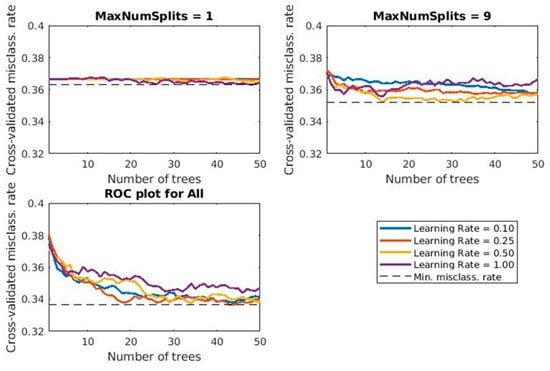
Figure 3.
10-fold cross validation for the AdaBoost method for all samples.
Table 4.
Misclassification and model selection results for AdaBoost and SVM method for all samples.
For the AdaBoost method, the best model is achieved when the number of trees is 50, the maximum number of split is 81 and the learning rate is 0.25. The misclassification rate is 0.343. The overall learning performance increases when the number of trees and the depth of trees increase. However, the improvement becomes flat when the number of trees increases. For SVM method, we do not show the training process since the only varying parameter is the C parameter. The misclassification rate is 0.368.
Another metric used for evaluation is the confusion metric (as shown in Figure 4). In order to show the generalization capability of the model, we predicted the M&A success using only the testing dataset with 1229 samples. From the result, the AdaBoost method has achieved 80.1% accuracy, but the SVM only achieved 55.8%.
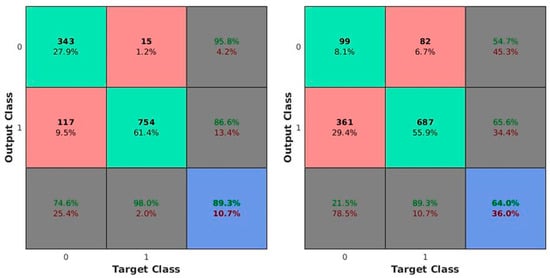
Figure 4.
Confusion matrix for AdaBoost (left) and SVM (right) method for all samples.
After generating the predicted label for the testing dataset, the ROC metric was calculated and shown in Figure 5. The curve on the left is closer to the top left corner than the curve on the right.
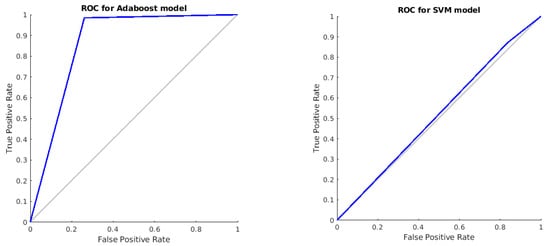
Figure 5.
ROC curve for AdaBoost and SVM model for all samples.
From the results above, in general, the AdaBoost method outperforms the SVM method in predicting the M&A activities. The misclassification rate and prediction accuracy for the AdaBoost approach are both smaller than the SVM approach. The ROC plots also indicate the same trend since the model that is closer to the top left corner is better.
After classifying the full sample into sub-groups of horizontal M&A and cross-industry M&A, we retrain the machine learning model. We have also conducted a benchmark across different machine learning algorithms. Logistic regression is used as a baseline. The SVM result is also compared since it is widely used in the literature for a classification problem with two labels. The results are summarized in Table 5. From the table, the logistic regression has achieved the prediction accuracy of 62.7%, 61.5% and 65.8% for the all sample M&A, horizontal M&A and cross-industry M&A, respectively. For the SVM method, the performance is better than the logistic regression; however, it is not comparable with the AdaBoost method. The AdaBoost method has achieved the best performance in terms of the prediction accuracy with 80.1%, 80.3% and 80.0%, respectively.
Table 5.
A summary of the prediction accuracy for the subgroups of data.
There are also many financial interpretations for our prediction modeling. After the machine learning’s selection of the most relevant indicators for the completion of the mergers and acquisition, it can be mainly attributed to the financial features of the acquirer and target firms, which are shown in Figure 2. We can support the hypotheses, which are put forward in the previous sections. In our modeling, these factors are highly related to the sustainable development from both the sense of economics of scale and corporate governance.
6.1. Total Sample Result
Firstly, we can support the first hypothesis that the characteristics of sustainable development and degree of corporate governance can indeed impact the success rate of M&A significantly. On the one hand, the indicators related to the geography and climate factor can be directly associated with the success of the M&A, but the internationalization advantage factor is not significantly related. This result can indicate that sustainable development are more related to non-financial factors such as the environment protection and climate change mitigation. On the other hand, we used the percentage of share acquired for target in cross-border acquisition (Sought) to measure the corporate governance. Sought reflects the value of the controls in the cross-border M&A. The motivation of reducing transaction cost to obtain a monopoly power in the market’s competition has become the main driver for mergers and acquisitions [96]. When the internalization cost is smaller than transaction cost, the firms are motivated toward vertical integration of the counter parties in the transactions [97]. Moreover, the percentage of share acquired for the target also protects the investors of the acquirers in the weak contracting environment in an emerging market and in industries with high asset intangibility [19]. When the complementary asset is under the same ownership, M&A can make the firm generate more synergy [98]. A larger portion of acquisition of targets can increase the complementarities in the ecosystems since acquirer can control and internalize more required complementary assets.
Secondly, we can obtain the supportive result for the ecosystem’s stakeholder theory hypothesis that a high ESG acquirer/target can achieve a higher rate of success of M&A. In particular, a target’s ESG scoring is more significantly related to the final success of M&A. This result can be confirmed since ESG/CSR investment can show the firms with stronger incentives to contribute resources and effort to the firm and accept less favorable explicit contracts. We can then identify the importance of the alignment of the interests of shareholders and other stakeholders in the ESG investment [55,56,57].
Thirdly, the ecosystem’s risk hypothesis is also verified. Risk factors play important role in determining the M&A, especially the valuation, size and profitability factor. To begin, the sizeable and profitable firm can achieve a higher rate of success for M&A. Employees, assets and ROE are the financial indicators associated with the size and profitability factors, which is the source of the synergy of M&A. For one thing, the synergy driven by size and profitability can improve the efficiency of utilization of the resource [99]. The large size indicates substantial economics scale, which can be attained by reducing the low efficient production and improve the profitability [100]. The other aspect is the profitability’s improvement in cross-border acquisition can improve the corporate governance. It can further increase the Tobin Q of the target firm’s industry if the investor protection is weak in target countries [24]. Moreover, better protection of the target’s benefit through the post-merger firms’ profitability can further increase the size of the combined firm and facilitate the co-evolution of two firms in the ecosystems. Besides, the risk of valuation and growth potential are associated with the agency problem. On the one hand, adjusted price and market to book ratio can be the indicator of the firm’s potential for growth to the valuation. The higher the price and market to book ratio, the lower the agency problem in the firms. One of the motives for mergers is driven by the management team’s self-interest [101]. The M&A can also pose as the threat to the inefficient management team of target firms and further solve the conflict of interests between the shareholder and manager [102,103]. On the other hand, the manager in the acquirer also has the problem of over-confidence. When the firm tends to grow (high market to book ratio) and achieve high valuation (high price), they are more likely to expand in size through the M&A, even if it will harm the value of firm [104]. The potentials for the growth of two focal firms can reinforce the ecosystem and help the firms to find complementors to increase the post-merger synergy.
Lastly, we can support the fourth hypothesis that the institutions significantly matter for the success of M&A. We resort to the citizens’ satisfaction of the rule of law for the country to proxy the legal system’s effectiveness and find significant correlation with success of M&A. Moreover, we can use the public status to represent the trading environment of the M&A. The public status of the acquirers and targets can impact the mergers’ performance since going public can reduce valuation uncertainty, leading to more efficient acquisition strategy, therefore enhancing firm value [94]. Going public can alleviate the information asymmetry and obtain cash to be used in future acquisitions [105]. Less information asymmetry can increase the chance of the matching between the acquirers and targets in the ecosystems. The acquirer can select more appropriate target firms to match the strategic objectives.
6.2. Subsample Result for Horizontal and Cross-Industry M&A
As for the subsample analysis for the horizontal M&A and cross-industry M&A, compared with the prediction model of the full sample, the results are as follows.
Firstly, the growth of cash becomes the significant factor for the cross-industry M&A. Risk of financial constraints is proxied by the cash growth for the horizon M&A and cross-industry M&A. The cash growth can play the role of alleviating the problem of financial constraint [106]. The target firms are more likely to be acquired by the firm with more cash growth and liquidity in the same industry [107]. When the specific asset of the target firm is low, the value of firm can be improved by mergers and acquisition through the reallocation of the firm’s liquidity and cash flow. It is certified that the target firm’s cash-investment sensitivity is reduced after the M&A, which implies the moderation impact of the financing constraint of the target firms [108]. The combined firm can complement to the counter-party and grow faster with sufficient cash growth in the ecosystem to achieve the co-evolution through resource redeployment.
Secondly, the degree of Sought is significantly increased in the prediction model of horizontal M&A. This implies that in the decision-making of horizontal M&A, obtaining the equity share of the target company is a more important factor in the final M&A decisions. This is mainly because the function of horizontal M&A is to make acquirer firms achieve more scale and density economies by acquiring resources and complementary assets in ecosystem construction [109]. At the same time, due to the familiarity of acquirer firms to the industries in the horizontal M&A, the risks and internalization costs derived from information asymmetry are reduced [110]. Thus, in horizontal M&A, acquirer firms are more concerned about how much equity share of target firms can be controlled to obtain greater scale and density economies, and thereby form the monopoly power for the entire ecosystem, gaining a greater comparative advantage [111].
Thirdly, the low information asymmetry in horizontal M&A results show that the target firms going public is not one of the significant features in the prediction model of horizontal M&A decisions. Acquirer firms in horizontal M&A do not rely solely on the target firms going public to obtain information or financial indicators to evaluate the growth of target firms. Acquirer firms can select target firms with growth potential based on acquirer firms’ experience due to their familiarity with the industry [22]. This also explains why the significance of financial features in the prediction model of horizontal M&A declined compared to the full sample prediction model.
Lastly, the ESG score’s impact is weaker for the cross-industry M&A. For one thing, in cross-industry M&A, industrial distance and differentiation lead to more serious information asymmetry. This will result in that acquirer firms prefer the target firms with profit and operation information acquired easily [110]. The ESG rating cannot provide this information. The other aspect is that from the ecosystem perspective, firms aim to quickly acquire key complementary technologies that require years of internal R&D by cross-industry M&A to gain important scope economies [22,112]. The firms with more ESG investment will divert more resource into the non-profit activities, lowering the R&D investment. In the case of low level of familiarity and high level of information asymmetry, target firms’ capabilities on profitability and growth potential play a significant role in the prediction model of cross-industry M&A. The acquirer will not choose the target firm with much ESG investment in the cross-industry M&A, since research capabilities, rather than ESG investment can affect post-M&A integration efficiency and potentials of co-evolution, which is of vital importance for the firm’s future sustainable development.
7. Conclusions
In this study, we have implemented and evaluated the AdaBoost and SVM methods for building a prediction model of cross-border M&A activities from a sustainable development and ecosystem perspective. The main concerns of the features utilized in this paper are divided into macroeconomics, geography, climate, cultural and law, deal and payment, ESG and financial indicators, with a focus on the exploration of their predictability of success for M&A. Firstly, we can support that the cross-border M&A with the motivation of ESG investment are associated with characteristics of sustainable development and corporate governance factors. Secondly, the M&A are the outcome of stakeholder value maximization and high ESG firms can achieve a higher success rate of M&A. Thirdly, the risk factor such as the size, growth, profitability, cash flow, leverage, investment and valuation, especially the valuation, size and profitability factor can still play an important role in determining the ESG investment and further foster the M&A. Fourthly, to achieve sustainable development and cultivate the ecosystem, cross-border M&A is highly correlated with the institution of the target country, such as the political effectiveness. The results showed that the AdaBoost method had better prediction performance in this task with accuracy of 80.1% and the model had generalization capability by evaluating against the 10-folder cross validation method and testing dataset. We further predict the sub-group M&A classified by horizontal and cross-industry M&A. The AdaBoost method has also achieved the best performance in terms of the prediction accuracy with 80.3% and 80.0% for horizontal and cross-industry M&A, respectively.
Our prediction modeling based on machine learning technique indicates that the matching of financial growth potential of target and acquirer firms is the most crucial factor in the M&A decisions for sustainable development even though the transaction and country-level factors from the ecosystem perspective are also considered. To conclude, our results show that the potential of co-evolution and the cost of post-M&A integration are two key factors for the prediction of M&A activities and sustainable development. From the ecosystem perspective, key features affecting M&A decisions include a firm’s growth potential and market value for the post-merger integration, such as market to book ratio, cash growth, ROA, ROE and net profit. The trade-offs between transaction costs and the cost of internalization are also important for the prediction of M&A decision, which is indicated by the feature “Sought”. These results further reinforce the key ecosystem argument, that the potential of co-evolution is the most important criterion for focal firms to find complementors and connect with them.
Our results, based on machine learning technique, extend and contribute to extensive research on ecosystem background, especially for the business ecosystem. However, this study still requires further extension from the following aspects. First, more delicate features for sustainable development can be adopted, which are not limited in the financial-related features, such as the news from social media or technological indicators. For example, the prior collaboration experience can reflect the common knowledge base of target and acquirer firms, which may play a key role in M&A decisions for sustainable development under ecosystem mapping. The position of target firms in acquirer firms’ supply chain is another typical indicator for the M&A decisions from the ecosystem perspective, as focal firms usually integrate the downstream firms to reduce the uncertainty of ecosystems [113,114]. The features-added method require a more delicate design than the features-extraction method to support it. Second, the prediction on M&A’s future sustainable development by adopting machine learning techniques can be used to analyze other sub-group samples, especially technological M&A. From the ecosystem perspective, technological M&A can link technological and business dimensions [7,10]. With the exploration on patent data analyses to derive ecosystem-related technological indicators, such as technological proximity and complementarity, machine learning techniques can be adopted to predict and support the decisions of technological M&A.
Author Contributions
Conceptualization, Y.G. and R.L.; methodology, X.H., Y.G. and R.L.; software, L.F. and X.L.; formal analysis, X.H. and X.L.; data curation, X.H., L.F. and X.L.; writing—original draft preparation, X.H.; writing—review and editing, X.H. and R.L.; funding acquisition, R.L. All authors have read and agreed to the published version of the manuscript.
Funding
The project was sponsored by the National Natural Science Foundation of China (71902196), initiated by Ruipeng Li; the Social Science Foundation of Fujian in China: (FJ2021C075), initiated by Yi Yang; the Social Science Foundation of Fujian in China (FJ2021B142), initiated by Lifang Chen.
Institutional Review Board Statement
Not applicable.
Informed Consent Statement
Not applicable.
Acknowledgments
For helpful comments and discussions, we thank Yushan Yang.
Conflicts of Interest
The authors declare no conflict of interest.
Appendix A
Table A1.
Description of variables.
Table A1.
Description of variables.
| Level | Factor Type | Variable | Definition |
|---|---|---|---|
| Dependent Variable | Complete Status or not | Whether the M&A is successful or not | |
| Country Level | Internationalization Advantage Factor | logGDPchange | The difference of GDP between the acquirer and target country’s |
| logGDP_peChange | The difference of GDP per capital between the acquirer and target country’s | ||
| ExchangeRateReturn | The difference of exchange rate between the acquirer and target country’s | ||
| CoporateTaxChange | The difference of corporate tax between the acquirer and target country’s | ||
| Geography Factor | Contig | Whether the acquirer country and target country share the same border of country | |
| aLandArea | The land area of the acquirer’s country (not include the sea territory) | ||
| tLandArea | The land area of the target’s country (not include the sea territory) | ||
| aAgriculturalLand | The percentage of the area of agricultural land on the total land for the acquirer country | ||
| tAgriculturalLand | The percentage of the area of agricultural land on the total land for the target country | ||
| aForestArea | The percentage of the area of forest land for the total land for the acquirer country | ||
| tForestArea | The percentage of the area of forest land for the total land for the target country | ||
| aNetForestDepletion | The percentage of the net forest depletion on the GNI for the acquirer country | ||
| tNetForestDepletion | The percentage of the net forest depletion on the GNI for the target country | ||
| aNaturalResourcesDepletion | The percentage of the natural resources depletion on the GNI for the acquirer country | ||
| tNaturalResourcesDepletion | The percentage of the natural resources depletion on the GNI for the target country | ||
| Climate Factor | aCO2Emissions | Carbon dioxide emissions for the acquirer country (metric tons per capita) | |
| tCO2Emissions | Carbon dioxide emissions for the target country (metric tons per capita) | ||
| aCO2Emissions_GDP | Carbon dioxide emissions for the acquirer country (kg per PPP $ of GDP) | ||
| tCO2Emissions_GDP | Carbon dioxide emissions for the target country (kg per PPP $ of GDP) | ||
| aNitrousOxideEmissions | Nitrous oxide emissions for the acquirer country (metric tons per capita) | ||
| tNitrousOxideEmissions | Nitrous oxide emissions for the target country (metric tons per capita) | ||
| aMethaneEmissions | Methane emissions for the acquirer country (metric tons per capita) | ||
| tMethaneEmissions | Methane emissions for the target country (metric tons per capita) | ||
| aGHGNetEmissionsAnd | Greenhouse gas (GHG) net emissions/removals by Land use change and forestry (LUCF) activities for the acquirer country (Mt) | ||
| Removals | |||
| tGHGNetEmissionsAnd | Greenhouse gas (GHG) net emissions/removals by land use change and forestry (LUCF) activities for the target country (Mt) | ||
| Removals | |||
| aPM2.5PollutionExposure | Average annual concentrations of PM2.5 by population in both urban and rural areas of acquirer country | ||
| tPM2.5PollutionExposure | Average annual concentrations of PM2.5 by population in both urban and rural areas of target country | ||
| Culture and Law Factor | Comlang | Whether the language of the acquirer country and target country are the same | |
| SameReligion | Whether the religion of the acquirer country and target country are the same | ||
| SameLegal | Whether the law system of the acquirer country and target country are the same | ||
| aLawRule | The Extent agents have confidence in the rules of society of acquirer country | ||
| tLawRule | The Extent agents have confidence in the rules of society of target country | ||
| aGovernEffective | The quality of public services, policy formulation and implementation, and the credibility of the government’s commitment for the acquirer country | ||
| tGovernEffective | The quality of public services, policy formulation and implementation, and the credibility of the government’s commitment for the target country | ||
| Transaction Level | Deal Factor | Sought | The percentage of stake acquired in M&A |
| DealValue | Value of transaction (Mil.) | ||
| DealPurpose | Whether the purpose of deal is the technology acquisition, resource preference or business expansion. It is measured by three dummy variables specifically. | ||
| Payment Factor | CashPay | Percentage paid in cash | |
| OtherPay | Percentage paid in other method | ||
| StockPay | Percentage paid in stock | ||
| UnknownPay | Percentage paid in unknown method | ||
| Firm Level | ESG Factor | aESGScore | Acquirer’s ESG Score (From KLD data base) |
| tESGScore | Target’s ESG Score (From KLD data base) | ||
| Information Factor | aPublicStatus | Public Status of acquirer firms | |
| tPublicStatus | Public Status of target firms | ||
| Size Factor | aAsset | Asset of acquirer | |
| tAsset | Asset of target | ||
| aSale | Sales of acquirer | ||
| tSale | Sales of target | ||
| aEmployee | Employee of acquirer | ||
| tEmployee | Employee of target | ||
| aEquity | Equity of acquirer | ||
| tEquity | Equity of target | ||
| Growth Factor | aMarket_to_Book | Market to book ratio of acquirer | |
| tMarket_to_Book | Market to book ratio of target | ||
| aCash_growth | Growth rate of cash flow for acquirer | ||
| tCash_growth | Growth rate of cash flow for target | ||
| Profitability Factor | aROA | Return of asset for acquirer | |
| tROA | Return of asset for target | ||
| aROE | Return of equity for acquirer | ||
| tROE | Return of equity for target | ||
| aNetProfit | Net profit of acquirer | ||
| tNetProfit | Net profit of target | ||
| aNetIncome | Net income of acquirer | ||
| tNetIncome | Net income of target | ||
| aNetProfitMargin | Net profit margin of acquirer | ||
| tNetProfitMargin | Net profit margin of target | ||
| Cash Flow Factor | aCash | Cash flow of acquirer | |
| tCash | Cash flow of target | ||
| aEBIT | Earning before interest and tax for acquirer | ||
| tEBIT | Earning before interest and tax for target | ||
| aEBITDA | Earning before interest, tax, depreciation and amortization for acquirer | ||
| tEBITDA | Earning before interest, tax, depreciation and amortization for target | ||
| Leverage Factor | aCapex | Capital expenditure for acquirer | |
| tCapex | Capital expenditure for target | ||
| aDebt | Debt of acquirer | ||
| tDebt | Debt of target | ||
| Investment Factor | aCOGS | Cost of good sold for acquirer | |
| tCOGS | Cost of good sold for target | ||
| aReturn_on_Investment | Return on investment(profit/investment) for acquirer | ||
| tReturn_on_Investment | Return on investment(profit/investment) for target | ||
| Valuation Factor | aShareOutstanding | Outstanding shares for acquirer | |
| tShareOutstanding | Outstanding shares for target | ||
| aPrice_adj | Adjusted stock price for acquirer | ||
| tPrice_adj | Adjusted stock price for target |
References
- Adner, R. Ecosystem as structure: An actionable construct for strategy. J. Manag. 2017, 43, 39–58. [Google Scholar] [CrossRef]
- Jacobides, M.G.; Cennamo, C.; Gawer, A. Towards a theory of ecosystems. Strateg. Manag. J. 2018, 39, 2255–2276. [Google Scholar] [CrossRef]
- Xu, G.; Wu, Y.; Minshall, T.; Zhou, Y. Exploring innovation ecosystems across science, technology, and business: A case of 3D printing in China. Technol. Forecast. Soc. Chang. 2018, 136, 208–221. [Google Scholar] [CrossRef]
- Thomas, L.; Autio, E.; Gann, D. Architectural Leverage: Putting Platforms in Context. Acad. Manag. Perspect. 2014, 28, 198–219. [Google Scholar] [CrossRef]
- Li, Y.-R. The technological roadmap of Cisco’s business ecosystem. Technovation 2009, 29, 379–386. [Google Scholar] [CrossRef]
- Tsujimoto, M.; Kajikawa, Y.; Tomita, J.; Matsumoto, Y. A review of the ecosystem concept—Towards coherent ecosystem design. Technol. Forecast. Soc. Chang. 2018, 136, 49–58. [Google Scholar] [CrossRef]
- Yang, C.-S.; Wei, C.-P.; Chiang, Y.-H. Exploiting Technological Indicators for Effective Technology Merger and Acquisition (M&A) Predictions. Decis. Sci. 2014, 45, 147–174. [Google Scholar] [CrossRef]
- Park, H.; Yoon, J.; Kim, K. Identification and evaluation of corporations for merger and acquisition strategies using patent information and text mining. Scientometrics 2013, 97, 883–909. [Google Scholar] [CrossRef]
- Dao, M.A.; Strobl, A. Exploration outcomes of M&A: The interplay between coordination mechanisms and acquisition experience. R&D Manag. 2019, 49, 86–102. [Google Scholar] [CrossRef]
- Gao, Y.; Liu, X.; Ma, X. How do firms meet the challenge of technological change by redesigning innovation ecosystem A case study of IBM. Int. J. Technol. Manag. 2019, 80, 241–265. [Google Scholar] [CrossRef]
- Christenen, C.M.; Alton, R.; Rising, C.; Waldeck, A. The new M&A playbook. Harvard Bus. Rev. 2011, 89, 74–88. [Google Scholar]
- Capron, L. The long-term performance of horizontal acquisitions. Strat. Manag. J. 1999, 20, 987–1018. [Google Scholar] [CrossRef]
- Weil, H.B.; Sabhlok, V.P.; Cooney, C.L. The dynamics of innovation ecosystems: A case study of the US biofuel market. Energy Strat. Rev. 2014, 3, 88–99. [Google Scholar] [CrossRef]
- Shao, B.; Asatani, K.; Sakata, I. Categorization of Mergers and Acquisitions in Japan Using Corporate Databases: A Fundamental Research for Prediction. In Proceedings of the 2018 IEEE International Conference on Industrial Engineering and Engineering Management (IEEM), Bangkok, Thailand, 16–19 December 2018. [Google Scholar]
- Parente, R.; Rong, K.; Geleilate, J.-M.G.; Misati, E. Adapting and sustaining operations in weak institutional environments: A business ecosystem assessment of a Chinese MNE in Central Africa. J. Int. Bus. Stud. 2019, 50, 275–291. [Google Scholar] [CrossRef]
- Ali-Yrkkö, J.; Hyytinen, A.; Pajarinen, M. Does patenting increase the probability of being acquired? Evidence from cross-border and domestic acquisitions. Appl. Financ. Econ. 2005, 15, 1007–1017. [Google Scholar] [CrossRef]
- Hain, D.S.; Jurowetzki, R. The potentials of machine learning and big data in entrepreneurship research–the liaison of econometrics and data science. In Handbook of Quantitative Research Methods in Entrepreneurship; Edward Elgar Publishing: Copenhagen, Denmark, 2018. [Google Scholar]
- Freund, Y.; Schapire, R.E. A Decision-Theoretic Generalization of On-Line Learning and an Application to Boosting. J. Comput. Syst. Sci. 1997, 55, 119–139. [Google Scholar] [CrossRef]
- Chari, A.; Ouimet, P.P.; Tesar, L.L. The Value of Control in Emerging Markets. Rev. Financ. Stud. 2009, 23, 1741–1770. [Google Scholar] [CrossRef]
- Phillips, G.M.; Alexei, Z. R&D and the incentives from merger and acquisition activity. Rev. Financ. Stud. 2013, 26, 34–78. [Google Scholar]
- Rossi, S.; Volpin, P.F. Cross-country determinants of mergers and acquisitions. J. Financ. Econ. 2004, 74, 277–304. [Google Scholar] [CrossRef]
- Ahern, K.R.; Daminelli, D.; Fracassi, C. Lost in translation? The effect of cultural values on mergers around the world. J. Financ. Econ. 2015, 117, 165–189. [Google Scholar] [CrossRef]
- Bekaert, G.; Engstrom, E. Asset Return Dynamics under Habits and Bad Environment–Good Environment Fundamentals. J. Political-Econ. 2017, 125, 713–760. [Google Scholar] [CrossRef]
- Bris, A.; Brisley, N.; Cabolis, C. Adopting better corporate governance: Evidence from cross-border mergers. J. Corp. Financ. 2008, 14, 224–240. [Google Scholar] [CrossRef]
- Meador, A.L.; Church, P.H.; Rayburn, L.G. Development of prediction models for horizontal and vertial mergers. J. Financ. Strateg. Decis. 1996, 9, 11–23. [Google Scholar]
- Wei, C.-P.; Jiang, Y.-S.; Yang, C.-S. Patent Analysis for Supporting Merger and Acquisition (M&A) Prediction: A Data Mining Approach; Springer: Berlin/Heidelberg, Germany, 2008. [Google Scholar]
- Xiang, G.; Zheng, Z.; Wen, M.; Hong, J.; Liu, C. A supervised approach to predict company acquisition with factual and topic features using profiles and news articles on TechCrunch. In Proceedings of the Sixth International AAAI Conference on Weblogs and Social Media, Dublin, Ireland, 4–7 June 2012. [Google Scholar]
- Benders, N. Predicting Entrepreneurial Success with Machine Learning. Ph.D. Thesis, Erasmus University, Rotterdam, The Netherlands, 2016. [Google Scholar]
- Zhou, L.; Lai, K.K. AdaBoost Models for Corporate Bankruptcy Prediction with Missing Data. Comput. Econ. 2017, 50, 69–94. [Google Scholar] [CrossRef]
- Alfaro, E.; García, N.; Gámez, M.; Elizondo, D. Bankruptcy forecasting: An empirical comparison of AdaBoost and neural networks. Decis. Support Syst. 2008, 45, 110–122. [Google Scholar] [CrossRef]
- Vapnik, V.N. The Nature of Statistical Learning Theory; Taylor & Francis: Oxfordshire, UK, 1995. [Google Scholar]
- Shin, K.-S.; Lee, T.S.; Kim, H.-J. An application of support vector machines in bankruptcy prediction model. Expert Syst. Appl. 2005, 28, 127–135. [Google Scholar] [CrossRef]
- Zheng, D.; Yuan, Z.; Ding, S.; Cui, T. Enhancing environmental sustainability through corporate governance: The merger and acquisition perspective. Energy Sustain. Soc. 2021, 11, 1–15. [Google Scholar] [CrossRef]
- Adhikari, B.K. Causal effect of analyst following on corporate social responsibility. J. Corp. Financ. 2016, 41, 201–216. [Google Scholar] [CrossRef]
- Benabou, R.; Tirole, J. Individual and Corporate Social Responsibility. Economica 2010, 77, 1–19. [Google Scholar] [CrossRef]
- Aguilera, R.V.; Aragón-Correa, J.A.; Marano, V.; Tashman, P.A. The Corporate Governance of Environmental Sustainability: A Review and Proposal for More Integrated Research. J. Manag. 2021, 47, 1468–1497. [Google Scholar] [CrossRef]
- Iliev, P.; Roth, L. Do Directors Drive Corporate Sustainability? Work. Paper 2020. Available online: https://papers.ssrn.com/sol3/papers.cfm?abstract_id=3575501 (accessed on 3 May 2021).
- Borghesi, R.; Houston, J.F.; Naranjo, A. Corporate socially responsible investments: CEO altruism, reputation, and shareholder interests. J. Corp. Financ. 2014, 26, 164–181. [Google Scholar] [CrossRef]
- McCarthy, S.; Oliver, B.; Song, S. Corporate social responsibility and CEO confidence. J. Bank. Financ. 2017, 75, 280–291. [Google Scholar] [CrossRef]
- Landier, A.; Nair, V.B.; Wulf, J. Trade-offs in Staying Close: Corporate Decision Making and Geographic Dispersion. Rev. Financ. Stud. 2007, 22, 1119–1148. [Google Scholar] [CrossRef]
- Di Guili, A.; Kostovetsky, L. Are red or blue companies more likely to go green? Politics and corporate social responsibility. J. Finan. Econ. 2014, 111, 158–180. [Google Scholar] [CrossRef]
- Lu, J. Can the green merger and acquisition strategy improve the environmental protection investment of listed company?—ScienceDirect. Environ. Impact Assess. Rev. 2021, 86, 106470. [Google Scholar] [CrossRef]
- Lin, T.T.; Huang, Y.S. Merger and acquisition decisions analysis with sustainability operation concept. In Proceedings of the 2011 IEEE International Conference on Industrial Engineering and Engineering Management, Singapore, 6–9 December 2011; pp. 51–55. [Google Scholar]
- Samoylenko, V.V. The Practice of Mergers and Acquisitions in the Banking Industry. Bus. Strateg. 2016, 4. [Google Scholar] [CrossRef]
- Buchanan, B.; Cao, C.X.; Chen, C. Corporate social responsibility, firm value, and influential institutional ownership. J. Corp. Financ. 2018, 52, 73–95. [Google Scholar] [CrossRef]
- Gillan, S.L.; Hartzell, J.C.; Koch, A.; Starks, L.T. Firms Environmental, Social and Governance (ESG) choices, Performance and Managerial Motivation. Working Paper 2010. Available online: https://www.researchgate.net/profile/Maretno-Harjoto/publication/265849879_Board_Diversity_and_Corporate_Social_Responsibility/links/56024b2e08aeb30ba7355cda/Board-Diversity-and-Corporate-Social-Responsibility.pdf (accessed on 3 May 2021).
- Jian, M.; Lee, K.-W. CEO compensation and corporate social responsibility. J. Multinatl. Financ. Manag. 2015, 29, 46–65. [Google Scholar] [CrossRef]
- Ferrell, A.; Liang, H.; Renneboog, L. Socially Responsible Firms. J. Finan. Econ. 2016, 122, 585–606. [Google Scholar] [CrossRef]
- Ikram, A.; Li, Z.; Minor, D. CSR-contingent executive compensation contracts. J. Bank. Financ. 2019, 105655. [Google Scholar] [CrossRef]
- Coase, R.H. The Nature of the Firm. Economica 1937, 4, 386–405. [Google Scholar] [CrossRef]
- Alchian, A.; Demsetz, H. Production, information costs, and economic organization. Am. Econ. Rev. 1972, 62, 777–795. [Google Scholar]
- Jensen, M.C.; Meckling, W.H. Theory of the firm: Managerial behavior, agency costs and ownership structure. J. Financ. Econ. 1976, 3, 305–360. [Google Scholar] [CrossRef]
- Cornell, B.; Shapiro, A.C. Corporate Stakeholders and Corporate Finance. Financ. Manag. 1987, 16, 5–14. [Google Scholar] [CrossRef]
- Hill, C.W.L.; Jones, T.M. Stakeholder-agency theory. J. Manag. Stud. 1992, 29, 131–154. [Google Scholar] [CrossRef]
- Jensen, M.C. Value Maximization, Stakeholder Theory, and the Corporate Objective Function. J. Appl. Corp. Financ. 2001, 4, 8–21. [Google Scholar] [CrossRef]
- Jawahar, I.M.; McLaughlin, G.L. Toward a Deive Stakeholder Theory: An Organizational Life Cycle Approach. Acad. Manag. Rev. 2001, 26, 397–414. [Google Scholar] [CrossRef]
- Freeman, R.E.; Wicks, A.C.; Parmar, B. Stakeholder Theory and “The Corporate Objective Revisited”. Organ. Sci. 2004, 15, 364–369. [Google Scholar] [CrossRef]
- Bisceglia, M.; Padilla, J.; Piccolo, S.; Shekhar, S. Vertical Integration, Innovation and Foreclosure with Competing Ecosystems. SSRN Working Paper 2021. Available online: https://papers.ssrn.com/sol3/papers.cfm?abstract_id=3913301 (accessed on 5 May 2021).
- Deng, X.; Kang, J.-K.; Low, B.S. Corporate social responsibility and stakeholder value maximization: Evidence from mergers. J. Financ. Econ. 2013, 110, 87–109. [Google Scholar] [CrossRef]
- Edmans, A. Does the stock market fully value intangibles? Employee satisfaction and equity prices. J. Financ. Econ. 2011, 101, 621–640. [Google Scholar] [CrossRef]
- Flammer, C. Does Corporate Social Responsibility Lead to Superior Financial Performance? A Regression Discontinuity Approach. Manag. Sci. 2015, 61, 2549–2568. [Google Scholar] [CrossRef]
- Tang, D.Y.; Zhang, Y. Do shareholders benefit from green bonds? J. Corp. Financ. 2020, 61, 101427. [Google Scholar] [CrossRef]
- Flammer, C. Corporate green bonds. J. Financ. Econ. 2021, 142, 499–516. [Google Scholar] [CrossRef]
- Starks, L.T. EFA Keynote Speech: “Corporate Governance and Corporate Social Responsibility: What Do Investors Care about? What Should Investors Care about?”. Financ. Rev. 2009, 44, 461–468. [Google Scholar] [CrossRef]
- EI Ghoul, S.; Guedhami, O.; Kwok, C.C.; Mishra, D.R. Does corporate social responsibility affect the cost of capital? J. Bank. Financ. 2011, 35, 2388–2406. [Google Scholar] [CrossRef]
- Hong, H.; Kacperczyk, M. The price of sin: The effects of social norms on markets. J. Financ. Econ. 2009, 93, 15–36. [Google Scholar] [CrossRef]
- Ilhan, E.; Sautner, Z.; Vilkov, G. Carbon Tail Risk. Rev. Financ. Stud. 2021, 34, 1540–1571. [Google Scholar] [CrossRef]
- Hong, H.; Liskovich, I. Crime, Punishment and the Halo Effect of Corporate Social Responsibility. SSRN Paper 2015. Available online: https://www.nber.org/system/files/working_papers/w21215/w21215.pdf (accessed on 1 March 2021).
- Albuquerque, R.; Koskinen, Y.; Zhang, C. Corporate Social Responsibility and Firm Risk: Theory and Empirical Evidence. Manag. Sci. 2019, 65, 4451–4469. [Google Scholar] [CrossRef]
- Schiller, C. Global Supply-Chain Networks and Corporate Social Responsibility. SSRN Papers. 2018. Available online: https://papers.ssrn.com/sol3/papers.cfm?abstract_id=3089311 (accessed on 1 March 2021).
- Becchetti, L.; Ciciretti, R.; Hasan, I. Corporate social responsibility, stakeholder risk, and idiosyncratic volatility. J. Corp. Financ. 2015, 35, 297–309. [Google Scholar] [CrossRef]
- Baker, S.D.; Hollifield, B.; Osambela, E. Asset Prices and Portfolios with Externalities. SSRN Papers 2020. Available online: https://papers.ssrn.com/sol3/papers.cfm?abstract_id=3344940 (accessed on 1 March 2021).
- Chava, S. Environmental Externalities and Cost of Capital. Manag. Sci. 2014, 60, 2223–2247. [Google Scholar] [CrossRef]
- Ng, A.C.; Rezaee, Z. Business sustainability performance and cost of equity capital. J. Corp. Financ. 2015, 34, 128–149. [Google Scholar] [CrossRef]
- Breuer, W.; Müller, T.; Rosenbach, D.; Salzmann, A. Corporate social responsibility, investor protection, and cost of equity: A cross-country comparison. J. Bank. Financ. 2018, 96, 34–55. [Google Scholar] [CrossRef]
- Seltzer, L.; Starks, L.T.; Zhu, Q. Climate Regulatory Risk and Corporate Bonds. SSRN Papers 2020. Available online: https://papers.ssrn.com/sol3/papers.cfm?abstract_id=3563271 (accessed on 1 December 2021).
- Zerbib, O.D. The effect of pro-environmental preferences on bond prices: Evidence from green bonds. J. Bank. Financ. 2019, 98, 39–60. [Google Scholar] [CrossRef]
- Hong, H.; Kubik, J.; Scheinkman, J. Financ. Constraints on Corporate Goodness. SSRN Papers 2012. Available online: https://papers.ssrn.com/sol3/papers.cfm?abstract_id=1784357 (accessed on 1 December 2021).
- Liang, H.; Renneboog, L. On the Foundations of Corporate Social Responsibility. J. Financ. 2016, 72, 853–910. [Google Scholar] [CrossRef]
- Cai, Y.; Pan, C.H.; Statman, M. Why do countries matter so much in corporate social performance? J. Corp. Financ. 2016, 41, 591–609. [Google Scholar] [CrossRef]
- Wang, Y.; Zhi, Q. The Role of Green Finance in Environmental Protection: Two Aspects of Market Mechanism and Policies. Energy Procedia 2016, 104, 311–316. [Google Scholar] [CrossRef]
- Dikova, D.; Sahib, P.R. Is cultural distance a bane or a boon for cross-border acquisition performance? J. World Bus. 2013, 48, 77–86. [Google Scholar] [CrossRef]
- Jha, A.; Cox, J. Corporate social responsibility and social capital. J. Bank. Financ. 2015, 60, 252–270. [Google Scholar] [CrossRef]
- Huizinga, H.P.; Voget, H.J. International Taxation and the Direction and Volume of Cross-Border M&As. J. Financ. 2009, 64, 1217–1249. [Google Scholar]
- Ellison, G.; Glaeser, E.L. Geographic Concentration in U.S. Manufacturing Industries: A Dartboard Approach. J. Political Econ. 1997, 105, 889–927. [Google Scholar] [CrossRef]
- Fama, E.F.; French, K.R. The Cross-section of Expected Stock Returns. Crit. Financ. Rev. 1992, 47, 427–465. [Google Scholar] [CrossRef]
- Fama, E.F.; French, K.R. Multifactor Explanations of Asset Pricing Anomalies. J. Financ. 1996, 51, 55–84. [Google Scholar] [CrossRef]
- Ball, R.; Gerakos, J.; Linnainmaa, J.T.; Nikolaev, V.V. Deflating profitability. J. Financ. Econ. 2015, 117, 225–248. [Google Scholar] [CrossRef]
- Hou, K.; Xue, C.; Zhang, L. Digesting Anomalies: An Investment Approach. Rev. Financ. Stud. 2014, 28, 650–705. [Google Scholar] [CrossRef]
- Liu, W. A liquidity-augmented capital asset pricing model. J. Financ. Econ. 2006, 82, 631–671. [Google Scholar] [CrossRef]
- Piotroski, J.D. Value Investing: The Use of Historical Financial Statement Information to Separate Winners from Losers. J. Account. Res. 2000, 38, 1–52. [Google Scholar] [CrossRef]
- Xing, Y. Interpreting the Value Effect through the Q-Theory: An Empirical Investigation. Rev. Financ. Stud. 2007, 21, 1767–1795. [Google Scholar] [CrossRef]
- Giovanni, J.D. What Drives Capital Flows?, The Case of Cross-Border M&A Activity and Financial Deepening. J. Int. Econ. 2005, 65, 127–149. [Google Scholar]
- Erel, I.; Liao, R.C.; Weisbach, M.S. Determinants of Cross-Border Mergers and Acquisitions. J. Financ. 2012, 67, 1045–1082. [Google Scholar] [CrossRef]
- Hsieh, J.; Lyandres, E.; Zhdanov, A. A Theory of Merger-Driven IPOs. J. Financ. Quant. Anal. 2011, 46, 1367–1405. [Google Scholar] [CrossRef]
- Frésard, L.; Hege, U.; Phillips, G. Extending Industry Specialization through Cross-Border Acquisitions. Rev. Financ. Stud. 2017, 30, 1539–1582. [Google Scholar] [CrossRef]
- Grossman, S.J.; Hart, O.D. The Costs and Benefits of Ownership: A Theory of Vertical and Lateral Integration. J. Political-Econ. 1986, 94, 691–719. [Google Scholar] [CrossRef]
- Klein, S.; Frazier, G.L.; Roth, V.J. A Transaction Cost Analysis Model of Channel Integration in International Markets. J. Mark. Res. 1990, 27, 196–208. [Google Scholar] [CrossRef]
- Rhodes-Kropf, M.; Robinson, D.T. The Market for Mergers and the Boundaries of the Firm. J. Financ. 2008, 63, 1169–1211. [Google Scholar] [CrossRef]
- Andrade, G.; Mitchell, M.; Stafford, E. New Evidence and Perspectives on Mergers. J. Econ. Perspect. 2001, 15, 103–120. [Google Scholar] [CrossRef]
- Betton, S.; Eckbo, B.E.; Thorburn, K.S. Corporate Takeovers. Handbook of Empirical Corporate Finance; Elsevier: Amsterdam, The Netherlands, 2008; pp. 291–429. [Google Scholar]
- Mueller, D.C. A Theory of Conglomerate Mergers. Q. J. Econ. 1969, 83, 643–659. [Google Scholar] [CrossRef]
- Asquith, P. Merger bids, uncertainty, and stockholder returns. J. Financ. Econ. 1983, 11, 51–83. [Google Scholar] [CrossRef]
- Malatesta, P.H. The wealth effect of merger activity and the objective functions of merging firms. J. Financ. Econ. 1983, 11, 155–181. [Google Scholar] [CrossRef]
- Malmendier, U.; Tate, G. Superstar CEO. Q. J. Econ. 2009, 124, 1593–1638. [Google Scholar] [CrossRef]
- Mikkelson, W.H.; Partch, M.M.; Shah, K. Ownership and operating performance of companies that go public. J. Financ. Econ. 1997, 44, 281–307. [Google Scholar] [CrossRef]
- Alquist, R.; Mukherjee, R.; Tesar, L.L. Liquidity-Driven FDI. Working Paper 2015. Available online: http://fordschool.umich.edu/rsie/workingpapers/Papers626-650/r646.pdf (accessed on 1 May 2021).
- Almeida, H.; Campello, M.; Hackbarth, D. Liquidity Mergers. J. Financ. Econ. 2011, 102, 526–558. [Google Scholar] [CrossRef]
- Erel, I.; Jang, Y.; Weisbach, M.S. Do Acquisitions Relieve Target Firms’ Financial Constraints? J. Financ. 2015, 70, 289–328. [Google Scholar] [CrossRef]
- Hoberg, G.; Phillips, G. Product Market Synergies and Competition in Mergers and Acquisitions: A Text-Based Analysis. Rev. Financ. Stud. 2010, 23, 3773–3811. [Google Scholar] [CrossRef]
- Jandik, T.; Kali, R. Legal systems, information asymmetry, and firm boundaries: Cross-border choices to diversify through mergers, joint ventures, or strategic alliances. J. Int. Bus. Stud. 2008, 40, 578–599. [Google Scholar] [CrossRef]
- Hoberg, G.; Phillips, G. Text-Based Network Industries and Endogenous Product Differentiation. J. Political-Econ. 2016, 124, 1423–1465. [Google Scholar] [CrossRef]
- Maksimovic, V.; Phillips, G. Do Conglomerate Firms Allocate Resources Inefficiently Across Industries? Theory and Evidence. J. Financ. 2002, 57, 721–767. [Google Scholar] [CrossRef]
- Adner, R.; Kapoor, R. Value creation in innovation ecosystems: How the structure of technological interdependence affects firm performance in new technology generations. Strateg. Manag. J. 2010, 31, 306–333. [Google Scholar] [CrossRef]


Publisher’s Note: MDPI stays neutral with regard to jurisdictional claims in published maps and institutional affiliations. |
© 2022 by the authors. Licensee MDPI, Basel, Switzerland. This article is an open access article distributed under the terms and conditions of the Creative Commons Attribution (CC BY) license (https://creativecommons.org/licenses/by/4.0/).