Article

Digital Economy Development and Urban Green Innovation CA-Pability: Based on Panel Data of 274 Prefecture-Level Cities in China

Business School, Shandong University of Technology, Zibo 255000, China
*
Author to whom correspondence should be addressed.
Sustainability 2022, 14(5), 2921; https://doi.org/10.3390/su14052921
Submission received: 29 January 2022 / Revised: 22 February 2022 / Accepted: 22 February 2022 / Published: 2 March 2022

Abstract

:
The digital economy (DE) plays a crucial role in green innovation (GI) and green development as a new economic form. Based on the panel data of 274 Chinese prefecture-level cities from 2011 to 2019, this paper constructs a comprehensive DE index and conducts two-way fixed effect regression to explore its impact on GI capabilities and examines the mediating effect of industrial structure transformation and upgrading. The research results show that: (1) The development of the DE has significantly improved the GI capability of cities. (2) In terms of space, the development of DE and GI ability development in eastern cities outperform that in central and western regions. However, the development of eastern cities is almost saturated and slow, while the development of central and western cities is faster. (3) The DE has a significant role in promoting GI capabilities in the central and western regions. Although the eastern region has a positive impact, it is negligible. In terms of urban scale, the DE of the large, medium, and small cities positively affects GI capabilities to the effect. (4) The transformation and upgrading of the industrial structure mediate the relationship between the DE and GI. Based on the above conclusions, relevant suggestions for improving GI capabilities around the development of the DE and industrial transformation and upgrading must be devised.

1. Introduction

The Chinese economy has experienced rapid development since the beginning of the 21st century. The GDP jumped to second place globally, increasing nearly 15 times compared with the end of the 19th century, creating a miracle of world economic growth [1]. However, while the economy is growing rapidly, the protection of the environment is neglected. This way of improving economic development at the expense of the environment has heaped substantial pressure on the Chinese economy from high-speed development to high-quality development [2,3]. In the “Global Environmental Performance Index” report released in 2020, China only ranks 120th, reflecting the poor state of the Chinese environmental situation. To achieve a sustainable economy, development must be balanced under the restrictions of eco-environmental capacity and resource-bearing capacity [4]. Based on this, we urgently need to find a way to balance economic development and ecological environment, so GI has attracted the attention of many scholars [5,6,7]. Green innovation (hereinafter referred to as GI) refers to the technological innovation in green products and processes including energy savings, pollution control, waste recovery, green service, product design, or enterprise resource and environmental management [8]. In addition to directly creating economic value, GI can also yield environmental performance by reducing the impact on the entire life cycle of products of the ecological environment and ultimately achieve high-quality development of the society and economy, this is also the subject of this paper.
Over the past few years, digital technologies, such as IoT, Big Data, and AI have risen to prominence, and the digital economy (hereinafter referred to as DE) based on digital technologies has also achieved unprecedented development. The China Academy of Information and Communications Technology released the “White Paper on the Development of China’s Digital Economy (2020)”. The “White Paper” shows that in 2019, China’s digital economy’s added value reached CNY 35.8 trillion, accounting for 36.2% of the GDP. The DE has become one of the most important engines for economic growth. Likewise, the digital transformation of the economy and society substantially impacts the sustainable development of the environment [9]. In the existing literature, most of the research on DE and innovation are DE and enterprise innovation [10], user innovation in DE [11], and the impact of DE on technological innovation [12]. There are few literatures about the impact of DE development on urban GI ability. Under the background of the rapid development of DE, can the rapid development of the DE impact the region’s GI capabilities, considering the rapid development of the DE? What kind of characteristics will appear in the space? If the DE impacts GI capabilities, what is the impact mechanism? These issues have not yet been verified. Therefore, this paper aims to provide a detailed analysis of the issues raised above, examine the relationship between the DE and GI and provide novel ideas regarding GI development.
Numerous factors exert an impact on GI, such as impacts of environmental regulations on GI efficiency and GI performance [13,14,15], the impact on government subsidies on GI [16,17], the driving effect of carbon trading policies on GI [18,19], the impact on learning ability on GI ability [20,21], etc. However, in the context of the new era, the impact of DE as a new economic form on GI capacity merits further academic scrutiny, providing a novel idea for this study. This study also delves into the relationship of the DE on GI capabilities and mechanisms of action to supplement and improve the relevant theories of GI.
Therefore, to answer the above questions and enrich the theoretical research on the effect of the DE on GI, this paper establishes a comprehensive evaluation index of the DE based on the panel data onto each city from 2011 to 2019. The relationship between urban GI capabilities is analyzed and a reasonable explanation is provided. This research makes three main contributions: First, the current research mostly takes the national and provincial levels as the research objects. At the same time this paper narrows the research scope and uses prefecture-level cities as the research target. The research objects are more instructive than the national and provincial levels. Second, considering the differences in geographic location and development level of each city, this paper takes them as a starting point to discuss the regional heterogeneity characteristics and city scales heterogeneity characteristics of the DE on urban GI capabilities. Moreover, considering the influence of the policy in the time interval, the heterogeneity test is carried out with the policy promulgation time as node. The reasons for the heterogeneity are subsequently analyzed. Third, this study further explores the impact mechanism of the DE on urban GI capabilities, adopts the method of gradual regression to probe into the mediating role of industrial structure optimization between the DE and urban GI capabilities, and explains the mediating effect mechanism of action.
The following structural framework is: Section 2 is the theoretical analysis and research assumptions; Section 3 introduces the introduction of the models and related data used in the research methods; Section 4 contains the analysis and discussion of the research results including heterogeneity, robustness, and impact mechanism; Section 5 is a summary of the research and some relevant suggestions.

2. Theoretical Analysis and Research Assumptions

Digital technology has experienced rapid development and has continuously evolved. It has been extensively used in social production and life, thereby providing new technical support for GI. This section elaborates on the relevance between the DE and GI and puts forward the research hypothesis of this paper based on previous research on the DE and GI.

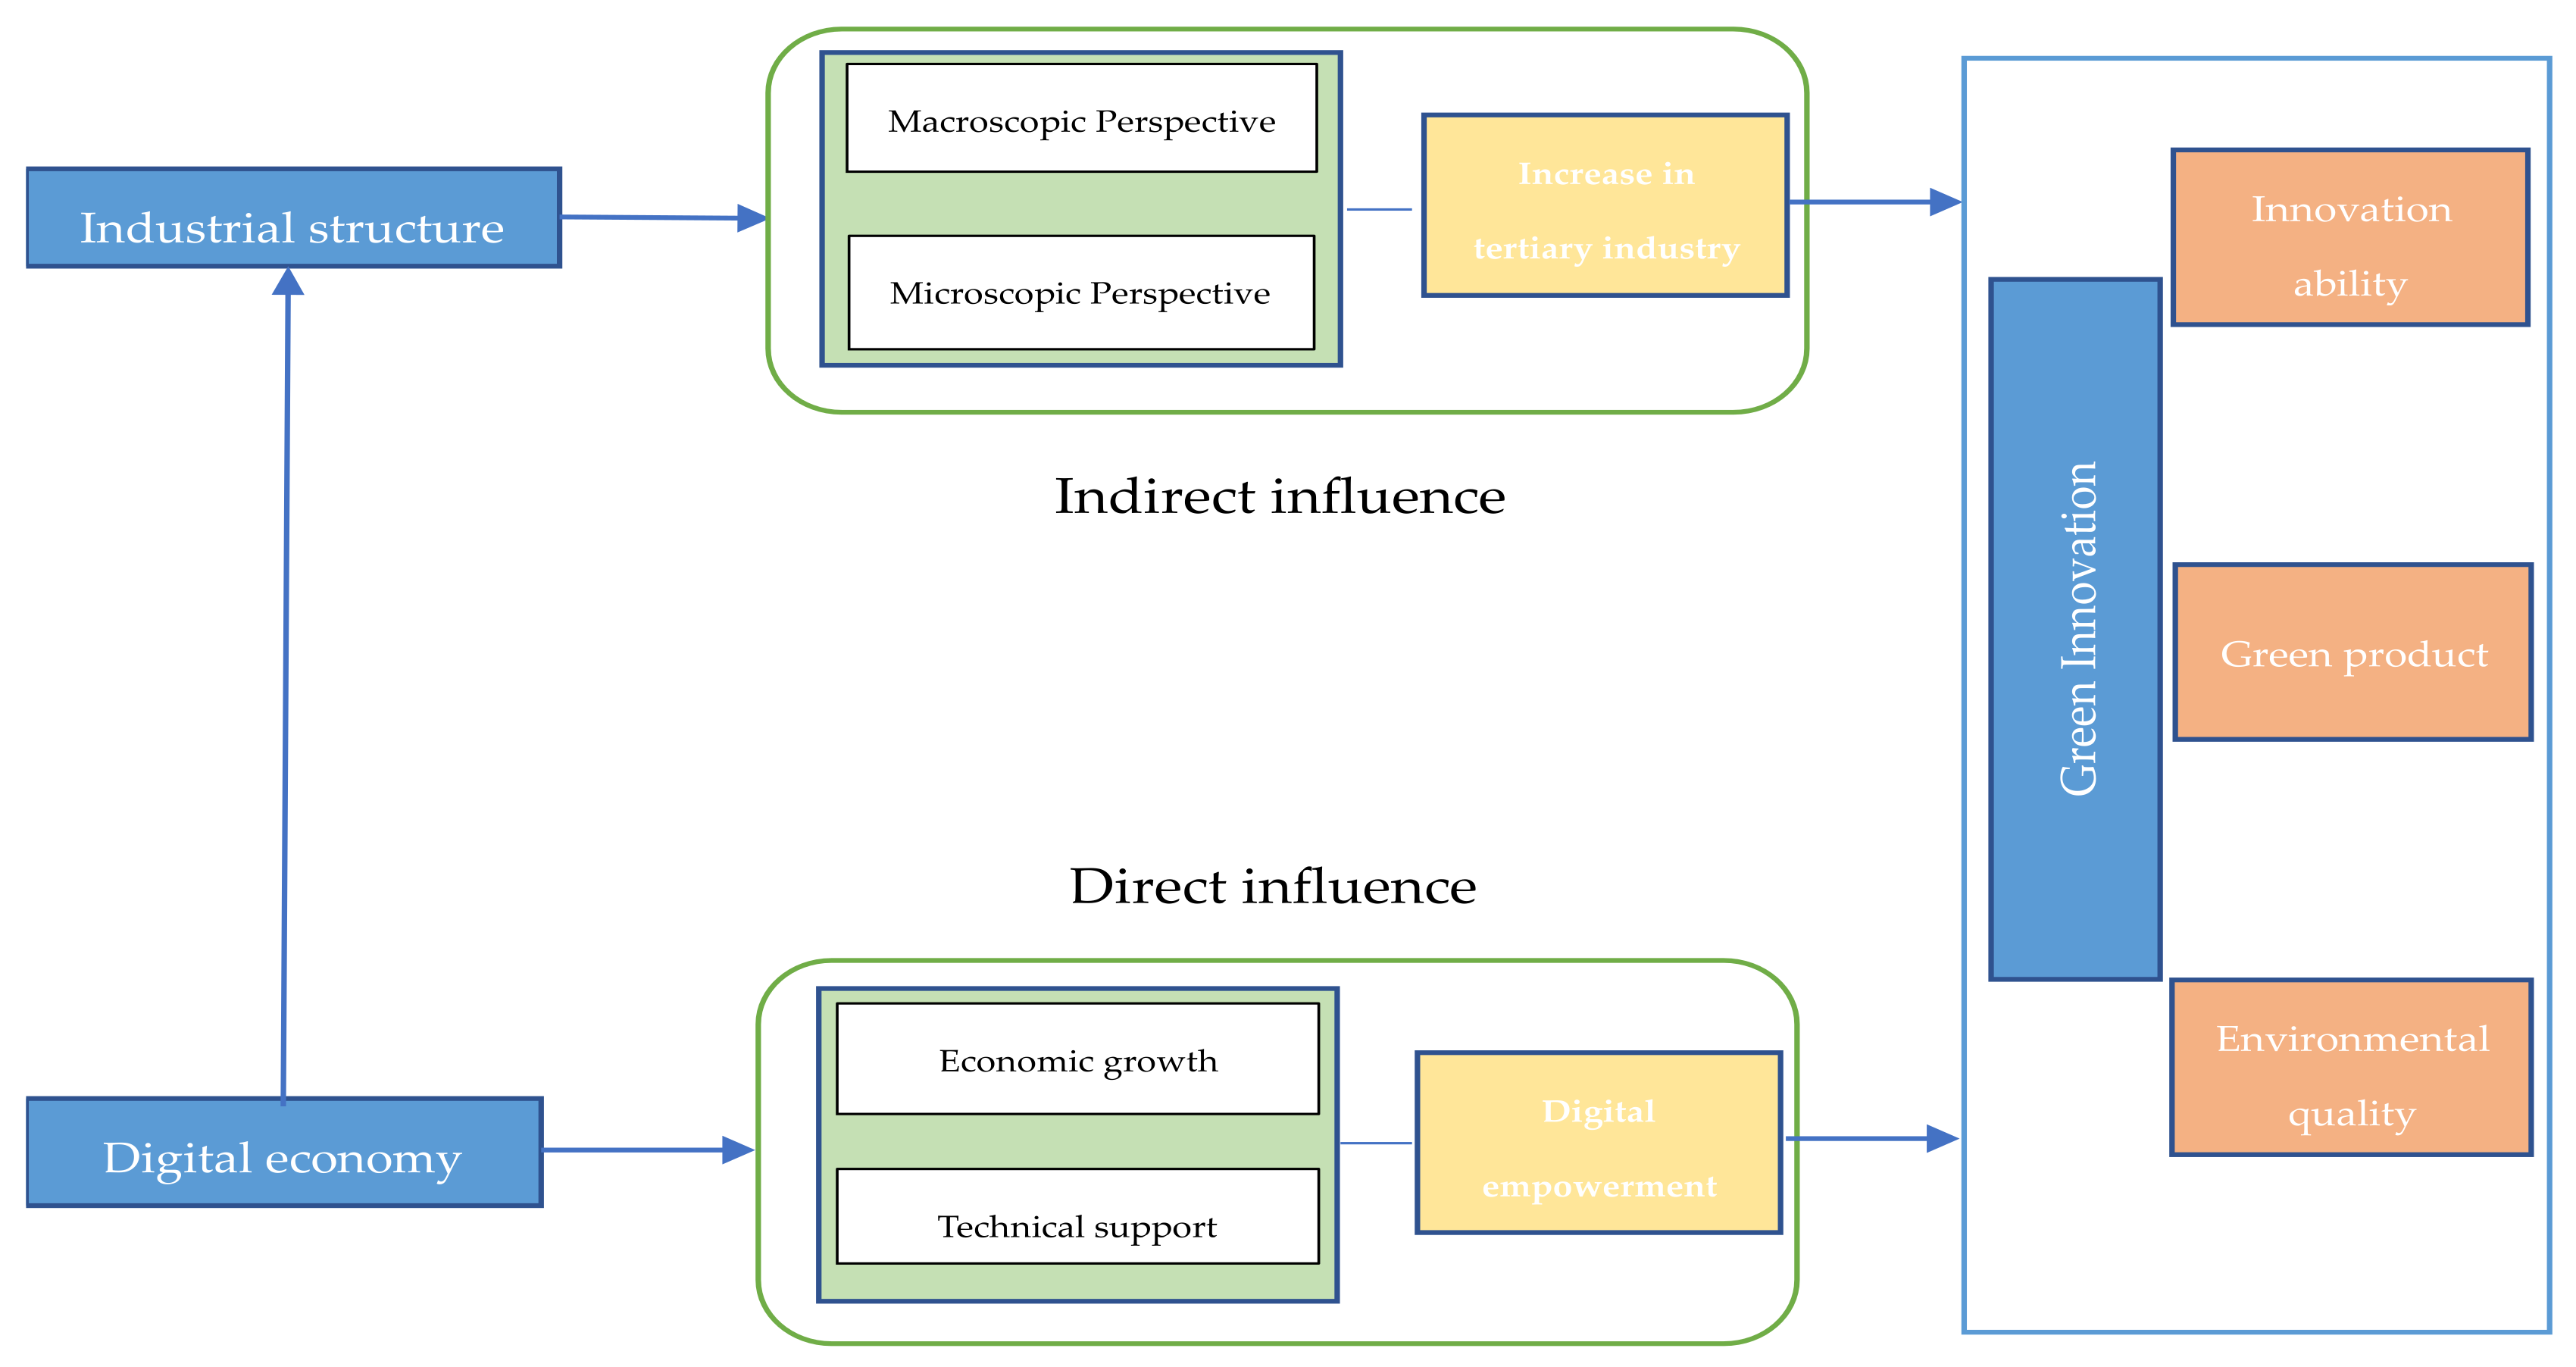
2.1. Digital Economy and Green Innovation

With the rapid development of the DE and the advancement of network information technology, new development models represented by the network economy continue to emerge, exerting a significant impact on the growth of the GI [6]. Moreover, the expansion of the Internet has entailed structural changes in China’s green total factor productivity, while also promoting further development of the green technology innovation [22]. The widespread application of new digital technologies has improved information asymmetry at the micro-level and made the market more transparent and fair. Therefore, enterprises have to innovate to ensure their survival and development, enhance the capacity for scientific and technological innovation, accelerate green product innovation and green transformation, and generate more services and products [23,24]. Wei and Sun [25], through a survey of 334 manufacturing enterprises in China, established that manufacturing digitization will affect enterprises. Green process innovation has a positive impact and is strengthened through horizontal information sharing and technology modularization. Vertical bottom-up learning weakens this impact. By using digital technology to collect information and share horizontal information, it provides enterprises with more knowledge and ideas and strengthens this positive impact, However, the bottom-up learning method of absorbing tacit knowledge from grass-roots employees will be rendered inefficient as employees focus on one field rather than information in other fields, which will negatively impact green process innovation At the macro level, Wang et al. [26] found that DE can enable green development, promote industrial structure optimization, and improve GI to achieve low-carbon transformation by studying the impact of digital technology innovation and technology spillover on carbon emissions. The rise of digital finance through digital technology fills the void left by traditional finance in promoting green technology innovation and energy and environmental performance [27]. Wang et al. [28] have considered the rapid development of digital finance and applied the MinDW model to gauge the efficiency of the green economy. The results show that the development of inclusive finance can promote the efficiency of the green economy by strengthening credit constraints on high-polluting enterprises. Therefore, through the above analysis, this paper proposes the first hypothesis:
Hypothesis 1 (H1).
The development of the DE plays a positive role in promoting the development of GI capabilities.

2.2. Digital Economy, Industrial Structure, and Green Innovation

The DE plays a significant role in accelerating industrial structure optimization, which most scholars have acknowledged [29,30,31,32]. Romanova [33] studied the focus on industrial policy formulation of the context of the DE. It highlighted that actively cooperating with various government departments in the formulation and management of the DE, the development of the DE, the industry plans and innovation development plans, are crucial for the digital transformation of the industry. Zhou et al. [34] applied the spatial and threshold models to empirically test the impact of the DE on haze pollution and its spatial spillover, and concluded that the DE promotes the construction of digital infrastructure through technology and accelerates the development of the digital industry through structural effect. It uses digital technology to empower traditional industries and improve energy and operational efficiency. Moreover, it promotes the optimization of industrial structure and ultimately reduces pollution emissions. The development of digital technology has also sparked the progress and innovation of DE. When discussing the new trends of the modern Belarusian industry, Mialeshka [35] stated that flexibility, adaptability, and individuality should be achieved through the trinity of digital production, digital services, and digital business models. industrial production, using various new technologies to improve the efficiency of traditional industries, prioritizing the full digitization of production, services, and business models (Figure 1).
Moreover, since the beginning of the 21st century, ‘green’ has become the recurring theme of development, and GI has played an essential role. With the development of green industries, the industrial structure has also changed. Previous research mainly focuses on the impact of industrial structure on GI efficiency [36,37] and pollution prevention [38,39,40]. Q. Y. Li [41] measured the GI efficiency of 30 provincial-level industrial enterprises in China and highlighted that R&D intensity and industrial structure are conducive to improving GI efficiency. Moreover, Long et al. [42] used the data envelopment analysis (DEA) model based on the super-relaxation measure (super-SBM) also measured the regional GI efficiency. The research results demonstrate that economic growth, government assistance, and industrial structure optimization are the leading forces that can directly improve cities’ green technology innovation ability in the Yangtze River economic belt. The development of smart cities will also influence GI and change air quality. Mak and Lam compared the air quality data openness (DOAQ) scores of 50 smart cities with the smart city scores of Eden Strategy Institute and ONG&ONG Pte Ltd. (2018) and other socio-economic attributes (i.e., social, political and humanistic), It was highlighted that the openness of environmental data is conducive to promoting urban air quality [43]. K. R. Du et al. [44] based on the data panel of 71 economies from 1996 to 2012, this paper studies the impact of green technology innovation on carbon dioxide emissions. The results show that industrial structure upgrading can boost the GI capacity of economies. Therefore, it has a significant inhibitory effect on carbon dioxide emissions. Therefore, this paper proposes the second hypothesis:
Hypothesis 2 (H2).
Industrial transformation and upgrading play an intermediary role in the impact of the DE on urban GI capabilities.

3. Research Design

3.1. Model Settings

The two-way fixed effects model studies the relationship between variables to prevent the influence of time or individual differences. This paper explores the effect of DE development on urban GI capabilities, and constructs the following measurement models based on urban panel data:
lnGPit = β0 + β1lnDEIit + β2lnControlit + λt + μi + εit
where i denotes the city and t is the year. GPit represents the explanatory variable, the city’s GI ability. DEIit stands for the digital economy composite index and is the core explanatory variable. ∑lnControlit is a set of control variables, including economic development level (GRP_PC), government intervention (GIv), science and technology expenditure (GEST), foreign investment (FDI), scientific research investment including funds and personnel (R&D_P, R&D_I). λt is the time fixed effect, μi is the individual fixed effect, and εit is the random disturbance term.
Moreover, this paper also probes into the mechanism of industrial structure optimization between the DE and GI capabilities. Therefore, a mediation effect model is constructed:
lnGPit = θ0 + θ1lnDEIit + θ2lnControlit + λt + μi + εit
lnISit = α0 + α1lnDEIit + α2lnControlit + λt + μi + εit
lnGPit = γ0 + γ1lnDEIit + γ2lnIS + γ3lnControlit + λt + μi + εit
A table was devised to more intuitively understand each step of mediation effect and delineate them (Table 1).
First, carry out regression analysis for Equation (2) to judge whether the regression coefficient is significant. When the p-value of the T-test is less than 0.05, it is significant, otherwise, it is not significant. if θ1 is not significant, the test is stopped, there is no intermediary effect. If it is significant, carry out the next test according to Equation (3). For the second test, if the coefficient α1 is not significant, the test is stopped, there is no intermediary effect. If significant, carry out the final test according to Equation (4). In the last step, we need to distinguish the significance of the coefficient, if γ1 and γ2 are significant, it is a partial mediating effect. If γ2 is significant, it is a complete intermediary effect.

3.2. Variable Description

3.2.1. Explained Variable

Urban green innovation capability. Presently, there is no unified understanding of the measurement indicators of GI capability. The measurement of GI capability in academia is mainly executed from the following dimensions: GI Index [45], GI performance [46], and the number of green patents [47,48]. The construction indicators and weights of the GI index are different; therefore, the constructed innovation index is not comprehensive and objective. Most of the research objects of GI performance are enterprises, where there is a lack of unified evaluation standards and indicators. A comprehensive measure of the inputs and outputs of GI, and GI patents fit that standard are thereby required. Green patents can reflect the input and output of the entire innovation process, so we choose the number of green patent applications as an indicator to measure GI capabilities. There are several external uncertainties regarding the number of green patent authorizations, which accounts for selecting the number of green patent applications instead of the number of green patent authorizations. Moreover, the number of green patent applications can accurately reflect the innovation ability and vitality of a region [49].
First, collect the relevant data of patent applications in each city from the China Intellectual Property Office and the incoPat database, and then filter out the IPC classification numbers of green patents in the “International Green Patent Classification List” issued by the World Intellectual Property Organization (WIPO) in 2010. For the number of green patent applications in cities, cities with serious missing data were excluded, and finally, the quantity of green patent applications in 274 cities was manually sorted out. In addition, since the quantity of urban green patent applications may be 0, this paper uses the natural logarithm of the quantity of green patent applications plus one as the dependent variable.

3.2.2. Explanatory Variables

Digital Economy Index. Through principal component analysis, multiple closely related indicators are integrated into one or several unrelated indicators, and the comprehensive indicators are used to represent other indicators. Therefore, this paper draws on the construction of DE indicators Li and Sun [9] and selects telecom business income, information transmission computer service and software employees, the number of broadband Internet access users, the number of mobile phone users, and the financial inclusion index are five items. These five indicators are integrated into one comprehensive indicator representing the digital economy through principal component analysis. The specific index composition is listed in Table 2:
It can be inferred from Table 3 that the cumulative contribution rate of the first three components has reached 94.76%. However, we calculate five principal components to boost the accuracy of the index. Through dimensionality reduction, five indexes are integrated into one index to replace the DE. According to the principal component score coefficient matrix, the linear expressions of the five principal components are obtained as
Y1 = TB × 0.5071 + IT × 0.4487 + IB × 0.4824 + MP × 0.5184 + FI × 0.2134
Y2 = TB × (−0.1984) − IT × 0.2687 + IB × 0.1592 − MP × 0.1036 + FI ×0.9233
Y3 = TB × 0.0897 + IT × 0.7046 − IB × 0.5753 − MP × 0.2815 + FI × 0.2919
Y4 = TB × (−0.7621) + IT × 0.4758 + IB × 0.4262 − MP × 0.0288 − FI × 0.1020
Y5 = TB × 0.3466 + IT × 0.0604 + IB × 0.4789 − MP × 0.8003 − FI × 0.0803
Finally, the calculated Y is multiplied by the ratio of their respective contribution rate to the total contribution rate and summed to obtain the comprehensive index. The DE index of 274 prefecture-level cities in China is as follows:
Digital Economy Index = Y1 × 0.6716 + Y2 × 0.1895 + Y3 × 0.0865 + Y4 × 0.0358 + Y5 × 0.0166

3.2.3. Control Variables

Based on relevant research on GI, the following factors are considered control variables in this paper:
  • Foreign Direct Investment (FDI). Foreign investment can introduce new technologies and models to the country and bring a lot of capital, substantially contributing to the research and development of green products. However, some scholars believe that foreign companies will transfer some low-tech, high-energy-consumption, and high-polluting enterprises to underdeveloped areas, that is, the “pollution haven hypothesis” [50]. Therefore, the enhancement of GI capabilities becomes more challenging.
  • Regional Economic Development Level (GRP_PC). The economic development level of a region is related to whether it can provide sufficient resources for GI. Due to various cities’ varying geographical locations and social development levels, gaps will arise in economic development, also impacting GI. Expressed in terms of per capita GDP [51].
  • Technology Expenditure (GEST). Science and technology research and development require substantial economic support. The amount of science and technology expenditure also reflects the importance of the attachment of a region to GI, which will significantly improve GI capacity and efficiency. It is expressed by the proportion of local governmental expenditure on technology [52].
  • R&D input (R&D_I). R&D institutions require finances to support innovation, and amount of financial input will affect the efficiency and quality of innovation [53].
  • R&D Personnel (R&D_P). R&D requires both capital and personnel investment. The increase of high-quality R&D personnel will accelerate the quality and efficiency of R&D and generate more new ideas and perspectives in mutual exchanges [18,53].
  • Government Intervention (GIv). The government’s intervention can guide the region to carry out GI, it can also strengthen the GI ability through the rational allocation of resources. It is expressed by the ratio of local financial expenditure to total national expenditure [54]. To reduce heteroscedasticity, all control variables above are in natural logarithmic form. The detailed variable definitions and indicators are shown in Table 4 and Table 5, the kurtosis and skewness of the data are used to describe the distribution of the data set. The kurtosis value of the data completely adhering to the normal distribution is 3. The larger the kurtosis value, the higher and sharper the distribution map. When the skewness is 0, it means that the data are relatively evenly distributed on both sides of the average value. When the skewness is greater than 0, the distribution diagram is biased to the right and less than 0 to the left. In this way, the distribution of variables can be obtained based on the data in Table 4.

3.3. Data Sources

Based on continuity, relevance, and authenticity of data, this paper establishes a panel dataset with 274 cities in China, including four municipalities and 270 prefecture-level cities, from 2011 to 2019. The data on the number of green patent applications used in the research comes from the incoPat database. The relevant indicator data and other variable data for constructing the digital economy index are from the China Urban Statistical Yearbook, prefecture-level city Statistical Yearbooks, and Statistical Yearbooks Bulleted.

4. Empirical Results and Discussion

4.1. Variable Multicollinearity Test Results

The correlation coefficients of the variables are shown in Table 6. The outcome shows that except for the investment of green innovation and R&D funds (0.766) and R&D personnel (0.827) and R&D funds and R&D personnel (0.905), the correlation coefficients of the other variables are less than 0.6, indicating no strong correlation between the control variables. The variance inflation factor (VIF) test (Table 7) is conducted on the variables, and the largest VIF value of the control variables is only 8.53 (R&D_P), which is much less than 10, and the mean value was 3.49. Therefore, there is no multicollinearity exists between the variables.

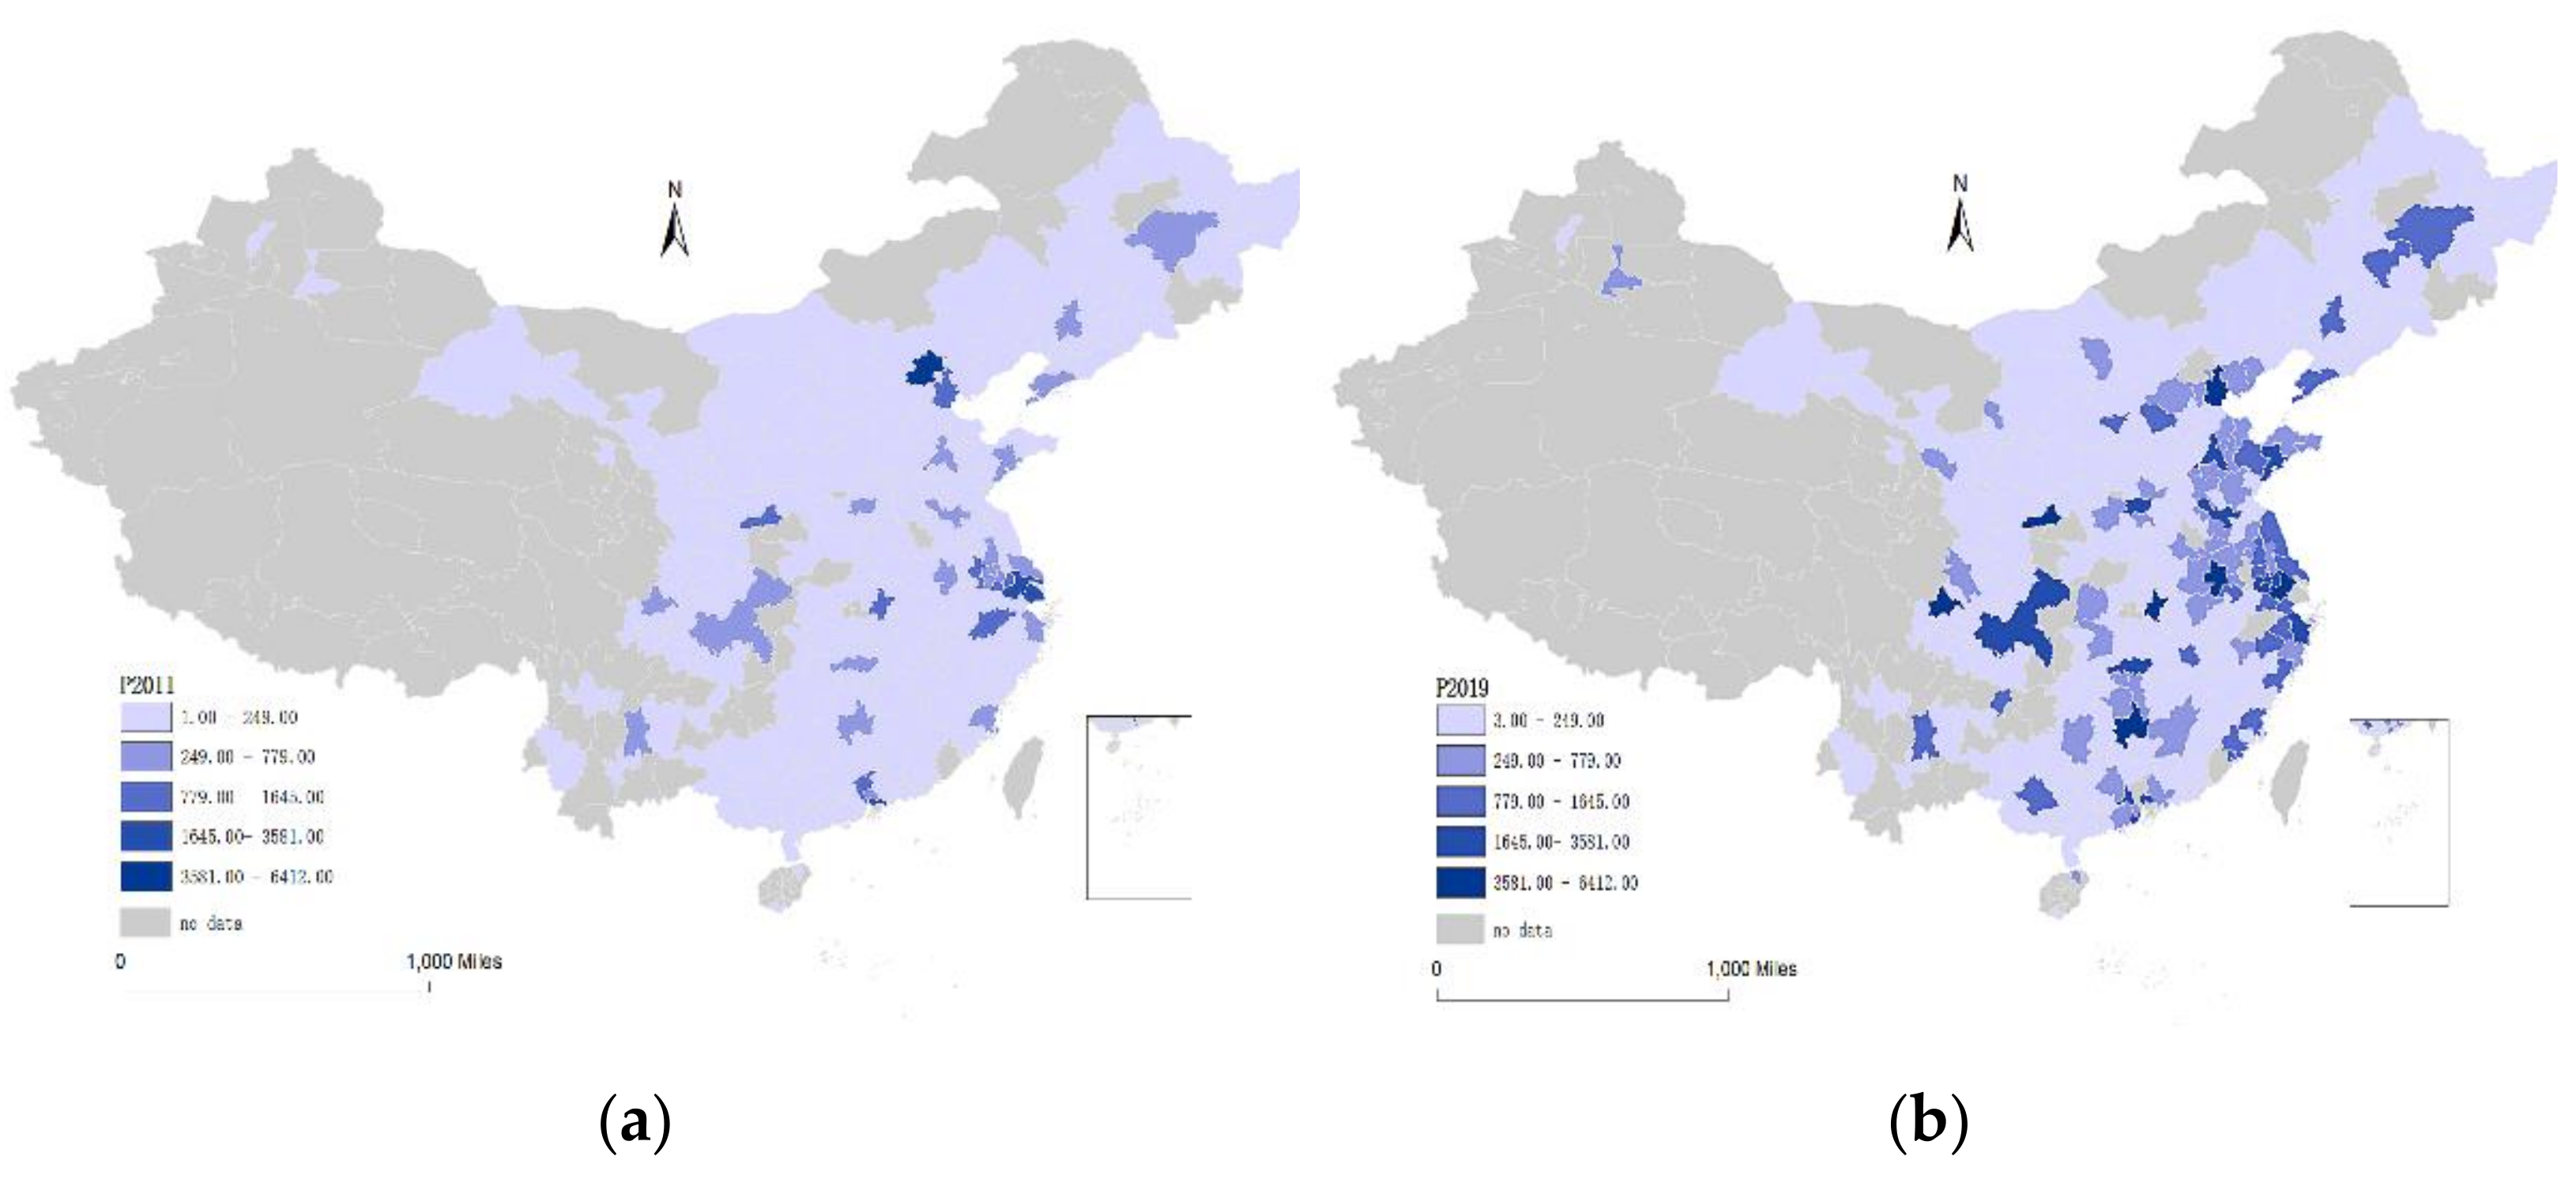
4.2. The Spatio-Temporal Evolution of the Urban Digital Economy and Green Innovation

To explore the spatial distribution and evolution characteristics of DE development and GI capabilities in Chinese cities, 2011 and 2019 were selected as the start and end years of the research.
It can be inferred from Figure 2a,b, that the DE of prefecture-level cities has generally shown an upward trend. Since 2011, the DE development level of the eastern region has markedly outperformed that of the mid-west. Over time, it is obvious from Figure 2b that the development of the mid-west has rapidly gradually narrowed the gap with the eastern cities. Although the eastern region has also developed to a certain extent, the increment was small. From the north and south perspective, the DE development level of the north and the south was equal at first. However, under the influence of various factors such as resource endowment, geographical location, and social development, the development speed of the south has far exceeded that of the north. As shown in the Figure 2a,b, in the north, except for Beijing, Tianjin, and the surrounding cities, which have experienced substantial progress in digital economic development, the rest of the cities are not far behind the previous ones. In the south, many cities have undergone substantial changes, such as Chongqing, Shanghai, Hangzhou, and so on. Moreover, inland cities in the northwest and southeast have a low level of development and a slow development pace, reflecting the uneven development of the DE among different regions.
Figure 3 illustrates the spatial distribution map of the number of green patent applications in Chinese cities. The Figure 3a shows that the overall green patents in 2011 were still relatively small, and most cities are still in the range of 1 to 249, indicating low GI ability. With the change of the country’s development direction, green has become the mainstream of the city that has begun to heed the significance of GI, and invested many resources to achieve the green transformation and green development of the city. As can be seen from Figure 3b the number of green patents in 2019 has increased significantly, half of the cities have broken through the boundary of 249, and the number of cities in the range of 1645 to 3581 and 3581 to 6412 has increased significantly compared with 2011. As inferred from the figure, although the number of green patents in the east has increased, the increase has been small, while the mid-west has a greater development than before. For the north and the south, it can be concluded that the GI capability of the south is much higher than that of the north. Similarly, as with the development of the DE, the number of green patents in the northwest and southeast inland areas is relatively small, and the GI capability is low. From the Figure 2 and Figure 3, we can see that areas with a high level of DE development tend to have strong GI capabilities, and the facts will be verified by empirical research conducted below.

4.3. Analysis of Two-Way Fixed Effect Regression Results

In this paper, based on Equation (1) as the model, a two-way fixed effect regression is performed, and the results are listed in Table 8. The first column contains only time and individual fixed effects regression results without control variables. From the results, the coefficient of the DE is 0.9525, and it is significant at the level of 1%, indicating that the development of the DE positively promotes the ability of GI. From the results of adding control variables in column (2), it can be further inferred that the DE coefficient is 0.0879, which is still significant at the level of 1%, verifying the strengthening effect of the development of the DE on GI capabilities. For every 1% increase in urban GI capacity, the city’s GI capacity increases by 0.0879%. The trend might result from data application greatly improving the resource allocation capacity in various economic and social fields, reducing innovation costs, and improving innovation efficiency. Data will not be depleted by use but will only increase. Moreover, the rapid development of the DE based on digital technology brings GI new technical support and more innovation
In terms of control variables, the coefficient of economic development level (GRP_PC) is 0.2469, which is significant at the 1% level. When the economic development level increases by 1%, the GI capability will increase by 0.24%. It shows that the level of the regional economic development is directly proportional to the GI capability of the region. The economic strength of a region represents the abundance of resources. The process of innovation requires numerous resources; therefore, the economic development level is proportional to the ability of GI. The foreign investment (FDI) coefficient is 0.0500, which is significant at the 1% level. These numbers show that foreign investment will improve regional GI capabilities, and foreign investment will bring many funds and new technologies to the region, all conducive to GI. The coefficient of science and technology expenditure (GEST) is 0.3411, which is significant at the 1% level. It shows that science and technology expenditure exerts a positive role in promoting regional GI capabilities. GI requires substantial financial support and the science and technology expenditure of a region reflects the importance of GI and provides funding support for GI. The government intervention (GIv) coefficient is 0.7813, which is significant at the 1% level. It shows that the government’s emphasis on GI has a marked effect on the improvement of GI capabilities, and the government’s rational allocation of resources is conducive to the improvement of GI capabilities, such as funds, talents, and technology. The coefficients of scientific research personnel and capital investment (R&D_P, R&D_I) are significantly positive, indicating that scientific research funds and personnel investment are directly proportional to the improvement of GI. This result is straightforward. GI requires high-quality talents and funds, which provides a guarantee.

4.4. Heterogeneity Analysis

4.4.1. Spatial Heterogeneity Analysis

China has a vast territory and a large population. The geographical and social environment of each city differs. There are significant differences in the development of the DE, green technology innovation, and economic development in different regions. Therefore, it is necessary to analyze the heterogeneity of cities in different regions. This article will divide the 274 cities into three parts according to the eastern, western, and central parts and Liu and Dong’s division standard reference [55]. The specific regression results are listed in Table 9.
Although the regression coefficient in the eastern region is positive, it is not significant, which is consistent with the conclusion drawn from the initial spatiotemporal evolution map. The DE in the Midwest area positively impacts GI capability. Its regression coefficients are 0.1845 and 0.2007, respectively, which is significant at the level of 1%, that is, when the development level of DE increases by 1%, the GI capacity of the central and western regions increases by 0.1845% and 0.2007%, respectively. These figures may be since eastern region has more advantages in GI development than the Midwest area due to its resource endowment and geographical location. It started earlier and has reached its peak after years of development. Therefore, the current development speed is slower than that of the Midwest area. Although the improvement of innovation ability has an impact, it is not significant. For the central and western regions, GI started late, just in time to catch up with the era of the great development of the DE. Using digital technology to carry out GI has substantially improved innovation efficiency. Therefore, the development of the DE is very significant for improving the GI ability of cities in central and western regions.

4.4.2. Urban Scale Heterogeneity Analysis

Cities of different scales have varying levels of development which in turn affect GI capabilities. Therefore, we explore the heterogeneity of DE development and GI capabilities in cities of different scales. Based on the difference in population, we refer to the practice of He et al. [56] to divide cities into small and medium cities (0–5 million people) and large cities (more than 5 million people). The specific results are listed in Table 10.
From the regression results, it can be seen that the regression parameters of the DE in large cities and small–medium cities are positive and significant. From Table 10, it can be seen that for every 1% increase in the development level of DE in small and medium-sized cities, the GI ability can be increased by 0.0645. For every 1% increase in the development level of DE in big cities, the GI ability can be increased by 0.0925. This shows that regardless of the size of the city, the development of DE can promote the improvement of GI capacity, probably because the DE has penetrated all fields of society and has become a vital engine to impel economic development. Every city has acknowledged the potential of the DE and started to vigorously develop digital industries, promoting the emergence of new formats and models, impelling the development of the overall economy, and providing technical and economic support for urban GI.

4.4.3. Policy Time Heterogeneity Analysis

In July 2015, the State Council issued the “Guiding Opinions on Actively Promoting the “Internet+” action, which indicated that the country values the development of the DE from a strategic perspective, and the deviation of the national policy direction will also affect the DE and GI in various regions. Therefore, this paper divides the time into two periods, 2011–2015 and 2016–2019, with the year of policy release as the boundary to analyze the heterogeneity before and after the policy release. The specific regression results are listed in Table 11.
According to the regression results, prior to the promulgation of the policy, the regression coefficient of the DE was significant at the 10% level, meaning that the development of the DE positively influenced the city’s GI capabilities. After the policy was promulgated, the coefficient of the DE was significant at the 1% level. The regression coefficient increased by 0.0272 compared to that before the implementation of the policy, indicating that the implementation of the policy plays an obvious role in facilitating the development of GI. Under the influence of the national development strategy, various regions have begun to focus on the development of informatization and digitalization, and the DE has begun to rise. Moreover, to promote the sustainable development of the economy, GI has gradually been concerned by various fields. With the growth of the DE, a great quantity of funds, personnel, and technologies have been provided to improve GI and thus improve the ability of GI.

4.5. Robustness Check

4.5.1. Endogenous Test

For the potential problem of variable omission, we use the instrumental variable method to deal with the endogenous problem. We choose the spherical distance between each city and Hangzhou as the instrumental variable. The distance will affect economic behavior, but will not change with economic development. At the same time, the distance between each city and Hangzhou is related to the development level of DE and will not affect GI through digital economic development, meeting the two conditions of instrumental variable. The specific regression results are shown in Table 12. In the first stage of regression, the p values of the LM statistics are all 0.000, which significantly rejects the original hypothesis. In the weak instrumental variable identification test, Wald F statistics is greater than the threshold of more than 10% of the weak identification test, so there is no weak instrumental variable. According to the regression results of instrumental variable method, we can see that after considering the endogenous problem, the effect of the development of DE on the improvement of urban GI ability is still obvious.

4.5.2. Other Robustness Tests

Firstly, we eliminate sample data from municipalities as the status of municipalities directly under the central government is equivalent to provinces and autonomous regions, and they have formed cities under the direct jurisdiction of the Central People’s Government. Therefore, to circumvent the deviation of the regression results caused by the differences of cities, we deleted the municipal data and re-run the regression. The results are listed in (1) in Table 13. After excluding the data of municipalities, the regression result is still positive and significant at the 1% level, indicating that after excluding the bias caused by urban differences, the development of the DE has indeed improved the GI capabilities of cities.
Secondly, from the practice of Sun et al., we take the proportion of Internet broadband access households and the total population as proxy variables of the DE, and perform regression, the results are as in (3), the results of the robustness analysis and the bidirectional fixed. The effect regression results are consistent, and the coefficients are all significantly positive, highlighting that that the development of the DE can promote the improvement of urban GI capabilities, that is to say, the regression results are robust.
Finally, to avoid the influence of outliers on the results, the data of all variables are reduced below 1% and above 99%. The regression results are shown in Table 13. It is evident in column (2) that the regression results remain significant after tail reduction, confirming the results of the previously fixed regression. To sum up, the results of these robustness tests all highlight the credibility of our findings, that is, the development of the DE is beneficial to improving GI capabilities.

4.6. Influence Mechanism Inspection

After the above two-way fixed effect results, we conclude that the DE can promote GI capacity, and it has passed the robustness test. This paper will further probe into the mediating effect of industrial structure optimization and upgrading on the DE and GI. To represent the industrial structure, we use the ratio of the secondary industry’s added value to the tertiary industry’s added value and Equations (2)–(4) to discuss the impact of the upgrading and transformation of the industrial structure.
Table 14 lists the regression results of the impact mechanism of the DE on GI. From (1), it can be inferred that the regression coefficient of DE is 0.0877, which is significant at the 1% level. the DE plays a positive role in promoting GI capabilities. Based on the regression coefficient in column (2) for the DE, the regression coefficient is −0.0747, that is, when the level of DE increases by 1%, the ratio of secondary industry to tertiary industry will decrease by 0.0747%, the DE will drive the development of the tertiary industry and transform the industrial structure from secondary to tertiary industries, which is conducive to promoting economic development and enhancing the vitality of economic development. The results in column (3) show that both the DE and industrial structure optimization can improve urban GI capabilities. The regression coefficient of IS is −0.1485. The regression coefficient of DE is 0.0766 which is smaller than the coefficient in column (1), indicating that industrial structure optimization in the DE has played a certain intermediary role in the impact of GI. When the DE level and industrial structure change by 1%, It will impact 0.1485 and 0.0766 on GI ability, respectively. The transformation and upgrading of industrial structure will play a mediating role because the progress of digital technology often accompanies the development of the DE. DE with high applicability is widely used by all walks of life, the application of digital technology to promote the green transformation of industrial, manufacturing, etc., and provides a powerful tool for the development of the tertiary industry. At present, green has become the theme of development. Most of the enterprises in the secondary industry are industries, manufacturing, gas, and electricity with high pollution degrees and should respond to the call of green development the call for green development, they actively carry out green transformation and achieve the purpose of energy conservation and environmental protection through the application of digital technology.

4.7. Other Discussions

The development of DE and GI is an important part of the development of smart cities, especially the innovative ideas and cutting-edge technologies embodied in the development process, which are conducive to the development of GI. Previous studies have pointed out the relationship between data openness and smart city development, providing a good idea for us to further improve our GI ability [43,57]. Under the background of DE, data have become a new factor of production. Increasing the openness of data through the application of digital technology is conducive to improving the air environment quality and the development of smart city, and then promoting the improvement of GI ability. However, there are also some problems between open data and smart city, such as insufficient balance of urban sustainability dimension and lack of technology [58]. For these problems, we should further optimize the policy and practice of data openness, constantly improve the maturity of data openness, and apply it to different scenarios and stages of smart city development to promote the sustainable development of smart city. The full development of smart cities also significantly impacts the DE and GI ability. The opening and sharing of data in various departments will make the GI process more convenient and efficient. At the same time, it is also conducive to applying innovation achievements in practice. An important role of data openness is to feed back the feelings of innovation achievements after application in practice. The feedback information can bring new innovation inspiration to further optimize products or services, form a virtuous circle, and continuously promote the improvement of GI ability.

5. Conclusions and Recommendations

5.1. Conclusions

This paper discussed the role of the DE on urban GI capacity and its impact mechanism. Based on the panel data of 274 prefecture-level cities from 2011 to 2019, a comprehensive index of the DE was constructed using the principal component analysis method, and the influence of the development of the DE on the GI capability was tested through two-way fixed effect regression and mediation effect. The specific results are as follows:
First, the two-way fixed effect regression results show that the development of DE significantly improves the city’s GI ability. When the control variables are controlled, the city’s GI ability increases by 0.0879% when the development level of the DE increases by 1%. This conclusion is still valid after controlling for urban differences, replacing explanatory variables, and performing robustness tests such as tail reduction.
Second, the spatial heterogeneity analysis was carried out first in terms of heterogeneity. The results showed that although the development of the DE in the eastern region can affect the GI ability, it is not significant. At the same time, the DE in the mid-west has a great significant promotion of the GI ability. From the perspective of city size, regardless of small or medium-sized cities or large cities, due to the development of the DE, the GI ability of cities has been improved; however, the impact on large cities is significantly higher than that in small–medium cities. From a policy perspective, the State Council promulgated the “Guiding Opinions on Actively Promoting “Internet Plus “Actions in 2015. This article uses 2015 as the boundary to explore the impact of DE development on GI before and after the policy was promulgated. From 2011 to 2015, before the policy was promulgated, the DE played a stimulative role in promoting GI. Similarly, after the policy was promulgated, the DE also played a positive role in promoting GI; nevertheless, the impact of capabilities is more pronounced than it was before enactment.
Third, in terms of the influence mechanism, industrial structure optimization plays an intermediary role in the impact of the DE on urban GI ability. On the one hand, the DE can directly affect the improvement of GI capabilities; on the other hand, the DE can affect the ability of GI by affecting the optimization of industrial structure
Although this study supplements the theory of the DE on GI, there are still some deficiencies. First, in the construction of indicators, based on the availability of data, the indicators are not sufficient to fully represent the development level of city’s DE. Future research can be adjusted according to the actual situation. Regarding the availability of data, Sanchez-Alonso’s practice can be used as reference to provide a set of enhanced and interoperable metadata to describe relevant data, and consider the requirements of data quality dimension and related data to improve its availability [59]. Secondly, although this study takes prefecture-level cities as the research object, the number of samples is limited because of a lack of data. The data can be improved in the future, and the number of samples can be expanded. When selecting control variables, proper attention should be given to whether they are appropriate and their actual impact on the explained variables as much as possible. The selection of the control variable of foreign direct investment in this paper overlooks the fact that account that the research object is a closed spatial domain but does not interact with the outside world. Therefore, the selection of control variables should be more rigorous in future research. Third, when studying the impact mechanism of the DE on GI, only the industrial structure is pointed out, and the role of other factors on the relationship between the two can be studied in the future, such as energy structure, environmental pollution, and so on. Finally, the development of the DE and GI will change over time. We should continue to show solicitude for their development trends and changes in their relationship.

5.2. Recommendations

(1) Promote the development of the DE in an all-around way, and make the DE a sustainable driving force for urban GI. The regression results reveal that the DE significantly influences cities’ ability to improve their GI capabilities. In other words, the DE is driving urban GI. A strong digital infrastructure, as well as a deep integration of digitalization with GI, are crucial to fully capturing the driving effect of the DE on GI, improving the level of digital construction in the region, and coordinating the appropriate investment of different resources. For digital applications in the entire industry chain, the government needs to improve the digital transformation governance system and guide enterprises to carry out digital transformation plans.
(2) Enhance the positive effect of the DE in enhancing GI capabilities by accelerating the industrial structure optimization. A crucial element in the impact of the DE on GI is the upgrading and transformation of the industrial structure, which allows for the application of digital technology to be strengthened and encourages the green transformation of enterprises. A constant increase in the proportion of the tertiary industry is necessary as well as strengthening the governance of polluting enterprises in secondary industry, vigorously developing high-tech industries, continuing to carry out green technological innovation, and truly achieving green development.
(3) Adapt measures to local conditions and give full play to the function of the DE in optimizing the allocation of different resource endowments in different regions. The experimental results reveal that the auxo-action of the DE on GI capability is more obvious in the mid-west. When the resource endowment of each city is quite different, the innovation-driven effect brought by the development of the DE should be released in a targeted manner. There is still obvious room for improvement in the mid-west. It is necessary to seize the opportunity of the DE, introduce talents and advanced technologies, create industries with characteristics of the DE, and make the DE a new engine for GI and regional economic development.
(4) The development of the DE and GI requires the support of human resources and continuously cultivating and introducing relevant talents. On the one hand, cities should strengthen the adhibition of existing digital technologies and the research and development of new digital technologies, strengthen the cultivation of talents, and in the meantime, strengthen the ability of innovation and practice, cultivate “innovation + practice” compound talents, and inject new impetus into GI. Alternatively, we need to strongly develop interdisciplinary and cutting-edge scientific technology and innovation disciplines, encouraging the cultivation of scientific and technological talent in these areas, and provide human resources for improving GI and developing the DE. In addition, we should strengthen economic development. Through the description of the relevant research results of other scholars, we find that the different level of economic development is also an important factor affecting the development of DE and GI ability. Regions with high economic level can introduce more new digital technologies, expand the application scenarios of digital technologies, and have strong digital development ability, so as to provide more resources for GI and promote its development [60,61]. A high level of economic development will attract talents and bring a lot of funds for R&D, which will promote the improvement of GI ability.

Author Contributions

Conceptualization, X.W. and H.Z.; methodology, X.W. and H.Z.; software, X.W. and X.S.; formal analysis, X.S.; resources, X.W. and X.S.; data curation, X.W. and H.Z.; writing—original draft preparation, X.W., writing—review and editing, C.X. and H.Z.; supervision, X.S. and C.X.; project administration, C.X. and H.Z.; funding acquisition, X.S.; All authors have read and agreed to the published version of the manuscript.

Funding

This work was supported by the project supported by the National Social Science Fund of China (19BGL276). The authors are grateful for the receipt of these funds.

Institutional Review Board Statement

Not applicable.

Informed Consent Statement

Not applicable.

Data Availability Statement

The data of green patent applications in this paper are from the Chinese Intellectual Property Office and incoPat database, and other variable data and related data of constructing digital economy indicators are from the Statistical yearbook of Chinese cities and the statistical yearbook of prefecture-level cities.

Acknowledgments

Thanks to all those who contributed to this article, and special thanks to Jiawei Chen for his support in writing and revising this article.

Conflicts of Interest

The authors declare no conflict of interest.

References

  1. Sheng, P.F.; Li, J.; Zhai, M.X.; Huang, S.J. Coupling of economic growth and reduction in carbon emissions at the efficiency level: Evidence from China. Energy 2020, 213, 12. [Google Scholar] [CrossRef]
  2. Liu, Y.; Liu, M.; Wang, G.G.; Zhao, L.L.; An, P. Effect of Environmental Regulation on High-quality Economic Development in China-An Empirical Analysis Based on Dynamic Spatial Durbin Model. Environ. Sci. Pollut. Res. 2021, 28, 54661–54678. [Google Scholar] [CrossRef] [PubMed]
  3. Zhao, P.J.; Zeng, L.E.; Lu, H.Y.; Zhou, Y.; Hu, H.Y.; Wei, X.Y. Green economic efficiency and its influencing factors in China from 2008 to 2017: Based on the super-SBM model with undesirable outputs and spatial Dubin model. Sci. Total Environ. 2020, 741, 17. [Google Scholar] [CrossRef] [PubMed]
  4. Fang, G.C.; Wang, Q.L.; Tian, L.X. Green development of Yangtze River Delta in China under Population-Resources-Environment-Development-Satisfaction perspective. Sci. Total Environ. 2020, 727, 11. [Google Scholar] [CrossRef]
  5. Song, W.; Yu, H. Green Innovation Strategy and Green Innovation: The Roles of Green Creativity and Green Organizational Identity. Corp. Soc. Responsib. Environ. Manag. 2018, 25, 135–150. [Google Scholar] [CrossRef]
  6. Wang, J.L.; Wang, W.L.; Ran, Q.Y.; Irfan, M.; Ren, S.Y.; Yang, X.D.; Wu, H.T.; Ahmad, M. Analysis of the mechanism of the impact of internet development on green economic growth: Evidence from 269 prefecture cities in China. Environ. Sci. Pollut. Res. 2022, 29, 9990–10004. [Google Scholar] [CrossRef]
  7. Xie, X.; Huo, J.; Zou, H. Green process innovation, green product innovation, and corporate financial performance: A content analysis method. J. Bus. Res. 2019, 101, 697–706. [Google Scholar] [CrossRef]
  8. Chen, Y.S.; Lai, S.B.; Wen, C.T. The influence of green innovation performance on corporate advantage in Taiwan. J. Bus. Ethics 2006, 67, 331–339. [Google Scholar] [CrossRef]
  9. Li, Z.H.X.; Li, N.Y.; Wen, H.W. Digital Economy and Environmental Quality: Evidence from 217 Cities in China. Sustainability 2021, 13, 20. [Google Scholar] [CrossRef]
  10. Li, R.; Rao, J.; Wan, L.Y. The digital economy, enterprise digital transformation, and enterprise innovation. Manag. Decis. Econ. 2022, 1–12. [Google Scholar] [CrossRef]
  11. Gault, F. User Innovation in the Digital Economy. Foresight STI Gov. 2019, 13, 6–12. [Google Scholar] [CrossRef]
  12. Ding, C.H.; Liu, C.; Zheng, C.Y.; Li, F. Digital Economy, Technological Innovation and High-Quality Economic Development: Based on Spatial Effect and Mediation Effect. Sustainability 2022, 14, 21. [Google Scholar] [CrossRef]
  13. Zhang, J.X.; Kang, L.; Li, H.; Ballesteros-Perez, P.; Skitmore, M.; Zuo, J. The impact of environmental regulations on urban Green innovation efficiency: The case of Xi'an. Sust. Cities Soc. 2020, 57, 9. [Google Scholar] [CrossRef]
  14. He, X.; Huang, S.Z.; Chau, K.Y.; Shen, H.W.; Zhu, Y.L. A Study on the Effect of Environmental Regulation on Green Innovation Performance: A Case of Green Manufacturing Enterprises in Pearl River Delta in China. Ekoloji 2019, 28, 727–736. [Google Scholar]
  15. Feng, Z.J.; Chen, W. Environmental Regulation, Green Innovation, and Industrial Green Development: An Empirical Analysis Based on the Spatial Durbin Model. Sustainability 2018, 10, 22. [Google Scholar] [CrossRef] [Green Version]
  16. Liu, Y.T.; Xu, H.; Wang, X.J. Government subsidy, asymmetric information and green innovation. Kybernetes 2021, 23. [Google Scholar] [CrossRef]
  17. Ma, W.M.; Zhang, R.R.; Chai, S.W. What Drives Green Innovation? A Game Theoretic Analysis of Government Subsidy and Cooperation Contract. Sustainability 2019, 11, 24. [Google Scholar] [CrossRef] [Green Version]
  18. Liu, B.L.; Sun, Z.Q.; Li, H.H. Can Carbon Trading Policies Promote Regional Green Innovation Efficiency? Empirical Data from Pilot Regions in China. Sustainability 2021, 13, 15. [Google Scholar] [CrossRef]
  19. Zhang, L.; Cao, C.C.; Tang, F.; He, J.X.; Li, D.Y. Does China's emissions trading system foster corporate green innovation? Evidence from regulating listed companies. Technol. Anal. Strateg. Manag. 2019, 31, 199–212. [Google Scholar] [CrossRef]
  20. Huang, S.Z.; Chau, K.Y.; Chien, F.S.; Shen, H.W. The Impact of Startups' Dual Learning on Their Green Innovation Capability: The Effects of Business Executives' Environmental Awareness and Environmental Regulations. Sustainability 2020, 12, 17. [Google Scholar] [CrossRef]
  21. Singh, H.; Abu Mansor, N.; Krubally, M.; Balder, N.; Ullah, H. Investigating the impact of dynamic and relational learning capabilities on green innovation performance of SMEs. Int. J. Adv. Appl. Sci. 2019, 6, 10–18. [Google Scholar] [CrossRef]
  22. Li, T.C.; Han, D.R.; Ding, Y.Y.; Shi, Z.Y. How Does the Development of the Internet Affect Green Total Factor Productivity? Evidence From China. IEEE Access 2020, 8, 216477–216490. [Google Scholar] [CrossRef]
  23. Lin, R.H.; Xie, Z.Y.; Hao, Y.H.; Wang, J. Improving high-tech enterprise innovation in big data environment: A combinative view of internal and external governance. Int. J. Inf. Manag. 2020, 50, 575–585. [Google Scholar] [CrossRef]
  24. Yang, X.D.; Wu, H.T.; Ren, S.Y.; Ran, Q.Y.; Zhang, J.N. Does the development of the internet contribute to air pollution control in China? Mechanism discussion and empirical test. Struct. Change Econ. Dyn. 2021, 56, 207–224. [Google Scholar] [CrossRef]
  25. Wei, Z.L.; Sun, L.L. How to leverage manufacturing digitalization for green process innovation: An information processing perspective. Ind. Manage. Data Syst. 2021, 121, 1026–1044. [Google Scholar] [CrossRef]
  26. Wang, L.; Chen, Y.Y.; Ramsey, T.S.; Hewings, G.J.D. Will researching digital technology really empower green development? Technol. Soc. 2021, 66, 13. [Google Scholar] [CrossRef]
  27. Cao, S.P.; Nie, L.; Sun, H.P.; Sun, W.F.; Taghizadeh-Hesary, F. Digital finance, green technological innovation and energy-environmental performance: Evidence from China's regional economies. J. Clean Prod. 2021, 327, 13. [Google Scholar] [CrossRef]
  28. Wang, L.; Wang, Y.A.; Sun, Y.X.; Han, K.J.; Chen, Y.T. Financial inclusion and green economic efficiency: Evidence from China. J. Environ. Plan. Manag. 2022, 65, 240–271. [Google Scholar] [CrossRef]
  29. Su, J.Q.; Su, K.; Wang, S.B. Does the Digital Economy Promote Industrial Structural Upgrading?-A Test of Mediating Effects Based on Heterogeneous Technological Innovation. Sustainability 2021, 13, 23. [Google Scholar] [CrossRef]
  30. Sun, X.X.; Chen, Z.W.; Shi, T.T.; Yang, G.Q.; Yang, X.Y. Influence of digital economy on industrial wastewater discharge: Evidence from 281 Chinese prefecture-level cities. J. Water Clim. Chang. 2021, 14, jwc2021447. [Google Scholar] [CrossRef]
  31. Wang, X.H.; Sui, D.L.; Xie, X.Z. Analysis of the Impact of Environmental Protection Strategy on the Competitiveness of Industrial Manufacturing Industry under the Digital Media Economy Environment. Fresenius Environ. Bull. 2021, 30, 6805–6813. [Google Scholar]
  32. Yu, G.; Zhou, X.B. The influence and countermeasures of digital economy on cultivating new driving force of high-quality economic development in Henan Province under the background of “double circulation”. Ann. Oper. Res. 2021. [Google Scholar] [CrossRef] [PubMed]
  33. Romanova, O.A. Industrial Policy Priorities of Russia in the Context of Challenges of the Fourth Industrial Revolution. Part 2. Ekon. Reg.-Econ. Reg. 2018, 14, 806–819. [Google Scholar] [CrossRef]
  34. Zhou, J.; Lan, H.L.; Zhao, C.; Zhou, J.P. Haze Pollution Levels, Spatial Spillover Influence, and Impacts of the Digital Economy: Empirical Evidence from China. Sustainability 2021, 13, 18. [Google Scholar] [CrossRef]
  35. Mialeshka, Y.V. New Industrialization and Trends in Modernization of Belarusian Industry. Sci. Tech. 2021, 20, 357–364. [Google Scholar] [CrossRef]
  36. Yi, M.; Wang, Y.Q.; Yan, M.D.; Fu, L.N.; Zhang, Y. Government R&D Subsidies, Environmental Regulations, and Their Effect on Green Innovation Efficiency of Manufacturing Industry: Evidence from the Yangtze River Economic Belt of China. Int. J. Environ. Res. Public Health 2020, 17, 1330. [Google Scholar] [CrossRef] [Green Version]
  37. Du, J.L.; Liu, Y.; Diao, W.X. Assessing Regional Differences in Green Innovation Efficiency of Industrial Enterprises in China. Int. J. Environ. Res. Public Health 2019, 16, 940. [Google Scholar] [CrossRef] [PubMed] [Green Version]
  38. Du, K.R.; Cheng, Y.Y.; Yao, X. Environmental regulation, green technology innovation, and industrial structure upgrading: The road to the green transformation of Chinese cities. Energy Econ. 2021, 98, 105247. [Google Scholar] [CrossRef]
  39. Wang, X.Y.; Zhao, D.S.; Zhang, L.L.; Hu, H.Q.; Ma, Y.D.; Ma, J.Y. Relations between upgrading of industrial structure, innovation of green technology and water environmental pollution: Estimation based on dynamic simultaneous equation. Desalination Water Treat. 2021, 218, 80–86. [Google Scholar] [CrossRef]
  40. Yi, M.; Lu, Y.; Wen, L.; Luo, Y.; Xu, S.J.; Zhang, T. Whether green technology innovation is conducive to haze emission reduction: Empirical evidence from China. Environ. Sci. Pollut. Res. 2022, 29, 12115–12127. [Google Scholar] [CrossRef]
  41. Li, Q.Y. Regional technological innovation and green economic efficiency based on DEA model and fuzzy evaluation. J. Intell. Fuzzy Syst. 2019, 37, 6415–6425. [Google Scholar] [CrossRef]
  42. Long, R.Y.; Guo, H.Y.; Zheng, D.T.; Chang, R.H.; Na, S.Y. Research on the Measurement, Evolution, and Driving Factors of Green Innovation Efficiency in Yangtze River Economic Belt: A Super-SBM and Spatial Durbin Model. Complexity 2020, 2020, 14. [Google Scholar] [CrossRef]
  43. Mak, H.W.L.; Lam, Y.F. Comparative assessments and insights of data openness of 50 smart cities in air quality aspects. Sust. Cities Soc. 2021, 69, 102868. [Google Scholar] [CrossRef]
  44. Du, K.R.; Li, P.Z.; Yan, Z.M. Do green technology innovations contribute to carbon dioxide emission reduction? Empirical evidence from patent data. Technol. Forecast. Soc. Chang. 2019, 146, 297–303. [Google Scholar] [CrossRef]
  45. Luo, Q.L.; Miao, C.L.; Sun, L.Y.; Meng, X.N.; Duan, M.M. Efficiency evaluation of green technology innovation of China's strategic emerging industries: An empirical analysis based on Malmquist-data envelopment analysis index. J. Clean Prod. 2019, 238, 10. [Google Scholar] [CrossRef]
  46. Yin, S.; Zhang, N.; Li, B.Z. Improving the Effectiveness of Multi-Agent Cooperation for Green Manufacturing in China: A Theoretical Framework to Measure the Performance of Green Technology Innovation. Int. J. Environ. Res. Public Health 2020, 17, 27. [Google Scholar] [CrossRef]
  47. Du, G.; Yu, M.; Sun, C.W.; Han, Z. Green innovation effect of emission trading policy on pilot areas and neighboring areas: An analysis based on the spatial econometric model. Energy Policy 2021, 156, 10. [Google Scholar] [CrossRef]
  48. Petruzzelli, A.M.; Dangelico, R.M.; Rotolo, D.; Albino, V. Organizational factors and technological features in the development of green innovations: Evidence from patent analysis. Innov.-Organ. Manag. 2011, 13, 291–310. [Google Scholar] [CrossRef]
  49. Fan, F.; Lian, H.; Liu, X.Y.; Wang, X.L. Can environmental regulation promote urban green innovation Efficiency? An empirical study based on Chinese cities. J. Clean Prod. 2021, 287, 10. [Google Scholar] [CrossRef]
  50. Wang, M.X.; Li, Y.L.; Liao, G.K. Research on the Impact of Green Technology Innovation on Energy Total Factor Productivity, Based on Provincial Data of China. Front. Environ. Sci. 2021, 9, 11. [Google Scholar] [CrossRef]
  51. Du, K.R.; Li, J.L. Towards a green world: How do green technology innovations affect total-factor carbon productivity. Energy Policy 2019, 131, 240–250. [Google Scholar] [CrossRef]
  52. Peng, W.B.; Yin, Y.; Kuang, C.G.; Wen, Z.Z.; Kuang, J.S. Spatial spillover effect of green innovation on economic development quality in China: Evidence from a panel data of 270 prefecture-level and above cities. Sust. Cities Soc. 2021, 69, 9. [Google Scholar] [CrossRef]
  53. Tian, Y.; Huang, P.; Zhao, X. Spatial analysis, coupling coordination, and efficiency evaluation of green innovation: A case study of the Yangtze River Economic Belt. PLoS ONE 2020, 15, 29. [Google Scholar] [CrossRef]
  54. Yang, Y.; Wang, Y. Research on the Impact of Environmental Regulations on the Green Innovation Efficiency of Chinese Industrial Enterprises. Pol. J. Environ. Stud. 2021, 30, 1433–1445. [Google Scholar] [CrossRef]
  55. Liu, Y.J.; Dong, F. How technological innovation impacts urban green economy efficiency in emerging economies: A case study of 278 Chinese cities. Resour. Conserv. Recycl. 2021, 169, 13. [Google Scholar] [CrossRef]
  56. He, S.W.; Yu, S.; Li, G.D.; Zhang, J.F. Exploring the influence of urban form on land-use efficiency from a spatiotemporal heterogeneity perspective: Evidence from 336 Chinese cities. Land Use Pol. 2020, 95, 12. [Google Scholar] [CrossRef]
  57. Bibri, S.E.; Krogstie, J. Data-Driven Smart Sustainable Cities of the Future: A Novel Model of Urbanism and Its Core Dimensions, Strategies, and Solutions. J. Futures Stud. 2020, 25, 77–93. [Google Scholar] [CrossRef]
  58. Neves, F.T.; Neto, M.D.; Aparicio, M. The impacts of open data initiatives on smart cities: A framework for evaluation and monitoring. Cities 2020, 106, 15. [Google Scholar] [CrossRef]
  59. Herrera-Cubides, J.F.; Gaona-Garcia, P.A.; Montenegro-Marin, C.E.; Sanchez-Alonso, S. Improving OER descriptions to enhance their availability, reuse, and enrichment. Educ. Inf. Technol. 2021, 29. [Google Scholar] [CrossRef]
  60. Li, Z.Q.; Liu, Y. Research on the Spatial Distribution Pattern and Influencing Factors of Digital Economy Development in China. IEEE Access 2021, 9, 63094–63106. [Google Scholar] [CrossRef]
  61. Liu, J.M.; Jiang, Y.L.; Gan, S.D.; He, L.; Zhang, Q.F. Can digital finance promote corporate green innovation? Environ. Sci. Pollut. Res. 2022, 13. [Google Scholar] [CrossRef] [PubMed]
Figure 1. Flow chart of mediation effect test.
Sustainability 14 02921 g001
Figure 2. The spatial and temporal evolution of China’s urban digital economy. (a) The spatial of China’s urban digital economy. (b) The temporal evolution of China’s urban digital economy.
Sustainability 14 02921 g002
Figure 3. Temporal and spatial evolution of the number of green patent applications in Chinese cities. (a) Temporal of the number of green patent applications in Chinese cities. (b) Spatial evolution of the number of green patent applications in Chinese cities.
Sustainability 14 02921 g003
Table 1. Mediating effect test.
Explained VariableExplanatory VariableSignificance of CoefficientConclusion
GPDEISignificantAnalysis is continued through Equation (3)
No significantStop testing, no mediating effects
ISDEISignificantAnalysis is continued through Equation (4)
No significantStop testing, no mediating effects
GPIS and DEIBoth γ1 and γ2 were significantPartial mediation effect
γ1 was not significant and γ2 was significantComplete mediating effect
Table 2. Construction of digital economic indicators.
Target LayerSystem LayerIndicator LayerUnit
Digital economy development levelInternet penetrationNumber of Internet Broadband Access Users10,000 people
Related business outputTelecom business revenuemillion
industry practitionersInformation Transmission, Computer Services, and Software Practitioners10,000 people
Mobile phone penetrationNumber of mobile phone users10,000 people
digital finance developmentFinancial Inclusion Index
Table 3. Principal component analysis.
ComponentEigenvalueDifferenceProportionCumulative
Comp13.358012.410290.67160.6716
Comp20.947710.515230.18950.8611
Comp30.432490.253510.08650.9476
Comp40.178970.096150.03580.9834
Comp50.08282 0.01661.0000
VariableComp1Comp2Comp3Comp4Comp5Unexplained
TB0.5017−0.19840.0897−0.76210.34660
IT0.4487−0.26870.70460.47580.06040
IB0.48240.1592−0.57530.42620.47890
MP0.5184−0.1036−0.2815−0.0288−0.80030
FI0.21340.92330.2919−0.1020−0.08030
Table 4. Variable descriptive statistics.
VariableObservationMeanMaxMinSDSkewKurt
GP24665.208.762.081.610.472.93
DEI24668.6210.877.000.870.734.40
GRP_PC246610.7111.899.690.550.212.91
FDI2466−3.04−0.52−6.621.42−0.653.78
GEST2466−4.47−2.85−6.180.84−0.032.80
GIv2466−6.38−4.74−7.470.620.975.99
R&D_P24668.8111.815.321.51−0.383.90
R&D_I246611.9515.197.361.76−0.735.28
Table 5. Variable definition and calculation method.
VariableDefinitionCalculationUnit
GPGreen innovationNumber of green invention patent applicationspiece
DEIDigital economy indicatorsPrincipal components of the digital economy (from principal component analysis)
GRP_PCThe level of economic developmentRegional GDP per capitamillion
R&D_PR&D staff inputObtaining the Urban Statistical Yearbookpeople
R&D_IR&D capital investmentObtaining the Urban Statistical Yearbookmillion
FDIforeign investmentThe ratio of foreign investment to regional gross output value%
GESTTechnology spendingThe ratio of technology spending to total regional spending%
GIvgovernment interventionThe ratio of local fiscal expenditure to gross national product%
Table 6. Correlation coefficient test.
VariablesGPDEIGRP_PCFDIGESTGIvR&D_PR&D_I
GP1
DEI0.576 ***1
GRP_PC0.360 ***0.328 ***1
FDI0.489 ***0.308 ***0.416 ***1
GEST0.559 ***0.301 ***0.506 ***0.498 ***1
GIv0.454 ***0.622 ***0.409 ***0.430 ***0.481 ***1
R&D_P0.827 ***0.548 ***0.566 ***0.582 ***0.576 ***0.565 ***1
R&D_I0.766 ***0.483 ***0.581 ***0.499 ***0.537 ***0.485 ***0.905 ***1
Note: Robust standard errors in parentheses, *** p < 0.01, ** p < 0.05, * p < 0.1.
Table 7. VIF between the variables.
VariablesVIF1/VIF
DEI1.690.590902
GRP_PC1.790.559314
FDI1.590.629733
GEST2.210.452458
GIv2.820.354618
R&D_P8.530.117224
R&D_I5.810.172128
Mean VIF3.490.410911
Table 8. Two-way fixed effects regression results.
VARIABLES(1)(2)
DEI0.9525 ***0.0879 ***
(0.0389)(0.0198)
GRP_PC 0.2469 ***
(0.0342)
FDI 0.0500 ***
(0.0094)
GEST 0.3411 ***
(0.0237)
GIv 0.7813 ***
(0.0329)
R&D_P 0.3343 ***
(0.0260)
R&D_I 0.0564 ***
(0.0182)
Constant−3.7082 ***4.0364 ***
(0.3325)(0.5485)
Observations24662466
R-squared0.4060.888
City FEYesYes
Year FEYesYes
Control variablesNoYes
Note: Robust standard errors in parentheses, *** p < 0.01, ** p < 0.05, * p < 0.1.
Table 9. Spatial heterogeneity analysis.
VARIABLES(1)
East
(2)
Mid
(3)
West
DEI0.04360.1845 ***0.2007 ***
(0.0289)(0.0488)(0.0404)
GRP_PC0.4657 ***0.2521 ***0.1283 *
(0.0601)(0.0636)(0.0662)
FDI0.1087 ***−0.03000.0733 ***
(0.0240)(0.0204)(0.0237)
GEST0.1620 ***0.4363 ***0.4242 ***
(0.0367)(0.0379)(0.0546)
GIv0.8781 ***0.8315 ***0.4112 ***
(0.0582)(0.0664)(0.0760)
R&D_P0.5128 ***0.1930 ***0.3290 ***
(0.0473)(0.0335)(0.0489)
R&D_I−0.1003 ***0.1142 ***0.0946 **
(0.0293)(0.0216)(0.0368)
Constant2.4854 **4.2262 ***1.8847
(0.9828)(0.8690)(1.2337)
Observations891873702
R-squared0.9140.8790.837
City FEYesYesYes
Year FEYesYesYes
Control variablesYesYesYes
Note: Robust standard errors in parentheses, *** p < 0.01, ** p < 0.05, * p < 0.1.
Table 10. Urban scale heterogeneity analysis.
VARIABLES(1)
Small–Medium
(2)
Big
DEI0.0645 ***0.0925 ***
(0.0225)(0.0309)
GRP_PC0.2128 ***0.3757 ***
(0.0456)(0.0822)
FDI0.0367 ***0.0828 ***
(0.0111)(0.0182)
GEST0.3194 ***0.2979 ***
(0.0302)(0.0436)
GIv0.7567 ***0.7260 ***
(0.0491)(0.0771)
R&D_P0.3075 ***0.4672 ***
(0.0295)(0.0572)
R&D_I0.1201 ***−0.0488
(0.0255)(0.0298)
Constant3.7475 ***2.3274 *
(0.6617)(1.3399)
Observations1592874
R-squared0.8550.914
City FEYesYes
Year FEYesYes
Control variablesYesYes
Note: Robust standard errors in parentheses, *** p < 0.01, ** p < 0.05, * p < 0.1.
Table 11. Policy time heterogeneity analysis.
VARIABLES(1)
2011–2015
(2)
2016–2019
DEI0.0550 *0.0822 ***
(0.0287)(0.0245)
GRP_PC0.1880 ***0.3247 ***
(0.0454)(0.0488)
FDI0.0263 *0.0553 ***
(0.0143)(0.0150)
GEST0.4344 ***0.3128 ***
(0.0406)(0.0306)
GIv0.8026 ***0.7894 ***
(0.0480)(0.0438)
R&D_P0.3684 ***0.2736 ***
(0.0348)(0.0393)
R&D_I0.0600 **0.0463 *
(0.0246)(0.0264)
Constant5.0756 ***5.3799 ***
(0.8366)(0.7836)
Observations13701096
R-squared0.8670.875
City FEYesYes
Year FEYesYes
Control variablesYesYes
Note: Robust standard errors in parentheses, *** p < 0.01, ** p < 0.05, * p < 0.1.
Table 12. Endogenous test.
First-StageSecond-Stage
VARIABLESDEIVARIABLESGP
Distance11.459 ***DEI0.975 ***
(2.5851) (0.3235)
ControlsYESControlsYES
YearYESYearYES
CityYESCityYES
Observations2466Observations2466
R-squared0.366R-squared0.174
Kleibergen–Paaprk LM statistic18.613
[0.000]
Kleibergen–Paaprk Wald F statistic19.650
{16.38}
Note: Robust standard errors in parentheses, *** p < 0.01, ** p < 0.05, * p < 0.1.
Table 13. Robustness check.
VARIABLES(1)(2)(3)
Internet 0.8012 ***
(0.0461)
DEI0.0772 ***0.0762 ***
(0.0209)(0.0204)
GRP_PC0.2675 ***0.2664 ***0.5404 ***
(0.0360)(0.0356)(0.0474)
FDI0.0544 ***0.0551 ***−0.0077
(0.0100)(0.0100)(0.0119)
GEST0.3604 ***0.3633 ***0.3678 ***
(0.0243)(0.0243)(0.0308)
GIv0.8191 ***0.7870 ***0.2271 ***
(0.0368)(0.0330)(0.0302)
RD_P0.2776 ***0.2816 ***0.1134 ***
(0.0275)(0.0271)(0.0251)
RD_I0.0591 ***0.0588 ***0.0377 **
(0.0190)(0.0190)(0.0170)
Constant4.7018 ***4.4988 ***−4.5973 ***
(0.5556)(0.5534)(0.6852)
Observations243024662466
R-squared0.8750.8840.788
City FEYesYesYes
Year FEYesYesYes
Control variablesYesYesYes
Note: Robust standard errors in parentheses, *** p < 0.01, ** p < 0.05, * p < 0.1.
Table 14. Influence mechanism test.
VARIABLES(1)(2)(3)
GPISGP
IS −0.1485 ***
(0.0291)
DEI0.0877 ***−0.0747 ***0.0766 ***
(0.0198)(0.0128)(0.0200)
GRP_PC0.2451 ***0.1280 ***0.2641 ***
(0.0345)(0.0226)(0.0343)
FDI0.0510 ***−0.0118 *0.0493 ***
(0.0097)(0.0066)(0.0098)
GEST0.3420 ***−0.00990.3405 ***
(0.0239)(0.0136)(0.0241)
GIv0.7799 ***−0.2409 ***0.7442 ***
(0.0329)(0.0230)(0.0328)
R&D_P0.3344 ***0.00850.3356 ***
(0.0261)(0.0174)(0.0262)
R&D_I0.0561 ***0.0523 ***0.0639 ***
(0.0182)(0.0112)(0.0185)
Constant4.0591 ***−2.6344 ***3.6680 ***
(0.5502)(0.3905)(0.5419)
Observations246624662466
R-squared0.8870.3660.888
City FEYesYesYes
Year FEYesYesYes
Control variablesYesYesYes
Note: Robust standard errors in parentheses, *** p < 0.01, ** p < 0.05, * p < 0.1.
Publisher’s Note: MDPI stays neutral with regard to jurisdictional claims in published maps and institutional affiliations.

