Article

Nature Interpretation as an Environmental Educational Approach in Visitor Management; The Application Dilemma for Different Target Groups at Masai Mara National Reserve, Kenya

by
Leanard Otwori Juma
1 and
Anikó Khademi-Vidra
2,*
1
Institute of Tourism and Hospitality Management, Dedan Kimathi University of Technology, Nyeri 10143, Kenya
2
Faculty of Economics and Regional Sciences, Szent Istvan Campus, Hungarian University of Agriculture and Life Sciences, 2100 Godollo, Hungary
*
Author to whom correspondence should be addressed.
Sustainability 2022, 14(5), 2935; https://doi.org/10.3390/su14052935
Submission received: 3 February 2022 / Revised: 23 February 2022 / Accepted: 25 February 2022 / Published: 2 March 2022

Abstract

:
Various scholars have endorsed contemporary visitor management strategies broadly categorized as hard or soft approaches. The hard strategies like area closure, penalties, patrols, or limiting access have been deemed punitive and restrictive to visitors seeking escape into natural environments. On the other hand, nature interpretation (NI) and general conservation information, christened as soft strategy, are pushed as complementary or alternative non-obstructive visitor management tactics. However, these arguments notwithstanding, questions linger about the choice of appropriate NI strategies, their application, and their effectiveness. This study sought to establish which NI and visitor information approaches can be used be to manage visitors by target group effectively at the Masai Mara National Reserve, Kenya. Data was collected by surveying n = 570 respondents that constituted visitors (n = 413) and tour guides (n = 157) participating in wildlife tourism at MMNR over six months. Descriptive and inferential statistics were employed to present and analyze data with spearman’s correlation used for testing the relationships to answer the research question. Study results established mixed results with different NI attributes comprising a few weak, some very weak, and the majority no correlations with the respondents’ demographics. The month of the visit and type of vehicle used had very weak negative correlations with attributes of NI, generally implying inverse relationships. Nationality and gender had the least correlations, while the month of visit and the purpose of the visit had the highest number of correlations with, the latter having slightly stronger correlations. Display boards and orientation signage had the highest number of very weak and weak correlations with nearly all the respondents’ demographics except nationality and gender. Visitor codes/do’s and don’ts followed with tour guiding with no correlations with almost all the demographics. The study recommends continuous improvement of all NI approaches at the MMNR, with urgency being given to display boards and orientation signage followed by visitor codes and tour guiding, as evidenced from findings. The study further recommends research on contemporary trends in NI and conservation education and information dissemination.

1. Introduction

Nature interpretation (NI) is an educational activity that examines and attractively reveals an area’s physical, biological, and cultural attributes and interrelationships using tangible objects and first-hand experience to create satisfaction, responsible actions, awareness, and commitment to the interpreted values and areas. NI attempts to convey cultural and natural heritage values, deter negative impacts, and support conservation initiatives of protected areas. In the past and contemporaries, nature interpretation has become one of the essential foundations in visitor management as destination managers and planners endeavour to balance between sustainable conservation of tourism resources and visitor satisfaction [1,2,3,4]. NI, also synonymous with environmental education, has been used as a visitor management strategy for areas that attract or have the potential to attract visitation to solicit public support towards conservation initiatives. NI used synonymously with environmental or conservation education depending on the season, or management focus has been implemented varyingly at different destinations. Some of the approaches implemented include interpreters or tour guides, visitor education centers, display boards, directional signage, visitor codes, guidebooks, brochures, and other print media broadly classified as personal and non-personal strategies in NI [4,5,6]. NI’s personal forms like tour guiding require a person to deliver the NI whenever and wherever required. It is labour intensive and requires skilled personnel for effectiveness.
On the contrary, non-personal forms of NI do not need the personnel once installed; they are self-communicating. These include orientation maps, visitor codes, information centres, display boards, and signage, tangible or physical, unlike tour guiding, which is a human-dependent service for actual delivery. Interpreters, also known as tour guides, are people from different educational and socio-cultural backgrounds and are specialized in providing an essential interpretation of observed realities and experience in an area entertainingly [5,7,8,9,10,11]. In essence, the application of NI approaches varies from one scenario to another; various approaches complement each other depending on the area and management objective or focus. Complementarity is critical for the sustainable development of destinations and or attractions as different NI approaches present certain advantages or disadvantages. These facts notwithstanding, destination planners and managers have endeavoured to apply different approaches for different visitor groups and scenarios [12,13]. For instance, in expansive nature-based destinations, nature trails or tracks with adequate orientation maps, signage, visitor codes, and information centres will facilitate practical interpretation provided with or without tour guides. By and large, the interpreters provide environmental education as the visitors savour their outdoor classroom experience on the spot as NI facilitates knowledge about the environment and the interrelationships between nature and society at that destination.
Historically, visitor management in protected areas has been primarily interested in visitor impacts, emphasizing mitigating undesirable consequences. This included limiting the number of visitors, changing visitor behaviour, and changing the resource itself over time. These methods have been categorized as either ‘hard’ or soft [14]. Physical, regulatory, and economic control are components of ‘hard’ visitor management systems. ‘Soft’ approaches use education and interpretation to help people learn [14]. One of the main points of the current research was to find out which nature interpretation and visitor education approaches can be used to manage visitors by group effectively. Therefore, it was necessary to review and describe a conceptual system that focuses on didactic-based activities related to nature interpretation.

1.1. Theoretical Framework for Environmental Education (EE)

EE is a broad conceptual category for this research and systems approach, as it incorporates all didactic techniques with an emphasis on the environment. Educators, thinkers, and philosophers such as Humboldt, Froebel, Rousseau, Goethe, Dewey, Montessori, and Haeckel influenced the environmental theory and practice throughout the eighteenth and nineteenth centuries. Sir Patrick Geddes (1854–1933) is widely regarded as one of the early philosophers to identify the critical links between environmental factors and education [15]. Patrick Geddes’ work as a city planner was his most well-known accomplishment. He did, however, desire to know more about individuals in their physical, social, and natural environments [16]. In 1948, at a meeting of the International Union for the Conservation of Nature (IUCN) in Paris, the term “environmental education” was first used in a public and professional setting [15,16]. Many heads of state and government attended the historic 1977 Conference in Tbilisi [17]. Environmental education’s goals, objectives, and definitions were articulated and emphasized in detail. The conference endorsed the following purposes of EE.
EE is a multifaceted process that encompasses events and a well-thought-out approach to societal development as a whole. Individuals increase environmental consciousness and acquire knowledge, skills, attitudes, experiences, and determination through EE, enabling people to act independently or jointly to answer current and prospective ecological challenges. People gain the knowledge to form alliances, comprehend NGO activities, create participatory urban planning approaches, and assure developing markets for eco-business through EE. EE is a learning process that increases people’s knowledge and awareness of the environment, improves skills and competence to solve difficulties, and creates attitude, motivation, and commitment to make decisions and take action [17].
EE bolsters individuals’ critical thinking, decision-making, and problem-solving abilities. It trains people to weigh opposing viewpoints on a particular environmental aspect to make the right judgments instead of merely advocating for or opposing anything. EE has the following components: Environmental awareness and sensitivity; first, environmental awareness and comprehension, and environmental challenges. The second concern is that it creates environmentally conscientious attitudes and willingness to improve, enhance or maintain environmental quality. Another consideration is inculcating individuals’ ability to recognize environmental challenges and assist in their solutions. And lastly, participation in actions that result in the resolution of environmental issues. EE is “conceived as a lifetime process that shapes the biosphere through active, innovative, and critically engaging the young and old in the daily decisions [18]. In addition, Stevenson & Stirling [19] observes that it is more meaningful to involve individuals in studying and solving real challenges that significantly concern them. Monroe et al. point out environmental education engages various target groups, multidimensional and ever-evolving [16] (p. 206). As learners seek more information and greater understanding, EE becomes a lifelong process, Stevenson and Stirling noted [19].

1.2. Conservation Education

As a result of current environmental trends and educational needs, the range of meanings of the notion of environmental education (EE) has widened and changed significantly. The notion has been dynamic due to its interdisciplinarity and complicated role in pedagogy: it now has numerous fields and sub-areas. Plant and animal conservation, encompassing wildlife and natural environments, is described as conserving plants and animals from the harmful impacts of human activities. The following definition indicates that “conservation” and “environmental education” are mutually beneficial. For example, EE could work as a catalyst in preserving human and other beings’ natural habitats. Conservation of nature is also possible with a well-planned and implemented EE. The introduction of information and communication technology has sparked a surge in interest in EE evaluation as a means of moving toward conservation [20]. Conservation education encourages building an ecological foundation to construct principles [21]. Conservation education affects social growth components like personality, character, collaboration ability, and leadership to enhance engagement in identifying and resolving environmental issues [22].
Recently, some researchers have advocated including conservation education’s longer-term and more significant benefits on societies, such as building networks of relationships, as desired and quantifiable objectives [23]. Similarly, Stirling’s [24] notion of the resilient learner emphasizes the person’s self-improvement or social abilities essential for healthy development and life success. Understanding how conservation education affects individual social development in a broader society or social group can help researchers document socio-ecological outcomes more thoroughly.
Bloom [25] defined learning as ‘what we know,’ founded on acquiring knowledge and abilities and including attitudes and beliefs. Ecopsychologists have demonstrated a correlation between emotional attachment to nature and ecologically responsible conduct [26,27,28]. A close relationship is argued to be a primary factor in selecting and implementing conservation education techniques [28]. Individual cognitive and affective outcomes [29,30] are targeted in conservation education programs. In other words, a more informed and concerned public is expected to be more motivated and capable of fixing environmental issues through ecologically responsible behaviour such as energy conservation and recycling.

1.3. Nature Interpretation

Interpretation is required for any learning process; it is a methodology in which interpreters provide meaning to the contents, which must be absorbed and organized uniquely. The nature and specification of the item always influence the interpretation (for example, in the case of Heritage Interpretation, cultural heritage contents). Some past research efforts on natural interpretation primarily focused on visitor management [31,32,33]. As described by some scholars, nature interpretation is an educational activity that seeks to uncover meanings and relationships through objects, media, or personal experiences rather than just transmitting information [31,34,35]. Nature interpretation packages and conveys messages as a visitor management strategy while considering the potential influence on protected areas and tourists, according to Ham & Sandberg and Ham et al. [32]. As evidenced by rules of conduct, exhibit boards, maps, and directional signs, nature interpretation have personal and non-personal components [33]. This study emphasizes natural interpretation—from a didactic standpoint—and places a premium on subjective, individual perception of the learning experience in a constantly changing natural context. The visitor, scenery, timing, social interactions, physical circumstances, and emotional reaction are factors in nature experiences [36,37,38,39,40,41]. Participants’ behavioural and emotional states shift in distinct stages over time [42], and numerous such perspectives on the nature experience have been developed.
According to Jurow [42], active development and accumulation of place meanings could be considered a true partner in a relationship. The setting’s physical and social interactions aided the formation of long-term bonds with a community. In rural contexts, social interactions and rituals contribute to developing shared narratives and meanings, which form the backbone of nature interpretation. Personal interpretation (as opposed to signage, audio tours, brochures, and films) is a preferred style of explanation and a good component of the tourist experience. Coble [43], conducted a poll that emphasized intellectual and emotional links. In Coble’s study, personal interpretation was the most effective on-site interpretive experience, which looked at the impact of interpretative offerings such as events, guided tours, exhibitions, signage, films, and brochures [43]. The most memorable on-site experience for respondents was ranger-led programs, which surpassed all other forms of interpretive encounters [42]. Pine and Gilmore [44] assert that the service economy is transforming into a new economy known as the experience economy, which happens when a corporation purposefully exploits [its] services as a stage to integrate individual customers into a memorable event. Their argument revolves around the economic implications of distinguishing between providing a service and providing an experience, a world made up of tangibles, intangibles, and memories. Furthermore, buyers are eager to pay extra for experiences. The writers contend that buyers cannot control goods, commodities, or services. An experience, on the other hand, is purely subjective, existing only in the mind of the person who had it. So no two ‘ ‘people’s experiences are alike. Each encounter results from a complex interaction between the staged event and the ‘ ‘individual’s mental state.
Scholars argue that the quality of NI delivery is dependent on the competencies possessed by tour guides/interpreters; that is, the knowledge and skilling possessed by tour guides or interpreters can make them serve as better mediators and positive change agents within destinations for sustainability [45,46,47,48,49]. In most destinations, tour guide training is not strictly regulated [50,51,52]. In contrast, others regulate tour guides through licensing and/or membership to professional associations to regulate their conduct, skilling, and competencies. Some scholars argue that the experience and social-cultural background have a more significant impact on interpretational delivery and competencies of interpreters or tour guides [10,53]. As managers and planners strive for the sustainability of attractions and destinations, these notwithstanding, they commonly complement interpreters with other non-personal NI approaches [54]. These non-personal NI approaches include information centres, trails, signages, and display boards [34,54,55,56,57].

Operative Tools of Nature Interpretation

Information is not the same as nature interpretation, neither a tourist information centre, a sign, or a brochure. These are only some of the methods for delivering nature interpretation. It entails more than simply informing people about identifying a wildlife species or the age of a structure. Nature interpretation is a well-coordinated, innovative, and inspirational method of learning. It allows us to explore the world’s numerous complexity and our place within it. People are stirred, their assumptions are challenged, and their desire to learn is piqued [58]. The visitor and the service provider are at the heart of traditional visitor management approaches. Their purpose is to improve the tourist experience, provide the suitable demand product, distinctive service group core design, raise attraction awareness, and reduce seasonality through enhanced understanding of revenues [59,60].
In contrast, as Eagles and crew point out, the primary purpose of visitor management in protected areas is to deal with problems that arise as a result of their actions. With this mentality, the visitor management system grew [61]. And the broad objectives were to check (the behaviour of those entering the area, influence (visitor decisions), to reduce the impact of tourists on the environmental effect. A previous paper by Juma et al. [33] focused on the importance of tour guiding, visitor codes, visitor information centres, display boards, and orientation signage in the process of nature interpretation. In Table 1 below, the study summarises each technique’s strengths and weaknesses in the context of the current research.
As mentioned previously, every interpretation is distinctive, and no two are the same. The consequences of interpretation formation are multifaceted, involving various contributing elements. From an inclusive approach, it is evident that demographic, socio-cultural, and psychological characteristics (personal habits, temperament, value system, norms, motivation, and interest, among others) all influence interpretation development. Mazilu and Mitroi described demographic characteristics as descriptive classifiers [63,64]. That gender, age, education, income, nationality, and family life cycle are examples of socio-demographic variables frequently employed by travel professionals [64,65,66,67]. According to Weaver and Oppermann [64,68], these characteristics describe the tourism market and accurately forecast travel behaviour trends. Age is a critical demographic feature for tourism stakeholders since it accurately predicts visitor demand for leisure activities [69]. Individuals’ desire for leisure and outdoor exploration is positively correlated with age [67].
The likelihood of engaging in wildlife pursuits differs with age, according to Spence [70]. When a person is younger, participating in an activity increases, and as the person becomes older, the likelihood of participating in activity diminishes. The study postulated that it is critical to choose an environmental terrain and experience that adapts to the target group’s age and psychosocial characteristics and rethink the tools to adopt based on age-related intellectual abilities. Gender is another important factor impacting travel demand [71]. Males and females travel in various ways, depending on the purpose of travel. Men tend to travel more than their female counterparts. Intrapersonal or physical constraints influence females more than males [72,73]. Moreover, cost, time, and family obligations limit ‘ ‘women’s trip participation [74,75]. The result is that women choose indoor activities like shopping and eating over outdoor activities like skiing [76].
Education level has been shown to impact travel motivation [67], whereas marital status has a significant impact [64,67,77]. Understanding the visitor audience’s educational level can be beneficial for developing educational content in the case of any natural encounters and sophisticated nature tour packages. Except for educational groups, there is no assumption about the educational attainment of specific tourists; nonetheless, a knowledgeable tour guide may make distinctions. When creating programs, it is possible to emphasize the visitors’ motivations and areas of interest. However, the intricacy of the psychographic and demographic elements that contribute to their determination has already been examined. Simultaneously, when evaluating these intricate action processes, it is vital to emphasize that each receipt of natural experience is unique and special, as the subject of the reception, namely, nature, is constantly changing in space and time. As a result, individuals cannot experience a natural event that is repeated and its reception. This is a situational process: uniform demographic, socio-cultural, and psychological patterns cannot define natural individual presence. The environment cannot be statically described.

2. Materials and Methods

The study was conducted at the Maasai Mara National Reserve (MMNR), one of Kenya’s most visited wildlife tourism destinations and the world. MMNR has been christened the 8th wonder of the world due to the seasonal wildebeests’ migration that attracts high visitor numbers during the high season. The research adopted a descriptive survey design, and questionnaires were the main data collection tool. Descriptive and inferential statistics were employed to present and analyze data using spearman’s correlation to test the research question. In the interpretation of spearman’ correlations, the study adopted the following ranking of correlation coefficients; 0.00–0.19 very weak correlations; 0.20–0.39 weak; 0.40–0.59 moderate; 0.60–0.79 strong; 0.80–1.0 very strong correlations as adopted from Akoglu [78].
Data collection took over six (6) months; in the low season months of November (20% of the respondents), December (11.2%), January (10.4%), and February (7%), and the high season months of August (31.2%) and September (20.2%) as detailed in Table 2 below. The high season constituted 51% of the respondents and 49% for the low season, giving a total sample size of n = 570. The respondents (n = 570) included 67.5% Kenyans, 18.7% non-residents, and 13.7% resident foreigners that visited MMNR. 61.9% of the respondents were males, 36.3% were females, and a further 1.8% for others. The skewed data towards the male gender was because 157 of the 570 respondents were tour driver guides who were predominantly male.
The majority of the respondents fell in the youthful category of ages 25–40 years (54.4%), followed by those aged 41–65 years (29.1%), those aged below 24 years constituted 14.6%, and lastly, senior citizens (66 years and above) with a small fraction of 1.9% as detailed in Table 2 above. The demographics of the visitor age completely departed from past statistics where the senior citizens constituted a more significant percentage of travellers than the current scenario attributed to the COVID-19 scare. It is especially true for senior citizens whom COVID-19 could have constrained their vacationing despite having higher travel propensity characteristics. Contrastingly, the youthful part of the population travelled more during the COVID-19 pandemic as they could have considered themselves as having higher immunity levels.
On the education level of the respondents (n = 570), over 49.3% of the respondents had a university education, 44.6% had college-level education, while 4.9% and 1.2% had secondary and primary level education, respectively (Table 1 above). Regarding the purpose of the visit, 56.8% of the respondents were on holiday/vacation, 27.5% were tour driver guides at work, 14% were on education and research, and a small fraction (1.6%) were visiting for other work-related purposes. Indeed vacationers, tour guides, and education and research visits constitute the primary travel purposes into MMNR. The research also delved into establishing the most commonly used mode of accessing MMNR. Study results revealed that company tour-equipped vehicle with driver-guide (59.3%) was the most popular means, followed by local freelance guides with tour-equipped vehicles (18.9%), and closely followed by self-drive visitors on ordinary vehicles (16%). Visitors on Self-drive on tour-equipped vehicles were the least used means for accessing MMNR.

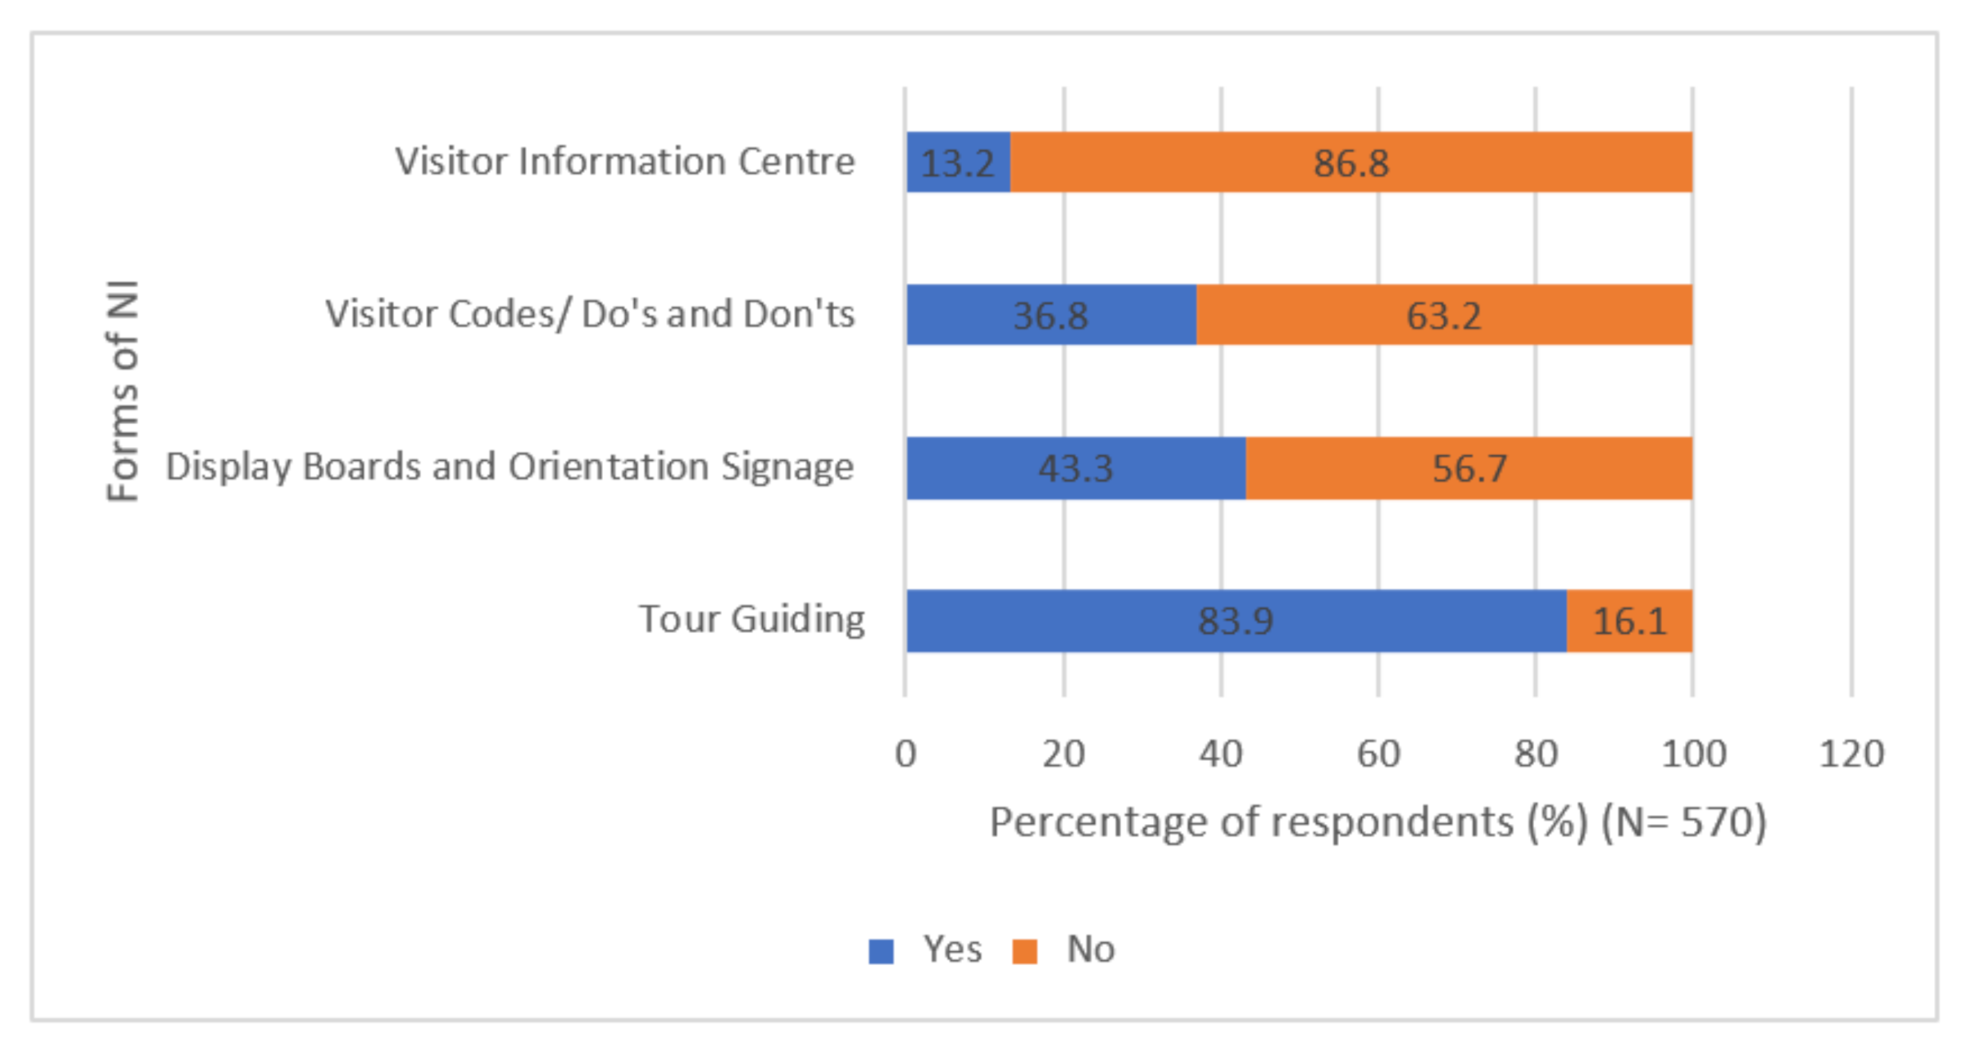
3. Results and Discussion

As evinced in Figure 1 below, tour guiding was the most prevalent form of NI in MMNR, as observed by 83.9% of the visitors and wildlife viewers. Tour guiding was followed in a distant second by display boards and orientation signage, with 43.3% of the respondents noting this approach’s existence. A situation that could partly be attributed to either the display boards being few or that most wildlife viewers never noted their existence as they concentrated on viewing wild animals. Visitor codes came third, with 36.8% of respondents noticing them within MMNR. Last on the list was a visitor information center noted by a paltry 13.2%. These statistics indicate the prominent forms of NI as currently observed in MMNR. Indeed tour guiding is the most widely used, followed by display boards and orientation signage, visitor codes or dos and don’ts, and lastly, the visitor information centres that are indeed very few.

3.1. Attitudes towards NI Approaches

The study first subjected several tour guiding attributes (as a personal form of NI) here considered dummy variables for these non-personal forms of nature interpretation. It was observed that generally, the respondents had positive attitudes with the least affirmations attribute being’ visitor codes and signage are observed by tour guides’ with 53% respondents strongly agree (15%) and agree with 38% as shown in Figure 2 below. Visitor codes are communicated to tourists by tour guides followed with over 55% affirmations strongly agree with 18% and agree having 38% responses.
Third from the bottom was tour guides require regular interpretational training and sensitization. Study results indicate that ambivalence increased as the level of positive attitudes reduced, as shown in Figure 2 above. Tour guiding attributes that respondents had favourable attitudes towards as represented agree strongly and agree are; first, ‘tour guides have a good understanding of wildlife’ at 78%. This was followed by ‘tour guides have good tour guiding skills’ with 74%, tour guides provide enlightening NI with 71%, and lastly, tour guides communicate does and don’ts. Study results indicate that generally, few respondents had negative attitudes towards all the attributes of tour guiding as depicted by strongly disagree and disagree. The negative attitudes increased marginally as affirmation levels reduced.
The study further endeavoured to establish the respondents’ attitudes towards visitor codes/rules and regulations and display boards and orientation signage broadly categorised as forms of NI that do not require staffing after deployment, also known as non-personal forms of NI. These include visitor codes, maps, display boards, orientation signage, and visitor information centres. Likert scale items were used to assess respondents’ attitudes to the various attributes of non-personal forms of NI, as shown in Figure 3 below. Recommendations to have visitor codes included in the proposed Mobile App had the highest affirmation at 70.4%, with a further 26% ambivalence and a paltry 7% negative attitudes.
Display boards and orientation signage’ are easy to read and understand’ came in second, as an attribute of a non-personal NI approach that had over 61.1% affirmations represented by strongly agree (16.5%) and agree (44.5%). 22.1% of the respondents were ambivalent (neither agree nor disagree), while a further 8.1% and 8.8% represented negative attitudes that disagree and disagree strongly, respectively (Figure 3 above). The attribute tourists and tour guides ‘observed visitor codes and directional signage’ in MMNR followed in the ranking with strongly agree to have 21.1% of the responses and agree 39.6% giving a total of 60.7% positive attitudes. 25.8% of the respondents neither agreed nor disagreed. Respondents with negative attitudes accounted for 8.6% (disagree) and 4.9% (disagree strongly) of the responses. Visitor codes ‘are communicated to tourists by tour guides’ was next with positive attitudes represented by responses of 17.9% of the respondents for strongly agree and 37.9% for agree. 29.1% of the responses expressed neutral ones, 7.9% disagreed, and 7.2% disagreed strongly.
Visitor codes ‘are observed by tour guides and tourists’ had positive attitudes represented by strongly agree (15.4%) and agree (38.2%), accounting for 53.6% of the responses. This attribute had the highest level of ambivalence, standing at 29.3% (neither agree nor disagree). A small fraction of the reactions accounted for negative attitudes as disagree (8.6% and strongly disagree (8.4%). As to whether display boards and orientation signage were of an appropriate size and visible, the study yielded the following responses; strongly agree had 13.2%, agree 38.4%, neither agree nor disagree 23.7%, disagree 12.5%, strongly disagree 12.3%. This statistic showed that over 51% had favorable attitudes, whereas 24.7% had unfavourable attitudes. Display boards and orientation signage ‘are strategically located’ had 13.2% of the responses on strongly agree, 37.5% on ‘agree,’ 26.7% on ‘neither agree nor disagree’, 11.6% on’ disagree’ and a further 11.1% on ‘strongly disagree.’ Lastly, on the questionnaire item about whether display boards and orientation signage ‘are too many,’ 5.3% of the responses ‘strongly agree’, 12.8% agree, 25.8% neither agree nor disagree, 32.6% disagree, and another 23.5% on strongly disagree. Study results revealed that whereas other attributes of non-personal forms of NI had over 50% favourable responses or attitudes, display boards and orientation signage had the highest level of negative attitudes/responses with a combined total of 56.1% (disagree and disagree strongly). When combined with the respondents who showed ambivalence, the total shoots to whooping 81.9%, this was an indication that display boards and orientation signage were few and more are needed and improvement of the existing ones. Overall, most respondents had favourable attitudes for the rest of the attributes.

3.2. Correlations between Respondents’ Demographics and NI Approaches

In the interpretation of spearman’s correlations, the study adopted the following ranking of correlation coefficients; 0.00–0.19 very weak correlations; 0.20–0.39 weak; 0.40–0.59 moderate; 0.60–0.79 strong; 0.80–1.0 very strong correlations. The month of the visit had very weak negative correlations with five of the seven attributes of tour guiding under review (Table 3 below). Did you see/use tour guiding services had rs = −0.123, p = 0.003, n = 570; tour guides have a good understanding of wildlife rs = −0.096, p = 0.022, n = 570; tour guides have good skills for rs = −0.156, p = 0.000, n = 570; tour guides provide enlightening nature interpretation rs = −0.109, p = 0.009, n = 570; and tour guides require regular ni training and sensitization rs = −0.102, p = 0.012, n = 570. Two attributes, however, did not have any correlation with the month of visit; these were tour guides communicating dos and don’ts (rs = −0.072, p = 0.086, n = 570), and recommendations for a new NI training programme (rs = −0.028, p = 0.508, n = 570). This largely depicts a weak inverse correlation between tour guiding as a NI approach and the visit month. This very weak correlation implies a better tour guiding experience in the low season months compared to the high season months. This calls for more complementary NI and visitor information strategies, especially in the high season when visitors and tourist numbers are high.
Visitor codes/do’s and don’ts had one very weak negative correlation with are observed/followed by tour guides and tourists rs = −0.085, p = 0.044, n = 570. All other visitor codes/do’s and don’ts attributes did not correlate with the visitation month (Table 3). These are, ‘did you see visitor Codes/do’s and don’ts’, ‘visitor codes are communicated by tour guides’, and lastly, ‘visitor codes rules and regulations in Mobile App’. These results imply that visitor codes are primarily not affected by the visitation month and can be implemented in and out of season for consistency.
Similarly, display boards and orientation signage had very weak negative correlations for three of its five attributes under consideration. This included the attributes ‘are strategically located’ rs = −0.130, p = 0.002, n = 570; ’are of appropriate size and visible’ rs = −0.157, p = 0.000, n = 570; and ’are easy to read and understand’ rs = −0.167, p = 0.000, n = 570 (Table 3 below). The attributes as to whether wildlife viewers identified display boards and orientation signage as one of the NI approaches in MMNR and that they ‘are too many’ did not correlate with the month of visitation. Research results generally suggest that NI in MMNR should not largely be affected by month of visitation and should be provided all year round at top standard as the correlations were largely very weak or no correlation at all. However, caution is to be given, especially in the high season, as study results suggested that NI were observed to be more effective in low season months ceteris paribus. High season months require a more concerted effort on all strategies to mitigate the complacency and or pressure related to high visitor volumes of the high season, especially for tour guiding and display boards and orientation signage.
Nationality had only one very weak positive correlation (rs = 0.185, p = 0.000, n = 570) with ‘recommends new tour guide training curriculum’ and another very weak positive correlation with the attribute ‘visitor codes rules and regulations in Mobile App’. The remaining attributes of tour guiding, visitor codes and display boards, and orientation signage did not correlate with the respondents’ nationality. The calculated p-values of these attributes were higher than the given p = 0.005, meaning the correlation results were not significant. The result indicated that nationality had only one very weak correlation with one of the seven attributes of tour guiding. Another very weak correlation with one out of the possible four attributes of visitor codes/do’s and don’ts. Lastly, there is no correlation with all the attributes of display boards and orientation signage. Overall, nationality results indicated negligible correlations as only two out of sixteen possible correlations were established and weak. This means that all the approaches of NI as currently used in MMNR can largely be implemented across visitors and tour guides from all nationalities. Attitude on most attributes is primarily never affected by the respondents’ nationality without any significant variance in attitudes. The only exception is recommendations for a ‘new tour guide training curriculum’ and ‘visitor codes rules and regulations in Mobile App’ with very weak and negligible positive correlations. That implied a weak proportionate correlation, that as one variable increases, the other increases too and vice versa.
Like nationality, all the five attributes of display boards and orientation signage did not correlate with gender. The calculated p-values of these attributes were higher than the given p = 0.005, meaning the correlation results were not significant. This meant that the respondents’ gender did not affect how they viewed display boards and orientation signage as an approach of NI in MMNR. It can then be argued that display boards and orientation signage as a NI and visitor conservation education approach at MMNR can comfortably be implemented across the gender divide without any discrimination or visitor profiling based on this demographic qualifier.
Two out of four attributes of visitor codes/do’s and don’ts had very weak positive correlations with the gender of the respondents. Did you see visitor codes/do’s and don’ts had rs = 0.140, p= 0.001, n = 570; whereas visitor codes /rules and regulations in Mobile App ah an rs = 0.120, p = 0.004, n = 570). The rest of the attributes did not correlate with the gender of the respondents, included’ tour guides communicate visitor codes’ (rs = −0.077, p = 0.066, n = 570), and visitor codes’ are observed by tour guides and tourists’ guides’ (rs = −0.024, p = 0.575, n = 570), where the calculated p-value was greater than the given p = 0.005. These results notwithstanding, it can be argued that the very weak correlations between the two out of the four attributes of visitor codes and the gender of the respondents were negligible as they were below 0.1. Therefore, it can be generalised that largely, respondents’ attitudes towards visitor codes were never affected considerably by their gender. As such, visitor codes can effectively be applied across all gender.
Further correlations between the gender of the respondents and tour guides were done, and results revealed two weak relationships out of the possible seven. One weak positive correlation was yielded with ‘recommendations on a new tour guide training curriculum, guides’ (rs = 0.245, p = 0.000, n = 570), which implied a weak proportionate relationship as shown in Table 3 above. Another very weak negative correlation was realized with TGs requiring regular NI training and sensitization (rs = −0.174, p = 0.000, n = 570), implying an inverse correlation. The remaining five attributes of tour guiding did not correlate with gender as the calculated p-value was greater than the given p = 0.005. These are ‘did you see/use tour guiding services’; ‘tour guides communicate do’s and don’ts’; ‘tour guides have a good understanding of wildlife’; ‘tour guides have good tour guiding skills’; and ‘tour guides provide enlightening nature interpretation’. All attributes relating to tour guiding execution did not correlate with gender. This means that profiling visitors along gender lines should never be a concern in implementing tour guiding. However, gender becomes a weak factor of consideration when determining recommendations for regular training of tour guides or the need for a new tour guide training curriculum.
As shown in Table 3 above, research findings indicated that tour guiding did not correlate with the age of the respondents as all attributes of tour guiding had a calculated p-value that was higher than the given p-value of 0.005. Therefore, study results indicated that tour guiding is valuable in delivering NI across all ages in MMNR. The only concern could be the content and manner of executing it. No correlations between age and tour guiding indicated that respondents’ attitudes towards tour guiding as a NI and conservation education approach were never affected by their age. While assessing how age correlated with visitor codes, study results established two very weak negative relationships with visitor codes are communicated by tour guides (rs = −0.097, p = 0.021, n = 570), and are observed by tour guides and tourists (rs = −0.095, p = 0.024, n = 570) as shown in Table 3 above. These results depicted a very weak inverse relationship, that is, when the age of the respondents increased attitudes towards ‘visitor codes are communicated by tour guides’ and ‘are observed by tour guides and tourists’ reduced and vice versa. This inverse relationship had a nearly negligible and very weak correlation.
On the other hand, a very weak positive correlation was established between respondents’ age and visitor codes rules and regulations in Mobile App (rs = 0.112, p = 0.008, n = 570). This result implied that the respondent’s attitudes and recommendations to have visitor codes as one of the features in a proposed Mobile App for MMNR was mildly affected by the respondents’ age; as age increased, the attitudes towards the visitor codes in the Mobile App increased. These results notwithstanding one other attribute of visitor codes did not correlate with the age of the respondents, that is, ‘did you see visitor codes/do’s and don’ts’ in MMNR (rs = 0.112, p = 0.008, n = 570). This was a weak proportionate relationship between the two variables.
Further analysis to establish a relationship between age and attributes of display boards and orientation signage yielded three very weak negative correlations and two no correlations, as shown in Table 3 above. ’Are strategically located’ has rs = −0.155, p = 0.000, n = 570; ’are of appropriate size and visible’ had rs = −0.179, p = 0.000, n = 570;’ while ‘are easy to read and understand’ had rs = −0.146, p = 0.000, n = 570. on the other hand, ‘did you see display boards and orientation signage’ had rs = −0.075, p = 0.075, n = 570; while ’are too many’ had rs = −0.068, p = 0.106, n = 570. Age and attributes of display boards and orientation signage yielded mixed reactions that can be summarized as no correlations or very weak positive and some very weak negative correlations that were largely inclined no correlations at all.
Level of education generally generated mixed very weak correlation results with attributes of tour guiding as a NI approach. In summary, there were three very weak negatives, one very weak positive correlation, and three no correlations. ‘Tour guides communicate do’s and don’ts’ yielded an rs = −0.107, p = 0.011, n = 570; ’recommend a new tour guiding curriculum’ rs = −0.182, p = 0.000, n = 570; ’did you see/use tour guiding services’, (rs = −0.083, p = 0.048, n = 570); and lastly, tour guides require regular NI training and sensitization (rs = 0.119, p = 0.005, n = 570) as shown in Table 3 above. On the other hand, ‘tour guides have a good understanding of wildlife’, ‘tour guides have good tour guiding skills’, and ‘tour guides provide enlightening NI’ had no correlations with level of education.
Further analysis on how the level of education correlated with attributes of’ visitor codes/do’s and don’ts, two very weak positive correlations and two no correlations were yielded as detailed in Table 3 above. ‘Tour guides communicate visitor codes’ had an rs = 0.099, p = 0.018, n = 570, and visitor codes rules and regulations in Mobile App had rs = 0.097, p = 0.021, n = 570. On the other hand, ‘did you see visitor codes/do’s and don’ts’ (rs = −0.062, p = 0.152, n = 570), and ‘is observed by tour guides and tourists’ (rs = −0.042, p = 0.319, n = 570) did not correlate with respondents’ level of education. Generally, the two correlations between the level of education and visitor codes/do’s and don’ts were very weak and negligible. It can be argued that the respondents’ level of education primarily did not affect their attitudes towards ‘visitor codes/do’s and don’ts. And as such, visitor codes/do’s and don’ts can be used effectively and nearly indiscriminately regardless of visitors’ level of education.
On correlating the respondents’ level of education with ‘display boards and orientation signage’ attributes, one very weak negative correlation was yielded with the query as to whether respondents saw display boards and orientation signage (rs = −0.094, p = 0.024, n = 570) at MMNR. All other attributes of display boards and orientation signage did not correlate with respondents’ level of education as the calculated p-value was greater than the given p = 0.005. They included’ are too many, ‘are strategically located’, ‘are of appropriate size and visible’, and ‘are easy to read and understand’. It can be argued that one very weak correlation was negligible. That level of education did not affect the respondents’ attitudes towards display boards and orientation signage as a NI and conservation education approach at the MMNR. Therefore the NI approach can be implemented across its visitor publics without profiling them by the level of education.
The study also sought to establish the relationship between the purpose of visit versus the NI and conservation education approaches implemented at the MMNR. Overall, out of the seven attributes under evaluation, tour guiding had one very weak negative correlation and two positive correlations with the respondents’ purpose of visit. These were ‘tour guides require regular NI training and sensitization’ (rs = −0.121, p = 0.004, n = 570), ‘tour guides communicates do’s and don’ts’ (rs = 0.107, p = 0.011, n = 570), and ‘recommend a new tour guiding curriculum’ (rs = 0.300, p = 0.000, n = 570), respectively. On the other hand, four attributes of tour guiding did not correlate with respondents’ purpose of visit. These are ’did you see/use tour guiding services’ (rs = −0.002, p = 0.962, n = 570); ’tour guides have a good understanding of wildlife’ (rs = 0.034, p = 0.423, n = 570); ’tour guides have good tour guiding skills’ (rs = 0.054, p = 0.199, n = 570); and ’tour guides provide enlightening NI’ (rs = 0.043, p = 0.307, n = 570). These results indicated that regardless of the purpose of the visit, respondents, to some small extent, endorsed the need for a new tour guide training curriculum. As for the other attributes of tour guiding, the two very weak correlations were near negligible, and thus tour guiding can be viewed as critical to all visitors in the MMNR.
Study results further revealed that the purpose of the visit had very weak positive correlations with three of the four attributes of visitor codes/do’s and don’ts. The remaining attribute did not correlate. These are, ’visitor codes are communicated by tour guides’ (rs = 0.094, p = 0.025, n = 570); ’visitor codes rules and regulations in Mobile App’ (rs = −0.097, p = 0.021, n = 570); and ’are observed by tour guides and tourists’ (rs = 0.120, p = 0.004, n = 570). On the other hand, ‘did you see visitor codes/do’s and don’ts’ had rs = 0.066, p = 0.113, n = 570.
The purpose of the visit was two very weak and three weak positive correlations with display boards and orientation signage. The two attributes that had very weak positive correlations were ‘did you see display boards and orientation signage’ (rs = 0.189, p = 0.000, n = 570), and that display boards and orientation signage ‘are too many’ (rs = 0.161, p = 0.000, n = 570). On the other hand weak positive correlations were observed between purpose of visit and ‘are strategically located’ (rs = 0.256, p = 0.000, n = 570); ‘are of appropriate size and visible’ (rs = 0.226, p = 0.000, n = 570), and lastly, ‘are easy to read and understand’ (rs = 0.226, p = 0.000, n = 570). Study results indicated a direct correlation that the purpose of the visit weakly influenced visitors’ attitudes towards display boards and orientation signage and very weakly towards visitor codes/do’s and don’ts. This implied that to a small extent, some caution should be taken in implementing these NI and conservation education at the MMNR that as the purpose of visit changed from work-related visit to vacation and research, attitudes increased and vice versa.
The study had sought to establish if the type of vehicle used by respondents correlated with the NI and conservation education approaches implemented at the MMNR. On tour guiding, results revealed that the type of vehicle used had a single and very weak negative with the recommendation for a new tour guiding curriculum (rs = −0.134, p = 0.001, n = 570) as shown in Table 3 above. This was one of the seven attributes of tour guiding, as the other six did not correlate with the type of vehicle used. These are ‘did you see/use tour guiding services’; ‘tour guides communicate do’s and don’ts’; and, ‘tour guides have a good understanding of wildlife’. In addition to these, ‘tour guides have good tour guiding skills’; ‘tour guides provide enlightening NI’; and ‘tour guides require regular NI training and sensitization’. These six attributes of tour guiding had a calculated p-value was greater than the given p = 0.005. These six attributes of tour guiding that never correlated with the type of vehicle used primarily focused on the skilling and execution of their duties. The correlated attribute was the recommendation for a new tour guide training curriculum. It can thus be argued that respondents’ attitudes towards tour guide knowledge and skilling were never affected by the type of vehicle used.
The type of vehicle used had one very weak negative correlation with one attribute of visitor codes/do’s and don’ts; that is ‘did you see visitor codes/do’s and don’ts’ (rs = −0.108, p = 0.010, n = 570). The other three attributes that did not correlate included ‘visitor codes are communicated by tour guides’, ‘visitor codes rules and regulations in Mobile App’, and ‘are observed by tour guides and tourists’ as their calculated p-value was greater than the given p = 0.005. This correlation was on if respondents saw visitor codes at MMNR. This is because the purpose of the visit can inversely dictate to a very weak extent how keen the visitors are to the visitor codes/do’s and don’ts found at MMNR. On the other hand, questions about how the visitor codes/do’s and don’ts are implemented and whether they are effective indicated no correlation. This means that the type of vehicle used did not affect the attitudes formed by respondents towards visitor codes/do’s and don’ts. Therefore in this regard, the approach can be implemented indiscriminately regardless of the vehicular type used to access MMNR.
When display boards and orientation signage were correlated with the type of vehicle used in the MMNR study, results yielded very weak negative correlations for all of its attributes. ’Did you see display boards and orientation signage’, (rs= −0.189, p = 0.000, n = 570), ’are too many’ (rs = −0.136, p = 0.001, n = 570), ’are strategically located’ (rs = −0.178, p = 0.000, n = 570), ’are of appropriate size and visible’ (rs = −0.159, p = 0.000, n = 570), and that display boards and orientation signage ’are easy to read and understand’ (rs = −0.161, p = 0.000, n = 570). Despite being very weak, all these correlations were significant at 0.01 level. This implies a very weak inverse correlation between the type of vehicle used and the attitudes towards display boards and orientation signage. That attitudes towards boards and orientation signage increased as the type of vehicle used reduced towards self-drive in ordinary vehicles. The attitudes reduced as the vehicle increased towards a tour-equipped vehicle with a professional tour guide. It is imperative to note that self-drive visitors with ordinary vehicles value display boards and orientation signage more because they are less experienced in visiting MMNR than tour guides who have experience and have more confidence in outdoor locations.

4. Conclusions and Recommendations

The study also established that out of sixteen possible correlations, the month of respondents’ visit had nine very weak negative correlations spread over attributes of tour guiding (5), visitor codes/do’s and don’ts (1), and display boards and orientation signage (3). The month of the visit had seven no correlations; tour guiding (2), visitor codes/do’s and don’ts (3), and display boards and orientation signage (2). More attention and effort should be in the high season compared to the low season despite very weak negative correlations. Results revealed a slight tendency for visitors to develop negative attitudes towards the NI approaches from low to high visitation months. This is especially true for tour guiding with the highest number of very weak negative correlations. The study recommends that regular tour guide training workshops, awareness creation, and hard visitor management strategies like patrols or penalties could supplement the NI approaches, especially in the high tourist seasons.
Regarding the respondents’ nationality, two very weak positive correlations and fourteen no correlations were established out of the sixteen possible attributes of NI approaches tested. All the display boards and orientation signage characteristics tested did not correlate, while tour guiding and visitor codes had one each. These correlations were on recommendations for a new tour guide training curriculum, and that visitor codes or rules and regulations should be included in the proposed Mobile App. These future recommendations from respondents notwithstanding, nationality did not affect the attitudes formed on NI as currently implemented at the MMNR. And therefore, the implementations of NI should not necessarily involve profiling visitors, albeit having the NI and conservation education information being made available in appropriate languages for respective target groups. The study recommends that some of the simple common signages and visitor codes be presented in at least three common international languages depending on the visitation trends.
Like nationality, gender had the second-highest number of no correlations at thirteen. Again, all attributes of display boards and orientation signage did correlate with gender, meaning that attitudes towards this form of NI were affected by gender. On the other hand, visitor codes had one very weak correlation and three no correlations, while tour guiding had five no correlations, one very weak, and one weak correlation. These recommendations were that tour guides require regular NI training and sensitization, visitor codes in Mobile App, and respondents’ recommend a new tour guide training curriculum. Important to note is that these correlations are related to respondents’ recommendations for future strategies and not how NI approaches are currently implemented at MMNR. Therefore holding other factors constant, gender did not affect respondents’ attitudes towards NI approaches currently implemented at MMNR. However, there is room for future improvements, like regular NI training and sensitization and a new tour guide training curriculum to enhance the skilling and delivery of NI. On the other hand, the Mobile application for NI should have visitor codes in Mobile App as one of its key features.
Overall, correlations between age and NI approaches in MMNR yielded five very weak negative and one very weak positive correlations, and ten no correlations. Seven of the no correlations was between age and tour guiding, as all attributes did not correlate. This means that NI through tour guiding can be applied across all ages without discrimination, albeit the only concern is to package conservation information appropriately for the respective age groups. Visitor codes and age revealed two very weak negatives, a very weak positive, and no correlation; the figures implied negligible correlations. This meant that attitudes towards visitor codes were least affected by the age of respondents and should, as such, be packaged to observe the tenets of effective communication through clarity. Display boards and orientation signage had three very weak negative correlations and two no correlations. Display boards and orientation signage are important regardless of age, especially for first-time or inexperienced visitors or due to seasonal route or operational changes, and should be managed keenly for all visitor groups.
Study results on attributes of NI approaches and respondents’ level of education generated seven very weak correlations and nine no correlations. Of these correlations, tour guiding had the highest count; three very weak negative and one very weak positive correlation. Visitor codes had two negligible correlations with level of education, while display boards and orientation signage had a single very weak correlation also. Even though all the correlations between the level of education and NI approaches are near negligible, it is imperative to note that as respondents’ level of education increased, there was a tendency to be more critical. Whereas most attributes of NI generated very weak and no correlations, in addition to these, the purpose of the visit had four weak correlations. These correlations were on recommendations for a new tour guide training curriculum, that display boards and orientation signage were strategically located, appropriate size and visible, and easy to read and understand. Correlating the type of vehicle used and NI approaches yielded seven very weak negative correlations and nine no correlations. Display boards and orientation signage had all attributes correlating with the type of vehicle used, while visitor codes and tour guiding had one very weak correlation each. Indeed, visitors were keen on display boards and orientation signage because they required proper signage to navigate the vast MMNR. Therefore, the study recommends that more attention be given to display boards and orientation signage to improve and erect more as they were observed to be few.
Overall, display boards and orientation signage had the highest number of very weak and weak correlations, followed by visitor codes/do’s and don’ts. Lastly, tour guiding with most no correlations. Study results indicated the prominence of tour guiding as the most widely used and recognisable NI approach in MMNR. It was followed by display boards and orientation signage, visitor codes or dos and don’ts, and lastly, the visitor information centres that were indeed very few. Overall, the study recommends continuous improvement of all NI approaches at the MMNR with urgency being given to display boards and orientation signage followed by visitor codes and tour guiding, as evidenced from findings. The study further recommends research on contemporary trends in NI and conservation education and information dissemination.

Author Contributions

Conceptualization, L.O.J. and A.K.-V.; methodology, L.O.J. and A.K.-V.; software, L.O.J. and A.K.-V.; validation, L.O.J.; A.K.-V. formal analysis, L.O.J. and A.K.-V.; investigation, L.O.J. and A.K.-V.; resources, L.O.J. and A.K.-V.; data curation, L.O.J.; writing—original draft preparation, L.O.J.; writing—review and editing, L.O.J. and A.K.-V.; visualization, L.O.J. and A.K.-V.; supervision, A.K.-V.; and project administration, A.K.-V. All authors have read and agreed to the published version of the manuscript.

Funding

This research received no external funding.

Informed Consent Statement

All respondents for the survey gave their informed consent for inclusion before they participated in the study. The study was conducted in accordance with the Declaration of Helsinki, and the protocol was approved by the Kenya’s National Commission of Science, Technology and Innovation vide research license number.

Data Availability Statement

The data presented in this study are available on request from the corresponding author. The data are not publicly available because it is part of an ongoing research.

Conflicts of Interest

The authors declare no conflict of interest.

References

  1. Stokes, D.; Crawshaw, B. Teaching Strategies for Environmental Education. Environmentalist 1986, 6, 35–43. [Google Scholar] [CrossRef]
  2. White Oak Wildlife. Conservation. Available online: http://www.whiteoakwildlife.org/conservation/ (accessed on 14 December 2021).
  3. Unites States Environmental Protection Agency. What is Environmental Education? Available online: https://www.epa.gov/education/what-environmental-education (accessed on 14 December 2021).
  4. Salazar, N.B. Tourism and Glocalization: ‘Local’ Tour Guiding. Ann. Tour. Res. 2005, 32, 628–646. [Google Scholar] [CrossRef] [Green Version]
  5. Black, R.; Ham, S.H. Improving the quality of tour guiding: Towards a model for tour guide certification. J. Ecotourism 2005, 4, 178–195. [Google Scholar] [CrossRef]
  6. Mak, A.H.; Wong, K.K.; Chang, R.C. Critical issues affecting the service quality and professionalism of the tour guides in Hong Kong and Macau. Tour. Manag. 2011, 32, 1442–1452. [Google Scholar] [CrossRef]
  7. Mak, A.H.; Wong, K.K.; Chang, R.C. Factors affecting the service quality of the tour guiding profession in Macau. Int. J. Tour. Res. 2010, 12, 205–218. [Google Scholar] [CrossRef]
  8. Nyahunzvi, D.K.; Njerekai, C. Tour guiding in Zimbabwe: Key issues and challenges. Tour. Manag. Perspect. 2013, 6, 3–7. [Google Scholar] [CrossRef]
  9. Prakash, M.; Chowdhary, N.; Sunayana. Tour Guiding: Interpreting the Challenges. 2011. Available online: http://chios.aegean.gr/tourism/volume_6_no2_art04.pdf (accessed on 14 December 2021).
  10. Huang, S.; Hsu, C.H.; Chan, A.M. Tour guide performance and tourist satisfaction: A study of the package tours in Shanghai. J. Hosp. Tour. Res. 2010, 34, 3–33. [Google Scholar] [CrossRef]
  11. Poudel, S.; Nyaupane, G.P. The Role of Interpretative Tour Guiding in Sustainable Destination Management A Comparison between Guided and Nonguided Tourists. J. Travel Res. 2013, 52, 659–672. [Google Scholar] [CrossRef]
  12. Stewart, M.A. Managing Heritage Site Interpretation for Older Adult Visitors. 2017. Available online: http://symphonya.unicusano.it/article/view/2016.2.09avellino (accessed on 15 December 2021).
  13. Kuo, I.-L. The effectiveness of environmental interpretation at resource-sensitive tourism destinations. Int. J. Tour. Res. 2002, 4, 87–101. [Google Scholar] [CrossRef]
  14. Mason, P.A. Visitor Management in Protected Areas: From ‘Hard’ to ‘Soft’ Approaches? Curr. Issues Tour. 2005, 8, 181–194. [Google Scholar] [CrossRef]
  15. Palmer, J. Environmental Education in the 21st Century: Theory, Practice, Progress and Promise; Routledge: London, UK, 1998. [Google Scholar]
  16. Pudin, S. Development of an Environmental Education Programme for Waste Management with Local Communities in Sabah, Malaysia. Ph.D. Thesis, The University of Waikato, Hamilton, New Zealand, 2015. Available online: https://researchcommons.waikato.ac.nz/bitstream/handle/10289/9675/thesis.pdf?sequence=4&isAllowed=y (accessed on 15 December 2021).
  17. UNESCO. Intergovernmental Conference on Environmental Education (Final Report); UNESCO: Paris, France, 1978. [Google Scholar]
  18. Clover, D.E. Environmental adult education. Adult Learn. 2002, 13, 2–6. [Google Scholar] [CrossRef]
  19. Stevenson, R.B.; Stirling, C. Environmental learning and agency in diverse education and cultural contexts. In Engaging Environmental Education: Learning, Culture and Agency; Stevenson, R.B., Dillon, J., Eds.; Sense: Rotterdam, The Netherlands, 2010; pp. 219–237. [Google Scholar]
  20. Carleton-Hug, A.; Hug, J.W. Challenges and opportunities for evaluating environmental education programs. Eval. Program Plan. 2010, 33, 159–164. [Google Scholar] [CrossRef] [PubMed]
  21. North American Association for Environmental Education (NAAEE), 2014 Status Report. Available online: https://cdn.naaee.org/sites/default/files/eepro/resource/files/2014_state_elp_report.pdf (accessed on 14 December 2021).
  22. Jacobson, S.K.; McDuff, M.D.; Monroe, M. Conservation Education and Outreach Techniques; Oxford Scholarship Online: Oxford, UK, 2006. [Google Scholar]
  23. Schneller, A.J. Environmental service learning: Outcomes of innovative pedagogy in Baja California Sur, México. Environ. Educ. Res. 2008, 14, 291–307. [Google Scholar] [CrossRef]
  24. Stirling, A. Keep it complex. Nature 2010, 468, 1029–1031. [Google Scholar] [CrossRef] [PubMed]
  25. Bloom, B.; Englehart MFurst, E.; Hill, W.; Krathwohl, D. Taxonomy of Educational Objectives: The Classification of Educational Goals. Handbook I: Cognitive Domain; Longmans, Green: New York, NY, USA; Toronto, ON, Canada, 1956. [Google Scholar]
  26. Mayer, F.S.; Frantz, C.M. The connectedness to nature scale: A measure of individuals’ feeling in community with nature. J. Environ. Psychol. 2004, 24, 503–515. [Google Scholar] [CrossRef] [Green Version]
  27. Louv, R. Children and Nature: A Report on the Movement to Reconnect Children to the Natural World. 2008. Available online: https://www.childrenandnature.org/wp-content/uploads/CNMovement.pdf (accessed on 15 December 2021).
  28. Nisbet, E.K.; Zelenski, J.M.; Murphy, S.A. The Nature Relatedness Scale: Linking Individuals’ Connection with Nature to Environmental Concern and Behavior. Environ. Behav. 2008, 41, 715–740. [Google Scholar] [CrossRef]
  29. McKenzie-Mohr, D.; Lee, N.R.; Schultz, P.W.; Kotler, P.A. Social Marketing to Protect the Environment: What Works; Sage Publications: New York, NY, USA, 2012. [Google Scholar]
  30. Clayton, S.; Litchfield, C.; Geller, E.S. Psychological science, conservation, and environmental sustainability. Front. Ecol. Environ. 2013, 7, 377–382. [Google Scholar] [CrossRef] [Green Version]
  31. Tilden, F. Interpreting our heritage. In Chapel Hill Books; University of North Carolina Press: Chapel Hill, NC, USA, 1997; Available online: https://books.google.hu/books?printsec=frontcover&vid=LCCN77365104&redir_esc=y#v=onepage&q&f=false (accessed on 23 November 2019).
  32. Ham, S.H.; Sandberg, E.K. Interpretation as Strategic Communication in Protected Area Management. In Proceedings of the 6th International Conference on Monitoring and Management of Visitors in Recreational and Protected Areas, Stockholm, Sweden, 21–24 August 2012; Fredman, P., Stenseke, M., Liljedahl, H., Mossing, A., Daniel, L., Eds.; MMV: Stockholm, Sweden, 2012; pp. 132–133. [Google Scholar]
  33. Juma, L.O.; Bakos, I.M.; Khademi-Vidra, A. Nature Interpretation and Visitor Management Objectives: A Survey of Tourist Attitudes at Maasai Mara National Reserve, Kenya. Sustainability 2020, 12, 7246. [Google Scholar] [CrossRef]
  34. Juma, L.O. Nature Interpretation and Visitor Management in Protected Areas: An Analysis of Stakeholder Attitudes; Lambert Academic Publishing: Saarbrücken, Germany, 2016. [Google Scholar]
  35. Albrecht, J.N. Introduction to Visitor Management in Tourism Destinations. In Visitor Management in Tourism Destinations; Albrecht, J.N., Ed.; CABI: Wallingford, UK, 2017; pp. 3–8. [Google Scholar]
  36. Hull, R.B.; Stewart, W.P.; Yi, Y.K. Experience Patterns: Capturing the Dynamic Nature of a Recreation Experience. J. Leis. Res. 1992, 24, 240–252. [Google Scholar] [CrossRef]
  37. Norman, M.; Roggenbuck, J.W. Nature/Person Transactions during an Outdoor Adventure Experience: A Multi-Phasic Analysis. J. Leis. Res. 1998, 30, 401. [Google Scholar]
  38. Terry, H. Nature Experience in Transactional Perspective. Landsc. Urban Plan. 1993, 25, 17–36. [Google Scholar]
  39. Borrie, W.T.; Roggenbuc, J.W. The Dynamic, Emergent, and Multi-Phasic Nature of On-Site Wilderness Experiences. J. Leis. Res. 2001, 33, 202. [Google Scholar] [CrossRef]
  40. Patterson, M.E.; Watson, A.E.; Williams, D.R.; Roggenbuck, J.R. An Hermeneutic Approach to Studying the Nature of Wilderness Experiences. J. Leis. Res. 1998, 30, 423. [Google Scholar] [CrossRef]
  41. Werner, C.M.; Altman, I. Humans and Nature: Insights from a Transactional View. In Theoretical Perspectives in Environment-Behavior Research; KluwerAcademic/Plenum Publishers: New York, NY, USA, 2000; pp. 21–37. [Google Scholar]
  42. Jurow, K. Making Meaning Together: The Role of Interpretation during a Short-Term Nature Excursion. Ph.D. Thesis, Antioch University, Keene, NH, USA, 2016. Available online: https://aura.antioch.edu/cgi/viewcontent.cgi?article=1297&context=etds (accessed on 15 December 2021).
  43. Coble, T.; Lin, H.S.; Coble, D.; Hart, J.L.; Darville, R. Visitor Voices: Assessing Interpretive Outcomes in the Intermountain Region; National Park Service: Washington, DC, USA, 2005. [Google Scholar]
  44. Pine, B.J.; Gilmore, J.H. Welcome to the experience economy. Harv. Bus. Rev. 1998, 76, 96–105. [Google Scholar]
  45. Marzouki, S.Y.; Posecion, A.T. Employee Engagement and Commitment, Communication Skills and Talent Management Competencies of Tourism Professionals. J. Tour. Hosp. Sports 2019, 40, 43–59. [Google Scholar]
  46. Jahwari, D.S.; Sirakaya-Turk, E.; Tanrisever, C. Efficacy of the theory of communication competence and personality traits in predicting tour guides’ income. J. Hum. Resour. Hosp. Tour. 2017, 16, 109–136. [Google Scholar] [CrossRef]
  47. Guzman, J.P. Tour Guiding Competency of Tourism Graduates Working in Selected Travel Agencies in Calamba City, 2009. Ani Let. Calamba Res. Rep. 2011, 1, 1. [Google Scholar]
  48. Rahmawati, E. Improving the Quality Service of Tour Guides through the Competency Certification Program; Public Knowledge Project—Open Journal Systems, Budapest: 2015. Available online: http://unisbank.ac.id/ojs/index.php/sendi_u/article/view/3319/926 (accessed on 15 December 2021).
  49. Lin, Y.-C.; Lin, M.-L.; Chen, Y.-C. How Tour Guides’ Professional Competencies Influence on Service Quality of Tour Guiding and Tourist Satisfaction: An Exploratory Research. International J. Hum. Resour. Stud. 2017, 7, 1–19. [Google Scholar] [CrossRef]
  50. Ong, C.-E.; Ryan, C.; McIntosh, A.J. Power-knowledge and tour-guide training: Capitalistic domination, utopian visions and the creation and negotiation of UNESCO’s Homo Turismos in Macao. Ann. Tour. Res. 2014, 48, 221–234. [Google Scholar] [CrossRef]
  51. Jacobson, S.K.; Robles, R. Ecotourism, sustainable development, and conservation education: Development of a tour guide training program in Tortuguero, Costa Rica. Environ. Manag. 1992, 16, 701–713. [Google Scholar] [CrossRef]
  52. Leff, P. California counties adapt permitting and regulations for agritourism. Calif. Agric. 2011, 65, 2. [Google Scholar] [CrossRef] [Green Version]
  53. Prakash, M.; Chowdhary, N. Tour guides: Roles, challenges and desired competences A review of literature. International J. Hosp. Tour. Syst. 2010, 3, 1–12. [Google Scholar]
  54. Kuo, I.-L. The Use of Visitor Management Techniques to Protect a Fragile Environment. Ph.D. Thesis, Bournemouth University, Poole, UK, 2003. [Google Scholar]
  55. National Parks Service. Redwood National and State Parks California. Available online: https://www.nps.gov/redw/index.htm (accessed on 14 December 2021).
  56. Mukhina, K.D.; Rakitin, S.v.; Visheratin, A.A. Detection of tourists attraction points using Instagram profiles. Procedia Comput. Sci. 2017, 108, 2378–2382. [Google Scholar] [CrossRef]
  57. Švajda, J.; Masný, M.; Koróny, S.; Mezei, A.; Machar, I.; Taczanowska, K. Visitor profiling using characteristics of socio-demographic and spatial behavior as tools to support the management of protected mountain areas. Geografie 2018, 123, 461–478. [Google Scholar] [CrossRef]
  58. McArthur, T. Living Words_Language, Lexicography and the Knowledge Revolution; University of Exeter Press: Exeter, UK, 1998. [Google Scholar]
  59. Rátz, T. Cultural Tourism. In Turisztikai Terméktervezés és Fejlesztés; University of Pécs: Pécs, Hungary, 2011; Available online: http://www.eturizmus.pte.hu/szakmai-anyagok/Turisztikai%20term%C3%A9ktervez%C3%A9s%20%C3%A9s%20fejleszt%C3%A9s/book.html (accessed on 14 December 2021).
  60. Szeberényi, A. Examining the Main Areas ff Environmental Awareness, Sustainability and Clean Energy. In Sustainable Development Goals Southampton; Daniel, G., Hayri, U., Rashmi, G., Eds.; Tradepreneur Global Academic Platform: London, UK, 2021; pp. 17, 258–274, 458. [Google Scholar]
  61. Eagles, P.; Mccool, S.; Haynes, C.; Phillips, A. Sustainable Tourism in Protected Areas Guidelines for Planning and Management. Park Tourism Projekt. 2002. Available online: https://portals.iucn.org/library/sites/library/files/documents/pag-008.pdf (accessed on 14 December 2021).
  62. Mitchell, J.; Ryland, P. Creating an Interpretation Plan: An Introduction Natural Interpretation: A Guide To The Interpretation Of Nature And Wildlife. 2020. Available online: http://eprints.bournemouth.ac.uk/29728/7/BPG13-Natural%20interpretation.pdf. (accessed on 15 December 2021).
  63. Mazilu, M.; Mitroi, S. Demographic, social, economic and geographic features shaping factors of the tourist market. Rom. Econ. Bus. Rev. 2010, 5, 159–166. [Google Scholar]
  64. Kara, N.S.; Mkwizu, K.H. Demographic factors and travel motivation among leisure tourists in Tanzania. Int. Hosp. Rev. 2020, 34, 81–103. [Google Scholar] [CrossRef]
  65. Mkwizu, K.H. Analysis of sources of information and income of domestic tourists to national parks in Tanzania. ATLAS Tour. Leis. Rev. 2018, 2018, 28–43. [Google Scholar]
  66. Mkwizu, K.H. The Influence of Television Advertising on Domestic Tourism: A Case of Southern Tourist Attractions in Tanzania. Available online: http://repository.out.ac.tz/1878/ (accessed on 4 January 2018).
  67. Ma, A.; Chow, A.; Cheung, L.; Lee, K.; Liu, S. Impacts of tourists’ socio-demographic characteristics on the travel motivation and satisfaction: The case of protected areas in South China. Sustainability 2018, 10, 3388. [Google Scholar] [CrossRef] [Green Version]
  68. Weaver, D.; Oppermann, M. Tourism Management; John Wiley: Milton, MA, USA, 2000. [Google Scholar]
  69. Mieczkowski, Z. The World Trends in Tourism and Recreation; Peter Lang: New York, NY, USA, 2020. [Google Scholar]
  70. Spence, M. The effect of age on the probability of participation in wildlife-related activities: A birth year cohort study. Am. J. Agric. Econ. 2002, 84, 1384–1389. [Google Scholar] [CrossRef]
  71. Collins, D.; Tisdell, C. Gender and differences in travel life cycles. J. Travel Res. 2002, 41, 133–143. [Google Scholar] [CrossRef]
  72. Josiam, B.; Kinley, T.; Kim, Y. Involvement and the tourist shopper: Using the involvement construct segment the American tourist shopper at the mall. J. Vacat. Mark. 2005, 11, 135–154. [Google Scholar] [CrossRef]
  73. Andronikidis, A.; Vassiliadis, C.; Masmanidis, T. Evaluation of the compatibility degree of constraint variables for the demand of ski center services. J. Vacat. Mark. 2008, 14, 211–220. [Google Scholar] [CrossRef]
  74. Scott, D. The Relevance of Constraints Researches to Leisure Service Delivery; Jackson, E.L., Ed.; Constraints to Leisure; Venture Publishing: State College, PA, USA, 2005; pp. 279–293. [Google Scholar]
  75. Alexandris, K.; Carrol, B. Demographic differences in the perception of constraints on recreational sports participation: Result from a study in Greece. Leis. Stud. 1997, 16, 107–125. [Google Scholar] [CrossRef]
  76. Xie, H.; Costa, C.; Morais, D. Gender differences in rural tourists motivation and activity participation. J. Hosp. Leis. Mark. 2008, 16, 1–27. [Google Scholar] [CrossRef]
  77. Fan, X.; Qiu, H.; Hsu, C.; Liu, Z. Comparing motivations and intentions of potential cruise passengers from different demographic groups: The case of China. J. China Tour. Res. 2015, 11, 461–480. [Google Scholar] [CrossRef]
  78. Akoglu, H. User’s guide to correlation coefficients. Turk. J. Emerg. Med. 2018, 18, 91. [Google Scholar] [CrossRef] [PubMed]
  79. Juma, L.O.; Khademi-Vidra, A. (2021) Research data (2021). N = 570.
Figure 1. Types of NI in MMNR [79].
Sustainability 14 02935 g001
Figure 2. Respondents’ attitudes towards tour guiding attributes (n = 570) [79].
Sustainability 14 02935 g002
Figure 3. Attitudes towards Non-personal forms of NI (n = 570) [79].
Sustainability 14 02935 g003
Table 1. Applicability of different Media and Strategies in Nature interpretation.
Media and StrategyApplicationStrengthsLimitations
Print media
and websites
Provide pre-arrival information, such as site maps, a list of media and activities available, and the best routes.
During their visit to the site, provide visitors with directions.
Give details on the location, its landscape, and its wildlife (incl. streaming)
Provide environmental communications, codes of conduct, or site-specific or key ecological messages, as needed.
Apps and a variety of digital materials help in on-the-spot interpretation.
Easily transportable and valuable
Multiple points of entry
Budget-friendly
Widespread distribution
Raising the site’s profile can assist in managing expectations before they arrive.
Regular maintenance is required. Match the product to the site’s ‘look and feel.’
On-site’ litter’ can be created from paper-based materials.
Is the site’s Wi-Fi adequate?
Some visitors may have limited time to spend on site
Roadside display boards, visitor centres, and viewing sitesA focal point for the rangers/volunteers have a base of operations here.
Provide site information as well as upcoming activities and events.
Provide various content, including static, audio, paper-based, and live exhibits.
Feely boxes, cabinets, and touch tables can help to foster personal connections.
Provide details on the site’s management applicable codes of conduct, among others
A conspicuous location where tourists can obtain site-related information and guidance
Possibility of providing a diverse selection of media
If it does not already exist, it can be costly to start up.
It needs to be updated regularly or have a “rolling program’ for repeat visitors
Not be suitable for all visitors.
Wildlife
viewing hides and lookouts
Can give visitors a cause to visit a location and a focal point of their visit.
Allows visitors to have a first-hand experience searching for and seeing wildlife.
They can host various media, but static graphic panels are frequently used.
Rangers or volunteers can meet and greet tourists from this spot.
Whether or not to supply optical equipment for visitors needs to be considered.
It can assist visitors in being more connected to nature.
Self-discovery creates value for the tourist experience.
Can control visitor interest while minimizing wildlife disturbance
Wildlife sightings might be unpredictable.
Unique locations may be in isolated, unstaffed areas.
Isolated enclosures can be intimidating for some visitors.
Visitors require their optical equipment for better views.
Face-to-face and guided tours;
Rangers, guides, volunteers
Rangers give information, orientation, and explanations, manage expectations, create awareness, and monitor on-site behaviour. Rangers can also present theatre, music, poetry, and walks and activities.
Patrolling rangers can ‘stroll the site,’ meet and greet tourists, and serve on ‘information duty,’ among other things.
Tours can be personalized to people with varying degrees of interest and understanding on various topics.
Rangers can organize ‘working parties’ to allow visitors to more personally interact with the site
Highly effective and powerful.
Rangers can respond to guest requests and queries immediately.
The information provided can be updated regularly and matched to the visitors’ needs.
Visitors’ active participation and engagement can be easily facilitated
Experienced and well-trained rangers, tour guides, and volunteers are required.
It might not be suitable for all types of visitors.
There should be a diverse choice of tour subjects available.
Patrolling rangers are ineffective on vast and isolated sites.
Electronic strategiesPodcasts, interactive maps, and downloaded audio trails are available on mobile devices and applications.
Spy and webcams are used, providing either a live broadcast or edited highlights. Reasonably necessary for sensitive wildlife species or areas that are potentially harmful or difficult to reach.
These technologies could be used to support additional on the site interpretative activities and/or media.
Easy to carry and use
The material that visitors are interested in is available to them.
Possible to update straightforwardly and straightforwardly.
Visitors can share photos and leave their comments.
Costly updating and ongoing maintenance
Higher technological abilities are necessary.
Rely on explanations given on the spot.
Inappropriate for some sites
Challenges of Wi-Fi/mobile connectivity.
Source: adapted from [33,62].
Table 2. Demographic characteristics of the respondents (n= 570) [79].
DemographicSPSS CodeDescriptionFrequencyValid Percent
The month of
data collection
1Jan5910.4
2Feb407.0
8Aug17831.2
9Sep11520.2
11Nov11420.0
12Dec6411.2
Total570100.0
Nationality1Kenyan Citizen38567.5
2Resident Foreigner7813.7
3Non-resident10718.8
Total570100.0
Gender of respondents1Male35361.9
2Female20736.3
3Other101.8
Total570100.0
Age 1Below 24 years8314.6
225–40 years31054.4
341–65 years16629.1
466 years & above111.9
Total570100.0
Education level1University28149.3
2College25444.6
3Secondary284.9
4Primary71.2
Total570100.0
Purpose of visit1Work-related-Tour guide15727.5%
2Work-Related-Others91.6%
3Holiday/Vacation32456.8%
4Education and research8014.0%
Total570100.0
Vehicle type used1Self-drive on ordinary vehicle9116.0
2Self-drive on tour
equipped vehicle
335.8
3Driver Guide & Company
tour equipped vehicle
33859.3
4Freelance Local Guide &
tour equipped vehicle
10818.9
Total 570100.0
Table 3. Correlations between NI approaches and respondents’ demographic characteristics (n = 570) [79].
Approaches of NIAttributes of the
Approaches in NI
Month of VisitNationalityGenderAgeEducation LevelPurpose of VisitVehicle Used
Tour guidingDid you see/use Tour Guiding servicesrs−0.123 **0.0820.0390.004−0.083 *−0.0020.054
p value0.0030.0510.3490.9310.0480.9620.196
Tour guides communicates do’s and don’tsrs−0.0720.0750.082−0.011−0.107 *0.107 *−0.058
p value0.0860.0740.0520.7960.0110.0110.163
Tour guides have a good understanding of wildlifers−0.096 *−0.0080.0380.006−0.0390.0340.002
p value0.0220.8560.3710.8900.3540.4230.970
Tour guides have good tour guiding skillsrs−0.156 **0.0560.020−0.022−0.0440.054−0.006
p value0.0000.1800.6320.5940.2980.1990.877
Tour guides provide enlightening NIrs−0.109 **0.0500.0420.015−0.0300.0430.028
p value0.0090.2320.3130.7290.4690.3070.499
TGs require regular NI training and sensitizationrs−0.102 *−0.057−0.174 **−0.0270.119 **−0.121 **0.023
p value0.0150.1770.0000.5230.0050.0040.582
Recommend a new tour guiding curriculumrs−0.0280.185 **0.245 **−0.058−0.182 **0.300 **−0.134 **
p value0.5080.0000.0000.1640.0000.0000.001
Visitor Codes/Do’s and Don’tsDid you you see visitor codes/do’s and don’tsrs0.0230.0450.140 **0.005−0.0600.066−0.108 *
p value0.5880.2830.0010.9020.1520.1130.010
Visitor codes are communicated by tour guidesrs−0.060−0.077−0.022−0.097 *0.099 *0.094 *−0.026
p value0.1510.0660.6070.0210.0180.0250.535
Visitor codes rules and regulations in Mobile Apprs0.0050.116 **0.120 **0.112 **0.097 *−0.097 *0.058
p value0.8990.0050.0040.0080.0210.0210.164
Are observed by tour guides and touristsrs−0.085 *−0.024−0.002−0.095 *−0.0420.120 **−0.062
p value0.0440.5750.9540.0240.3190.0040.137
Display boards and orientation signageDid you see display boards and orientation signagers−0.0600.0170.043−0.075−0.094 *0.189 **−0.189**
p value0.1550.6790.3030.0750.0240.0000.000
Are too manyrs0.039−0.0680.042−0.0680.0620.161 **−0.136 **
p value0.3540.1060.3170.1060.1390.0000.001
Are strategically locatedrs−0.130 **−0.0710.027−0.155 **−0.0510.256 **−0.178 **
p value0.0020.0890.5170.0000.2240.0000.000
Are of appropriate Size and Visiblers−0.157 **0.0190.056−0.179 **−0.0630.226 **−0.159 **
p value0.0000.6490.1800.0000.1340.0000.000
Are easy to read and understandrs−0.167 **−0.0270.023−0.146 **−0.0780.226 **−0.161 **
p value0.0000.5250.5910.0000.0620.0000.000
**. Correlation is significant at the 0.01 level (2-tailed); *. Correlation is significant at the 0.05 level (2-tailed); rs—Spearmans’ correlation coefficient.
Publisher’s Note: MDPI stays neutral with regard to jurisdictional claims in published maps and institutional affiliations.

