Abstract
After a sudden-onset disaster strikes, relief agencies usually dispatch assessment teams to the affected region to quickly investigate the impacts of the disaster on the affected communities. Within this process, assessment teams should compromise between the two conflicting objectives of a “faster” assessment, which covers the needs of fewer community groups, and a “better” assessment, i.e., covering more community groups over a longer time. Moreover, due to the possible effect of the disaster on the transportation network, assessment teams need to make their field-visit planning decisions under travel-time uncertainty. This study considers the two objectives of minimizing the total route duration and maximizing the coverage ratio of community groups, as well as the uncertainty of travel times, during the rapid needs assessment stage. In particular, within our bi-objective solution approach, we provide the set of non-dominated solutions that differ in terms of total route duration and the vector of community coverage ratio at different levels of travel-time uncertainty. Moreover, we provide an in-depth analysis of the amount of violation of maximum allowed time for decision makers to see the trade-offs between infeasibility and solution quality. We apply the robust optimization approach to tackle travel-time uncertainty due to its advantages in requiring fewer data for uncertain parameters and immunizing a feasible solution under all possible realizations.
1. Introduction
After a sudden-onset disaster, humanitarian organizations begin mobilizing healthcare facilities, equipment and relief items to assist the affected area. Beforehand, however, it is of high importance to evaluate the local capacity on the field and the needs of the affected communities to guide the decisions needed to provide appropriate and effective assistance [1]. This quick evaluation of the impacted region is called rapid needs assessment (RNA) and usually starts as early as a few hours after the occurrence of a disaster, aiming to evaluate the disaster’s impact on various community groups. The RNA is conducted by a number of assessment teams who travel to the field, perform direct observations of the affected sites and conduct interviews with the impacted community groups [2,3,4]. Assessment teams consist of people with different specialties, such as public health, epidemiology, nutrition, logistics and shelter, in addition to experts who are familiar with the local area [3,4]. In the RNA stage, humanitarian organizations can identify the most vulnerable community groups that need immediate intervention to guarantee social sustainability. The information gathered by assessment teams helps humanitarian agencies to effectively satisfy the needs of affected communities in times of great need [4].
Assessment teams must quickly plan their field visits and decide which sites to go to in order to capture the needs of various community groups within the limited time and resources. These constraints do not usually allow assessment teams to visit all affected sites, and as a result, they can only choose a sample of sites to visit [3]. Site-sampling processes aim to choose a limited number of sites to visit that allows assessment teams to compare the conditions of the various community groups affected based on social and cultural characteristics, such as ethnicity, religion, age and gender, or other factors, such as displaced persons, host communities and returnees [2,3].
While planning field visits, assessment teams encounter the two conflicting but at the same time essential objectives of performing “faster” or “better” assessments. In fact, on the one hand, they try to complete the assessment operations as fast as possible, while on the other hand, they want, if possible, to visit more community groups and receive more information about their needs. Zissman et al. [5] (p. 13) stated that, in the planning of a humanitarian needs assessment for Haiti, “the key challenge was that the data were required urgently: a better assessment could be produced by spending more time designing its elements and verifying its results, but the data were needed faster to inform urgent actions to provide relief to those in need”. To find the best trade-off between these two conflicting objectives, we consider a bi-objective optimization problem with minimizing the total route duration as the first objective and maximizing the coverage ratio of community groups as the second objective.
Furthermore, during the RNA stage, it is hard to obtain well-timed and accurate information about the status of the transportation network in the affected area; therefore, field visits may be conducted under high travel-time uncertainty [6]. Due to the special characteristics of any disasters, there are not enough historical data on uncertain parameters, nor repetitions of their occurrence, so it is challenging to find the probabilistic distributions of uncertain parameters. This characteristic of disasters hampers the application of stochastic optimization, in which it is assumed that we know the probability distribution of the random parameters. In this study, we apply a robust optimization approach to address travel-time uncertainty in a post-disaster situation. The robust optimization approach just requires a so-called uncertainty set without the need to obtain distributional information and immunizes a feasible solution under all possible realizations [7,8,9]. Nevertheless, handling uncertainty with a robust approach needs basic information about this uncertainty set. For this, an expert who has knowledge of the uncertain parameters can determine the smallest closed set as a support of the data. It is necessary to mention that determining a distribution itself is much harder than identifying the support set of a distribution. Therefore, robust optimization requires fewer data than stochastic programming approaches. Accordingly, since there is generally limited information as well as available time to make the required decisions in a disastrous situation, applying a robust optimization approach seems to be preferable to other uncertainty approaches. In this study, we use the “worst-case-oriented” philosophy of robust optimization, which fits with a disastrous situation. The motivation to adopt this approach is to generate solutions that are feasible for “any” realizations of an uncertain parameter in a given set. Having such robust solutions is important, since infeasible solutions may cause delays in the assessment process, which, in turn, can affect the overall performance of the disaster response [6].
This study investigates the following research question: What is the best trade-off between the total route duration and the coverage ratio of community groups in the RNA stage characterized by different levels of uncertainty with respect to travel times?
To sum up, our contribution is two-fold. First, different from the previous single-objective study by Balcik and Yanıkoğlu [6], we consider the travel-time uncertainty of post-disaster environments within a bi-objective setting. In particular, we provide the set of non-dominated solutions that differ in terms of total route duration and the vector of community coverage ratio at different levels of travel-time uncertainty. Second, we provide a non-binary perspective into route infeasibility to assist decision makers in understanding when it may be reasonable to ignore a slight violation of the maximum allowed duration to achieve a higher coverage ratio instead.
The rest of the paper is organized as follows: In Section 2, we review the relevant literature. In Section 3, we describe the two main aspects of this study, including the considered bi-objective approach in Section 3.1 and the robust optimization approach in Section 3.2. Section 4 and Section 5 provide the solution method and computational results, respectively. Finally, concluding remarks and some possible future works are presented in Section 6.
2. Related Literature
Balcik [10] proposed a mixed integer mathematical model to address the site selection and routing decisions of assessment teams during the RNA stage in which assessment teams aim to choose a subset of sites to visit and to evaluate the post-disaster conditions of different community groups, each carrying a distinct characteristic. Balcik [10] called this model “Selective Assessment Routing Problem” (SARP). In order to have a balanced evaluation of various community groups, the SARP adopts the classic max–min approach by maximizing the minimum coverage ratio of community groups. This coverage ratio is obtained by the number of times that a characteristic is observed divided by the total number of sites in the network with that characteristic [10]. The SARP considers the maximum-allowed-time constraints, which define the assessment deadline.
Instead of maximizing the minimum coverage ratio, Pamukcu and Balcik [11] took a different approach from Balcik [10] by assuming that there is a pre-specified target number of the visits required to cover each community group and the goal is minimizing the total duration necessary to cover all community groups. Li et al. [12] considered both the RNA stage and the detailed needs assessment stage. With regard to the RNA stage, the objective function in Li et al.’s [12] work aims to maximize the minimum coverage ratio of various community groups (similar to Balcik [10]). As for the detailed needs assessment stage, in which covering all the affected sites is necessary, the objective function aims to minimize the maximum assessment time of all assessment teams. Looking at the post-disaster assessment activities from a customer-centric perspective, Bruni et al. [13] minimized the total latency and considered a service level constraint that ensures a pre-determined level of coverage ratio. Hakimifar et al. [14] proposed easy-to-implement heuristic algorithms for planning the field visits during the RNA stage. They used a simulation environment to evaluate the performance of the presented heuristic algorithms. Hakimifar et al. [15] considered the lexicographic maximin approach, which refines the classic max–min approach used by Balcik [10] by distinguishing solutions with the same max–min value. The goal of this differentiation is to provide a range of solutions with more sites to visit along the assessment routes. Visiting such extra sites increases the coverage ratio of at least one characteristic [10]. As an alternative to the classic max–min approach, the lexicographic minimax approach with the goal of providing fair solutions has been considered in various areas of operations research, including facility location [16], supply-chain optimization [17], air-traffic-flow management [18], and bandwidth allocation and network optimization; see, e.g., [19,20]. Closer to our research interests, the lexicographic-ordering approach has also been integrated in vehicle-routing problems, e.g., by lexicographically minimizing the sorted route length or duration; see, e.g., [21,22].
Similar to the assumption in our paper, Balcik and Yanıkoğlu [6] considered the travel-time uncertainty of post-disaster networks in the RNA stage and proposed a robust optimization approach to tackle uncertainty. They proposed a target-based coverage objective which maximizes the minimum excess value obtained among the community groups. The excess value is the difference between the number of site visits made per community group and the pre-specified target value. Our paper adopts the idea of travel-time uncertainty presented in Balcik and Yanıkoğlu [6] and integrates it with the deterministic study by Hakimifar et al. [15], who considered a bi-objective optimization model that offers the best trade-off between the total route duration and coverage-ratio vector maximization to the SARP.
The simultaneous consideration of multiple objectives and uncertainty in the optimization model has been studied in different areas of the humanitarian-relief literature, such as facility location (e.g., [23,24]), transportation planning (e.g., [25]), urban evacuation planning (e.g., [26]) and blood-supply-chain planning (e.g., [27]). In this study, we extend the literature on humanitarian relief by considering both bi-objectives and uncertainty of travel times during the RNA stage, which addresses the two conflicting objectives of minimizing the total route duration and maximizing the vector of coverage ratio during the RNA stage. Specifically, we extend the study by Hakimifar et al. [15] by investigating the impact of different levels of travel-time uncertainty on the Pareto frontier and the impact on route infeasibility. We apply robust optimization to tackle travel-time uncertainty.
3. Problem Definition
In Section 3.1, we describe the bi-objective SARP problem, starting with a brief description of the lexicographic maximin approach and its differences from the max–min approach. The lexicographic maximin approach and its bi-objective setting have been detailed in Hakimifar et al. [15] and we only provide a summary of this approach and the corresponding main definitions in this section. In Section 3.2, we describe the robust optimization approach adopted to address travel-time uncertainty.
3.1. Bi-Objective Lexicographic Maximin Approach to the SARP Model
Let us first differentiate the lexicographic maximin from the classic max–min approach in the SARP model. Let us recall that, within the SARP model proposed in [10], the goal is to evaluate the post-disaster conditions of different community groups, each carrying a distinct characteristic. The SARP ensures a balanced coverage of the selected characteristics by defining an objective that maximizes the minimum coverage ratio of the characteristics. This coverage ratio is obtained by dividing the number of times that the characteristic is observed by the total number of sites in the network with that characteristic [10]. The purpose of this objective is to ensure that each characteristic is observed at least once; furthermore, if time allows it, one characteristic can be observed multiple times [10]. In the SARP, there are assessment teams, with each having to complete its tour within the maximum allowed duration ().
In order to illustrate the max–min approach in the SARP, we consider three solutions, , and , to an SARP instance with six characteristics with the vectors of coverage ratio of (0.5, 0.5, 0.5, 0.5, 0.75, 0.25), (0.5, 0.75, 0.5, 0.5, 0.75, 0.5) and (0.75, 0.75, 0.5, 0.75, 0.75, 0.5), respectively. From a max–min perspective, provides better performance than , as it results in a higher minimum coverage ratio (i.e., 0.5 > 0.25). On the contrary, solutions and offer the same value of 0.5 for the least covered characteristics; thus, they are viewed as equal for the max–min objective. These two solutions, however, may be different from the perspective of decision makers in the field. Within the SARP, solutions with the same max–min value can result in different coverage ratios for characteristics that are not the least covered ones, which can lead to visiting extra sites. As stated by Balcik [10], visiting additional sites is helpful, since it improves the coverage ratio of at least one characteristic. Therefore, this paper applies the lexicographic maximin approach, which discriminates among solutions that provide the same minimum coverage ratio, to the SARP.
The lexicographic maximin refines the classic max–min approach such that two vectors of distinct values are compared [28]. Note that, in the max–min approach, we only compare two minimum numbers. To be able to apply the lexicographic maximin approach, the coverage ratios of a solution need to be sorted from the lowest to the highest and compared with the sorted values of the other solution. For instance, if we sort solutions and from the previous example, then solution dominates (in terms of lexicographic maximin approach), since it provides a higher coverage ratio in the third place of the sorted values.
We present the leximin ordering definition adopted by Bouveret and Lemaitre [29] as follows.
Definition 1 (Leximin ordering).
Let x and y denote two vectors in . Let and denote these same vectors where each element is rearranged in a non-decreasing order. According to the leximin ordering, the following hold:
- Vector x leximin-dominates y (written as ), if and only if , such that , = and >;
- x and y are indifferent (written as x y), if and only if = ;
- is the case where or x y.
Now, we focus on the bi-objective setting of the SARP, which aims to find the best trade-off between minimizing the total route duration and maximizing the vector of coverage ratio. The lexicographic ordering described above is used to compare solutions with respect to the vector of coverage ratio. This bi-objective problem is called leximin–SARP. The following Pareto optimality can be defined for leximin–SARP.
Definition 2 (Dominance and Pareto optimality in the leximin–SARP).
Let be the duration of solution s and = (, …, ) the vector of coverage ratio for solution s.
- Let s and represent two solutions of the leximin–SARP. Solution s dominates solution iff and , and either or . Solution s is a Pareto-optimal solution iff no other solutions dominate s.
3.2. Robust Optimization Approach to Deal with Uncertainty
As mentioned in Section 1, the uniqueness of each disaster makes it hard to find enough historical data to determine the probabilistic distributions of uncertain parameters. In this study, we apply the robust optimization approach with a box-uncertainty set, where the probabilistic distribution of the uncertain parameters is not required and the uncertain parameters vary in a given uncertainty set U.
The box-uncertainty set has the following two main advantages within the humanitarian-logistics scope: (i) It is based on the “worst-case-oriented” philosophy of robust optimization, which results in solutions that are feasible for “any” realizations of an uncertain parameter in a given uncertainty set U [9]. Constructing routes that are immunized against uncertain travel times is important, since infeasible solutions could cause delays in the dissemination of assessment findings, which can negatively affect the humanitarian response [6]. (ii) The box-uncertainty set is simpler to apply and understand than other uncertainty sets, such as the ellipsoidal set. It can also be modeled by making a few (implicit or explicit) assumptions. That is, in our problem, we can directly replace the travel-time parameters of each arc with their worst-case values. Easy-to-apply methods are encouraged within the humanitarian logistics literature [30].
We consider travel time as an uncertain parameter due to the post-disaster transportation conditions. We assume that, during the RNA stage, only an approximation of travel times is accessible, which can be estimated based on the magnitude of the disaster and the aerial data from satellites and drones [6]. The goal of the robust optimization approach is to guarantee that each team finishes its route within its maximum allowed duration (), such that the selected route is feasible for any realizations of the uncertain travel times within the estimated range. Appendix A provides the deterministic formulation of the bi-objective SARP. Since is the uncertain parameter in our model, we need to represent the robust counterpart of the uncertain equation. is represented by a range of estimated values, as follows:
where is the nominal value of travel time between nodes i and j, is the largest magnitude of the dispersion and represents the primitive uncertain parameter. In the box-uncertainty set, we can directly replace the travel-time parameters of each arc with their worst-case value, i.e., .
4. Solution Method
Heuristic optimization techniques, which are often developed in artificial-intelligence research, have been designed to overcome some of the difficulties of exact optimization procedures, such as computational time [31,32]. These algorithms are problem and model independent and most of them are efficient and flexible [31]. There are many different domains where metaheuristics have been applied as solution approaches, including but not limited to scheduling (e.g., [33,34]), transportation (e.g., [35,36]), sustainable transportation (e.g., [37,38]) and humanitarian logistics (e.g., [39,40]).
Leximin–SARP is an NP-hard problem; therefore, we apply the multi-directional local search method (MDLS) to solve the leximin–SARP as a bi-objective problem. MDLS is a metaheuristic method to solve multi-objective optimization problems. MDLS provides an approximation of Pareto-optimal solutions by generalizing the concept of local search to multiple objectives [23]. Hakimifar et al. [15] compared the performance of the MDLS method with methods previously applied to the SARP and showed that the designed MDLS finds the same max–min coverage ratio in most of the runs and, in some cases, a value that is even higher than the previously best-known value. To apply MDLS, for each objective, we use specific Adaptive Large Neighborhood Search (ALNS) operators, which are introduced and detailed in Hakimifar et al.’s [15] paper, to lead our search towards better solutions. We briefly describe the framework of MDLS in Section 4.1 and its components in Section 4.2.
4.1. Multi-Directional Local Search
MDLS extends the concept of single-objective local search to multiple objectives [23]. In particular, the MDLS algorithm starts with an initial non-dominated set F of solutions. At every iteration, a solution x is randomly selected from F, then new solutions are generated by performing single-objective local search from x for each objective considered. New solutions generated this way are used to update F, thus filtering out solutions that are found to be dominated. In this work, as in the original MDLS work, we use ALNS to perform single-objective local search. To apply MDLS to the leximin–SARP as a bi-objective problem, specific ALNS operators need to be defined for each objective, i.e., minimizing the total route duration and maximizing the leximin value. Algorithm 1 provides a high-level overview of the MDLS procedure, where represents a parametric ALNS algorithm for objective k. F is a set of initial solutions which is preserved and updated via the solution process.
| Algorithm 1 High-level overview of the MDLS procedure proposed by Tricoire [23]. |
1: pre-condition: F is a non-dominated set 2: repeat 3: select a solution 4: 5: 6: 7: until timeLimit is reached 8: return F |
4.2. ALNS Operators
ALNS has been proven to be an effective method for solving various routing problems [41,42,43]. As mentioned above, to apply the MDLS algorithm to the leximin–SARP, we need to develop two ALNS operators, i.e., one for each objective. Then, for each objective, at each iteration, a destroy operator and a repair operator are randomly chosen from the list of operators designed for that objective to generate a new solution. For each ALNS, we use the following destroy and repair operators defined by Hakimifar et al. [15]. Below, we briefly explain these operators for each objective.
4.2.1. Total-Route-Duration Objective Operators
For the total-route-duration objective, we apply some of the well-defined, classical ALNS destroy and repair operators that are designed for the VRP with the single objective of travel-time minimization (e.g., Pisinger and Ropke [44]). Specifically, we use random removal, worst removal and related removal as the removal operators. As for the repair operators, we use the cheapest insertion heuristic and the k-regret heuristic for k = 2 and 3.
4.2.2. Leximin Objective Operators
The following two destroy operators are applied for the leximin objective:
- Random removal: q sites are selected randomly to be removed;
- Worst min removal: q sites with the lowest contribution to the solution’s minimum coverage ratio are selected to be removed.
The following two repair operators are applied for the leximin objective:
- Highest max–min insertion: for this operator, we first insert the site with the highest contribution to the max–min value of the current solution;
- Highest Leximin insertion: this operator differs from the previous one in that we first insert the site with the highest contribution to the vector of coverage ratio (leximin objective) of the current solution.
We automatically adjust the weights of the defined operators based on their success rates. That is, we calculate the number of times the use of each operator brings about an update in the set of non-dominated solutions and assign its weight accordingly. This approach is based on the adaptive weight adjustment described by Ropke and Pisinger [42].
5. Computational Results
We implemented the designed MDLS algorithm in C++ and using a 64-bit Windows Server with two 2.3 GHz Intel Core CPUs and 12 GB RAM. The descriptions of the instances and parameter settings are presented in Section 5.1 and Section 5.2, respectively. In Section 5.3, we provide the non-dominated set of solutions obtained using the MDLS algorithm at different uncertainty levels for different instances. In Section 5.4, we discuss the value of robustness in terms of the infeasibility of the solutions.
5.1. Instance Description
In the computational experiments, we used the instances provided by Balcik [10], including 25, 50, 75 and 100 nodes with 12 characteristics. Balcik [10] modified Solomon’s 100-node random (R) and random-clustered (RC) instances to generate these instances. Table 1 presents the detail of the instances, including the maximum allowed route duration for each team () and the number of assessment teams (K). We ran our algorithm 10 times for each instance with the time limit mentioned in Table 1 for each uncertainty level (i.e., 0.1, 0.2, 0.3 and 0.6). We here report the union of the non-dominated sets obtained by MDLS within 10 runs per instance as the final Pareto-front approximation.

Table 1.
The SARP instances used in our computational study. represents the number of sites in each instance, the type of network (R or RC), number of teams and the maximum allowed duration for each route. The time limit column shows the run time for each cluster of instances in seconds.
5.2. Parameter Settings
Table 2 shows the parameters used in the MDLS algorithm. Note that, in this table, M represents the number of sites in the current solution. Regarding the weights of the operators, as explained by Ropke and Pisinger [42], we divided the entire search into a number of segments, each with 100 MDLS runs, and adjusted the weights based on the success rate of the operators.
Table 2.
Parameters used in the MDLS algorithm.
5.3. Pareto-Front Approximation at Different Levels of Uncertainty
Let us recall that the aim of solving a bi-objective problem and obtaining the set of non-dominated solutions is to provide decision makers with a range of solutions (options) that differ in terms of the total route duration (speed of assessment) and the vector of community coverage ratio (quality of assessment). To further diversify the range of options for decision makers, we capture another critical assumption during the RNA stage by providing the set of non-dominated solutions at different levels of travel-time uncertainty (i.e., 10% or 20% dispersion in the nominal data).
Figure 1 and Figure 2 provide a graphical representation of the non-dominated set of solutions returned by the MDLS algorithm at different uncertainty levels for the instances R8 and RC12. In these figures, the horizontal axis shows the total route duration and the vertical axis represents the minimum coverage ratio. Note that there are several points in the two-dimensional visualization with the same minimum coverage ratio that are indeed different in terms of leximin values, i.e., they have different vectors of coverage ratio. Therefore, we need complete information regarding the total route duration and vector of coverage ratio to interpret such two-dimensional figures. Please see Appendix B for similar two-dimensional visualizations of various SARP instances.
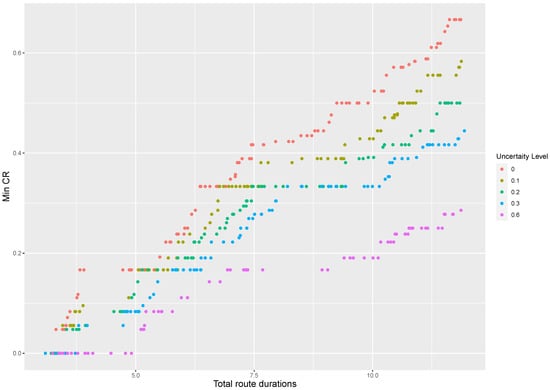
Figure 1.
Two-dimensional visualization of non-dominated solutions at different levels of travel-time uncertainty for instance R8.
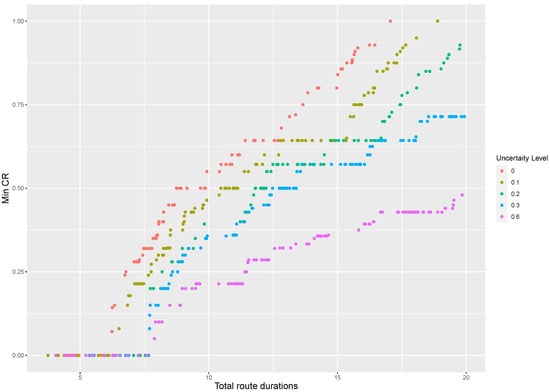
Figure 2.
Two-dimensional visualization of non-dominated solutions at different levels of travel-time uncertainty for instance RC12.
Figure 1 and Figure 2 show that, by increasing the level of uncertainty, the Pareto front shifts towards solutions with greater route duration and fewer vectors of coverage ratio. In other words, robustness comes at a cost and it yields a more conservative solution with a worse objective function value than the deterministic approach (i.e., ). The value of the robust optimization approach is to guarantee that each assessment team finishes its tour within its maximum allowed duration, such that this tour is feasible for any realizations of the uncertain travel times within an estimated range.
5.4. Trade-Off between Infeasibility and Solution Quality
In routing problems, the concept of route infeasibility may not be as straightforward for humanitarian practitioners as it is for academicians; therefore, in this section, we analyze route infeasibility in more detail. We share the opinion expressed by Balcik and Yanıkoğlu [6], whereby infeasible solutions could create delays in the dissemination of assessment findings, which can affect the performance of the disaster response. Nevertheless, the level of infeasibility is also important, as it may vary from very small to considerable violations of the maximum allowed duration (). In order to assist decision makers in better analyzing route infeasibility, we used a Monte Carlo simulation that tested the average performance of the deterministic and robust approaches in terms of route infeasibility. To this end, we took two instances, RC5 and R7, as illustrative examples. We assumed that the uncertain travel time of each arc (i, j) varied in an interval , where is the nominal travel time and specifies the size of the interval as the percentage of the nominal data. We randomly sampled 100 instances for each and for each of the two instances and calculated the average performance of the nominal and robust approaches. Table 3 presents the percentage of infeasible solutions obtained on average with the deterministic and the robust approaches.
Table 3.
Percentage of infeasible solutions for deterministic and robust approaches (average of 100 simulation runs).
As we can see in Table 3, by increasing the level of uncertainty, more solutions become infeasible. An infeasible solution is a solution that has at least one route that exceeds . However, as mentioned above, route infeasibility in deterministic settings can vary from small to large violations of . To illustrate this, Figure 3 and Figure 4 show the histogram of the average violation of the solutions within the 100 simulation runs as a percentage of . For instance, when the level of uncertainty () is 0.1, most violations are less than 5 percent of . Therefore, at lower uncertainty levels, decision makers may decide to stick with the nominal values of travel time (deterministic approach), which would result in a higher coverage ratio. In this case, they would need to take the risk of a slight violation of the allowed time, which can happen in worse-case scenarios. However, at higher uncertainty levels, the risk of having a significant violation of is considerable, which increases the motivation to have a robust plan. To illustrate this, let us assume that the time unit of is based on days of 10 h of work for each assessment team. In this case, the violation of 30% in instance RC5 (where h) means that we have 9 h of delay in the assessment processes, which may negatively affect the disaster response program.
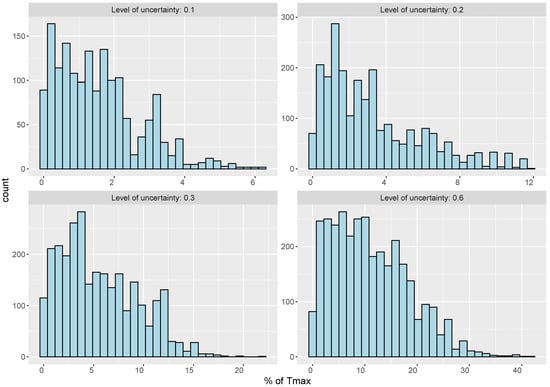
Figure 3.
Histogram of violation amount of infeasible solutions in % of Tmax (average of 100 simulation runs)—instance RC5.
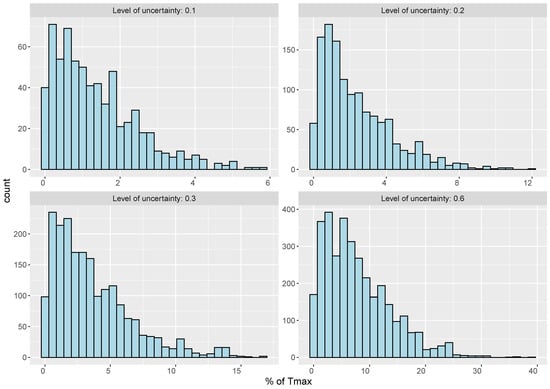
Figure 4.
Histogram of violation amount of infeasible solutions in % of Tmax (average of 100 simulation runs)—instance R7.
6. Conclusions
In this study, we focus on field-visit planning during the RNA stage, during which assessment teams visit a subset of affected sites in order to evaluate the immediate needs of various community groups. Building on previous studies, we further develop this topic by considering the uncertainty of travel times during the RNA stage within the bi-objective setting. In particular, we solve the bi-objective optimization problem of minimizing the total route duration and maximizing the vector of coverage ratio at different levels of uncertainty. We apply the MDLS algorithm to provide an approximation of the Pareto set for the leximin–SARP. We consider travel time as an uncertain parameter, since it is highly possible that the transportation network becomes disrupted immediately after the occurrence of a disaster. We apply the robust optimization approach to tackle uncertainty. Robust optimization does not require probabilistic information about the uncertain parameters and immunizes a feasible solution under all possible realizations.
We assist decision makers by providing the set of non-dominated solutions that differ in terms of the total route duration and vector of community coverage ratio at different levels of travel-time uncertainty. We further analyze route infeasibility in detail, since from the practitioners’ point of view, it may be reasonable to ignore slight violations of the maximum allowed duration to achieve a higher coverage ratio instead. However, we show that, at higher uncertainty levels, it is more reasonable to rely on robust routes, as infeasibility leads to a significant violation of the specified time, which can negatively affect the assessment process.
In this study, we only consider the travel time between sites as an uncertain parameter. Future studies could consider other aspects, such as community-group characteristics, as uncertain parameters in their optimization models. Moreover, in this study, we assume that the assessment teams decide on their field visits at the beginning of the planning horizon and stick with this static plan due to a lack of advanced communication tools. Future studies could focus on the settings where advanced communication tools are available in the field, allowing assessment teams to dynamically update their original plan.
Author Contributions
Conceptualization, M.H., V.C.H. and F.T.; methodology, M.H., V.C.H. and F.T.; software, M.H.; validation, M.H., V.C.H. and F.T.; investigation, M.H., V.C.H. and F.T.; writing—original draft preparation, M.H.; writing—review and editing, M.H., V.C.H. and F.T.; visualization, M.H.; supervision, V.C.H. and F.T. All authors have read and agreed to the published version of the manuscript.
Funding
This research study received no external funding.
Institutional Review Board Statement
Not applicable.
Informed Consent Statement
Not applicable.
Data Availability Statement
All data used in this paper are referenced in the article.
Acknowledgments
The authors would like to thank Burcu Balcik for providing the data.
Conflicts of Interest
The authors declare no conflict of interest.
Appendix A
The model below is the mathematical formulation of the SARP proposed by Balcik [10]. See Balcik [10] for detailed information. We made a slight modification of the original model by adding the second objective, which minimizes the total route duration. Note that the set of characteristics of a site refers to its geographical aspects (e.g., topography and altitude), demographical aspects (e.g., age and gender), socio-economical aspects (e.g., economic activity and literacy) and socio-cultural aspects (e.g., ethnicity and language) [3,10].
The following notation is used to formulate the modified SARP model.
Sets/indices:
- N = set of sites in the affected sites indexed by i, j∈
- = N∪ where is the depot
- K = set of assessment teams indexed by k∈K
- C = set of characteristics indexed by c∈C
Parameters:
- = takes the value 1 if node carries characteristic and 0 otherwise
- = total number of sites that carry characteristic
- = travel time between nodes i and j
- = total available time for each team
Decision Variables:
- = 1 if team k visits site j after site i and 0 otherwise
- = 1 if team k visits site i and 0 otherwise
- = sequence in which site i is visited
- Z = minimum expected coverage ratio
Mathematical formulation:
The first objective function (A1) maximizes the minimum coverage ratio, which is defined by constraint (A3). The second objective function (A2) minimizes the total route duration. Constraints (A4) and (A5) guarantee that an arc enters and leaves the depot and each selected site. Constraint (A6) guarantees that each site is visited at most once. Constraint (A7) controls the number of routes according to the available number of assessment teams. Constraint (A8) ensures that each route is finished within the allowed duration. Constraint (A9) is for eliminating subtours. Constraints (A10)–(A13) define the domains of the variables.
Appendix B
In this section, we provide a two-dimensional visualization of the non-dominated solutions at different levels of travel-time uncertainty for different instances of the SARP. The horizontal axis shows the total route duration and the vertical axis represents the minimum coverage ratio.

Figure A1.
Two-dimensional visualization of non-dominated solutions at different levels of travel-time uncertainty for instances (a) R8, (b) RC11, (c) R13 and (d) RC14.
Figure A1.
Two-dimensional visualization of non-dominated solutions at different levels of travel-time uncertainty for instances (a) R8, (b) RC11, (c) R13 and (d) RC14.


Figure A2.
Two-dimensional visualization of non-dominated solutions at different levels of travel-time uncertainty for instances (a) R20, (b) RC23, (c) R6 and (d) RC5.
Figure A2.
Two-dimensional visualization of non-dominated solutions at different levels of travel-time uncertainty for instances (a) R20, (b) RC23, (c) R6 and (d) RC5.


References
- PAHO. Humanitarian Supply Management and Logistics in the Health Sector; Pan American Health Organization: Washington, DC, USA, 2001. [Google Scholar]
- IFRC. Guidelines for Assessment in Emergencies, Geneva, Switzerland. 2008. Available online: https://www.icrc.org/en/doc/assets/files/publications/icrc-002-118009.pdf (accessed on 28 June 2020).
- ACAPS. Technical Brief: Purposive Sampling and Site Selection in Phase 2. 2011. Available online: https://www.humanitarianresponse.info/sites/www.humanitarianresponse.info/files/documents/files/Purposive_Sampling_Site_Selection_ACAPS.pdf (accessed on 28 June 2020).
- Arii, M. Rapid assessment in disasters. Jpn. Med. Assoc. J. 2013, 56, 19–24. [Google Scholar]
- Zissman, M.; Evans, J.; Holcomb, K.; Jones, D.; Kercher, M.; Mineweaser, J.; Schiff, A.; Shattuck, M.; Gralla, E.; Goentzel, J.; et al. Development and use of a comprehensive humanitarian assessment tool in post-earthquake haiti. Procedia Eng. 2014, 78, 10–21. [Google Scholar] [CrossRef][Green Version]
- Balcik, B.; Yanıkoğlu, I. A robust optimization approach for humanitarian needs assessment planning under travel time uncertainty. Eur. J. Oper. Res. 2020, 282, 40–57. [Google Scholar] [CrossRef]
- Ben-Tal, A.; Nemirovski, A. Selected topics in robust convex optimization. Math. Program. 2008, 112, 125–158. [Google Scholar] [CrossRef]
- Ben-Tal, A.; El Ghaoui, L.; Nemirovski, A. Robust Optimization; Princeton University Press: Princeton, NJ, USA, 2009. [Google Scholar]
- Bertsimas, D.; Brown, D.B.; Caramanis, C. Theory and applications of robust optimization. SIAM Rev. 2011, 53, 464–501. [Google Scholar] [CrossRef]
- Balcik, B. Site selection and vehicle routing for post-disaster rapid needs assessment. Transp. Res. Part E Logist. Transp. Rev. 2017, 101, 30–58. [Google Scholar] [CrossRef]
- Pamukcu, D.; Balcik, B. A multi-cover routing problem for planning rapid needs assessment under different information-sharing settings. OR Spectrum 2020, 42, 1–42. [Google Scholar] [CrossRef]
- Li, X.; Liu, X.; Ma, H.; Hu, S. Integrated routing optimization for post-disaster rapid-detailed need assessment. Int. J. Gen. Syst. 2020, 49, 521–545. [Google Scholar] [CrossRef]
- Bruni, M.; Khodaparasti, S.; Beraldi, P. The selective minimum latency problem under travel time variability: An application to post-disaster assessment operations. Omega 2020, 92, 102154. [Google Scholar] [CrossRef]
- Hakimifar, M.; Balcik, B.; Fikar, C.; Hemmelmayr, V.; Wakolbinger, T. Evaluation of field visit planning heuristics during rapid needs assessment in an uncertain post-disaster environment. Ann. Oper. Res. 2021, 1–42. [Google Scholar] [CrossRef]
- Hakimifar, M.; Hemmelmayr, V.; Tricoire, F. A lexicographic maximin approach to the selective assessment routing problem. arXiv 2022, arXiv:2201.09599. [Google Scholar]
- Ogryczak, W. On the lexicographic minimax approach to location problems. Eur. J. Oper. Res. 1997, 100, 566–585. [Google Scholar] [CrossRef]
- Liu, S.; Papageorgiou, L.G. Multiobjective optimisation of production, distribution and capacity planning of global supply chains in the process industry. Omega 2013, 41, 369–382. [Google Scholar] [CrossRef]
- Bertsimas, D.; Lulli, G.; Odoni, A. The air traffic flow management problem: An integer optimization approach. In Proceedings of the International Conference on Integer Programming and Combinatorial Optimization, Bertinoro, Italy, 26–28 May 2008; pp. 34–46. [Google Scholar]
- Nace, D.; Orlin, J.B. Lexicographically minimum and maximum load linear programming problems. Oper. Res. 2007, 55, 182–187. [Google Scholar] [CrossRef]
- Ogryczak, W.; Pióro, M.; Tomaszewski, A. Telecommunications network design and max-min optimization problem. J. Telecommun. Inf. Technol. 2005, 3, 43–56. [Google Scholar]
- Saliba, S. Heuristics for the lexicographic max-ordering vehicle routing problem. Cent. Eur. J. Oper. Res. 2006, 14, 313–336. [Google Scholar] [CrossRef]
- Lehuédé, F.; Péton, O.; Tricoire, F. A lexicographic minimax approach to the vehicle routing problem with route balancing. Eur. J. Oper. Res. 2020, 282, 129–147. [Google Scholar] [CrossRef]
- Tricoire, F. Multi-directional local search. Comput. Oper. Res. 2012, 39, 3089–3101. [Google Scholar] [CrossRef]
- Rath, S.; Gendreau, M.; Gutjahr, W.J. Bi-objective stochastic programming models for determining depot locations in disaster relief operations. Int. Trans. Oper. Res. 2016, 23, 997–1023. [Google Scholar] [CrossRef]
- Gao, X.; Cao, C. Multi-commodity rebalancing and transportation planning considering traffic congestion and uncertainties in disaster response. Comput. Ind. Eng. 2020, 149, 106782. [Google Scholar] [CrossRef]
- Kimms, A.; Maiwald, M. Bi-objective safe and resilient urban evacuation planning. Eur. J. Oper. Res. 2018, 269, 1122–1136. [Google Scholar] [CrossRef]
- Samani, M.R.G.; Torabi, S.A.; Hosseini-Motlagh, S.M. Integrated blood supply chain planning for disaster relief. Int. J. Disaster Risk Reduct. 2018, 27, 168–188. [Google Scholar] [CrossRef]
- Dubois, D.; Fargier, H.; Prade, H. Refinements of the maximin approach to decision-making in a fuzzy environment. Fuzzy Sets Syst. 1996, 81, 103–122. [Google Scholar] [CrossRef]
- Bouveret, S.; Lemaitre, M. Computing leximin-optimal solutions in constraint networks. Artif. Intell. 2009, 173, 343–364. [Google Scholar] [CrossRef]
- Gralla, E.; Goentzel, J. Humanitarian transportation planning: Evaluation of practice-based heuristics and recommendations for improvement. Eur. J. Oper. Res. 2018, 269, 436–450. [Google Scholar] [CrossRef]
- Rao, R.V. Jaya: An Advanced Optimization Algorithm and Its Engineering Applications; Springer: Berlin/Heidelberg, Germany, 2019. [Google Scholar]
- Potvin, J.Y.; Gendreau, M. Handbook of Metaheuristics; Springer: Berlin/Heidelberg, Germany, 2018. [Google Scholar]
- Jarboui, B.; Siarry, P.; Teghem, J. Metaheuristics for Production Scheduling; John Wiley & Sons: Hoboken, NJ, USA, 2013. [Google Scholar]
- Theophilus, O.; Dulebenets, M.A.; Pasha, J.; Lau, Y.Y.; Fathollahi-Fard, A.M.; Mazaheri, A. Truck scheduling optimization at a cold-chain cross-docking terminal with product perishability considerations. Comput. Ind. Eng. 2021, 156, 107240. [Google Scholar] [CrossRef]
- Hemmelmayr, V.C.; Cordeau, J.F.; Crainic, T.G. An adaptive large neighborhood search heuristic for two-echelon vehicle routing problems arising in city logistics. Comput. Oper. Res. 2012, 39, 3215–3228. [Google Scholar] [CrossRef]
- Pasha, J.; Dulebenets, M.A.; Kavoosi, M.; Abioye, O.F.; Wang, H.; Guo, W. An optimization model and solution algorithms for the vehicle routing problem with a “factory-in-a-box”. IEEE Access 2020, 8, 134743–134763. [Google Scholar] [CrossRef]
- Erdoğan, S.; Miller-Hooks, E. A green vehicle routing problem. Transp. Res. Part E Logist. Transp. Rev. 2012, 48, 100–114. [Google Scholar] [CrossRef]
- Koç, Ç.; Bektaş, T.; Jabali, O.; Laporte, G. The impact of depot location, fleet composition and routing on emissions in city logistics. Transp. Res. Part B Methodol. 2016, 84, 81–102. [Google Scholar] [CrossRef]
- Özdamar, L.; Ertem, M.A. Models, solutions and enabling technologies in humanitarian logistics. Eur. J. Oper. Res. 2015, 244, 55–65. [Google Scholar] [CrossRef]
- Doerner, K.F.; Gutjahr, W.J.; Nolz, P.C. Multi-criteria location planning for public facilities in tsunami-prone coastal areas. OR Spectrum 2009, 31, 651–678. [Google Scholar] [CrossRef]
- Shaw, P. Using constraint programming and local search methods to solve vehicle routing problems. In Proceedings of the International Conference on Principles and Practice of Constraint Programming, Pisa, Italy, 26–30 October 1998; pp. 417–431. [Google Scholar]
- Ropke, S.; Pisinger, D. An adaptive large neighborhood search heuristic for the pickup and delivery problem with time windows. Transp. Sci. 2006, 40, 455–472. [Google Scholar] [CrossRef]
- Pisinger, D.; Ropke, S. Large neighborhood search. In Handbook of Metaheuristics; Springer: Berlin/Heidelberg, Germany, 2019; pp. 99–127. [Google Scholar]
- Pisinger, D.; Ropke, S. A general heuristic for vehicle routing problems. Comput. Oper. Res. 2007, 34, 2403–2435. [Google Scholar] [CrossRef]


Publisher’s Note: MDPI stays neutral with regard to jurisdictional claims in published maps and institutional affiliations. |
© 2022 by the authors. Licensee MDPI, Basel, Switzerland. This article is an open access article distributed under the terms and conditions of the Creative Commons Attribution (CC BY) license (https://creativecommons.org/licenses/by/4.0/).