Article

Territorializing and Monitoring of Sustainable Development Goals in Italy: An Overview

by
Anna Richiedei
1,2,* and
Michele Pezzagno
1,3
1
Department of Civil, Environmental, Architectural Engineering and Mathematics—DICATAM, University of Brescia, Via Branze 43, 25123 Brescia, Italy
2
The Board of the Lombardy Regional Center of Urban Studies (CeRSUL), 20124 Milano, Italy
3
The University Research and Documentation Center for the 2030 Sustainable Development Agenda (CRA 2030), Steering Committee, University of Brescia, Via Branze 43, 25123 Brescia, Italy
*
Author to whom correspondence should be addressed.
Sustainability 2022, 14(5), 3056; https://doi.org/10.3390/su14053056
Submission received: 28 January 2022 / Revised: 28 February 2022 / Accepted: 1 March 2022 / Published: 5 March 2022

Abstract

:
The 2030 Agenda defined 17 Sustainable Development Goals (SDGs) divided into 169 targets, applicable everywhere and based on the “No one left behind” principle. Goals and indicators to measure the achievement of the 2030 Agenda have to be localized. The paper presents the Italian current evolution of the territorialization of the SDGs, starting from the global level up to the local one, and wonders if the implementation of the 2030 Agenda takes concrete form with the quantitative monitoring of the SDGs at the local level (municipalities and not only capitals). A comparison among indicators proposed at different levels is set by using an ad hoc comparative reading grid. The analysis highlights that, in Italy, the principle barriers in the territorialization of the SDGs are the lack of data open sources, the proposal of new not adequately validated metrics by institutional/non-institutional subjects and the progressive loss of relationship with Global indicator framework and targets of the 2030 Agenda. The strategies needed to reach sustainable development are obviously site-specific, but we need to maintain common metrics in measuring performances in relation to the 2030 Agenda. In the Global indicator framework for the Sustainable Development Goals and targets of the 2030 Agenda for Sustainable Development, it is possible to find indicators suitable to measure performances at the local level—albeit in a smaller numbers—but in Italy, there is no awareness about this. Italy is completely losing both the opportunity to compare the results of the effort performed by the Municipalities in a rigorous way and the possibility to use strong metrics to support decision-makers’ policies for the future.

1. Introduction

On 25 September 2015, the governments of the 193 UN member countries, including Italy, signed the adoption of a global Agenda for post-2015 development: the 2030 Agenda for Sustainable Development [1]. Officially entered into force on 1 January 2016, the 2030 Agenda is the new reference framework for development that follows the Millennium Development Goals (MDGs). The United Nations Millennium Declaration was signed by 189 Heads of State and Government on 20 September 2000, through which the 8 Millennium Goals to be achieved by 2015 were adopted. These first Agenda Goals defined the priorities for action of national cooperation, gave a time limit (2015) and provided for constant measurement and verification of the progress made (https://www.un.org/millenniumgoals/, accessed on 27 January 2022). The following 2030 Agenda is a path for the global community towards sustainable development defined in an ambitious “plan of action for people, the planet and prosperity” [1], which promotes a common and integrated approach to numerous and complex social, economic and environmental challenges that present and future generations have to face. Poverty, illiteracy, economic inequality, gender inequality, humanitarian crises, overexploitation of resources and climate crisis are deeply interconnected problems and, as such, cannot be addressed separately or even by some countries alone. To this end, the 2030 Agenda has defined 17 Sustainable Development Goals (SDGs) [2] divided into 169 targets, interconnected, indivisible and potentially applicable everywhere—globally, nationally and locally (at regional or urban level) in order that no one will be left behind.
The areas of intervention of the 17 Objectives can be grouped into five fundamental principles, the so-called “5P” [1]:
  • People—Eliminate hunger and poverty in all forms, guarantee dignity and equality for all human beings;
  • Planet—Protect the planet’s natural resources and climate for future generations;
  • Prosperity—Ensure prosperous and fulfilling lives in harmony with nature);
  • Pace—Promote peaceful, just and inclusive societies which are free from fear and violence;
  • Partnership—Implement the 2030 Agenda through solid partnerships.
All countries are called to define their sustainable development strategy that allows them to achieve the objectives set, communicating the accomplished results within a process coordinated by the UN (New York, NY, USA). Through the activities of the High-Level Political Forum on Sustainable Development (HLPF) (central element of the United Nations for follow-up and review of the strategies implemented by the member states to achieve the 2030 Agenda and the Sustainable Development), each year the progress and results of the political actions of all members of the United Nations are evaluated [3]. Every four years, however, in the UN General Assembly and in the presence of Heads of State and Government, a debate is held on the implementation of the 2030 Agenda. With just over ten years left to reach the SDGs, during the last HLPF summit, which took place in September 2019, there was a strong delay in the pursuit of some objectives, both in the environmental and social and economic fields [4]. The UN and the world leaders have therefore launched a “Decade of action”, calling for accelerated solutions to respond to the world’s greatest challenges. UN Secretary-General António Guterres called on all components of society to mobilize for change: from the world leaders to coordinate global action, to the local leaders to define national, regional and city policies and strategies, to the entire world population [5]. One of the key concepts of the 2030 Agenda is to have “no one left behind”. It suggests that every single human being should become an active partner in the implementation and realization of the global agreement. To this end, it is not possible to disregard the international strategy first of all at the European and national level, then moving on to the sub-regional level and so on.
As is known, between 1950 and 2018, a rapid urbanization process led the world population living in urban centers to increase by about 25%, going from 29.5% to 55.3% [6]. World Bank (Washington, DC, USA) data show that, in 2019, 74.7% of the European population and 70.7% of the Italian population lived in urban areas [7]. However, urban growth is expected to slow down: 68% of the population worldwide is expected to live in cities by 2050 [6]. Rapid urban growth is an important opportunity, but also a great challenge for achieving the Goals of Sustainable Development, especially for the achievement of Agenda Goal 11, “Make cities and human settlements inclusive, safe, resilient and sustainable” [2]. Although cities play a fundamental role as an engine of the economy, as a hub of services, creativity and innovation, and as a training ground for sociality. Many of the major global challenges derive from them [8]. Income inequality and consequent inequality (Goals 1, 4, 5, 8 and 10), segregation and social exclusion (Goal 1), air pollution (Goal 13) and water (Goals 6 and 14), noise pollution and light, the overexploitation of resources (Goals 7, 8 and 12) and the overproduction of waste (Goal 12), the fragmentation of the territory and the degradation of countless ecosystems (Goal 15) are just some of the effects of urbanization, many of the which extend and have repercussions far beyond the city limits. The process of transition and sustainable development cannot ignore local policies [8]. Already in 2012, the UN Secretary-General, Ban Ki-moon, recognized that, in a rapidly urbanized world such as ours, “our struggle for global sustainability will be won or lost in cities” [9].
The importance given at the international level to the territorialization of the Sustainable Development Goals is expressed also, and above all, through the promotion of Voluntary Local Reviews (VLR): documents in which local governments share their experience of territorialization of the indicators to measure the achievement of the 2030 Agenda Goals. Although the 2030 Agenda Goals are global, the targets are related to the responsibilities of local governments, especially their ability to provide basic services to citizens. The “localization” of the 2030 Agenda Goals is a complex action, which involves a plurality of actors. To support governments and local administrations in the process of territorialization of the SDGs, Global Taskforce of Local and Regional Governments, UNDP and UN-Habitat have drawn up a roadmap [10] in which they describe this process with four steps:
  • Awareness-raising (getting to know the SDGs at subnational level);
  • Advocacy (including a subnational perspective in national SDG strategies);
  • Implementation (SDGs target become local);
  • Monitoring (evaluating and learning from experiences).
There is a research gap on the territorialization of SDGs; as a matter of fact, few publications face this theme, and they are mainly focused on region or capital cities; none focuses on SDG-indicator monitoring at local level for medium and small municipalities.
Some authors try to better understand the mission and the vision of Italian metropolitan city plans in relation to the 2030Agenda [11]. The most relevant references about territorialization of SDGs monitoring are related to single communities (very small as Forrest in Australia with 450 inhabitants [12]; a regional capital city in Sweden [13]) region or group of capitals (Deqing County in China [14], national capital cities in Europe [15], Pacific Islands [16] and provincial capital cities in Italy [17]), civil participation (civic participation and consumers’ rights [18] and citizen observatories [19]) and integration of SDG into strategic planning and management [20]. For the Italian context the most important one is the paper of Farnia et.al [17] elaborated from the same research group of report “For a Sustainable Italy: SDGs City Index” cited in material and methods paragraph [21].
There is increasing awareness of the importance of SDG localization [12,15,16] in terms of strategy and policy, but a total lack of attention on the methodology used to monitor them: “Several researchers have raised related concerns connected to the gap between policy and implementation and that sustainability efforts lead to little change” [13] (see References [22,23,24,25,26]). One reason hypothesized in this paper is that the information related to the use of correct metrics at the local level is undervalued. Moreover, the coherence with the supra-local-level strategies is missing, and when there is a tentative rigorous methodology, the the open-source databases are not always easily available and user-friendly. The result is that most of the information present in the local monitoring is absolutely self-referential and characterized by poor data collected by using poor protocols, and they are not statistical based.
The paper, therefore, aims to clarify the current evolution of the territorialization of the SDGs targets in Italy. Critical issues in using different methodologies in collecting indicators to monitor the same phenomena from the subnational level up to the local one are be investigated. The case study also deepens the situation related to Lombady Region.
The main research questions are as follows: Does the implementation of the 2030 Agenda take concrete form with the quantitative monitoring of the SDGs at the local level? Are local institutions strong enough politically to withstand the pressure deriving from the use of EU metrics to evaluate the outcomes of sustainability actions?
The paper tries to analyze the ways in which the territorialization of the monitoring indicators of the achievement of the SDGs takes place at the different territorial levels across the Nomenclature of Territorial Units for Statistics—NUTSs (from over NUTS 1 to under NUTS3).

2. Materials and Methods

Given what is explained in the Introduction, the materials useful for research are not scientific papers, but mainly official reports of the bodies that deal with SDGs. The materials used for the territorialization of the SDGs through indicators are organized according to the territorial level (Table 1). In Italy, the official body in charge for SDGs metrics is the National Institute of Statistics (Istat, Rome, Italy), but, as a matter of fact, other bodies are also involved in sub-regional monitoring action:
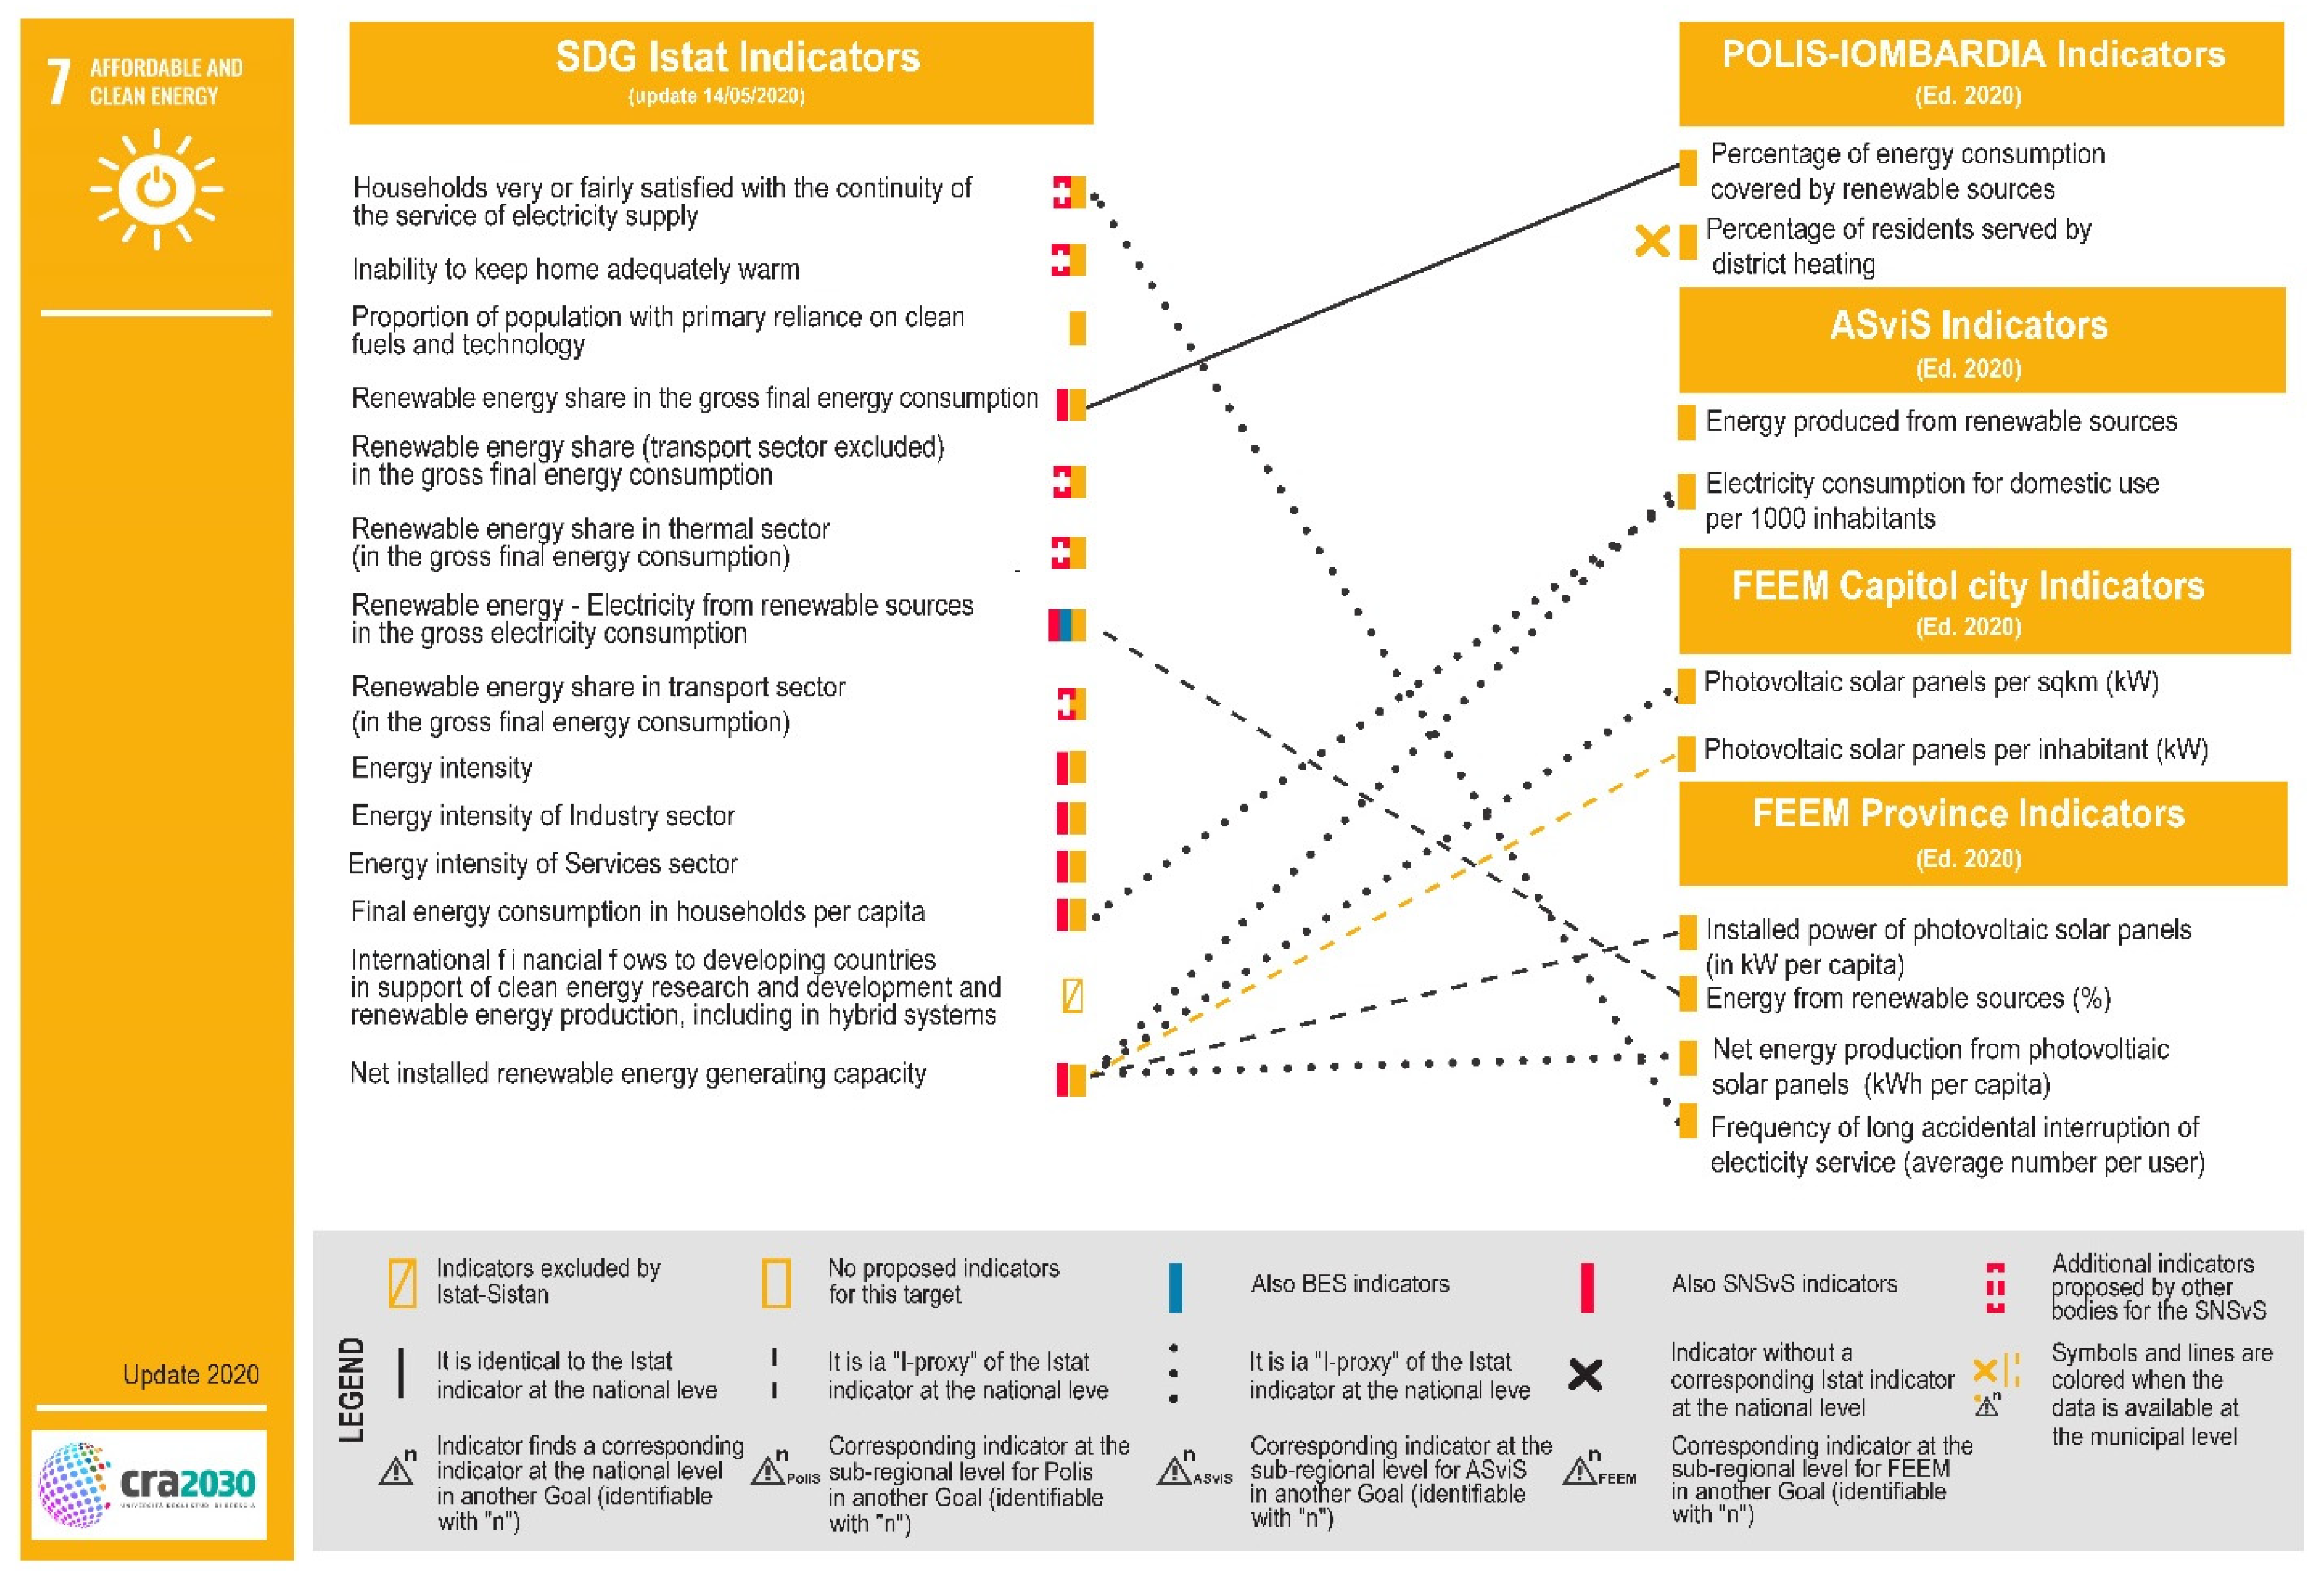
  • PoliS-Lombardi is a Regional Institute (Milan, Italy) for the support of Lombardy’s policies and it is the subject in charge to monitor the Regional Strategy on Sustainable Development commissioned by Region Lombardy. In its annual regional report (2019 and 2020) [27,28] PoliS proposes also sub-regional metrics;
  • Italian Alliance for Sustainable Development (ASviS, Rome, Italy) brings together more than 300 member organizations among the most important civil society institutions and networks, and it aims to raise the awareness of the Italian society, economic stakeholders and institutions about the importance of the 2030 Agenda for Sustainable Development, and to mobilize them to pursue the SDGs [29]. Every year, ASviS presents the monitoring results to the Ecological Transition Ministry;
  • Eni Enrico Mattei Foundation (FEEM, Milan, Italy) is a non-profit policy-oriented international research center and a think-tank that produces high-quality, innovative, interdisciplinary and scientifically sound research on sustainable development [30].
The downscaling of the metrics used from the global, European and national levels can be performed through a direct comparison among indicators. The sets of indicators can in fact be compared one by one, as the source and the set are unique. The situation in relation to national and sub-national levels is more complex, because, as already told, different metrics have been introduced. The sets of indicators to be compared are one too many. Therefore, a reading grid, based on the following analyzing criteria, was introduced to understand the interlinkages among the proposed metrics:
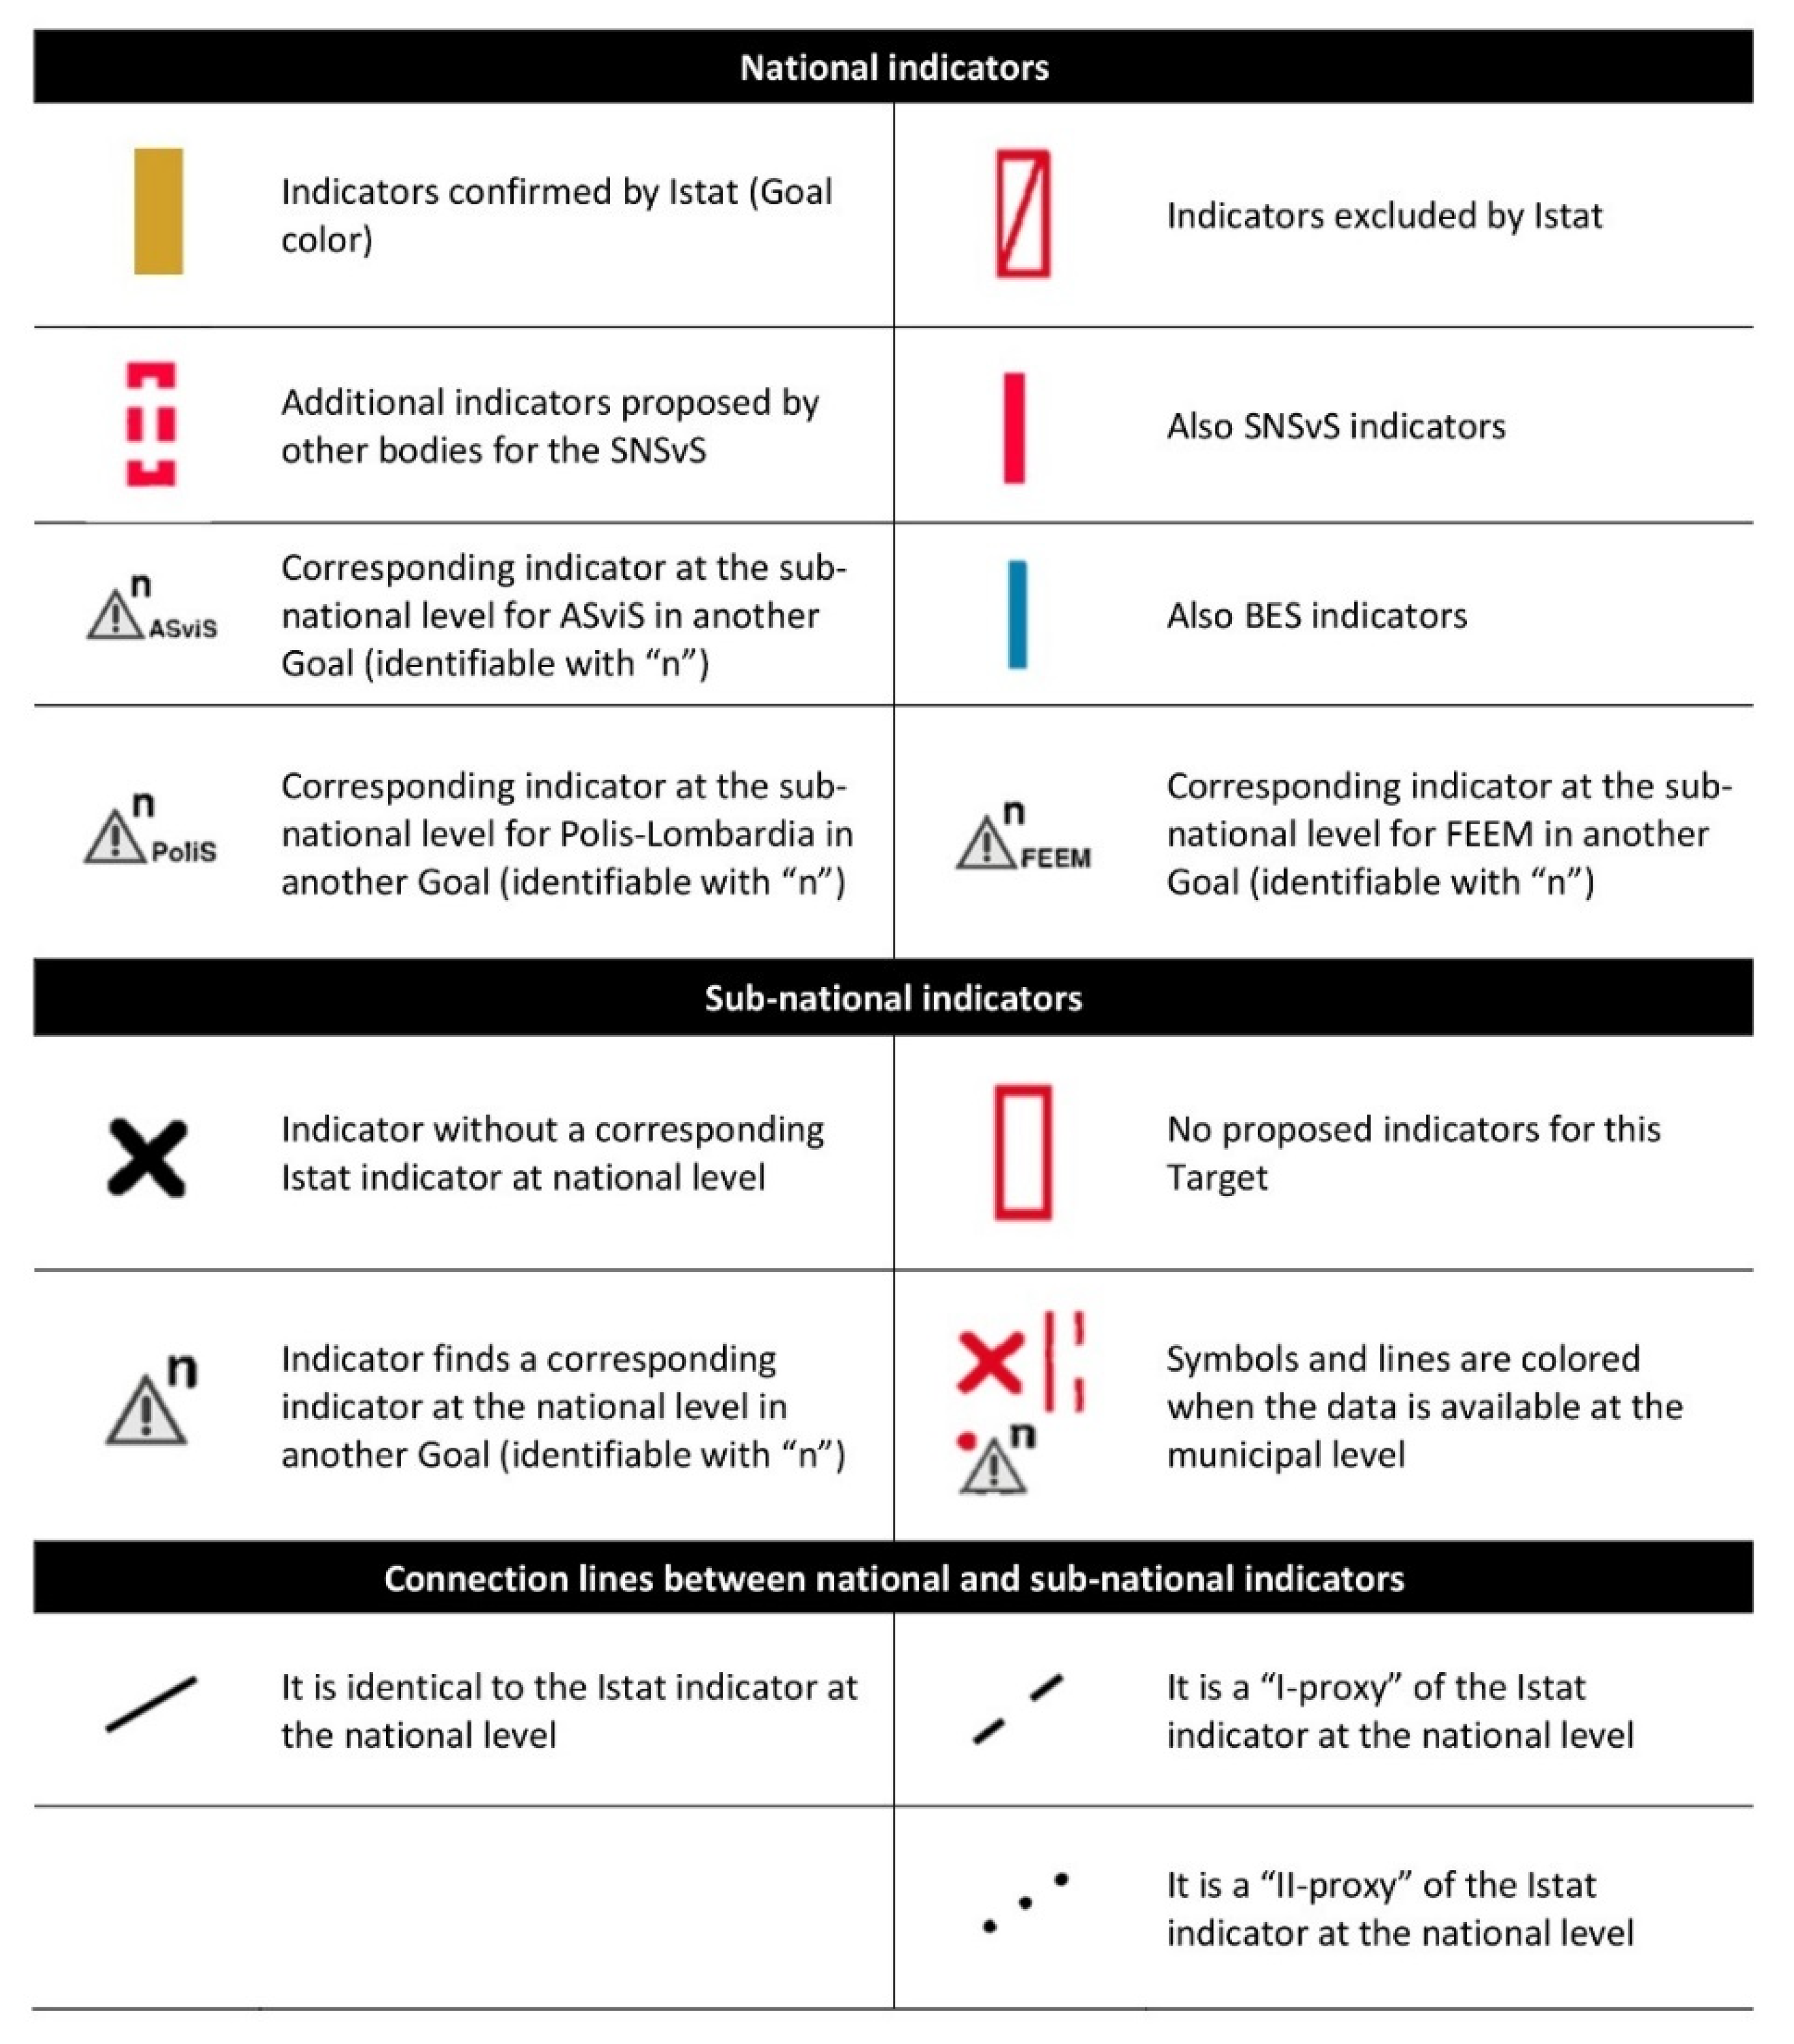
  • The indicator is present at the sub-national level and confirmed by Istat (the indicator is identical, so it has the same description);
  • The indicator is excluded by Istat, so, at the national level, these data are not monitored, but present in international sets;
  • The indicator is proposed for the SNSvS by private consultant of other bodies not formally in charge to monitor SDGs;
  • The indicator is present also in the SNSvS set of indicators. The use of the same indicator to monitoring the SDGs and the National Strategy for Sustainable Development is considered a value because it connects the National strategy with the international sustainable strategies;
  • The indicator is present also in the BES (Equitable and Sustainable Well-Being) set of indicators. The use of the same indicator to monitoring the SDGs and the BES is considered a value because the BES strategy aim is to monitor the local policy about well-being, equity and sustainability. This set of indicators has a strong link with the territorialization of the strategies;
  • The national indicator could have a corresponding indicator (identical or a partially identical and so-called “proxy”) in other sets of sub-national indicators (provided by ASviS, PoliS-Lombardia, FEEM) but not referred to the same Agenda Goal. These features are indicated by using a warning that highlights the bodies and the Agenda Goal.
The comparative reading, for each Agenda Goal, offers symbols to identify the characteristics of the indicators:
  • The indicator is new and similar indicators are not present at the national level;
  • No indicators are fixed for some target or Agenda Goal at the sub-national level;
  • The sub-national indicator could have a corresponding indicator (identical or a partially identical and so-called “proxy”) at the national level but not referred to the same Agenda Goal. This feature is indicated by using a warning that highlights the different numbers of the Agenda Goals;
  • The indicator has available data at the municipal level (the indicator could be identical to the Istat indicator or could be a “proxy” indicator.
The “proxy” indicator is a partially identical indicator or a similar indicator compared to the national one. Two kinds of proxy are defined: the “I-proxy” refers to indicators for the same target of the national indicator but the description or the unit of measure of data is not the same; the “II-proxy” refers to indicators for the same target of the national indicator, but the statistical measure is completely different from the description of the national one.
In the scheme of comparative reading, different lines connect identical indicators and proxy indicators from the national to the sub-national level.
The comparative reading scheme (Figure 1) allows us to recognize the qualitative characteristics of the proposed metrics (with symbols) and to make evidence of the coincidence or similarity among indicators coming from different sources and called in different ways (dashed line connection).
The results of the comparison are presented below.

3. Results

3.1. The Global Level

In 2015 the United Nations Statistical Commission (UnStat) established the Inter-Agency Expert Group on SDGs (IAEG-SDGs). The IAEG-SDGs had the task of developing and implementing the Global Indicator Framework to respond to Goals and Targets of 2030Agenda and to identify a shared framework of statistical information. The IAEG-SDGs paid particular attention to the capacity gaps between states and the need for investment in national statistical systems, as well as the levels of disaggregation of the available data. The Global Indicator Framework set was approved in 2017 during the 48th Conference of the United Nations Statistical Commission and is refined annually. It was revised by UnStat in 2020 and will be revised again in 2025. Based on the latest update of 28 December 2020, the set includes 247 indicators, of which 231 are unique and 12 are used to monitor two or three Agenda Goals [31].
All indicators have been classified into three levels (Tier I, II and III) [32] based on the level of development of the methodology and the availability of data globally in order to facilitate the updating of the set. IAEG-SDGs established the following definition:
  • Tier 1: Indicator is conceptually clear and has an internationally established methodology and standards are available, and data are regularly produced by countries for at least 50 per cent of countries and of the population in every region where the indicator is relevant;
  • Tier 2: Indicator is conceptually clear and has an internationally established methodology and standards are available, but data are not regularly produced by countries;
  • Tier 3: No internationally established methodology or standards are yet available for the indicator, but methodology/standards are being (or will be) developed or tested. (As of the 51st session of the UN Statistical Commission, the global indicator framework does not contain any Tier III indicators [32] (p. 1).)
According to the update of 28 December 2020, 130 indicators belong to Tier I, 97 indicators to Tier II, and four indicators belong to several Tiers (different components of the indicator are classified into different levels), while none indicator is in Tier III [32]. This process is concluded in 2021.
UnStat is responsible for sharing indicators and data on its website, as well as sharing the reports of the United Nations Secretary-General “Progress towards the Sustainable Development Goals” and reports on the SDGs addressed to a wider audience. The Sustainable Development Goals Report was an annual (five editions, from 2016 to 2020) report that “provides an overview of the world’s implementation efforts to date, highlighting areas of progress and areas where more action needs to be taken to ensure no one is left behind” [4,33,34,35,36,37].

3.2. The Continental Level—Europe

The European Union’s response to the adoption of the 2030 Agenda and the 17 Sustainable Development Goals is expressed in the Communication of the European Commission of 22 November 2016 “Next steps for a sustainable European future. European action for sustainability”, which states that “ the EU is fully committed to be a frontrunner in implementing the 2030 Agenda and the SDGs, together with its Member States, in line with the principle of subsidiarity” [38] (p. 3). Starting from 2017, the EU foresees constant monitoring of the achievement of the SDGs, developing a framework of reference indicators for this purpose. Eurostat is the body in charge of the collection and monitoring of the SDGs in Europe.
Eurostat is the statistical authority of the European Community (EC). Eurostat has the task of coordinating the individual national statistical institutes of the Member States (or other national authorities responsible for the development, production and dissemination of statistics) of the countries belonging to the European Economic Area (EEA) and the European Free Trade Association (EFTA, Geneva, Switzerland) to harmonize statistical data. The Member States of the EC, the EEA and the EFTA are asked to collect data and carry out statistical analysis for both national and Community purposes. This collaboration is called the European Statistical System (ESS), whose work is also coordinated with other agencies of the European Commission and with international organizations, such as the Organization for Economic Cooperation and Development (OECD, Paris, France), the United Nations (in particular Unstat), the International Monetary Fund and the World Bank.
For the constant monitoring of progress related to the 2030 Agenda Goals, in May 2017, the ESS, led by Eurostat, adopted a set of European SDG indicators. The EU SDGs indicators were selected based on their political relevance for the European context, their quality and statistical freshness, as well as their degree of disaggregation and coverage of the Member States. Many selected indicators were previously used to monitor European policies, for example, the “Europe 2020” indicators (Europe 2020 headline indicators) and the main indicators of the Social Scoreboard for the European Pillar of Social Rights. The set of EU SDGs indicators defined by the ESS covers all 17 Goals and is aligned, as far as possible, with the list of global indicators of the United Nations, even if it is not always identical. This allows the EU SDGs indicators to focus on monitoring policies and phenomena that are most relevant in the European context. Each 2030 Agenda Goal is represented by five or six EU SDGs indicators, for a total of 100 indicators. In the latest edition of the report [39] on the monitoring of progress towards the 2030 Agenda Goals, 36 indicators are intended as “multi-purpose” (MPI), i.e., they monitor more than one Goal and 65 are aligned with the UN-IAEG-SDGs indicators. The presence of multipurpose indicators is the logical response to the complex challenge posed by the 2030 Agenda, which cannot be resolved without a holistic and integrated approach. Given the deep interconnectedness of the 17 Agenda Goals, the progress of one Agenda Goal may slow down the achievement of another. Therefore, the introduction of multi-purpose indicators makes it possible to control the synergies and unexpected consequences deriving from these relationships.
Eurostat is responsible for sharing indicators and data on its website, as well as for the creation and publication of annual reports regarding the revisions of the indicators and progress towards the Sustainable Development Goals in the European context. Eurostat published editions of its report “Sustainable development in the European Union—Monitoring report on progress towards the SDGs in an EU context” from 2017 to 2020 [40,41,42,43].
In January 2019, the EU confirmed its commitment to achieving the Sustainable Development Goals in the document entitled “Towards a sustainable Europe by 2030” [44], while in June of the same year the European Council approved “A new Strategic Agenda 2019-2024” [45]. One of the priorities is to build “a climate-neutral, green, fair and social Europe”. In December 2019, the European Commission presented the Green Deal [46] to manage a fair and controlled transition process towards a zero-impact economy, to transform the EU into a fair society that is healthy, sustainable and prosperous, and to restore the way we interact with nature, followed by the presentation and adoption of numerous strategies and plans, including the “EU Biodiversity Strategy for 2030” [47] and the “European Climate Pact” [48].

3.3. The National Level—Italy

The Italian Institute of Statistics (Istat) has been called by UnStat to play the role of national referent for the production and dissemination of quality statistical data at the national and the sub-national level. Istat has the task of coordinating the institutions belonging to the National Statistical System (Sistan) in the statistical production of data: Higher Institute for Environmental Protection and Research (ISPRA); Energy Services Managers; Higher Institute of Health, Ministry of the Environment and Protection of Land and the Sea; Ministry of Foreign Affairs and International Cooperation; Ministry of Justice; Ministry of the Interior; Ministry of Education, University and Research; National Institute for the Evaluation of the Education and Training System (INVALSI); and Italian Alliance for Sustainable Development (ASviS) [49].
In order to satisfy the demand for global, European, national and local statistical information, Istat has declined the set of global indicators (UN-IAEG) at a national level, defining the SDGs national indicators following four fundamental criteria [49]:
  • Relevance for the official statistics;
  • Comparability at the European level;
  • Significance for the territorial context;
  • Relevance to the targets.
There is no univocal correspondence between the indicators defined at the international and national levels. Since 2016, there have been many revisions and updates of statistical measures and indicators. Since 2018, Istat has prepared an annual report on the SDGs (SDGs Report in three editions) [50,51,52]. The latest report presented 325 statistical measures [52] (of which 296 unique) for the 130 UN-IAEG indicators: 98 statistical measures are identical to the indicators required by the UN-IAEG in its 2020 review, 128 are proxy or partial (i.e., not all data are available or not all are in the required specificity) and 99 are specific for the national context [52]. This configuration for each Agenda Goal is shown in the following Figure 2.
In fact, less than one-third of indicators correspond with the global level. Istat reports provide a quantitative measure of the degree of achievement of the targets in which each Agenda Goal is divided. This measure is flanked by information about the type of variation (improvement, stability, worsening and not available) compared to ten years earlier and the previous year. Furthermore, based on the disaggregation levels of the statistical data, the reports present comparison tables with supranational and subnational contexts.
In the application of the “no one left behind” principle, Istat also paid attention to the level of disaggregation of the statistical data chosen to measure sustainable development, especially in relation to the regional level. On the Istat information platform [53], it is possible to find sections dedicated to reports and statistical data on the SDGs at the national and the regional levels.

3.3.1. The Istat SDGs Indicator and the BES Indicators

The Equitable and Sustainable Well-Being (BES) indicators were conceptually introduced before the SDGs indicators, in the face of growing international interest in relation to the need to undertake measurements of the well-being of individuals and society going beyond conventional measures such as GDP. They were born from the collaboration of Cnel (National Council of Economy and Labor) and Istat. Their statistical measurement led to the drafting of the first edition of the “BES Report” in 2013. Thanks to law 163/2016, which reformulated the budget law, the BES was introduced in the definition of economic policies: from 2017 a shortlist of the BES indicators became part of the Economic and Financial Document (DEF) of the Italian Government.
The BES indicators have an economic, environmental and social character and are divided into 12 domains: health; instruction; work and lifetimes; economic well-being; social relations; politics and institutions; safety; well-being; landscape and cultural heritage; environment; innovation, research and creativity (formerly referred to as research and innovation); and quality of services. Most of it can be broken down by social groups and at the regional level.
The BES indicators have broad points of contact with the SDGs indicators: 59 BES indicators are included in the national SDGs indicators set.

3.3.2. The Istat SDGs Indicator and the National Strategy for Sustainable Development

With the adoption of the 2030 Agenda, all UN Countries have been called upon to commit themselves to define their own Sustainable Development Strategy that will allow them to achieve the SDGs. On 22 December 2017, Italy is committed to declining the 2030 Agenda Goals at a national level with the approval of the CIPE resolution 108/2017 of the “National Strategy for Sustainable Development” (SNSvS). The first step to ensure the monitoring of Italy’s performance was defining an indicator set. The references for the SNSvS indicators set were the Istat SDGs indicators (SDGs Report 2018 [50]), the BES indicators and the “Partnership agreement for the SNSvS”. In order to try reducing the number of indicators, a maximum of four indicators was considered for each Goal, using the following criteria:
  • Indicators that refer to UN-IAEG Tier I indicators;
  • Possibly “identical” Istat indicators;
  • Indicators already present in the National Statistical System (Sistan);
  • Indicators that ensure supranational comparability;
  • Indicators with at least regional disaggregation level.
The first set of 43 indicators revised by the Ministry of the Environment in 2020 was therefore defined and the relation with the Istat SDGs indicators is shown in the following Figure 3.

3.4. The Regional Level—Lombardy

Istat has made available a collection of statistical measures for monitoring the Sustainable Development Goals of Regions and Autonomous Provinces in Italy [54].
The Lombardy Region promoted the 2030 Agenda with various initiatives:
  • Since 2017 Lombardy has commissioned to PoliS-Lombardia to draft the “Rapporto Lombardia” to provide a tool for reading and possibly orient the Lombardy development model, contextualizing the SDGs and declining the indicators in a regional perspective;
  • Lombardy Region has published the Regional Development Program of the XI Legislature 2018–2023 [55], which defines the objectives, strategies and policies that the Region intends to implement throughout the legislature;
  • During the United Nations SDGs Summit (New York, NY, USA, 24–25 September 2019) in which the “Decade of action” was launched, the Lombardy Region presented the “Lombard Protocol for sustainable development” as acceleration action for the implementation of the SDGs at the local level [56];
  • In November 2020, the “First Regional Forum for Sustainable Development” was held, on the occasion of which the “Rapporto Lombardia 2020” [28] of PoliS-Lombardia was also presented;
  • In June 2021, the Regional Sustainable Development Strategy (SRsvS) was adopted and it was upgraded in November 2021.
In addition to the indicators provided by Istat, the Region assigns the task to monitor the SDGs to PoliS-Lombardia (A Regional Institute for the support of Lombardy’s policies and its mission is to service the implementation (and evaluation) of policies for the Lombardy Region as a whole). The Lombardy Region through PoliS-Lombardia, in agreement with Istat, publishes the “Rapporto Lombardia”, which offers an overview of the regional situation based on a set of independently defined monitoring indicators from 2017 to 2020 (4 editions) [27,28,57,58]. For the definition of the set of regional indicators, PoliS-Lombardia referred to the subset of indicators adopted by Eurostat and Istat, sharing the following selection criteria: relevance for official statistics; comparability at the European level; significance for the territorial context; relevance concerning the Targets. It added the criterion of availability of statistical information at the regional level. If the Eurostat regional data are not available, PoliS-Lombardia has used comparable Istat data or elaborations carried out on Istat microdata in order to guarantee coverage of 16 SDGs (Agenda Goal 14—Conserve and sustainably use the oceans, seas and marine resources for sustainable development is not included because Lombardy has no sea coasts). Moreover, in this case, not all but most indicators proposed by PoliS-Lombardia (40) find a corresponding IAEG indicator and not even Eurostat or Istat (25 indicators equal to 62.5%).
The Regional Sustainable Development Strategy (SRSvS), whose definition was supported by PoliS-Lombardia, also provides a set of indicators. For each Agenda Goal, PoliS-Lombardia proposed to select two types of indicators: monitoring indicators, selected from existing regional plans and programs, and context indicators. The latter include some indicators for monitoring the National Sustainable Development Strategy (SNSvS) [27]. The SRSvS organizes the Agenda Goals into 5 Strategic Macro-Areas (MAS):
  • Health, equality, inclusion;
  • Education, training, work;
  • Infrastructure, innovation and cities;
  • Mitigation of climate change, energy, production and consumption;
  • Eco-landscape system, adaptation and culture.
Each MAS contains elements of a Lombardy vision and is made up of a plurality of strategic challenges and medium/long-term targets to achieve that vision. Each strategic challenge has indicators. Some of the strategic challenge indicators and some of the context indicators were then selected to define the composite indicators of the MAS. Quantitative targets are associated with these composite indicators.
The indicators proposed in the SRSvS in June 2021 were 156: 101 were corresponding to Istat indicators.

3.5. The Sub-Regional Level

In Italy, the sub-regional level can be divided into further ones: provinces, metropolitan cities, capital cities and municipalities. This collection refers to the local authorities present in Italy (see the Table 2 for more details) that are different from the ones prosed by Eurostat in the international classification called DEGURBA (see Reference [59]).
In the “Rapporto Lombardia 2019” [27], PoliS-Lombardia introduced a section of “sub-regional indicators”, drawing on the list of indicators used for comparison with the 21 OECD-EU countries or, where it was not possible to perform the calculation at the sub-regional level, drawing on the list of indicators from the National Sustainable Development Strategy (SNSvS) or the Lombardy Regional Development Program. The Rapporto Lombardia 2019 presents 44 regional indicators, 18 provincial indicators, two indicators at the level of capital cities and eight municipal indicators. These sets are only partially stackable. By enriching and expanding the set of sub-regional indicators, the “Rapporto Lombardia 2020” [28] proposes a single set of 40 indicators, highlighting all the levels of territorial disaggregation available for each measure. In this set of 40 indicators, there are 25 regional indicators, 32 provincial indicators, two indicators at the level of capital cities and 10 municipal indicators. The definition of this set of indicators, however, does not always make explicit any identity with the global indicators and with the Istat indicators.
Starting from 2016, The Italian Alliance for Sustainable Development (ASviS) publishes an annual report called the “Rapporto ASviS. L’Italia e gli obiettivi di Sviluppo Sostenibile”, in which it analyzes the achievement of the SDGs at the national level and makes policy proposals. With the 2018 edition, ASviS studied for the first time the achievement of the SDGs of the Italian regions. The issue of the monitoring of the provinces and the metropolitan cities is addressed for the first time by ASviS in 2020 with the report called “The territories and the SDGs”, in which it defines a methodology for measuring and studying the progress of Regions and Autonomous Provinces, Provinces and cities [60]. ASviS also analyzes 90 provinces and 14 metropolitan cities. It identifies 53 indicators defined as “elementary indicators” based on Istat’s statistical indicators. The “elementary indicators” are then aggregated into “composite indicators” (with the MPI—Mazziotta Pareto Index methodology) to allow comparison with national averages. The definition of the aforementioned “elementary indicators”, however, does not always clarify the possible identity with the global indicators and with the Istat indicators, moreover “elementary indicators” only partially include the Istat indicators of measurement of the SDGs.
Some research of the Eni Enrico Mattei Foundation (FEEM) concerns the localization of the 2030 Agenda. Three FEEM Reports concerns the SDGs at the local level: two of them regard the capital cities (published in 2018 and 2020 [21,61]) and one regards the provinces and the metropolitan cities [62]. In the case of the capital cities, FEEM presents the “Sustainable Development Solutions Network (SDSN) Italy SDGs City Index”, a composite indicator referred to Italian cities. This SDGs City Index aims to help local authorities face the still open challenges that affect cities and to elaborate a consolidated database of indicators that can be monitored over time. Even FEEM, similar to ASviS, has defined a set of “elementary indicators” which started from the analysis of the IAEG-SDGs global indicators, the SNSvS, the urban strategy and the urban sustainability indexes existing at the international and national levels. In the 2018 Report [21], FEEM selected 39 “elementary indicators” based on the connection with the SDGs and some features: the relevance for the Italian urban system, the frequency and the measurability (quantitative indicators and not qualitative ones). They are referring to 16 of the 17 SDGs (excluding Agenda Goal 14 due to problems of comparability), whose denomination, however, does not always succeed in explaining the possible identity with the global indicators and with the Istat indicators. FEEM grouped the “elementary indicators” of each Agenda Goal to create 16 “composite indices” for carrying out the comparative analyzes between the capital cities. Furthermore, FEEM has proposed for each capital city a composite index that groups all the SDGs. In the 2020 Report [61], FEEM updated the data, increased the “elementary indicators” (that became 46) and the capital cities (from 101 to 103). In the case of provinces and metropolitan cities [62], FEEM presents the “provincial index”, using the same methodology proposed for the “SDSN Italy SDGs City Index” mentioned above. FEEM has selected 57 “elementary indicators”, with the accuracy of measuring 16 SDGs with at least two indicators (also in this case FEEM has not analyzed Agenda Goal 14). If official statistical data at the provincial and metropolitan levels were not available for the “elementary indicators” chosen, FEEM considered data at the regional level. Even in this case, however, the definition of the aforementioned “elementary indicators” does not always succeed in making explicit the identity with the global indicators and with the Istat indicators. In addition, in this case, FEEM developed a “composite index” for each Agenda Goal, aggregating the “elementary indicators”, as well as a “composite index” that included all the SDGs for each province/metropolitan city. With this method, FEEM analyzed 106 provinces and metropolitan cities.
An example of the scheme of comparative reading for the indicators at the National (Istat indicators) and sub-national level (PoliS-Lombardia, ASviS and FEEM indicators), using the methodology proposed in paragraph 2 follows. The example is for Agenda Goal 7 (Figure 4).
For each Agenda Goal, the research realized the comparative reading showing the total or partial coherence among national (Istat) indicators and sub-national levels indicators (with connecting lines) or the lack of alignment with the supra-local level indicators (without connecting lines). For example, for Agenda Goal 7—shown in Figure 4—only one indicator proposed at the sub national level is identical to the Istat one and only one indicator (in yellow in the Figure 4) is available at the municipal level (excluded capitals cities). Half of the sub-national level indicators are similar to the Istat set (dashed connecting lines) but not identical (proxy indicators). The synthetic results of comparative readings for all Agenda Goals are showed in the Table 3. The first column of the Table 3 shows the number of SDG Istat indicators (National level) for each Agenda Goal. For each sub-national indicator set (PoliS-Lombardia set, ASviS set and FEEM sets for capital cities and for provinces), Table 3 present how many indicators there are corresponding to the national-level set, divided into identical indicators, I-proxy indicators, II-proxy indicators.
The SDG Istat indicators are 328 (updated by Istat in 2021), and they correspond with indicators sub-national for only the 6–13%. The indicators at the sub-national level are mostly proxy indicators. Only 40 indicators of sub-regional sets have available data at the municipal level (excluded capital cities) from open-source databases. Five of the Agenda Goals have no data available at the municipal level.

4. Discussion

At the national and supranational levels, the Agenda Goals are coherent with the indicators to measure the achievement of the SDGs thanks to the protocols provided by the various statistical bodies.
At a sub-national level, the maintenance of the coherence between the Agenda Goals and indicators is difficult because the bodies that carry out the SDG monitoring have different natures: they are autonomous research bodies, associations or bodies appointed by local authorities to carry out the monitoring for them for which it is not mandatory to use only indicators identical to the Istat set. For example, the indicators of PoliS-Lombardia at the sub-regional level (40) are autonomous: they are not identical to the SDGs indicators of the super-regional levels.
The localization of the 2030 Agenda carried out by ASviS is progressively moving away from the monitoring provided for in Resolution A/RES/71/313 adopted by the General Assembly of the United Nations in order to monitor in a univocal way all Member States [64]. The ASviS Report highlights that, due to the lack of statistical data on a sub-regional scale, it was possible to compare the provinces and metropolitan cities with only 11 of the 22 quantitative targets identified by ASviS. The ability to define only 11 “composite indicators” to be linked to the 11 Targets resulted in the coverage of only 10 SDGs and a partial analysis of the sub-regional territories.
The FEEM methodology is referred to as the first world publication relating to the analysis of SDGs at the urban level. It is “The U.S. Cities Sustainable Development Goals Index 2017: Achieving a Sustainable Urban America” [65]. The US Cities SDGs Index 2017 report defined 49 indicators (covering 16 of the 17 SDGs) to analyze the 100 most populous American cities (Metropolitan Statistical Areas). A concise vision (thanks to the “composite indicators”) contributes to FEEM’s mission of helping the definition of policies and encouraging the administrators of provinces and cities to become aware of the state of sustainability of the territories. Local administrators can draw inspiration from the 2030 Agenda to address the crucial problems they share in a coordinated way. However, as far as statistical data are concerned, FEEM has given priority to international databases for the criterion of replicability. Nonetheless, due to official data lacking information at the sub-regional level, FEEM made use of unofficial statistical sources recognized at the national level (e.g., Legambiente, a non-profit association that deals with the environment). FEEM itself states that the need to use unofficial statistical data represents a major limitation of the research carried out.
Downstream of the detailed analysis performed on the various indicators, the following limits are highlighted:
  • PoliS-Lombardia, ASviS and FEEM usefully subdivide the indicators by target, without, however, highlighting the corresponding Istat indicators;
  • ASviS and FEEM in the reports do not directly provide information on the statistical measures relating to the “elementary indicators” used. This detailed information is partially available only upon request;
  • Some indicators of PoliS-Lombardia, ASviS and FEEM find the corresponding Istat indicator, but to measure a different target.
The 76% of Istat indicators, for various reasons, have not been declined at a sub-regional level. In this regard, only 7% of Istat indicators reach the sub-regional level through an “identical” indicator; the 14% of the Istat indicators were declined through an indicator defined as “I-proxy” at a sub-regional level; the 3% of Istat indicators were declined as “II-proxy” indicator. In another remarkable international case study, the relation between the identical indicators and similar one are almost proportional (47% vs. 53%) [14] and strictly connected with the SGDs target. This result is possible thanks to “availability of reliable geospatial information, moving to transformative actions, and the engagement of stakeholders and innovative partnerships” [14]. In Italy, the lack of availability of open-source data is evident, and perhaps the stakeholders at the local levels are not yet engaged. For example, Guerini et al. propose some insights for public management to strategic systems and plans, in accordance with the multidimensional perspective of sustainability identifying possible patterns of actions that public managers will find useful [20]. In fact, it is claimed that there is a gap and that this has not yet happened. In Italy, the difficulty of constructing information consistent with the request is a severe limit.
The monitoring of Italian local institutions takes place by using various metrics, but a few are coherent with the EU ones (proposed by Istat) starting from the National Strategy of Sustainable Development (SNSvS). SNSvS and SRSvS share their principles and objectives with 2030 Agenda but not the monitoring methods: over 70% of Istat indicators are not represented among the so-called “elementary indicators”. Some targets are not measured: ASviS does not propose indicators for Targets 2, 14 and 17; FEEM does not propose indicators for Target 14, which excludes, as already stated, due to problems of comparability; PoliS-Lombardia does not propose any indicator for Target 14. In Targets 5, 6, 12 and 15, the measurement of a single Istat indicator is proposed. Finally, only 25% of the proposed “elementary indicators” have statistical measures with a local (municipal) level of disaggregation of data.
The municipalities and “local communities are heterogeneous in sustainability needs and priorities which requires the global goals and targets to be tailored and localized to align with local priorities” [12,20,66], moreover the regional level is central to academic and policy-relevant spatial analysis but it is an “elusive” category [67]. These assumptions cannot be an alibi for public administration due to the monitoring of strategies and policies—different but coherent with those of the EU Community—takes place with a set of “special” information dedicated to them, without taking into account the metrics proposed by the 2030 Agenda. Barnett and Parrel claim that the normative agenda of the Urban SDG necessarily depends upon the capacities of local actors of place-specific selection of data and indicators and on embedded capacities to share and learn across contexts and to work collaboratively with different parties in particular places [8], without losing the link with the supra-local levels. If EU policies are not supported by a rigorous scientific method aimed at implementation, so they risk failing or being reinterpreted and weakened, especially for quantitative aspects.

5. Conclusions

The analysis shows that many different metrics are generated by institutional and non-institutional subjects who participate in the debate on the 2030 Agenda by proposing different target measurement solutions that are sometimes not adequately validated. Among the subjects, ASviS is the main reference on a national scale, flanked by FEEM and PoliS-Lombardia at a regional and sub-regional level, as they are of interest for the Lombardy case study.
From the analysis carried out, it emerges that the action of localization of the SDGs indicators involves the following main risks:
  • The loss of relationship with the context of the 2030 Agenda and non-compliance with the provisions of Resolution A/RES/71/313 adopted by the General Assembly of the Statistical Commission of the European Community to monitor the Member States [64];
  • The progressive nullification of the work carried out by Istat and Eurostat to construct the measurement protocols (Tiers I, II and III);
  • A growing confusion caused by different definitions of indicators, identical or very similar, which, however, do not use the official name of the monitoring indicators of the Istat SDGs;
  • The lack of shared protocols in the construction of “elementary indicators” if they differ from those already included in the Istat protocols for measuring the SDGs;
  • The loss of relationship with the local context, determined by the above approximation;
  • The loss of the interrelation between the Agenda Goals, determined by the reduction in the number of official Istat indicators.
The size and strength of the 2030 Agenda targets is the interrelation between them, which allows us to understand and monitor the cause–effect relationships between apparently unrelated aspects and the repercussions that human interventions in the environmental field, for example, can have on the social and economic sector. For this reason and, above all, due to the heterogeneity of our territories, not only at the national level but also at the local level, all targets must be monitored.
In defining local strategies, given the financial scarcity, it is useful to focus monitoring on priority aspects. This approach could, however, lead to the underestimation of other aspects deeply related to the priority ones and the lack of understanding of the multiple repercussions of policies. The importance of the interrelationships and interdependencies of policies across different scales is identified by European Environmental Agency (EEA) as the “nexus approach” [68]. The EEA states that “although cities can be seen as representing complex systems in themselves (at the level of the city or functional urban area), they also have (…) policy integration operating at different scales. In the EU, high-level policy, targets and visions are set at the EU level, and Member States have their own urban policy and regulatory frameworks, including those implementing EU directives. Some countries have governance at a regional scale, and below this sits city- and sub-city-level governance” [68]. The “nexus analysis” considers horizontal and vertical integration: “Each nexus recognises the importance of EU and national policy frameworks and targets, while the analysis focuses on the identification and assessment of horizontal policy interactions. The aim is to help move towards more integrated policymaking and interventions in cities, and in this way to support the transition to urban environmental sustainability” (Figure 5).
The result of partial SDGs monitoring could be a short-sighted photograph, focused only on a few aspects in the complexity of the context. In order to know and understand nexus, cause–effect relationships of the individual actions and to define adequate strategies, it is of primary importance to monitor not only priority factors for individual entities and territories, but a wider scenario. In the localization process, the reduction of the possibility of measuring the indicators is normal because some indicators are not suitable [14]: when changing the scale, some data have no particular significance (for example the number of parliamentarians at the municipal level); others are statistical data, and they are not present at the local level. It is considered essential to maintaining an adequate number of indicators for each target to guarantee their overall monitoring and verify the position of a municipality (or other local bodies) in respect to the others in the context, despite how, in certain strands of spatial theory, the concepts of “scale” should be abandoned altogether, on the grounds that they apparently lack “ontological” coherence [8].
Furthermore, the indicators at the local level must remain as close as possible to the SDGs at the national and global level to make the positioning of the territory possible also concerning the international contest. The local level policies must necessarily interface with the metrics provided for by the super-local strategies (SNSvS and SRSvS), and, therefore, the indicators are configured as “Plan indicators” or “process indicators”. Finally, the SDGs monitoring should aim at highlighting the local-level policies relating to the quality of life, and the equitable and sustainable development of the territories, despite the reduction of the indicators, should favor the maintenance and measurement of the indicators that are common between the SDGs and the BES (Equitable and Sustainable Well-Being) ones. This integration can focus on data that are collected at organization-wide, policy and unit levels to obtain a comprehensive sustainability performance measurement system, and it is “increasingly important to develop ‘performance feedback capabilities’ by linking sustainability information with organizational decisions and performance valuation systems” [20].

Author Contributions

Conceptualization, M.P. and A.R.; methodology, M.P. and A.R.; data curation, A.R.; writing—original draft preparation, A.R.; writing—review and editing, M.P. and A.R.; visualization, A.R.; supervision, M.P.; project administration, M.P. All authors have read and agreed to the published version of the manuscript.

Funding

This research received no external funding. CRA2030 is supported by A2A foundation and AIB foundation.

Institutional Review Board Statement

Not applicable.

Informed Consent Statement

Not applicable.

Data Availability Statement

CRA2030 web site www.https://cra2030.unibs.it/ (accessed on 27 January 2022).

Acknowledgments

We thanks Barbara Maria Frigione for the support in the research analysis and data collection.

Conflicts of Interest

The authors declare no conflict of interest.

References

  1. United Nations. Transforming Our World: The 2030 Agenda for Sustainable Development. 2015, A/RES/70/71. Available online: https://sustainabledevelopment.un.org/post2015/transformingourworld/publication (accessed on 27 January 2022).
  2. United Nations. The 17 Goals. Available online: https://sdgs.un.org/goals (accessed on 12 July 2021).
  3. United Nations. Sustainable Development Goal Indicators Website. Available online: https://unstats.un.org/sdgs/ (accessed on 5 February 2021).
  4. United Nations. The Sustainable Development Goals Report 2019; United Nations: New York, NY, USA, 2019; p. 61. [Google Scholar]
  5. Guterres, A. Remarks to High-Level Political Forum on Sustainable Development. Available online: https://www.un.org/sg/en/content/sg/speeches/2019-09-24/remarks-high-level-political-sustainable-development-forum (accessed on 12 July 2021).
  6. United Nations. World Urbanization Prospects: The 2018 Revision; ST/ESA/SER.A/420; United Nations: New York, NY, USA, 2019. [Google Scholar]
  7. United Nations Population Division. The world bank. Available online: https://data.worldbank.org/indicator/SP.URB.TOTL.IN.ZS?locations (accessed on 19 April 2021).
  8. Barnett, C.; Parnell, S. Ideas, implementation and indicators: Epistemologies of the post-2015 urban agenda. Environ. Urban. 2016, 28, 87–98. [Google Scholar] [CrossRef] [Green Version]
  9. Ki-moon, B. Press Release. Available online: https://www.un.org/press/en/2012/sgsm14249.doc.htm (accessed on 12 July 2021).
  10. Global Taskforce of Local and Regional Governments; UN-Habitat; UNPD. Roadmap for Localizing the SDGs: Implementation and Monitoring at Sub-National Level; Global Taskforce of Local and Regional Governments; UN-Habitat; UNPD: Washington, DC, USA, 2016. [Google Scholar]
  11. Balletto, G.; Mundula, L.; Milesi, A.; Ladu, M. Cohesion Policies in Italian Metropolitan Cities—Evaluation and Challenges; Springer: Cham, Switzerland, 2020. [Google Scholar]
  12. Szetey, K.; Moallemi, E.A.; Ashton, E.; Butcher, M.; Sprunt, B.; Bryan, B.A. Co-creating local socioeconomic pathways for achieving the sustainable development goals. Sustain. Sci. 2021, 16, 1251–1268. [Google Scholar] [CrossRef] [PubMed]
  13. Krantz, V.; Gustafsson, S. Localizing the sustainable development goals through an integrated approach in municipalities: Early experiences from a Swedish forerunner. J. Environ. Plan. Manag. 2021, 64, 2641–2660. [Google Scholar] [CrossRef]
  14. Chen, J.; Peng, S.; Chen, H.; Zhao, X.; Ge, Y.; Li, Z. A Comprehensive Measurement of Progress toward Local SDGs with Geospatial Information: Methodology and Lessons Learned. ISPRS Int. J. Geo-Inf. 2020, 9, 522. [Google Scholar] [CrossRef]
  15. Jones, P.; Comfort, D. A commentary on the localisation of the sustainable development goals. J. Public Aff. 2020, 20, e1943. [Google Scholar] [CrossRef]
  16. Sterling, E.J.; Pascua, P.; Sigouin, A.; Gazit, N.; Mandle, L.; Betley, E.; Aini, J.; Albert, S.; Caillon, S.; Caselle, J.E. Creating a space for place and multidimensional well-being: Lessons learned from localizing the SDGs. Sustain. Sci. 2020, 15, 1129–1147. [Google Scholar] [CrossRef]
  17. Farnia, L.; Cavalli, L.; Lizzi, G.; Vergalli, S. Methodological Insights to Measure the Agenda 2030 at Urban Level in Italy. Sustainability 2019, 11, 4598. [Google Scholar] [CrossRef] [Green Version]
  18. Votta, M.; Toto, T.; Pollio, C.; Papavero, M. Local public services and sustainable development goals: From a national perspective to a European joint action. Resour. Environ. Econ. 2021, 3, 245–250. [Google Scholar] [CrossRef]
  19. Ajates, R.; Hager, G.; Georgiadis, P.; Coulson, S.; Woods, M.; Hemment, D. Local Action with Global Impact: The Case of the GROW Observatory and the Sustainable Development Goals. Sustainability 2020, 12, 10518. [Google Scholar] [CrossRef]
  20. Guarini, E.; Mori, E.; Zuffada, E. Localizing the Sustainable Development Goals: A managerial perspective. J. Public Budg. Account. Financ. Manag. 2021, 1096–3367. [Google Scholar] [CrossRef]
  21. Cavalli, L.; Farnia, L. Per Un’italia Sostenibile: L’SDSN Italia SDGs City Index 2018; Fondazione Eni Enrico Mattei: Milano, Italy, 2018. [Google Scholar]
  22. Betsill, M.; Bulkeley, H. Looking back and thinking ahead: A decade of cities and climate change research. Local Environ. 2007, 12, 447–456. [Google Scholar] [CrossRef]
  23. Fenton, P.; Gustafsson, S. Moving from high-level words to local action—Governance for urban sustainability in municipalities. Curr. Opin. Environ. Sustain. 2017, 26, 129–133. [Google Scholar] [CrossRef]
  24. Grainger-Brown, J.; Malekpour, S. Implementing the sustainable development goals: A review of strategic tools and frameworks available to organisations. Sustainability 2019, 11, 1381. [Google Scholar] [CrossRef] [Green Version]
  25. Stafford-Smith, M.; Griggs, D.; Gaffney, O.; Ullah, F.; Reyers, B.; Kanie, N.; Stigson, B.; Shrivastava, P.; Leach, M.; O’Connell, D. Integration: The key to implementing the Sustainable Development Goals. Sustain. Sci. 2017, 12, 911–919. [Google Scholar] [CrossRef] [PubMed] [Green Version]
  26. Valencia, S.C.; Simon, D.; Croese, S.; Nordqvist, J.; Oloko, M.; Sharma, T.; Taylor Buck, N.; Versace, I. Adapting the Sustainable Development Goals and the New Urban Agenda to the city level: Initial reflections from a comparative research project. Int. J. Urban Sustain. Dev. 2019, 11, 4–23. [Google Scholar] [CrossRef] [Green Version]
  27. Polis-Lombardia. Rapporto Lombardia 2019; Edizioni Angelo Guerini e Associati Srl: Milano, Italy, 2019. [Google Scholar]
  28. Polis-Lombardia. Rapporto Lombardia 2020; Edizioni Angelo Guerini e Associati Srl: Milano, Italy, 2020; Volume 1. [Google Scholar]
  29. ASviS. Who We Are. Available online: https://asvis.it/who-we-are/ (accessed on 21 July 2021).
  30. Fondazione Eni Enrico Mattei. About Us. Available online: https://www.feem.it/en/about_us/ (accessed on 21 July 2021).
  31. United Nations Statistics Division. SDG Indicators. Available online: https://unstats.un.org/sdgs/indicators/indicators-list/ (accessed on 15 July 2021).
  32. United Nations Statistical Divisione. IAEG-SDGs. Tier Classification for Global SDG Indicators. Available online: https://unstats.un.org/sdgs/iaeg-sdgs/tier-classification/ (accessed on 15 July 2021).
  33. United Nations. Sustainable Development Goals Report. Available online: https://www.un.org/sustainabledevelopment/progress-report/ (accessed on 15 July 2021).
  34. United Nations. The Sustainable Development Goals Report 2016; United Nations: New York, NY, USA, 2016. [Google Scholar]
  35. United Nations. The Sustainable Development Goals Report 2017; United Nations: New York, NY, USA, 2017. [Google Scholar]
  36. United Nations. The Sustainable Development Goals Report 2018; United Nations: New York, NY, USA, 2018. [Google Scholar]
  37. United Nations. The Sustainable Development Goals Report 2020; United Nations: New York, NY, USA, 2020. [Google Scholar]
  38. European Commission. Next steps for a sustainable European future. Eur. Action Sustain. 2016, 2016, 739. [Google Scholar]
  39. Eurostat. Sustainable Development in the European Union. Monitoring Report on Progress towards the SDGs in an EU Context-2021 Edition; European Union: Luxembourg, 2021. [Google Scholar]
  40. Eurostat. Sustainable Development in the European Union. Monitoring Report on Progress towards the SDGs in an EU Context-2020 Edition; European Union: Luxembourg, 2020. [Google Scholar]
  41. Eurostat. Sustainable Development in the European Union. Monitoring Report on Progress towards the SDGs in an EU Context-2019 Edition; European Union: Luxembourg, 2019. [Google Scholar]
  42. Eurostat. Sustainable Development in the European Union. Monitoring Report on Progress towards the SDGs in an EU Context—2018 Edition; European Union: Luxembourg, 2018. [Google Scholar]
  43. Eurostat. Sustainable Development in the European Union. Monitoring Report on Progress towards the SDGs in an EU Context—2017 Edition; European Union: Luxembourg, 2017. [Google Scholar]
  44. European Commission. Towards a Sustainable Europe by 2030; European Commission: Luxembourg, 2019. [Google Scholar] [CrossRef]
  45. European Council. A New Strategic Agenda 2019–2024; European Council: Bruxelles, Belgium, 2019. [Google Scholar]
  46. European Commission. The European Green Deal; European Commission: Luxembourg, 2019; Volume 2019, p. 640. [Google Scholar]
  47. European Commission. EU Biodiversity Strategy for 2030. Bringing Nature Back into Our Lives; European Commission: Luxembourg, 2020; Volume 2020, p. 380. [Google Scholar]
  48. European Commission. European Climate Pact; European Commission: Luxembourg, 2020; Volume 2020, p. 788. [Google Scholar]
  49. Istat. Rapporto SDGs 2020. Informazioni Statistiche per l’Agenda 2030 in Italia; Istat: Rome, Italy, 2020. [Google Scholar]
  50. Istat. Rapporto SDGs 2018. Informazioni Statistiche per l’Agenda 2030 in Italia: Prime Analisi; Istat: Rome, Italy, 2018. [Google Scholar]
  51. Istat. Rapporto SDGs 2019. Informazioni Statistiche per l’Agenda 2030 in Italia; Istat: Rome, Italy, 2019. [Google Scholar]
  52. Istat. Rapporto SDGs 2020. L’informazione Statistica per l’Agenda 2030 in Italia; Istat: Rome, Italy, 2020. [Google Scholar]
  53. Istat. Gli obiettivi di sviluppo sostenibile. Available online: https://www.istat.it/it/benessere-e-sostenibilit%C3%A0/obiettivi-di-sviluppo-sostenibile (accessed on 11 July 2021).
  54. Istat. Le misure statistiche SDGs: Le regioni. Available online: https://www.istat.it/it/benessere-e-sostenibilit%C3%A0/obiettivi-di-sviluppo-sostenibile/gli-indicatori-regionali (accessed on 23 July 2021).
  55. Regione Lombardia. Programma regionale di sviluppo della XI Legislatura. 2018, D.c.r. 10 luglio 2018-n. XI/64. Available online: https://www.regione.lombardia.it/wps/portal/istituzionale/HP/DettaglioRedazionale/istituzione/programma-e-finanze/programma-regionale-di-sviluppo/approvato_prs_XI_legislatura/approvato_prs_XI_legislatura (accessed on 27 January 2022).
  56. United Nations. For the Sustainable Development in Lombardy. Available online: https://sustainabledevelopment.un.org/partnership/?p=33696 (accessed on 23 July 2021).
  57. Lombardia, É. Rapporto Lombardia 2017; Regione Lombardia: Milano, Italy, 2017. [Google Scholar]
  58. Polis-Lombardia. Rapporto Lombardia 2018; Regione Lombardia: Milano, Italy, 2018. [Google Scholar]
  59. Eurostat. Methodological Manual on Territorial Typologies-Editions 2018; European Union: Luxembourg, 2019. [Google Scholar]
  60. ASviS. I Territori e gli Obiettivi di Sviluppo Sostenibile. Rapporto ASviS 2020; Alleanza Italiana per lo Sviluppo Sostenibile: Rome, Italy, 2020. [Google Scholar]
  61. Cavalli, L.; Farnia, L.; Lizzi, G.; Romani, I.; Alibegovic, M.; Vergalli, S. L’SDSN Italia SDGs City Index per un’Italia Sostenibile: Report di aggiornamento; Fondazione Eni Enrico Mattei: Milano, Italy, 2020. [Google Scholar]
  62. Cavalli, L.; Farnia, L.; Vergalli, S.; Lizzi, G.; Romani, I.; Alibergovic, M. Conoscere il Presente per un Futuro Sostenibile: L’SDGs Index per le Province e le Città Metropolitane d’Italia; Fondazione Eni Enrico Mattei: Milano, Italy, 2020. [Google Scholar]
  63. Pezzagno, M.; Frigione, B.M.; Richiedei, A. Per un Monitoraggio dell’Agenda 2030 in Italia. Un Approccio Multiscalare alla Territorializzazione degli Obiettivi di Sviluppo Sostenibile; Brixia University Press: Brescia, Italy, 2021; Volume 1, p. 106. [Google Scholar]
  64. United Nations. Work of the Statistical Commission Pertaining to the 2030 Agenda for Sustainable Development; United Nations: New York, NY, USA, 2017; A/RES/71/313. [Google Scholar]
  65. Prakash, M.; Teksoz, K.; Espey, J.e.; Sachs, J.; Shank, M.; Schmidt-Traub, G. The U.S. Cities Sustainable Development Goals Index 2017. Achieving a Sustainable Urban America; United Nations: New York, NY, USA, 2017. [Google Scholar]
  66. Moallemi, E.A.; Malekpour, S.; Hadjikakou, M.; Raven, R.; Szetey, K.; Ningrum, D.; Dhiaulhaq, A.; Bryan, B.A. Achieving the Sustainable Development Goals Requires Transdisciplinary Innovation at the Local Scale. One Earth 2020, 3, 300–313. [Google Scholar] [CrossRef]
  67. Macleod, G.; Jones, M. Territorial, Scalar, Networked, Connected: In What Sense a ‘Regional World’? Reg. Stud. 2007, 41, 1177–1191. [Google Scholar] [CrossRef] [Green Version]
  68. European Environment Agency. Urban Sustainability in Europe. A Stakeholder-led Process; Publications Office of the European Union: Luxembourg, 2021. [Google Scholar]
Figure 1. Comparative reading grid for the indicators at the national and sub-national level.
Sustainability 14 03056 g001
Figure 2. Italian Istat SDGs indicators in relation with European UN-IAEG indicators (Source: Reference [52]).
Sustainability 14 03056 g002
Figure 3. SNSvS indicators in relation with the Istat SDGs indicators for Italy (Source: Reference [52] p. 31).
Sustainability 14 03056 g003
Figure 4. Example of scheme of comparative reading for the indicators at the national and sub-national level for Agenda Goal 7 (The comparative reading for all SDGs is available in CRA2030 web site www.https://cra2030.unibs.it/, accessed on 1 march 2022, Reference [63]).
Sustainability 14 03056 g004
Figure 5. Vertical and horizontal policy integration (source: Reference [68]).
Sustainability 14 03056 g005
Table 1. Sources according to the territorial level.
Territorial LevelsBodiesSourcesPeriod
GlobalUnited Nations Statistics Division (UNSD)The Sustainable Development Goals Report (5 editions)from 2016 to 2020
Inter-Agency Expert Group on SDGs (IAEG-SDGs)
Continental (Europe)Eurostat (European Commission)Sustainable development in the European Union—Monitoring report on progress towards the SDGs in an EU context (5 editions)from 2017 to 2021
National (Italy)National Institute of Statistics (Istat)SDGs Report (3 editions)from 2018 to 2020
Equitable and Sustainable Well-Being (BES) Report (8 editions)from 2013 to 2020
Inter-ministerial Committee for Economic Planning (Italian Government)National Strategy for Sustainable Development (SNSvS)2017
Regional (Lombardy)National Institute of Statistics (Istat)SDGS statistical measures: the regions2020
PoliS-LombardiaLombardy Report (4 editions)from 2017 to 2020
Lombardy RegionRegional Strategy for Sustainable Development (1st edition)2021
Sub-regionalPoliS-LombardiaLombardy Report (2 editions)from 2019 to 2020
Italian Alliance for Sustainable Development (ASviS)ASviS 2020 Report. Territories and Sustainable Development Goals2020
Eni Enrico Mattei Foundation (FEEM)“City Index” (2 editions)2018 and 2020
SDGs Index for Italian provinces and metropolitan cities2020
Table 2. Summary of features of Italian provinces and metropolitan cities.
ProvinceMetropolitan City
The local body is made up of a group of neighboring municipalities, the most important of which constitutes the capital city (the capital cities can also be more than one per province). Provinces are an intermediate local authority between municipalities and regions. The provinces with the ordinary statute are governed by the Legislative Decree 267/2000 and already existed before the unification of Italy. Each province belongs to a region (except the autonomous provinces of Trento and Bolzano). With Law No. 56 of 7 April 2014, the provinces in regions with ordinary statutes were transformed into second-level administrative bodies.The metropolitan city is one of the local territorial bodies established with the constitutional reform of 2001 (constitutional law No. 3/2001). It is made up of a group of neighboring municipalities, the most important of which constitutes the capital. The metropolitan mayor coincides with the mayor of the capital, while the metropolitan council is a second-level elected body. In 2014, the metropolitan cities of Rome, Turin, Milan, Venice, Genoa, Bologna, Florence, Bari, Naples and Reggio Calabria were established to replace the related provinces. Afterwards, also the metropolitan cities of Cagliari, Palermo, Messina and Catania in the regions with special status were established.
Table 3. Results of comparative readings among ISTAT SDG indictors and sub-regional SDG indicators for all SDGs (2020 reports edition) (elaboration made in May 2020) (Source: [63]).
PoliS-Lombardia [28] IndicatorsASviS [60] IndicatorsFEEM Capital City [61] IndicatorsFEEM Province [62] Indicators
Istat SDGs Indicators (Number)IdenticalI-ProxyII-ProxyIdenticalI-ProxyII-ProxyIdenticalI-ProxyII-ProxyIdenticalI-ProxyII-Proxy
SDG1 (21 indicators) 2 2 11 1
SDG2 (16 indicators)1
SDG3 (33 indicators) 2 5 41 6
SDG4 (31 indicators) 1 37 51341
SDG5 (16 indicators) 2 1 2
SDG6 (16 indicators) 11 31 1
SDG7 (13 indicators)1 2 11 22
SDG8 (29 indicators)11 5 1 21
SDG9 (25 indicators) 1 2 2
SDG10 (15 indicators)11 11 1 1
SDG11 (30 indicators) 1 11 51 21
SDG12 (19 indicators)1 1 1 1
SDG13 (13 indicators) 2 211 2
SDG14 (4 indicators)
SDG15 (22 indicators)1 1 1
SDG16 (16 indicators)1 2 1112
SDG17 (9 indicators) 1 1 3
Total711311206321982510
Publisher’s Note: MDPI stays neutral with regard to jurisdictional claims in published maps and institutional affiliations.

