Article

The Effects of Subsidies on MSW Treatment Companies: Financial Performance and Policy Implications

Centre of Applied Research in Management and Economics, Polytechnic Institute of Leiria, 2411-901 Leiria, Portugal
*
Author to whom correspondence should be addressed.
Sustainability 2022, 14(5), 3076; https://doi.org/10.3390/su14053076
Submission received: 9 February 2022 / Revised: 28 February 2022 / Accepted: 2 March 2022 / Published: 7 March 2022
(This article belongs to the Section Economic and Business Aspects of Sustainability)

Abstract

:
Companies that provide public services usually receive subsidies from municipalities as compensation for replacing the latter in their functions as public service providers. However, the managers of those companies are not always interested in maintaining an economically sustainable company, as this implies turning off the tap on exploration subsidies. This article investigates the effect of subsidies on the financial performance of municipal solid waste collection and treatment companies for 2016–2020 and across NUTS II regions. The accounting data of 680 companies retrieved from the SABI database, make it possible to assess the economic sustainability of the companies through financial ratios and operational data. The results show that the financial structure and management of companies in the Centro, Lisbon, and the Azores allowed to take advantage of exploration subsidies to achieve economic sustainability. In the remaining regions these subsidies proved to be ineffective. These results have implications for managers and policy makers insofar as it sheds a light on the conditions under which subsidies contribute to the economical sustainability of companies in the sector.

1. Introduction

The growing trend of urbanization has contributed to an exponential growth in the generation of urban solid waste (MSW) [1]. Since the 1970s, the overexploitation of natural resources has led to overcoming the limit of ecosystems’ ability to regenerate [2]. The predominant linear production model, the so-called cradle-to-grave model, consists of extracting resources, transforming them and discarding them in landfills or incinerators [3]. However, if waste is not collected properly, environmental problems can occur with negative impacts on public health. At the same time, the existence of different regulations and the increasing awareness of consumers regarding the ecological impacts of waste disposal in landfills have pushed the waste management industry towards a more sustainable approach [4]. In this context, strategies to ensure environmental sustainability include addressing the circularity of materials, minimizing waste. In addition, concerns about the economic, social and environmental impacts of waste generation must be integrated into waste management plans, which range from the initial stages of waste collection to the final phase of reducing the mass of solid waste, passing through the careful selection of waste disposal technology [5]. Currently, one of the most acclaimed solutions is to promote the conversion of waste into another processing resource [6], resulting in cleaner production, energy efficiency, water savings, minimization of resource extraction and optimized use of materials, which translate into economic and environmental benefits. [7]. However, the transition to a Circular Economy (CE) model requires a systematic change in business approaches [8] that allows the generation of profits without compromising environmental sustainability. The concept of CE is incorporated into a new business model that leads companies to sustainable development without compromising economic sustainability, the so-called Circular Economy Business Model (CEBM) [9]. In this approach, sustainability is not dissociated from economic growth, but represents a factor of competitive advantage and value creation [10]. The economic advantages resulting from the adoption of circular practices are demonstrated in some empirical studies. For example, one study [11] underlines that CE can enable companies to achieve eco-innovations and industrial symbiosis. Another study for China [12] showed that disclosure of information about 3R activities (Reduce, Reuse, Recycle) can send a positive signal to shareholders and contribute to greater green competitiveness, thus achieving higher rates of sustainable growth and return on equity (ROE). In addition, CE practices allow investors to better understand the environmental sustainability of their companies and operations, enabling them to better identify risks and make more effective investment decisions. Assessing the sustainability of CE practices is also useful for regulatory and supervisory authorities to identify companies that are likely to develop optimal sustainability strategies. In this context, small and medium enterprises (SMEs) can make important contributions to CE, as they can be particularly active in areas such as recycling, repair and innovation [13].
In Portugal, there were 23 urban waste management systems (SGRU) scattered around the mainland in 2020, with greater production in the most populous regions. However, the recycling rate is still relatively low in the country. According to the Portuguese Environmental Protection Agency (APA) [14], in 2020, the generation of MSW in the mainland corresponded to an annual capitation of 512 kg/(inhab.year), that is, a daily production of 1.40 kg per inhabitant. The total of 5.01 million tons represented an increase of 0.1% compared to the previous year. In regional terms, the collection is higher in Alentejo and the Algarve due to tourist seasonality.
The fact that most MSW collection remains undifferentiated can be explained, on the one hand, by the exclusive focus on paper, cardboard, glass, metal and plastic; and on the other hand, because the waste industry requires a large amount of labor in different parts of the product’s life cycle. Therefore, it is not surprising that the most common way of dealing with MSW continues to be dumping or disposal of waste in landfills.
Despite the social importance of these activities, there is a persistent gap in the literature on the economic sustainability of waste collection and treatment companies. This paper attempts to fill the gap through the assessment of the economic sustainability of these companies (NACE 38.0) in 2016–2020, through six management ratios. The analysis of the five-year period will provide further understanding on the latest trends on how operations are affected in terms of profitability, liquidity, debt and investment risk. In addition, the eventual financial success of these companies could constitute an indicator of green competitiveness and contribute to a higher rate of compliance with CE practices in other sectors in the economy. Furthermore, as the waste collection activity is entitled to some exploration subsidies, we discuss the role of these in explaining the discrepancies found in the financial performance of these companies. Thus, this paper also attempts to contribute to the discussion on the need and impact of subsidies on the financial performance and economic sustainability of sectoral companies.
After the introduction, Section 2 carries out a literature review. Information on the data source and empirical framework is provided in Section 3. In Section 4, the results are presented, and Section 5 discusses the results. In Section 6, some conclusions are drawn.

2. Literature Review

The barriers to the implementation of the CE and the challenges to the activity of these companies require the adoption of medium- to long-term business strategies aiming at achieving competitiveness and growth.

2.1. Barriers

Barriers to implementing the CE can be grouped into cultural, political, financial, technological and organizational. Several studies point to the lack of interest and awareness of consumers to issues related to the environment as the main obstacle to the implementation of CE [15,16,17,18,19,20]. There are two main reasons for this behavior. First, there may be a perception that products derived from secondary, recycled or remanufactured materials are of inferior quality when compared to products produced from primary materials [15,16,19,21,22], discouraging companies from using them in the manufacture of their products. Second, for economic reasons, consumers prefer cheaper products, regardless of their environmental impact [23,24]. Additionally, there is a generalized perception among society that compliance checks on environmental protection laws are negligent [18,25,26]. Furthermore, there is limited regulation to support the use of recycled materials [22], and some legislation hinders the transition to CE by prohibiting certain products from containing recycled materials [15,19,24].
A third barrier is the lack of government intervention to accelerate the transition, translated by the absence of economic incentives (e.g., exemptions, tax benefits or subsidies) for the implementation of circular production systems [17,18,19,20,24,27].
The main financial barrier is related to the high initial costs of “cleaner” technologies, compared to conventional technologies [15,16,17,18,19,20,21,22,24], for example, the costs associated with returning and collecting products at the end of their useful life [25], the costs related to the separation of waste [27], and those related to the disassembly of products for later recycling and/or reuse of materials [25]. Other studies highlight the lack of awareness of the economic and environmental benefits of circularity for the organization [21] and the lack of effective measures to assess the financial performance of circular production [16,26] as financial barriers to the implementation of CE. A third example of financial barriers is the lower price of “virgin” materials compared to the price of recycled materials [15,17,19,24]. Moreover, trade agreements worldwide are designed to stimulate economic development, which imply that goods should be manufactured at highly competitive prices, ruling out the use of goods produced in circular operating systems [24]. As a consequence, products are typically conceived to maintain low costs by being easy to manufacture and, sometimes, difficult to repair and/or reuse [17,24,25]. As most companies still operate in a linear system and possess very conservative supply chains, products are designed to be discarded at the end of their lives [19,24]. The need for new product designs and conceptions in order to guarantee their longevity, disassembly and reuse requires structural and technological (costly) changes within organizations that impact on the whole organization and on the business model [16,18,19,24,25,27,28], and on the need to implement reverse logistics systems that allow the collection of products at the end of their useful life [25,29]. Another obstacle is claimed to be the poor collaboration and communication between departments and employees in the organization [15,16,21,24,26]. Finally, uncertainties as to the ability to supply high-quality remanufactured products are pointed to as another barrier to the implementation of CE [19,21,22].
In most firms, managers privilege the expansion of production capacity and the increasing of the market share over the implementation of cleaner systems [16,23]. Indeed, the move to CE requires investment in “cleaner” technology, resulting in additional costs, which, in the short term, may harm the competitiveness of companies [16,18,24,30]. In addition, managers often lack the administrative or technical capacity to implement these systems [21]. For example, they may lack trained employees [21], or the availability of new resources and skills [15,16,18,19,20,21,24,26,27,28]. A third organizational and management obstacle is the risk and change aversion on the part of managers to invest in circular models [16,18,21,30]. Furthermore, there is still some inertia when it comes to considering new business models or sustainability as strategic issues, as well as moving from a dominant product-orientation to a product–service system orientation, that is, a combination of product and service to meet customers’ needs [21]. As a consequence, CE is often not integrated into the organization’s strategy [16,19,24]. Finally, some companies find it difficult to cooperate with other companies and stakeholders, namely to build industrial symbiosis in order to facilitate the transition to CE [15,17].
The research on barriers to CE has been carried out in different contexts, leading to different results. Recent literature indicates the prominence of cultural barriers as the main obstacles to CE implementation. Indeed, most authors [19,31,32,33,34,35] found that the “lack of consumers’ interest and awareness”, “hesitant company culture”, “lack of appropriate partners in supply chains”, and “difficulties of demonstrating a strong business case for circular models” are the main barriers to CE. Ranking in second, the political barriers such as the “lack of environmental laws and regulations”, “lack of preferential tax policies for promoting the circular models”, “lack of support from public institutions”, “the costs of meeting regulations/legal standards” and “complexity of legal procedures” are found to be key challenges to modern companies [20,35,36,37,38]. Financial barriers rank in third position. Indeed, some reasons for not implementing CE are described in the literature as “costs and financial constraint”, “investment and cost–benefit”, and “higher costs for management and planning” [31,32,35,37]. Subsequently, the main barriers are pointed to as being of organizational and management nature, such as “administrative processes”, “lack of human resources” [32,37,38]. In addition to the barriers to the implementation of CE, waste collection and treatment companies are subject to failures that prevent the sustainability of their management structure. Such obstacles can be seen from different perspectives: economic, technical, social and environmental [39]. The social perspective relates to aspects of living standards and low socio-ecological awareness, the complexity of communication and consequent inadequate assessment of stakeholders regarding the adoption of technologies [40,41,42,43]. There are also policy and regulatory issues related to the lack of capacity of local governments, lack of norms, policies and guidelines, lack of transparency and reliability [44,45]. In environmental terms, there is the issue of inappropriate waste disposal, the concern of incinerators emitting toxic substances and the inherent risk of affecting the ecosystem [44,46,47] and the issue of infrastructure and energy consumption, which are mainly related to the fact that conventional sources are non-renewable and imply high energy consumption [42,48,49,50].
The economic aspects consider the budget for the development and maintenance of operations [43,44,51,52] and urban architecture related to population decline [41,42,51,53,54], while technical aspects are related to smart technologies [43,48,52,55] and human resources issues [55,56]. In particular, artificial intelligence and the Internet of Things are still not able to handle resource management, creating a gap in data management. Human resource issues are related to the lack of technical knowledge and skilled labor and the integration of operations management.

2.2. Sustainability Policies and Financial Performance

Evaluating corporate financial performance is important for identifying success, confirming the known and estimating the unknown, monitoring progress, understanding the nature of processes and associated issues, establishing new objectives and targets, designing future measures to be taken, and prioritizing objectives [57]. In this context, some studies focus on business performance [58,59,60,61]. The relationship between sustainability and corporate financial performance has been a widely debated topic. However, the empirical results on the impact of sustainability practices on the profitability of companies are far from conclusive. For example, a content analysis for 132 studies [62] concludes that: (1) there is a positive relationship between corporate sustainability and financial performance in 78% of the cases, and (2) different methodologies and measurement of variables may lead to different results. Some studies claim that CE practices can induce profitability (e.g., [11,12,63,64,65]), while another study opposes that the linear production model induces higher rates of profitability [66]. A third line of studies, despite recognizing that the linear production model returns greater profits, present evidence that implementing CE practices may increase corporate profitability [67,68].
One way to achieve a superior financial performance is involving the value chain in the CEBM model [69], exploring new markets and reducing costs through process innovation and low environmental fees [18]. Companies can increase sales by selling waste as an input to another industry [70] and introducing new green products to the market. Furthermore, companies committed to CE can build a reputation as a way to gain competitive advantages [71]. A study [72] using a natural resource-based view found a positive relationship and a partial bidirectional direction between environmental and financial performance, with the relationship being stronger when the approach to environmental performance is proactive. Another study [73] using a sample of 235 banks for 2007–2016, the independent variable being the disclosure of environmental performance and the dependent variables being the performance indicators measured by return on assets, return on equity, and Tobin’s q, concludes that there is a significant and positive impact of the disclosure of environmental sustainability practices on corporate performance. Other authors [74], using a resource-based function and a questionnaire applied to 364 managers, conclude that environmental ethics and environmental training positively impact the competitive advantage of companies, with environmental training driving the impact of environmental ethics on competitive advantage. Xie et al. [75], in a content analysis for 209 manufacturing companies, conclude that green process and product innovation can improve companies’ financial performance. Another study [76] using data envelopment analysis estimates the overall sustainability impact on corporate efficiency, as measured by return on assets and market value. The authors conclude that most environmental and social sustainability activities have a non-negative impact on companies’ financial performance. Bhaskaran et al. [77], using data for 4887 global companies and a two-stage least squares estimator, conclude that social sustainability practices exert a positive effect on company performance.
Another study [78] for China finds a positive and significant relationship between green patents and company performance. However, this relationship only exists in state-owned companies and, especially, since 2006, when the government began to provide formal legislative support to the green industry. Delmas et al. [79], performing an analysis for 1095 companies during 2004–2008, estimated the effect of measures to reduce greenhouse gases on financial performance. The authors concluded that environmental improvements cause a decline in short-term financial performance as measured by return on assets. However, they found a positive long-term effect of environmental improvements on company performance as measured by Tobin’s q. Misani and Pogutz [80], using a sample of carbon-intensive production companies that might cause the greenhouse effect, and measuring financial performance by Tobin’s q, conclude that companies in middle stages of carbon usage exhibit the highest financial performance. Alexopoulos et al. [81] measuring environmental performance through accounting data, and using return on assets and return on sales as performance indicators, conclude that better financial performance is associated with fewer investments in environmental sustainability. However, the superior financial performance allows to achieve a better environmental performance. The characteristics of companies and the market significantly shape the causal relationship between environmental and financial performance. Finally, Ho [82] uses CSR awards as indicators of sustainability practices and concludes that financial results are superior when companies do not engage in CSR initiatives.
A standard method for assessing corporate performance is through financial analysis. Annual reports are important sources of data, as they comprise operational and financial records and reviews or managerial discussions and analysis that allow calculating financial ratios related to profitability, liquidity and debt that are essential for measuring financial performance.

3. Materials and Methods

Corporate sustainability practices are based on a three-way strategy: transparency, stakeholder engagement and vision of the future. The first is based on the belief that an engaging environment within a company through open communications (i.e., high levels of information disclosure, clarity and accuracy) will improve performance and increase profits. The second can be achieved by increasing the ecological literacy of staff and stakeholders. Finally, the third can be achieved by stimulating the generation of ideas to reduce production costs and/or increase profits.
This paper uses firm-level financial ratios to assess financial positions in the private sector. It is assumed that better financial performance is positively related to greater economic sustainability. Bearing in mind the results of the literature review, one might expect that companies engaged in waste collection, treatment and disposal activities can provide a good example to assess the relationship between the adoption of circular practices and economic sustainability. As described above, the need of these companies to make large investments in clean energy sources provide the argument to assume that:
Hypothesis 1 (H1).
Companies operating in waste collection, treatment and disposal activities present high Debt levels to finance their activities.
In view of government subsidies to finance these companies, to meet its long-term goals of helping companies, managers may find a motivation to exhibit worse financial performances. Hence, we assume that:
Hypothesis 2 (H2).
Companies with subsidies exhibit worse financial performances than companies without subsidies.

3.1. Data Collection

Of the 1397 companies that operate in waste collection, treatment and disposal activities (NACE rev. 2—code 38) identified in the SABI database, after excluding companies with missing data, we ended with an unbalanced data panel with 680 companies, for 2016–2020. The number of companies operating in this sector in Portugal represents only 0.1% of the total number of Portuguese companies but contributes 1.7% to the gross value added (National Statistics Office—INE). The regional distribution of the sample, and the population density across regions is shown in Table 1.
Our sample has a good representation of companies in this sector since the percentage of regional structure given by INE for the year 2020 is similar to our percentage of observations, with the exception of the Centro, Lisbon and Alentejo. Lisbon is the capital of Portugal and is the region with the highest population density, attracting most companies in the sector. The regions of Lisbon, Madeira and the north are the most densely populated; while the Azores, the Algarve and Centro are less populated. The least populated region is Alentejo. The analysis of population density by region is relevant to assess possible balances between revenues and operating costs of these companies as there should be a minimum operational cost that requires a minimum revenue to break even, which may not be possible in some less populated regions. Thus, municipalities of these regions may give subsidies to compensate the high operating costs and low revenues from a declining population.
Lisbon and the north regions concentrate 68% of companies in the sample. The central region ranks in 3rd position but represents only 18.1% of the total number of sectoral firms and ranks in 6th in terms of population density.
Firm size, measured by the number of employees, is considered in this analysis since it can impact the company’s performance. Figure 1 shows the sample distribution by company size.
Micro-enterprises (less than 10 employees) represent 68% of the sample and are the most representative type of enterprise in all regions. Small companies (with 10–50 employees) have a share of 25% in the sample. Small companies are more representative in the islands and in the north region, compared to the rest of the country. The share of large companies (more than 250 workers) is only 2%, and this type of company does not exist either on the islands or in the Algarve.

3.2. Method

To assess the financial performance of companies we use 6 financial ratios, following [54,55,56], and perform a numerical and narrative analysis. A period of 5 years is used to understand trends and evolution of corporate performances. Data were retrieved from SABI. We focus on four groups of ratios: profitability, liquidity, capital structure (also called leverage) and investment risk.
Profitability aims to understand whether companies are efficient in using their investments to generate profits. All companies aim at generating returns [55]. The lower the profitability of the company, the greater the probability of default [56]. The most relevant ratios are ROA (return on assets) and ROE (return on equity) [54]. ROA shows the ability of companies to generate profits from the investment made, providing relevant information to all stakeholders.
ROA = Net   income Total   assets ,
It must be positive, otherwise the company has losses.
ROE represents shareholders’ returns as it measures the company’s ability to generate profits using shareholder financing.
ROE = Net   income Total   equity ,
It must be positive, but not a false positive, i.e., both net income and equity must be positive.
Liquidity ratios allow understanding the company’s ability to pay current obligations using current assets. Short-term creditors are the ones who are most concerned about this information [55]. The higher the liquidity, the lower the probability of default, as companies can meet their obligations [56]. In this work, we use the current ratio:
Liquidity = Current   assets Current   liabilities ,
It must be greater than 100% so that the company can cover short-term debt without raising external capital. The capital structure shows whether the companies can pay their credits. It provides information about the financial structure of the company [55]. We use debt and solvency ratios. The debt ratio measures the company’s indebtedness, that is, the part of the company’s assets that is financed through liabilities. The greater the indebtedness of the company, the greater the risk of failure, as companies find it more difficult to comply with their financial commitments.
Debt = Total   liabilities Total   assets ,
Debt must be less than 100%, otherwise it means that the company has negative equity (accumulated losses from previous years) and, in theory, they should have less than 70% to assure the ability to pay debts in the future.
Solvency measures the company’s ability to meet liabilities using equity. Creditors prefer a higher solvency ratio, because low solvency ratios mean that liabilities may not be paid due to insufficient capital.
Solvency = Total   equity Total   liabilities ,
It should be positive and as high as possible.
Investment risk is a ratio of EBITDA (earnings before interest, taxes, depreciation and amortization) to EBIT (earnings before interest and taxes) and shows how much depreciation impacts the operating income. We included this index to understand companies’ ability to make new investments.
Inv .   Risk = EBITDA EBIT ,
The investment risk must be greater than 100%, but if it is too high, it means that depreciations have a big impact on profits, decreasing the company’s profits. Companies need to make investments in order to grow, although this increases depreciation, causing a decrease in net income.

4. Results

Table 2 shows the descriptive statistics of accounting information, namely wages and fuel costs (the most representative operating costs of this activity), turnover, subsidies, and net income from income statement, total assets, and total equity from the balance sheet, and the number of employees and capital expenditures (CAPEX). The annual number of non-refundable subsidies corresponds to government support in which there is an individualized agreement towards its concession, if certain conditions are met. Financial statements do not disclose what these conditions are. CAPEX allows to understand the firm’s investment in physical assets such as property, plants, buildings, technology, or equipment.
A large dispersion is observed among the companies, as the standard deviation is high for all variables. At the median, the number of employees is 5 (the average being 26 employees). There are some companies without employees, perhaps because these companies use subcontracts. Regarding turnover, while some companies have EUR 0, not indicating sales or services in that year, another has a maximum value of EUR 77,924,553.10. Wages and fuel represent, on average, 20% of the turnover. Some companies receive annual (non-refundable) subsidies from the government, but this is more of an exception than a reality, as the median is zero. In addition, companies have, on average (and median), positive net income and equity. However, not all companies exhibit profits and some are over-indebted, as the total capital is negative (minimum total capital = EUR −5,626,967.10) which means that the debt is financing not only the assets of the companies but also negative equity. Finally, most companies invest in tangible and intangible assets (Capex = EUR 192,100.70 on average), but there are exceptions as the minimum is negative, suggesting disinvestments. Descriptive statistics of financial ratios are presented in Table 3.
Table 3 continues to show a large dispersion among the companies in the sample, as the financial ratios present a large standard deviation. On average and median, companies are profitable (ROA = 85.5%|2.4% and ROE = 12.4%|8.3%, on average and median respectively), and have liquidity, as this index is on average (and median) above 100%, indicating that current assets are enough to cover current liabilities. However, companies are highly indebted, as the debt ratio is greater than 100%, suggesting that many companies have negative equity. Thus, liabilities finance not only all of the company’s assets but also the total negative equity.
Regarding solvency, on average, companies are solvent, as the total capital covers the total liabilities; however, in the median, total capital covers only 59.6% of liabilities, confirming that several companies are heavily indebted. Investment risk is high, which means that depreciations have a big impact on company profits. These facts suggest that some companies do not have a stable financial situation, which poses problems to the economic sustainability of these companies.
To assess whether subsidies granted by the government help companies in the activities of collection, treatment and disposal of waste to achieve a superior performance, namely in terms of profitability, we compare two groups of companies: without and with non-refundable subsidies. As the data are not normally distributed (according to the Kolmogorov–Smirnov test), the medians of both groups are compared, using the nonparametric Mann–Whitney test to verify whether they are similar. It is important to identify that only 20.2% of companies receive subsidies. The results are presented in Table 4.
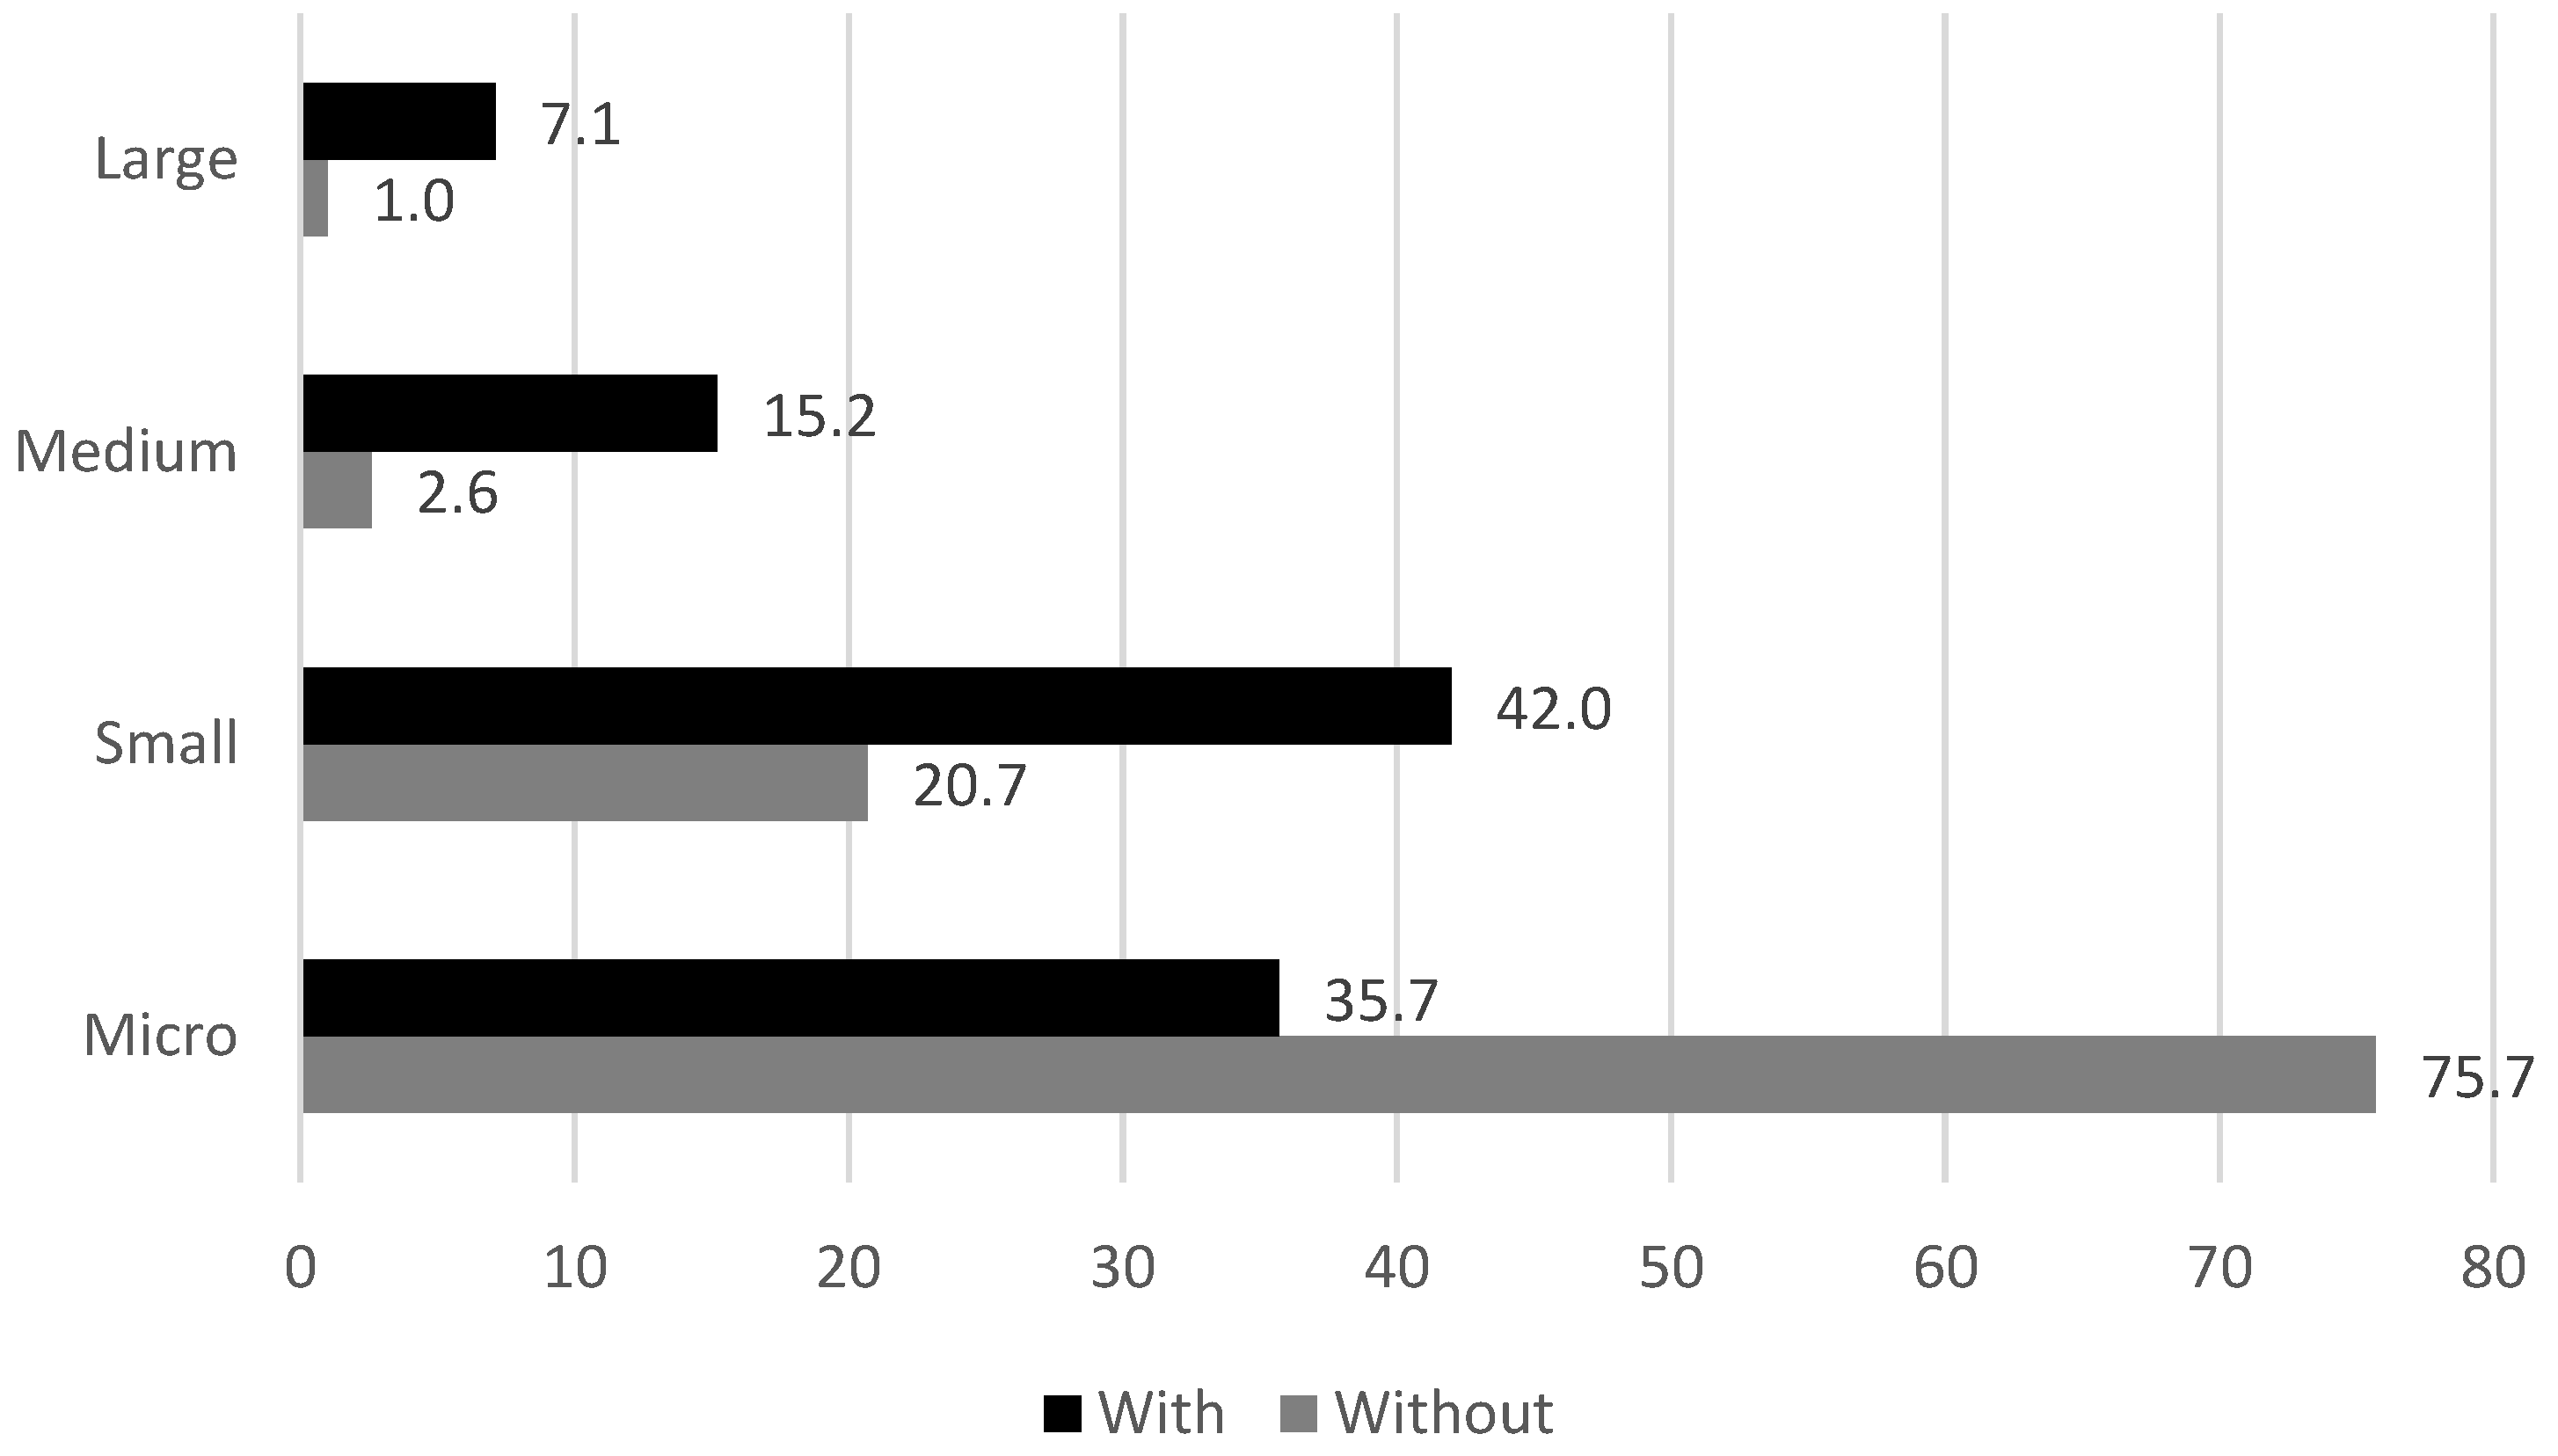
Regarding the impact of subsidies, Table 4 shows that there are significant differences in the average values of both groups, as well as for financial ratios except ROA, debt, and solvency. At the median, companies that receive subsidies employ more people, have more revenue, net income, total equity, total assets, and have more capital expenditures (CAPEX). However, in relation to financial ratios, companies that receive subsidies do not exhibit a better financial performance. At the median, ROA is positive and similar for both groups, but ROE is higher for companies without subsidies (8.7% vs. 6.8%). Companies without subsidies also have more liquidity, less debt, more solvency and less investment risk. When analyzing the structure of the most representative operating costs (wages and fuel), we find that the lower liquidity and solvency of companies with subsidies is due, at least in part, to the higher share of operating expenses in those two items, compared to companies that did not receive subsidies. However, it is important to point out that the group of companies without subsidies is very heterogeneous. These differences about the two groups of companies can also be explained by firm size. Figure 2 shows the sample distribution by size, measured by the number of employees.
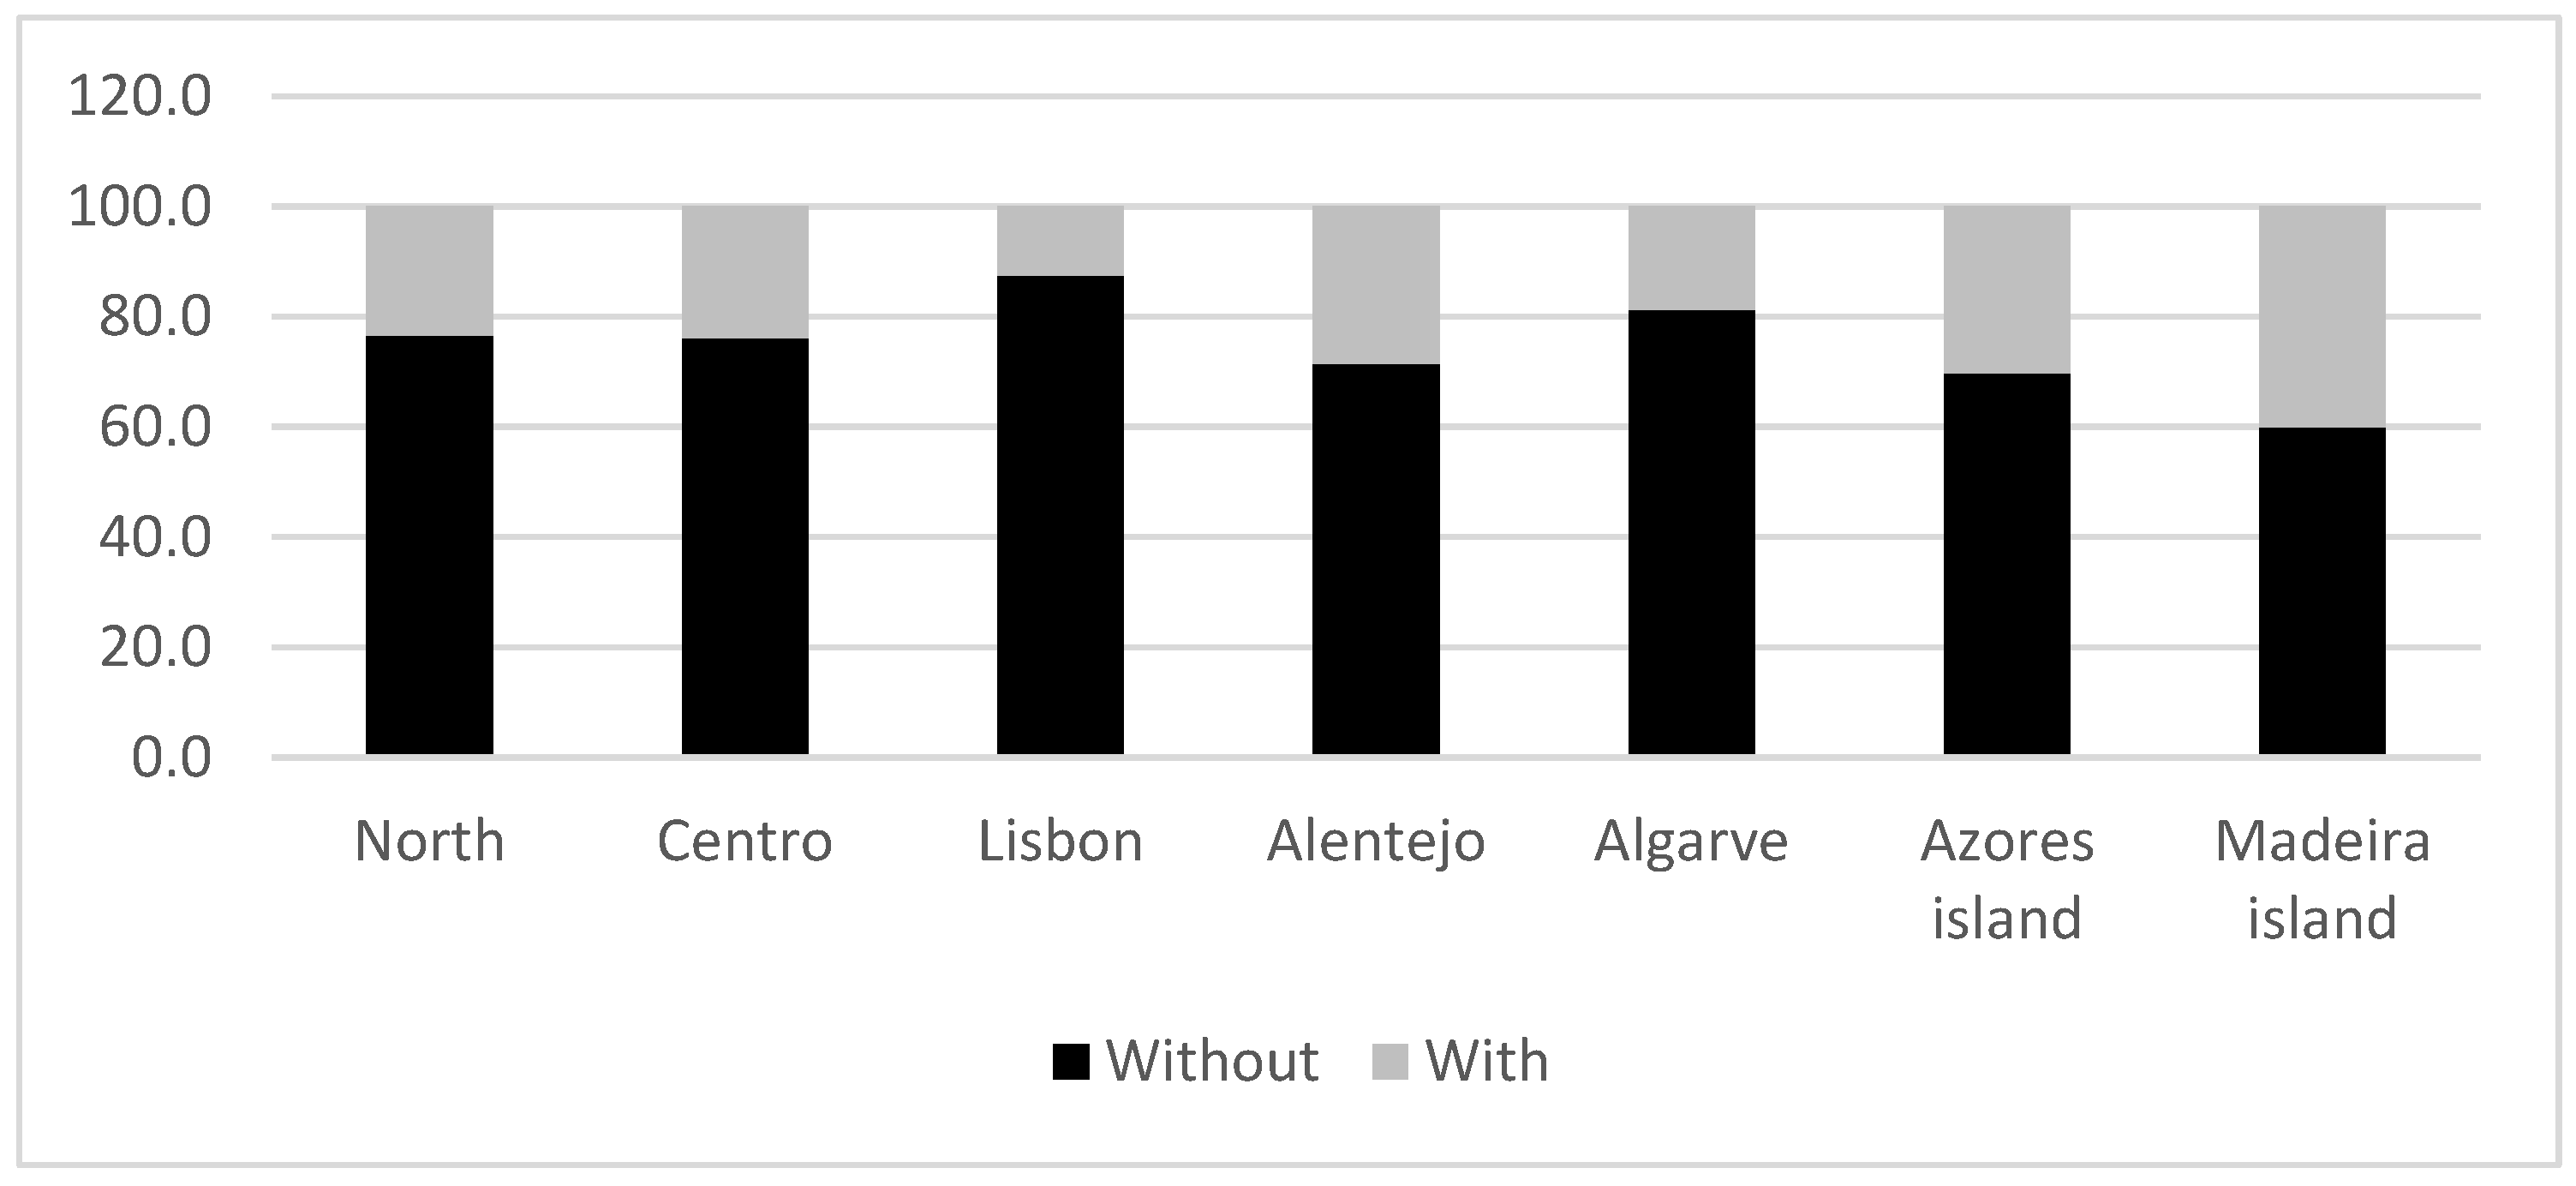
Figure 2 shows that most companies without subsidies are micro companies (with less than 10 employees), suggesting that size can impact results, as micro companies tend to have a less stable financial situation. It is interesting to note that the share of companies with subsidies in relation to those that did not receive subsidies decreases with the size of the company. Thus, large companies with subsidies are seven times more than those without subsidies, while the magnitude is 6 for medium-sized companies, 2 for small companies and less than half for micro companies. Figure 3 shows the regional distribution of companies with and without subsidies.
Most subsidies are awarded to companies located on the islands, followed by Alentejo. Lisbon, where most companies operating in this sector are located, is the region with the lowest percentage of companies receiving government subsidies.
The analysis of Table 5 can provide more details on the relative structure of the most representative operating costs (wages and fuel costs) of these companies by region, and by subsidies received. One can observe that companies that receive subsidies have a much higher share of costs with wages and fuel. Madeira is a paradigmatic case, in which, for example, companies without subsidies do not pay salaries while companies that received subsidies have an average cost of EUR 396,000.
Figure 4 analyzes the evolution of the ratios (median values) per year for companies with and without subsidies. The specific case of micro-enterprises is also analyzed, as it is the type of company that prevails in the sample. When companies do not receive subsidies, their financial situation is more stable over time compared to companies that receive subsidies. Subsidies last a certain period, and there are no certainties of its renewal, so companies have a financial situation when they receive the subsidy, but this situation is not maintained in other years. In addition, these companies, from 2017 to 2020, improved their financial performance. The joint analysis of Figure 3 and Figure 4 suggests that the region where companies operate may have a mediating effect on the impact of subsidies on the financial performance of companies.
Companies that receive subsidies, especially micro-enterprises, show greater variations in financial performance characterized by periods with greater returns, liquidity, solvency and lower debt and investment risk, altering with periods in which they exhibit an inverse performance. This suggests a lack of management capacity or permanent operational difficulties inherent to certain regions that make financial performance dependent on the year in which the company receives subsidies.
Furthermore, as Table 1 showed that Madeira Island is a more densely populated region, while the Azores and Alentejo are among the least populated regions, it raises the question of why subsidies were allocated in Madeira. In the Azores and Alentejo, the reason may be related to imbalances between costs and revenues from low-populated regions.
Eventually, the decision to subsidize Madeira’s companies will be more related to political reasons than possible real needs of companies in those regions. Or perhaps Madeira operations are carried out using more modern technologies that require greater investments in machinery and equipment, jeopardizing the viability of these companies and justifying the granting of subsidies.
Table 6 may help to clarify this, by presenting the average values of financial indicators by region for companies with and without subsidies. In particular, the reason for the attribution of subsidies being the investment in assets (machinery and equipment) can be checked through the analysis of ROA of companies with and without subsidies, since this indicator shows the ability of companies to generate profits from the investments made. We find that, in slightly more than half of the cases, companies without subsidies show a better financial performance than companies with subsidies, suggesting that companies with subsidies are not using them in the best way to improve their economic sustainability. Analyzing this in detail in regional terms, and starting with Madeira, being a populated region, the companies can rationalize the waste collection activities and obtain economies of scale in their operations.
Subsidized companies in Madeira have the highest solvency levels and rank second in terms of liquidity in the country but exhibit the worst performance in terms of economic and financial profitability. In relation to companies without subsidies, companies have the best solvency levels and the lowest level of indebtedness, and greater investment risk. Comparing the performance of the two types of companies, those that did not receive subsidies also show low levels of indebtedness and high solvency. Thus, the analysis suggests that the subsidies helped to obtain solvency and liquidity but did not improve economic and financial profitability, that is, they were not effective. This is evident in the better performance of non-subsidized companies in terms of economic and financial profitability.
Subsidized companies in the Azores show the highest economic and financial profitability in the country, but also the highest level of indebtedness. This happens not only in comparison with companies from other regions but also with those companies in the region that did not receive subsidies. Thus, this shows that subsidies were effective in the Azores, contributing to the economic and financial profitability of companies, although they did not prevent companies from falling into debt.
Northern companies are the second most indebted. They show high levels of indebtedness whether they are subsidized or not, but those that do not have subsidies also show greater investment risks. Thus, we can say that the subsidies did not help them to improve the situation of high indebtedness.
Subsidized companies in the Centro rank in second regarding solvency, while companies without subsidies show the highest liquidity and rank in second in terms of solvency. Comparing the performances of subsidized companies with those that did not receive subsidies, it seems clear that the subsidies have made it possible to improve economic and financial profitability, liquidity and solvency. Companies without subsidies show greater indebtedness and greater investment risk. Thus, the role of subsidies in the central region was effective in improving the financial performance of these companies.
Subsidized companies in Lisbon rank second in terms of economic and financial profitability, while companies without subsidies only have the second highest economic profitability. Thus, the subsidies seem to have contributed to improve the financial profitability of companies in the Lisbon region.
In Alentejo, subsidized companies presented the highest investment risk and the worst performance in terms of economic and financial profitability. In relation to companies without subsidies, they show the highest level of indebtedness and the worst performances in terms of economic and financial profitability, liquidity, and solvency, but lower investment risks. Comparing the two types of companies, we can see that companies with subsidies exhibit a poor performance in terms of financial profitability and present high investment risks, while companies that do not have subsidies in addition to poor performance in terms of financial profitability also show weak economic profitability (ROA), low levels of liquidity and solvency, but present the lowest level of investment risk.
In the Algarve, companies with subsidies rank second in terms of investment risk and exhibit the lowest levels of liquidity. Companies without subsidies have the best economic and financial profitability and higher levels of liquidity. Thus, results suggest that subsidies have contributed to making investments at the expense of the company’s liquidity without resulting in a corresponding economic and financial profitability. This suggests that subsidies are not effective in the Algarve.

5. Discussion

Here, we discuss the results vis-à-vis the established hypotheses. We start to discuss and validate H1 considering the barriers to operational activity. Subsequently, we discuss and validate H2 in the framework of the agency theory and discuss the effects of subsidies at a regional level. The objective of this section, besides validating our hypotheses, is to provide hints on ways to overcome barriers, and to contribute to the discussion on the need to attribute subsidies to these activities.

5.1. Barriers to Operating Activity and Corporate Indebtedness

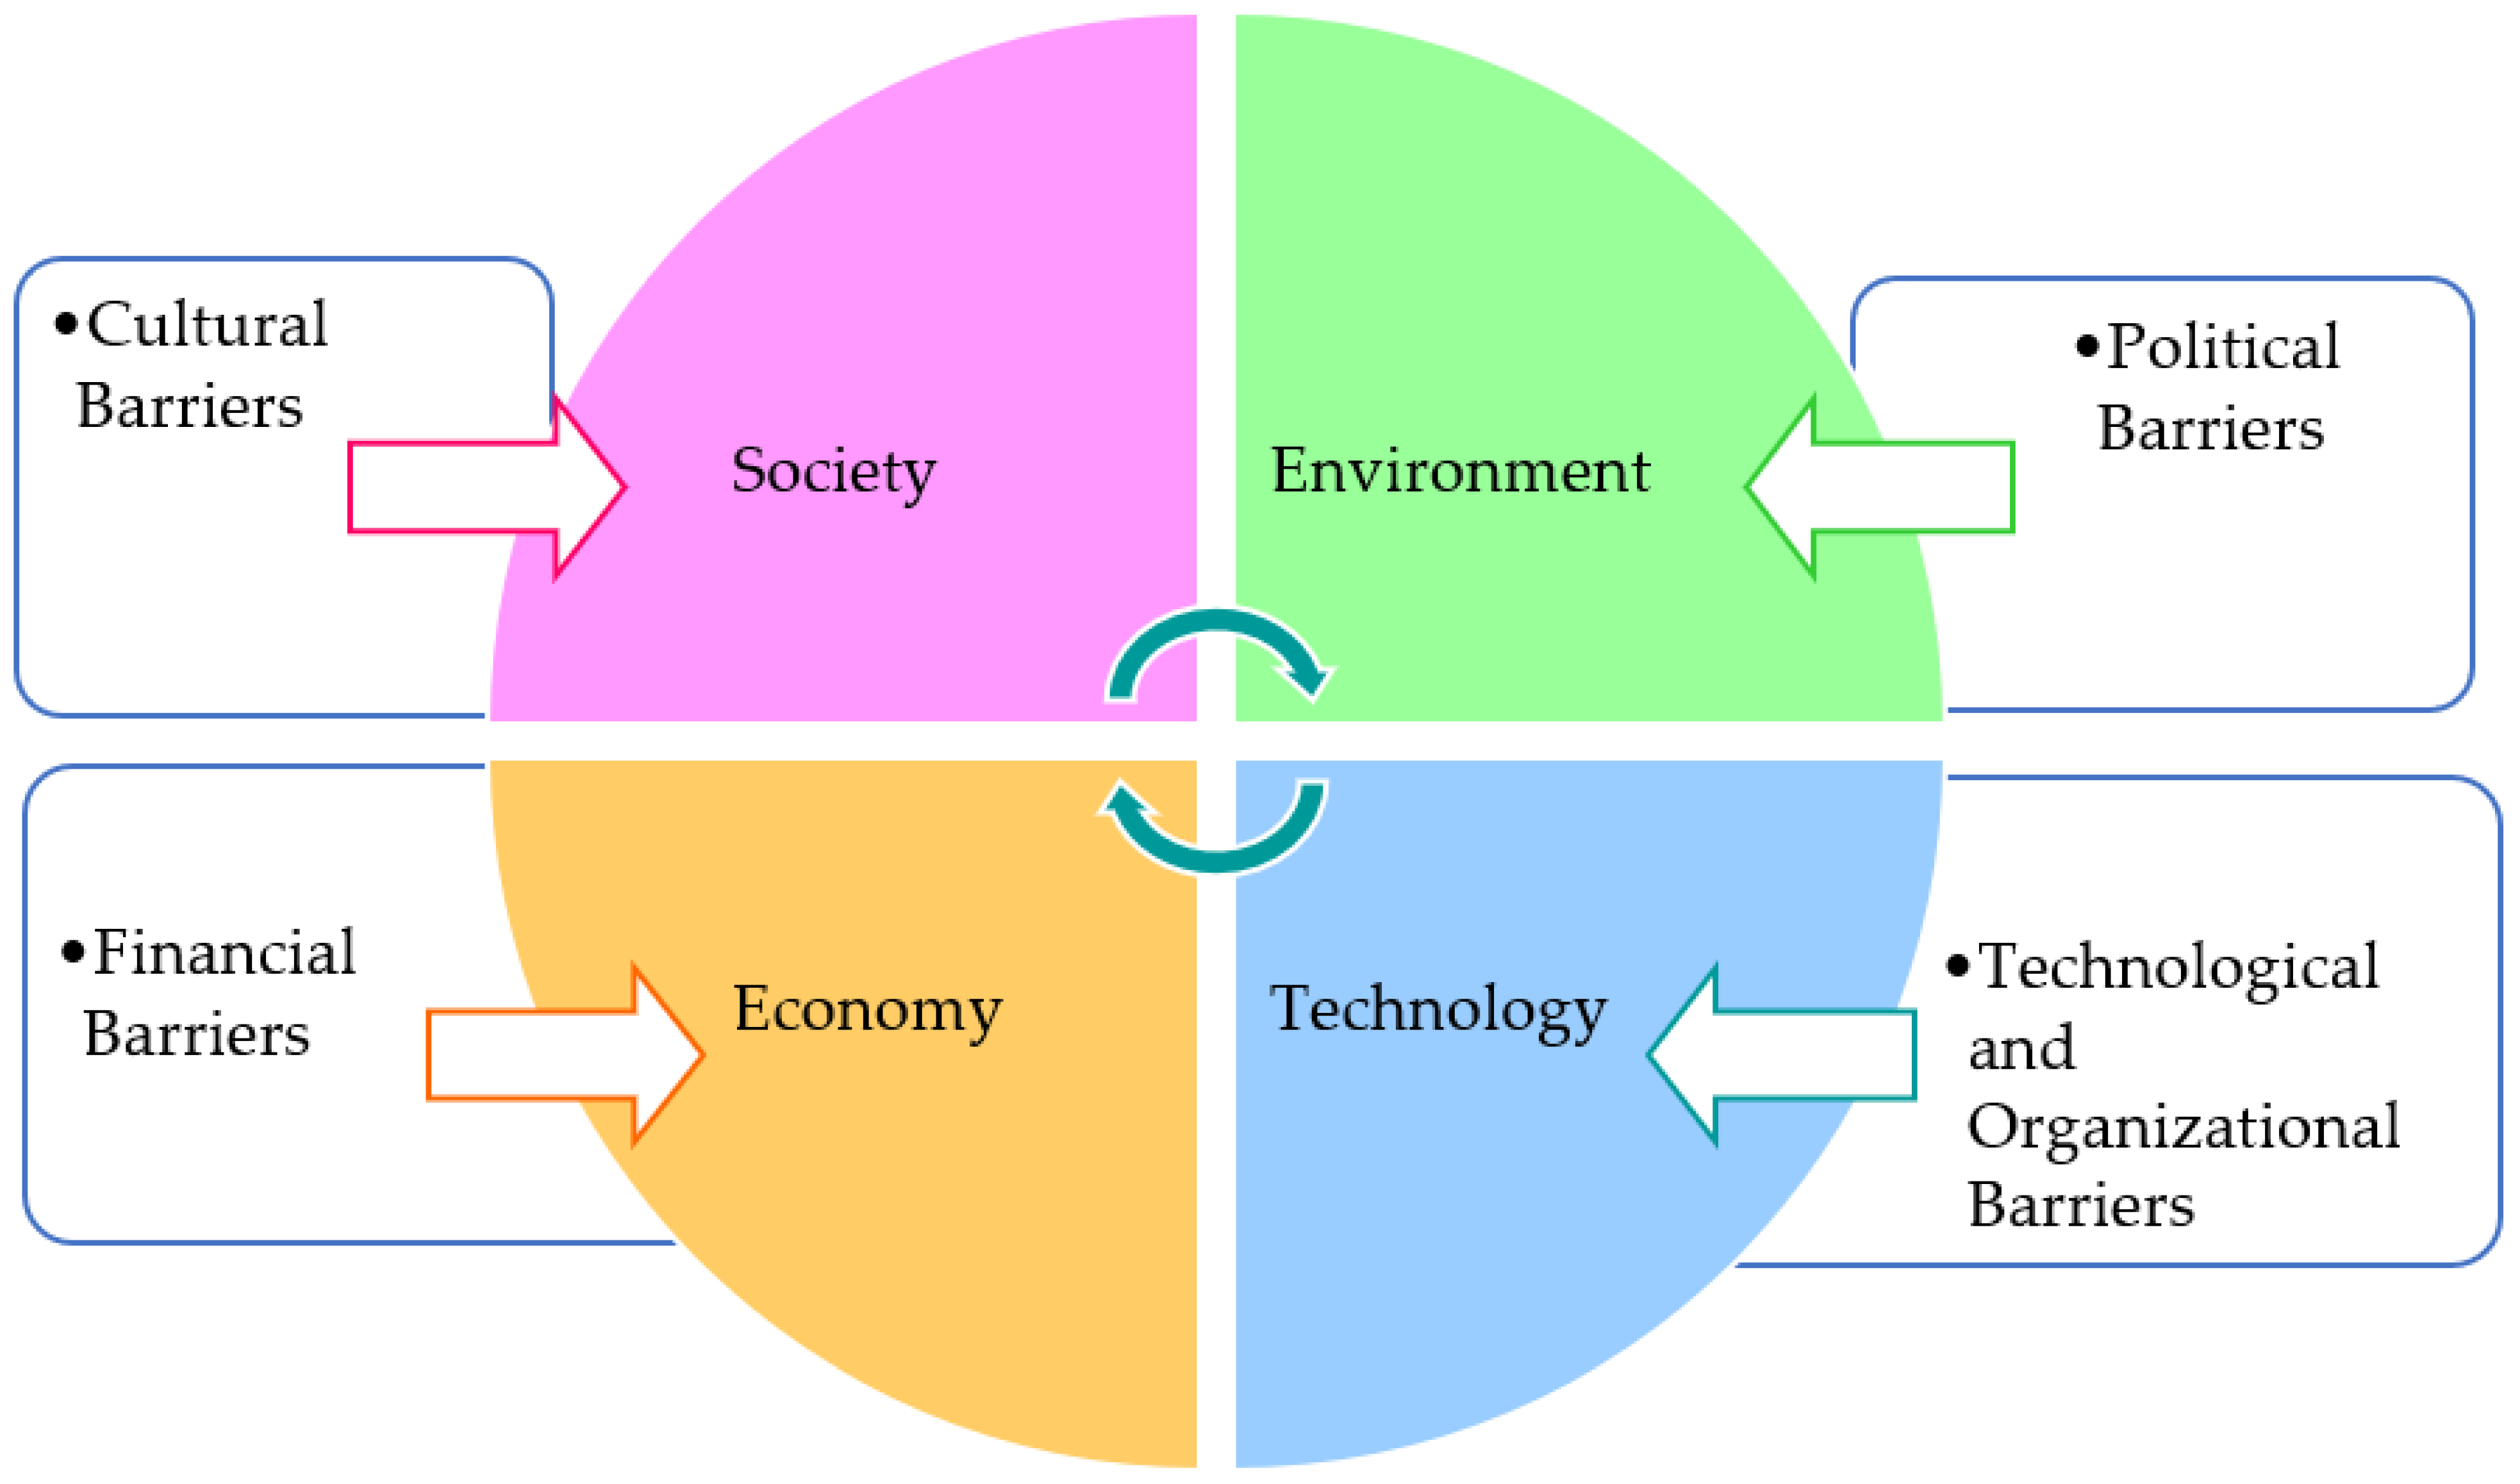
Taking into account the clear interconnection between barriers to the implementation of the CE and the sustainability of the management structure of these companies, described in Section 2, where interconnected areas are clearly visible, Figure 5 shows the link between different perspectives.
The analysis of the figure makes it possible not only to identify how the challenges inherent to the economic, social, and environmental trilogy pose obstacles to the activity of companies, but also to clarify the paths for developing strategies that allow mitigating these difficulties, in line with the United Nations Sustainable Development Goals.
In this sense, considering the conclusions of Section 2 on the order of importance of barriers, the analysis in Figure 5 suggests that the approach to mitigating or overcoming obstacles should consider the following priorities: (1) changing mindsets leading to changing living standards and the perception that products derived from recycled materials are of inferior quality; (2) improve collaboration and communication between departments and employees in the organization—communication should become simpler and clearer to improve stakeholder assessment of technology adoption; (3) improve the government’s capacity to create CE policies and increase its transparency and reliability, as well as create regulations to support the use of recycled materials, and ease the transition to CE by lifting bans on certain products containing recycled materials; (4) create strategies to inhibit inappropriate waste disposal, and reduce the energy consumption of waste incineration, for example, by developing alternatives to waste disposal; (5) grant economic incentives (for example, exemptions, tax benefits or subsidies) for the implementation of circular production systems and promote reverse-engineering practices that allow the design of products to guarantee their longevity, disassembly and reuse. Additionally, promoting venture capital to fund the initial costs of implementing cleaner technologies would allow, in some cases, to more competitively manufacture products with recycled materials; (6) encourage good management practices to achieve balanced budgets; (7) develop artificial intelligence and the Internet of Things to manage resources; (8) cooperate with other companies and stakeholders, namely, to build industrial symbiosis in order to facilitate the transition to CE; (9) promote training of employees; (10) improve the integration of operations management.
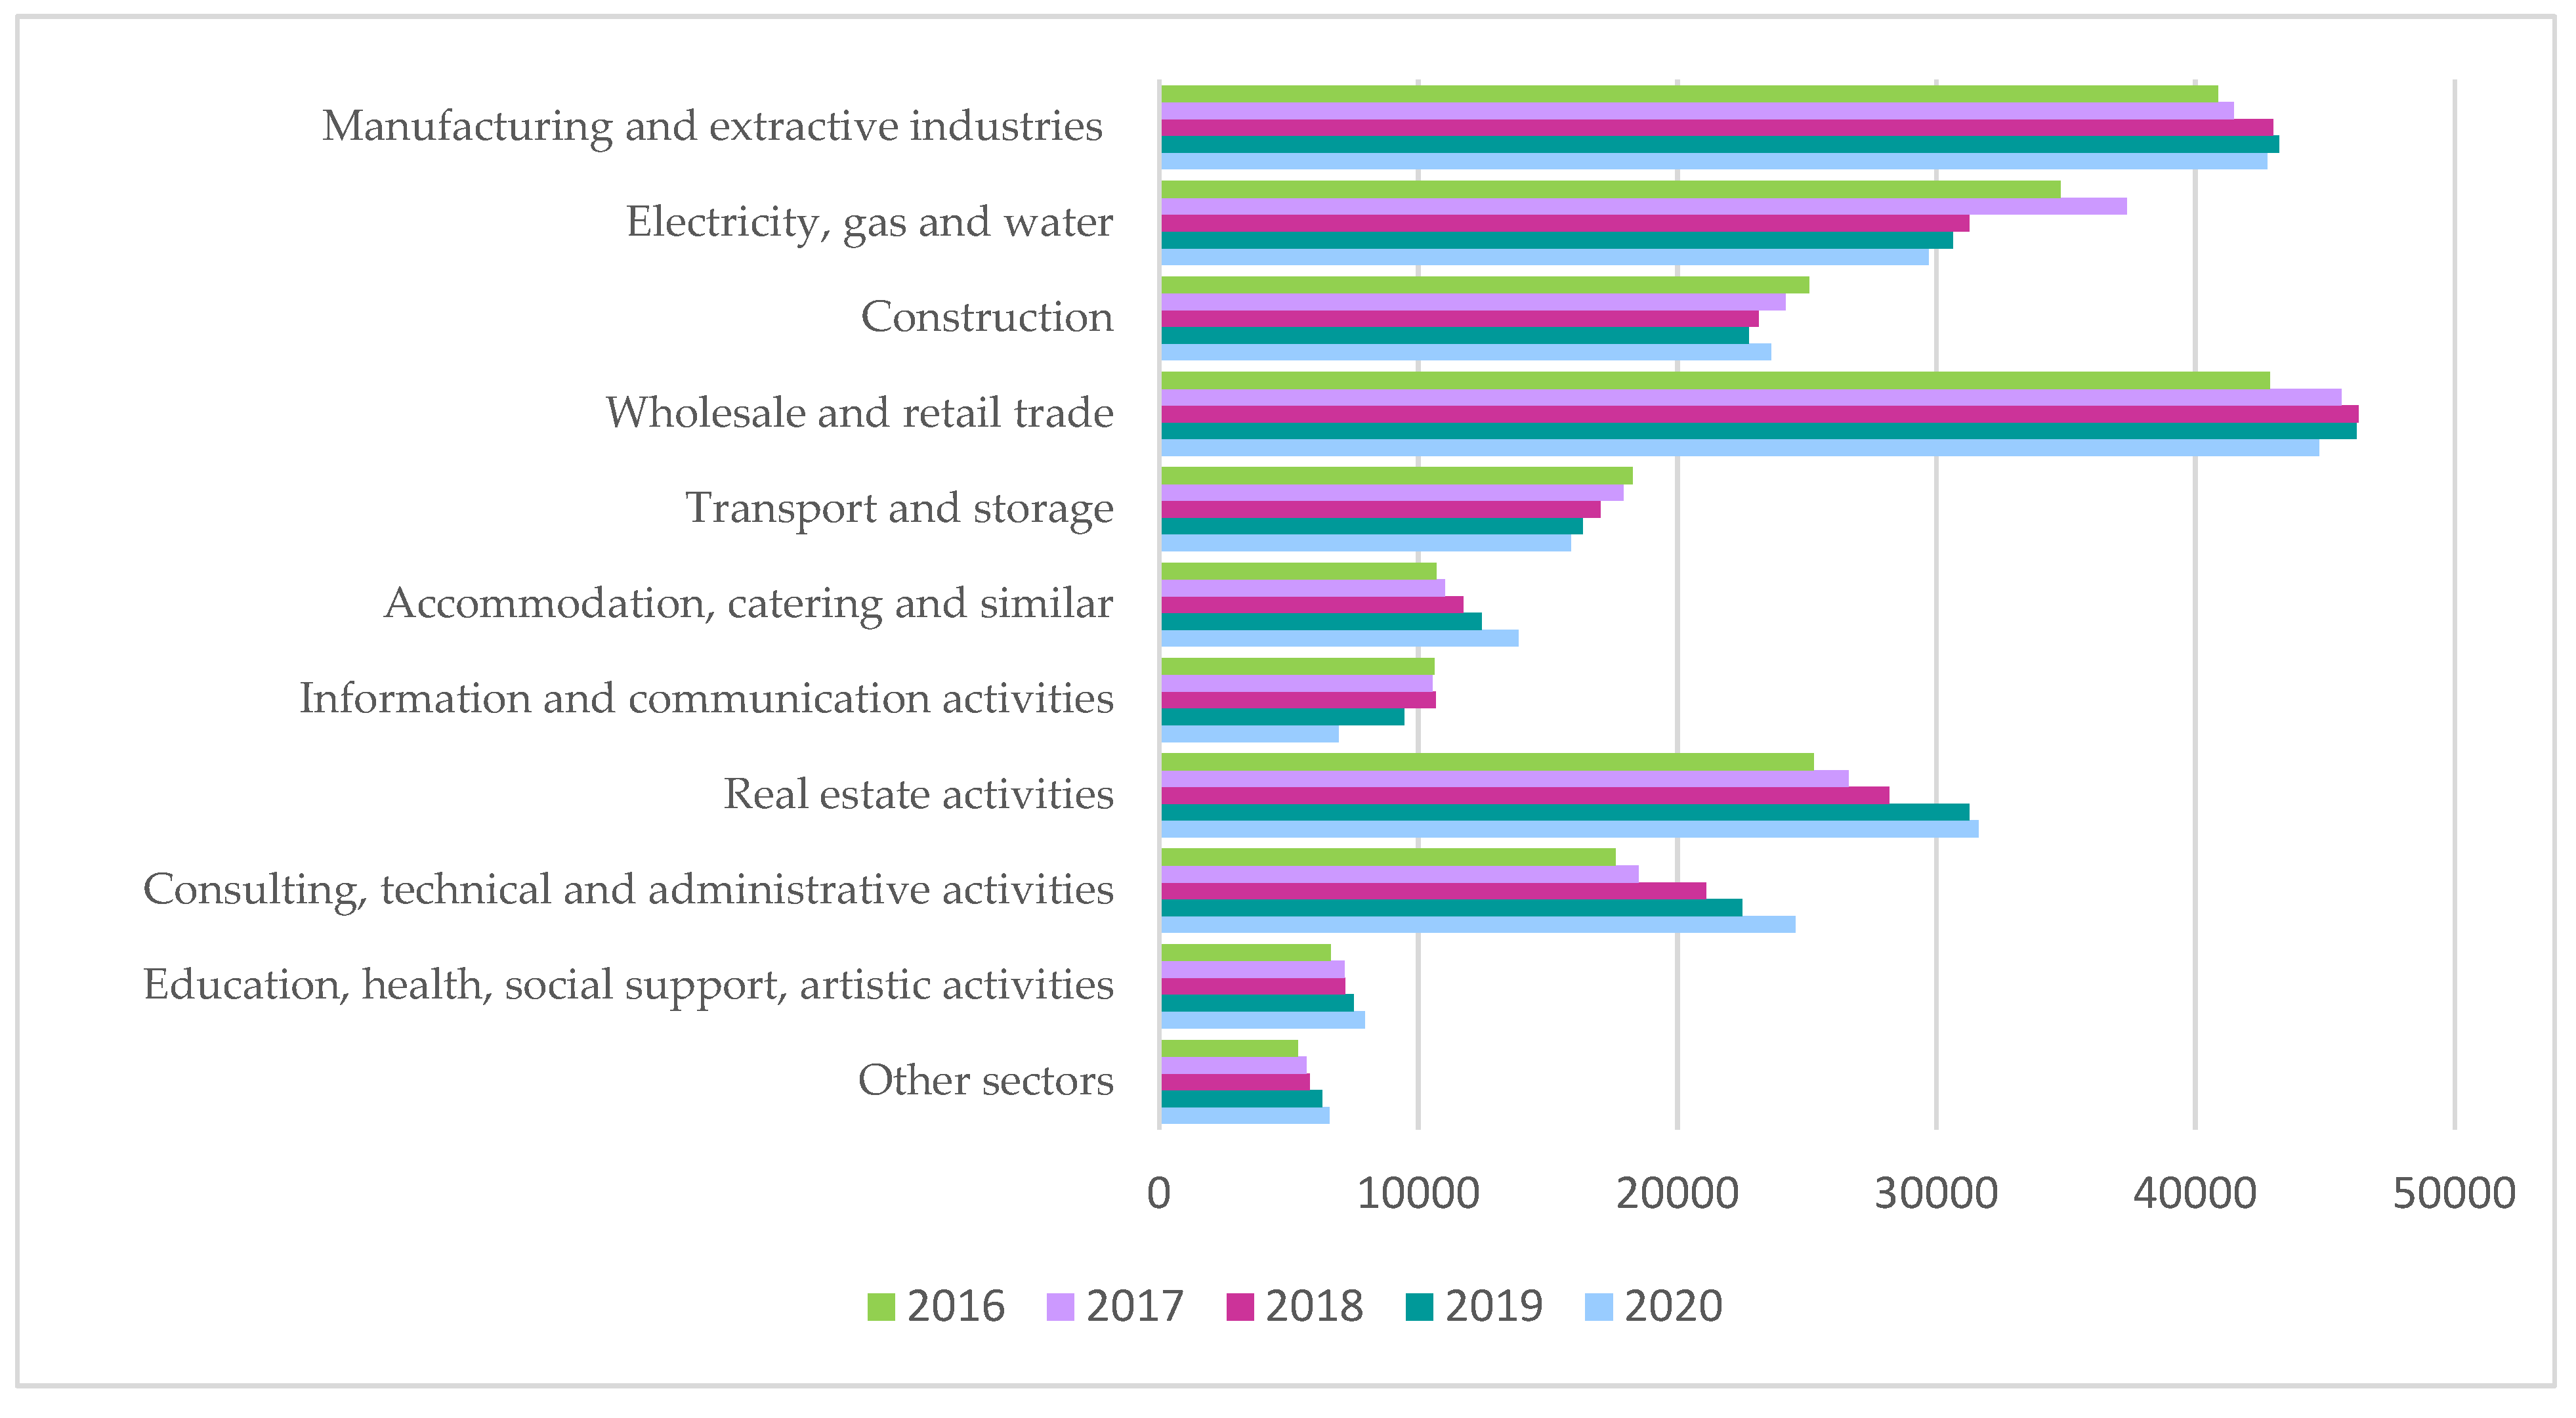
The aforementioned barriers force large investments by companies to overcome them. Since financial resources are scarce, these companies need to obtain external funding. The debt ratio of the total companies in the sample shows that, on average, the debt capital used to finance their activities represents 62–63%, meaning that they have positive equity. Furthermore, as the value of this indicator is less than 70%, these companies seem to be able to pay their debts in the future. To know whether this value for the debt ratio is high or low compared to other sectors in the period considered, we used the Pordata database to analyze the level of indebtedness by sector. Since, in Pordata, the Nace sector 38.0 is included under the heading of “Electricity, Gas, and Water”, it is only possible to make a comparison with the aggregation of these three sectors. Even so, we can observe that in this period, according to Figure 6, the companies under analysis rank in third in the top three sectors with a higher level of indebtedness, after “Wholesale and Retail Trade” and “Manufacturing and Extractive Industry”. However, the analysis over the years allows us to conclude that this indebtedness met a substantial reduction from 2016 to 2020, indicating a significant improvement in the performance of companies in the sector.
Thus, we can validate H1.

5.2. Government Subsidies and Corporate Performance

Government provides grants to companies in financial difficulties to meet their long-term goals to help companies in financial difficulties. From this perspective, public service concessionaires that carry out the collection and treatment of waste are entitled to receive government benefits to protect their economic sustainability. However, they are also subject to different forms of control and regulation. Subsidies can be awarded for R&D activities or aimed at increasing production efficiency. The former are always awarded to high-tech companies or companies with excellent performance, while the latter are intended for underperforming companies. In this framework, one aspect to consider concerning corporate performance, and especially governance, is that the focus on “equity governance” may cause the agency problem. This stems from a conflict of interest in any relationship (for example, between owners and managers and/or between majority and minority shareholders) where one party acts to maximize its benefit, to the detriment of others’ benefits [83]. Hence, this theory explains why managers are tempted to successively underestimate the company’s profit and show an inferior performance to receive more public subsidies. Accordingly, they are expected to spend more time and resources on influence activities (rent-seeking) than on productive activities, which can significantly reduce the potential positive subsidies’ effects [84]. As a result, granting discretionary subsidies can distort the government’s initial intention and lead to the misallocation of capital within companies, since the government is diverting few resources to less productive companies. Furthermore, information asymmetries, improper incentives and bad implementations can also lead to undesirable results, namely unfair competition, moral hazard and corruption, which is counterproductive for government policies aimed at correcting possible market failures [85]. In addition, in weak institutional contexts, the government is especially intrusive, and the rules of the game for granting subsidies remain fluid. Therefore, the consistent empirical demonstration of the relationship between subsidies and corporate performance remains controversial and inconclusive. Thus, knowing whether subsidies meet the intended objectives requires more empirical research. Accordingly, this article assumes (H2) that companies with subsidies exhibit worse financial performance than companies without subsidies. From Table 4, we can observe that the standard deviation of the sample of companies without subsidies is very high, indicating a wide heterogeneity between companies. Moreover, since the results between the mean and the median are conflicting in terms of conclusions about the greater or lesser degree of indebtedness between clusters of subsidies, we believe that by employing the median analysis (instead of the mean), we can obtain more accurate hints on the clustered corporate performance. Thus, it appears that companies without subsidies are less indebted than companies with subsidies, although the percentage difference is not large (1.4% in the median). With regard to the remaining ratios that serve as a basis for evaluating corporate performance, we found that, in just over half of the cases, companies without subsidies present better financial performance than companies with subsidies, suggesting that companies with subsidies are not using them in the best way to improve their economic sustainability. Thus, we can validate H2.
The analysis of corporate performance by clusters of subsidies at a regional level returned the following results, summarized in terms of subsidy effectiveness: (1) ineffectiveness in the north, Alentejo, the Algarve and Madeira. In the North, subsidies helped to reduce the high indebtedness. In Madeira, the attribution of subsidies seems to have been guided by political reasons, since they served to obtain solvency and liquidity, but did not help to improve economic and financial profitability. In the Algarve, subsidies contributed to making investments to the detriment of the company’s liquidity without resulting in a corresponding improvement in economic and financial profitability. This suggests that the subsidies were not effective. In Alentejo, the role of subsidies was to reduce the risk of investments, but they were not able to improve economic and financial profitability, so they were considered ineffective. (2) Effectiveness in the Centro, Lisbon and the Azores regions. Subsidies in the central region were effective in improving the financial performance of companies. In the Azores, subsidies were effective, contributing to the economic and financial profitability of companies, although they did not prevent companies in this region from falling into debt. In Lisbon, subsidies seem to have been effective in improving the financial profitability of companies.
To sum up, our contribution to the literature is twofold. First, by validating H1, we contribute to the literature on this sector, through the results on barriers to activity and higher levels of indebtedness that hinder the increases in performance. Still, Figure 6 has shown that the indebtedness has decreased in the five-year period. Second, by validating H2, we contribute to the discussion on the effects of subsidies on the corporate performance. Hence, we corroborate the previous findings on the negative relationship between subsidies to production and corporate performance.
Despite providing several insights, this analysis has some limitations. First, the study has been carried out over 5 years; a broader temporal analysis would confirm these findings and would assist to better establish future trends. Secondly, the analysis was carried out for Portugal; it would be interesting to carry out a cross-country study to verify the validity of the conclusions, for example, at the European level. Third, as most companies in Portugal are micro or small, our sample is likely to be biased. Therefore, we must handle the results with caution. Ideally, a comparison of our results with countries with larger shares of large companies would provide more insights. Therefore, more research is needed to investigate the economic sustainability of companies in the sector.

6. Conclusions

The objective of the present study was to evaluate the economic sustainability of the companies involved in the collection and treatment of residues, through financial ratios. We compared companies with and without subsidies to understand whether non-refundable government subsidies help companies improve their financial performance. In addition, regional effects are also analyzed. The main results show that companies with subsidies are mainly small companies and located in regions with lower population densities (Alentejo and the Azores). The subsidies can assist companies with resources to hire employees and even increase revenue and profits. However, the regional analysis showed the effectiveness of such subsidies in only three of the seven NUTs II regions: Centro, Lisbon and the Azores. Since the companies without subsidies appear to exhibit a more stable financial situation, which has been increasing in recent years, we suggest caution when granting subsidies if the purpose is to assist these companies in achieving economic sustainability.
Indeed, our findings confirm H1 and H2. On average, companies operating in this sector exhibit profits but are highly indebted. Companies with subsidies tend to perform worse than companies without subsidies. This can be explained by the managers’ desire to maintain an uninterrupted source of subsidies but also through barriers to the activity, such as the budget for the development and maintenance of operations, the lack of norms, policies and guidelines; the fact that conventional sources of waste disposal imply high energy consumption; and the lack of technical knowledge and skilled labor and the lack of integration of operations’ management.
Since financial ratios allow the assessment of a company’s financial health and are, therefore, a good tool to assess the economic sustainability of recycling activities, this study suggests that the government and other stakeholders continue to make efforts to contribute to increasing the environmental responsibility of producers. However, implementing CE requires large investments, cultural and organizational changes and economic incentives that are not always easily predictable and quantifiable. In every company, the CE plays an important role in defining the corporate strategy. However, the corporate response to sustainability challenges changes according to business models and priorities. Some companies promote circular initiatives and assume “ethical leadership”, while others focus on cost reductions, better resource allocation or energy savings.
This analysis provides further insights into the latest trends in how subsidies might affect profitability, liquidity, indebtedness and investment risk. The results can fill the gap in the literature related to the advancement of knowledge about the economic sustainability of these companies in Portugal and provide recommendations to improve their economic sustainability. They can benefit managers, shareholders, stakeholders and policymakers. In line with the caveats presented in the previous section, future research could consider an extended period of time and include other European countries to confirm our findings. The research gaps mentioned above can be used to guide future research that seeks to explore methodologies and tools for a systematic assessment of the economic performance of waste collection and treatment companies, to provide feedback for successful management plans and decisions.

Author Contributions

Conceptualization, E.S.; methodology, E.S. and I.L.; software I.L.; validation, E.S., and I.L.; formal analysis, E.S. and I.L.; investigation, E.S. and I.L.; resources, E.S. and I.L.; writing—original draft preparation, E.S. and I.L.; writing—review and editing, E.S. and I.L.; supervision, E.S.; project administration E.S.; funding acquisition, E.S. and I.L. All authors have read and agreed to the published version of the manuscript.

Funding

This research is financed by National Funds of the FCT—Portuguese Foundation for Science and Technology within the project «UIDB/04928/2020» and, under the Scientific Employment Stimulus—Institutional Call CEECINST/00051/2018.

Institutional Review Board Statement

Not applicable.

Informed Consent Statement

Not applicable.

Data Availability Statement

Restrictions apply to the availability of data. Data was obtained from [SABI, at https://sabi.bvdinfo.com/] (accessed on 25 December 2021). Data from Pordata can be found at [https://www.pordata.pt] (accessed on 25 December 2021).

Conflicts of Interest

The authors declare no conflict of interest.

References

  1. Vyas, S.; Prajapati, P.; Shah, A.V.; Varjani, S. Municipal solid waste management: Dynamics, risk assessment, ecological influence, advancements, constraints and perspectives. Sci. Total Environ. 2022, 814, 152802. [Google Scholar] [CrossRef] [PubMed]
  2. Alvarado, R.; Tillaguango, B.; Dagar, V.; Ahmad, M.; Işık, C.; Méndez, P.; Toledo, E. Ecological footprint, economic complexity, and natural resources rents in Latin America: Empirical evidence using quantile regressions. J. Clean. Prod. 2021, 318, 128585. [Google Scholar] [CrossRef]
  3. Kumar, S.R.; Prajapati, S.; Parambil, J.V. Sustainable Food Value Chains and Circular Economy. In Challenges and Opportunities of Circular Economy in Agri-Food Sector; Springer: Singapore, 2021; pp. 77–92. [Google Scholar]
  4. Sharma, H.B.; Vanapalli, K.R.; Samal, B.; Cheela, V.S.; Dubey, B.K.; Bhattacharya, J. Circular economy approach in solid waste management system to achieve UN-SDGs: Solutions for post-COVID recovery. Sci. Total Environ. 2021, 800, 149605. [Google Scholar] [CrossRef] [PubMed]
  5. Shooshtarian, S.; Maqsood, T.; Caldera, S.; Ryley, T. Transformation towards a circular economy in the Australian construction and demolition waste management system. Sustain. Prod. Consum. 2022, 30, 89–106. [Google Scholar] [CrossRef]
  6. Rodias, E.; Aivazidou, E.; Achillas, C.; Aidonis, D.; Bochtis, D. Water-energy-nutrients synergies in the agrifood sector: A circular economy framework. Energies 2021, 14, 159. [Google Scholar] [CrossRef]
  7. Baratsas, S.G.; Pistikopoulos, E.N.; Avraamidou, S. A system’s engineering framework for the optimization of food supply chains under circular economy considerations. Sci. Total Environ. 2021, 794, 148726. [Google Scholar] [CrossRef]
  8. Frishammar, J.; Parida, V. Circular business model transformation: A roadmap for incumbent firms. Calif. Manag. Rev. 2019, 61, 5–29. [Google Scholar] [CrossRef]
  9. Sposato, P.; Preka, R.; Cappellaro, F.; Cutaia, L. Sharing Economy and Circular Economy. How Technology and Collaborative Consumption Innovations Boost Closing the Loop Strategies. Environ. Eng. Manag. J. 2017, 16, 1797–1806. [Google Scholar] [CrossRef]
  10. Androniceanu, A.; Kinnunen, J.; Georgescu, I. Circular economy as a strategic option to promote sustainable economic growth and effective human development. J. Int. Stud. 2021, 14, 60–73. [Google Scholar] [CrossRef]
  11. Maranesi, C.; De Giovanni, P. Modern circular economy: Corporate strategy, supply chain, and industrial symbiosis. Sustainability 2020, 12, 9383. [Google Scholar] [CrossRef]
  12. Kuo, L.; Chang, B.G. The affecting factors of circular economy information and its impact on corporate economic sustainability-Evidence from China. Sustain. Prod. Consum. 2021, 27, 986–997. [Google Scholar] [CrossRef]
  13. Holzer, D.; Rauter, R.; Fleiß, E.; Stern, T. Mind the gap: Towards a systematic circular economy encouragement of small and medium-sized companies. J. Clean. Prod. 2021, 298, 126696. [Google Scholar] [CrossRef]
  14. APA. Produção e Gestão de Resíduos Urbanos. 2021. Available online: https://rea.apambiente.pt/content/produ%C3%A7%C3%A3o-e-gest%C3%A3o-de-res%C3%ADduos-urbanos (accessed on 25 December 2021).
  15. Van Buren, N.; Demmers, M.; Van Der Heijden, R.; Witlox, F. Towards a Circular Economy: The Role of Dutch Logistics Industries and Governments. Sustainability 2016, 8, 647. [Google Scholar] [CrossRef] [Green Version]
  16. Shahbazi, S.; Wiktorsson, M.; Kurdve, M.; Jönsson, C.; Bjelkemyr, M. Material efficiency in manufacturing: Swedish evidence on potential, barriers and strategies. J. Clean. Prod. 2016, 127, 438–450. [Google Scholar] [CrossRef]
  17. Mont, O.; Plepys, A.; Whalen, K.; Nußholz, J.L. Business Model Innovation for a Circular Economy: Drivers and Barriers for the Swedish Industry—The Voice of REES Companies; Mistra REES: Linköping, Sweden, 2017. [Google Scholar]
  18. De Jesus, A.; Mendonça, S. Lost in Transition? Drivers and Barriers in the Eco-innovation Road to the Circular Economy. Ecol. Econ. 2018, 145, 75–89. [Google Scholar] [CrossRef] [Green Version]
  19. Kirchherr, J.; Piscicelli, L.; Bour, R.; Kostense-Smit, E.; Muller, J.; Huibrechtse-Truijens, A.; Hekkert, M. Barriers to the circular economy: Evidence from the European Union (EU). Ecol. Econ. 2018, 150, 264–272. [Google Scholar] [CrossRef] [Green Version]
  20. Ormazabal, M.; Prieto-Sandoval, V.; Puga-Leal, R.; Jaca, C. Circular Economy in Spanish SMEs: Challenges and opportunities. J. Clean. Prod. 2018, 185, 157–167. [Google Scholar] [CrossRef]
  21. Ritzén, S.; Sandström, G.Ö. Barriers to the Circular Economy—Integration of Perspectives and Domains. Procedia CIRP 2016, 64, 7–12. [Google Scholar] [CrossRef]
  22. Ranta, V.; Aarikka-Stenroos, L.; Ritala, P.; Mäkinen, S.J. Exploring institutional drivers and barriers of the circular economy: A cross-regional comparison of China, the US, and Europe. Resour. Conserv. Recycl. 2018, 135, 70–82. [Google Scholar] [CrossRef]
  23. Shi, H.; Peng, S.Z.; Liu, Y.; Zhong, P. Barriers to the implementation of cleaner production in Chinese SMEs: Government, industry and expert stakeholders’ perspectives. J. Clean. Prod. 2008, 16, 842–852. [Google Scholar] [CrossRef]
  24. Pheifer, A.A.G. Barriers & Eenablers to Circular Business Models; Centre for European Policy Studies: Brielle, The Netherlands, 2017; Available online: https://www.circulairondernemen.nl/uploads/4f4995c266e00bee8fdb8fb34fbc5c15.pdf (accessed on 25 December 2021).
  25. Fitzpatrick, C.; Kissling, R.; Coughlan, D.; Fitzpatrick, C.; Boeni, H.; Luepschen, C.; Dickenson, J. Success factors and barriers in re-use of electrical and electronic equipment Resources, Conservation and Recycling. Resour. Conserv. Recycl. 2013, 80, 21–31. [Google Scholar]
  26. Nordin, N.; Ashari, H.; Hassan, M.G. Drivers and barriers in sustainable manufacturing implementation in Malaysian manufacturing firms. In Proceedings of the 2014 IEEE International Conference on Industrial Engineering and Engineering Management, Selangor, Malaysia, 9–12 December 2014; pp. 687–691. [Google Scholar]
  27. Van Eijk, F. Barriers & Drivers towards a Circular Economy—A Literature Review; European Union: Naarden, The Netherlands, 2015; pp. 1–138. Available online: https://circulareconomy.europa.eu/platform/sites/default/files/e00e8643951aef8adde612123e824493.pdf (accessed on 25 December 2021).
  28. Bakker, C.A.; den Hollander, M.C.; van Hinte, E.; Zijlstra, Y. Products That Last: Product Design for Circular Business Models; TU Delft Library: Delft, The Netherlands, 2014. [Google Scholar]
  29. Frei, R.; Jack, L.; Krzyzaniak, S.A. Sustainable reverse supply chains and circular economy in multichannel retail returns. Bus. Strategy Environ. 2020, 29, 1925–1940. [Google Scholar] [CrossRef]
  30. Liu, Y.; Bai, Y. An exploration of firms’ awareness and behaviour of developing circular economy: Empirical research in China. Resour. Conserv. Recycl. 2014, 87, 145–152. [Google Scholar] [CrossRef]
  31. Masi, D.; Kumar, V.; Garza-Reyes, J.A.; Godsell, J. Towards a more circular economy: Exploring the awareness, practices, and barriers from a focal firm perspective. Prod. Plan. Control 2018, 29, 539–550. [Google Scholar] [CrossRef]
  32. Agyemang, M.; Kusi-Sarpong, S.; Khan, S.A.; Mani, V.; Rehman, S.T.; Kusi-Sarpong, H. Drivers and barriers to circular economy implementation: An explorative study in Pakistan’s automobile industry. Manag. Decis. 2019, 57, 971–994. [Google Scholar] [CrossRef]
  33. Hart, J.; Adams, K.; Giesekam, J.; Tingley, D.D.; Pomponi, F. Barriers and drivers in a circular economy: The case of the built environment. Procedia Cirp 2019, 80, 619–624. [Google Scholar] [CrossRef]
  34. Kumar, V.; Sezersan, I.; Garza-Reyes, J.A.; Gonzalez, E.D.; Moh’d Anwer, A.S. Circular economy in the manufacturing sector: Benefits, opportunities and barriers. Manag. Decis. 2019, 57, 1067–1086. [Google Scholar] [CrossRef] [Green Version]
  35. Bilal, M.; Khan KI, A.; Thaheem, M.J.; Nasir, A.R. Current state and barriers to the circular economy in the building sector: Towards a mitigation framework. J. Clean. Prod. 2020, 276, 123250. [Google Scholar] [CrossRef]
  36. Mangla, S.K.; Luthor, S.; Mishra, N.; Singh, A.; Rana, N.P.; Dora, M.; Dwivedi, Y. Barriers to effective circular supply chain management in a developing country context. Prod. Plan. Control 2018, 29, 551–569. [Google Scholar] [CrossRef] [Green Version]
  37. Garcés-Ayerbe, C.; Rivera-Torres, P.; Suárez-Perales, I.; Leyva-de la Hiz, D.I. Is it possible to change from a linear to a circular economy? An overview of opportunities and barriers for European small and medium-sized enterprise companies. Int. J. Environ. Res. Public Health 2019, 16, 851. [Google Scholar] [CrossRef] [Green Version]
  38. García-Quevedo, J.; Jové-Llopis, E.; Martínez-Ros, E. Barriers to the circular economy in European small and medium-sized firms. Bus. Strategy Environ. 2020, 29, 2450–2464. [Google Scholar] [CrossRef]
  39. Bui, T.D.; Tseng, M.L. Understanding the barriers to sustainable solid waste management in society 5.0 under uncertainties: A novelty of socials and technical perspectives on performance driving. Environ. Sci. Pollut. Res. 2021, 29, 16265–16293. [Google Scholar] [CrossRef]
  40. Casazza, M.; Gioppo, L. A playwriting technique to engage on a shared reflective enquiry about the social sustainability of robotization and artificial intelligence. J. Clean. Prod. 2020, 248, 119201. [Google Scholar] [CrossRef]
  41. Keogh, J.G.; Dube, L.; Rejeb, A.; Hand, K.J.; Khan, N.; Dean, K. The Future Food Chain: Digitization as an Enabler of Society 5.0. In Building the Future of Food Safety Technology; Detwiler, D., Ed.; Elsevier: London, UK; Oxford, UK; San Diego, CA, USA; Cambridge, MA, USA, 2020. [Google Scholar]
  42. Murayama, A. Institutional instruments for urban systems design from the planner’s perspective. In Urban Systems Design: Creating Sustainable Smart Cities on the Internet of Things Era; Elsevier: London, UK, 2020; Chapter 14; pp. 409–427. [Google Scholar] [CrossRef]
  43. Tabaa, M.; Monteiro, F.; Bensag, H.; Dandache, A. Green Industrial Internet of Things from a smart industry perspective. Energy Rep. 2020, 6, 430–446. [Google Scholar] [CrossRef]
  44. Tanaka, M. Sustainable society and municipal solid waste management. In Municipal Solid Waste Management in Asia and the Pacific Islands; Springer: Singapore, 2014; pp. 1–14. [Google Scholar]
  45. Onoda, H. Smart approaches to waste management for post- COVID-19 smart cities in Japan. IET Smart Cities 2020, 2, 89–94. [Google Scholar] [CrossRef]
  46. Ikhlayel, M. Indicators for establishing and assessing waste management systems in developing countries: A holistic approach to sustainability and business opportunities. Bus. Strategy Dev. 2018, 1, 31–42. [Google Scholar] [CrossRef]
  47. Tsai, F.M.; Bui, T.D.; Tseng, M.L.; Lim, M.K.; Wu, K.J.; Mashud, A.H.M. Assessing a hierarchical sustainable solid waste management structure with qualitative information: Policy and regulations drive social impacts and stakeholder participation. Resour. Conserv. Recycl. 2020, 168, 105285. [Google Scholar] [CrossRef]
  48. Mohanty, R.; Kumar, B.P. Urbanization and smart cities. In Solving Urban Infrastructure Problems Using Smart City Technologies; Elsevier: Amsterdam, The Netherlands, 2021; pp. 143–158. [Google Scholar]
  49. Dubey, S.; Singh, P.; Yadav, P.; Singh, K.K. Household Waste Management System Using IoT and Machine Learning. Procedia Comput. Sci. 2020, 167, 1950–1959. [Google Scholar] [CrossRef]
  50. Bui, T.D.; Tsai, F.M.; Tseng, M.L.; Ali, M.H. Identifying sustainable solid waste management barriers in practice using the fuzzy Delphi method. Resour. Conserv. Recycl. 2020, 154, 104625. [Google Scholar] [CrossRef]
  51. Sharma, M.; Joshi, S.; Kannan, D.; Govindan, K.; Singh, R.; Purohit, H.C. Internet of things (IoT) adoption barriers of smart cities’ waste management: An Indian context. J. Clean. Prod. 2020, 270, 122047. [Google Scholar] [CrossRef]
  52. Mavrodieva, A.V.; Shaw, R. Disaster and climate change issues in Japan’s society 5 0—A discussion. Sustainability 2020, 12, 1893. [Google Scholar] [CrossRef] [Green Version]
  53. Bui, T.D.; Tsai, F.M.; Tseng, M.L.; Wu, K.J.; Chiu, A.S. Effective municipal solid waste management capability under uncertainty in Vietnam: Utilizing economic efficiency and technology to foster social mobilization and environmental integrity. J. Clean. Prod. 2020, 259, 120981. [Google Scholar] [CrossRef]
  54. Anagnostopoulos, T.; Zaslavsky, A.; Kolomvatsos, K.; Medvedev, A.; Amirian, P.; Morley, J.; Hadjieftymiades, S. Challenges and opportunities of waste management in IoT-enabled smart cities: A survey. IEEE Trans. Sustain. Comput. 2017, 2, 275–289. [Google Scholar] [CrossRef]
  55. Ferreira, C.M.; Serpa, S. Society 5.0 and social development. Manag. Organ. Stud. 2018, 5, 26–31. [Google Scholar]
  56. Foresti, R.; Rossi, S.; Magnani, M.; Bianco, C.G.L.; Delmonte, N. Smart society and artificial intelligence: Big data scheduling and the global standard method applied to smart maintenance. Engineering 2020, 6, 835–846. [Google Scholar] [CrossRef]
  57. Gunasekaran, A.; Kobu, B. Performance measures and metrics in logistics and supply chain management: A review of recent literature (1995–2004) for research and applications. Int. J. Prod. Res. 2007, 45, 2819–2840. [Google Scholar] [CrossRef]
  58. Mirhedayatian, S.M.; Azadi, M.; Saen, R.F. A novel network data envelopment analysis model for evaluating green supply chain management. Int. J. Prod. Econ. 2014, 147, 544–554. [Google Scholar] [CrossRef]
  59. Wei, Y.S.; Samiee, S.; Lee, R.P. The influence of organic organizational cultures. market responsiveness. and product strategy on firm performance in an emerging market. J. Acad. Mark. Sci. 2014, 42, 49–70. [Google Scholar] [CrossRef]
  60. Chand, M.B.; Hatia, N.; Singh, R.K. ANP-MOORA-based approach for the analysis of selected issues of green supply chain management. Benchmarking Int. J. 2018, 25, 642–659. [Google Scholar] [CrossRef]
  61. Diab, D.L.; Highhouse, S. Test of an impression formation model: An illustration with two well-known companies. Corp. Reput. Rev. 2015, 18, 156–173. [Google Scholar] [CrossRef]
  62. Alshehhi, A.; Nobanee, H.; Khare, N. The impact of sustainability practices on corporate financial performance: Literature trends and future research potential. Sustainability 2018, 10, 494. [Google Scholar] [CrossRef] [Green Version]
  63. Molina-Moreno, V. Leyva-Díaz, J.C.; Sánchez-Molina, J.; Peña-García, A. Proposal to foster sustainability through circular economy-based engineering: A profitable chain from waste management to tunnel lighting. Sustainability 2017, 9, 2229. [Google Scholar] [CrossRef] [Green Version]
  64. Walker, A.M.; Opferkuch, K.; Lindgreen, E.R.; Simboli, A.; Vermeulen, W.J.; Raggi, A. Assessing the social sustainability of circular economy practices: Industry perspectives from Italy and the Netherlands. Sustain. Prod. Consum. 2021, 27, 831–844. [Google Scholar] [CrossRef]
  65. López Ruiz, L.A.; Ramón, X.R.; Domingo, S.G. The circular economy in the construction and demolition waste sector—A review and an integrative model approach. J. Clean. Prod. 2019, 248, 119238. [Google Scholar] [CrossRef]
  66. Yeo, J.Y.J.; How, B.S.; Teng, S.Y.; Leong, W.D.; Ng, W.P.Q.; Lim, C.H.; Lam, H.L. Synthesis of sustainable circular economy in palm oil industry using graph-theoretic method. Sustainability 2020, 12, 8081. [Google Scholar] [CrossRef]
  67. Lahti, T.; Wincent, J.; Parida, V. A definition and theoretical review of the circular economy. value creation. and sustainable business models: Where are we now and where should research move in the future? Sustainability 2018, 10, 2799. [Google Scholar] [CrossRef] [Green Version]
  68. Van Loon, P.; Van Wassenhove, L.N. Transition to the circular economy: The story of four case companies. Int. J. Prod. Res. 2020, 58, 3415–3422. [Google Scholar] [CrossRef]
  69. Ranta, V.; Aarikka-Stenroos, L.; Väisänen, J.M. Digital technologies catalysing business model innovation for circular economy—Multiple case study. Resour. Conserv. Recycl. 2021, 164, 105155. [Google Scholar] [CrossRef]
  70. Pieroni, M.P.P.; McAloone, T.C.; Pigosso, D.C.A. Business model innovation for circular economy and sustainability: A review of approaches. J. Clean Prod. 2019, 215, 198–216. [Google Scholar] [CrossRef]
  71. Lieder, M.; Rashid, A. Towards circular economy implementation: A comprehensive review in context of manufacturing industry. J. Clean. Prod. 2016, 115, 36–51. [Google Scholar] [CrossRef]
  72. Endrikat, J.; Guenther, E.; Hoppe, H. Making sense of conflicting empirical findings: A meta-analytic review of the relationship between corporate environmental and financial performance. Eur. Manag. J. 2014, 32, 735–751. [Google Scholar] [CrossRef]
  73. Buallay, A. Is sustainability reporting (ESG) associated with performance? Evidence from the European banking sector. Manag. Environ. Qual. Int. J. 2019, 30, 98–115. [Google Scholar] [CrossRef]
  74. Singh, S.K.; Chen, J.; Del Giudice, M.; El-Kassar, A.N. Environmental ethics, environmental performance, and competitive advantage: Role of environmental training. Technol. Forecast. Soc. Change 2019, 146, 203–211. [Google Scholar] [CrossRef]
  75. Xie, X.; Huo, J.; Zou, H. Green process innovation, green product innovation, and corporate financial performance: A content analysis method. J. Bus. Res. 2019, 101, 697–706. [Google Scholar] [CrossRef]
  76. Xie, J.; Nozawa, W.; Yagi, M.; Fujii, H.; Managi, S. Do environmental, social, and governance activities improve corporate financial performance? Bus. Strategy Environ. 2019, 28, 286–300. [Google Scholar] [CrossRef] [Green Version]
  77. Bhaskaran, R.K.; Ting, I.W.; Sukumaran, S.K.; Sumod, S.D. Environmental, social and governance initiatives and wealth creation for firms: An empirical examination. Manag. Decis. Econ. 2020, 41, 710–729. [Google Scholar] [CrossRef]
  78. Zhang, D.; Rong, Z.; Ji, Q. Green innovation and firm performance: Evidence from listed companies in China. Resour. Conserv. Recycl. 2019, 144, 48–55. [Google Scholar] [CrossRef]
  79. Delmas, M.A.; Nairn-Birch, N.; Lim, J. Dynamics of environmental and financial performance: The case of greenhouse gas emissions. Organ. Environ. 2015, 28, 374–393. [Google Scholar] [CrossRef]
  80. Misani, N.; Pogutz, S. Unraveling the effects of environmental outcomes and processes on financial performance: A non-linear approach. Ecol. Econ. 2015, 109, 150–160. [Google Scholar] [CrossRef]
  81. Alexopoulos, I.; Kounetas, K.; Tzelepis, D. Environmental and financial performance. Is there a win-win or a win-loss situation? Evidence from the Greek manufacturing. J. Clean. Prod. 2018, 197, 1275–1283. [Google Scholar] [CrossRef] [Green Version]
  82. Hou, T.C.T. The relationship between corporate social responsibility and sustainable financial performance: Firm-level evidence from Taiwan. Corp. Soc. Responsib. Environ. Manag. 2019, 26, 19–28. [Google Scholar] [CrossRef] [Green Version]
  83. Dewatripont, M.; Tirole, J. The Prudential Regulation of Banks; MIT Press: Cambridge, MA, USA, 1994; Volume 6. [Google Scholar]
  84. Du, J.; Mickiewicz, T. Subsidies, rent seeking and performance: Being young, small or private in China. J. Bus. Ventur. 2016, 31, 22–38. [Google Scholar] [CrossRef] [Green Version]
  85. Datta-Chaudhuri, M. Market failure and government failure. J. Econ. Perspect. 1990, 4, 25–39. [Google Scholar] [CrossRef]
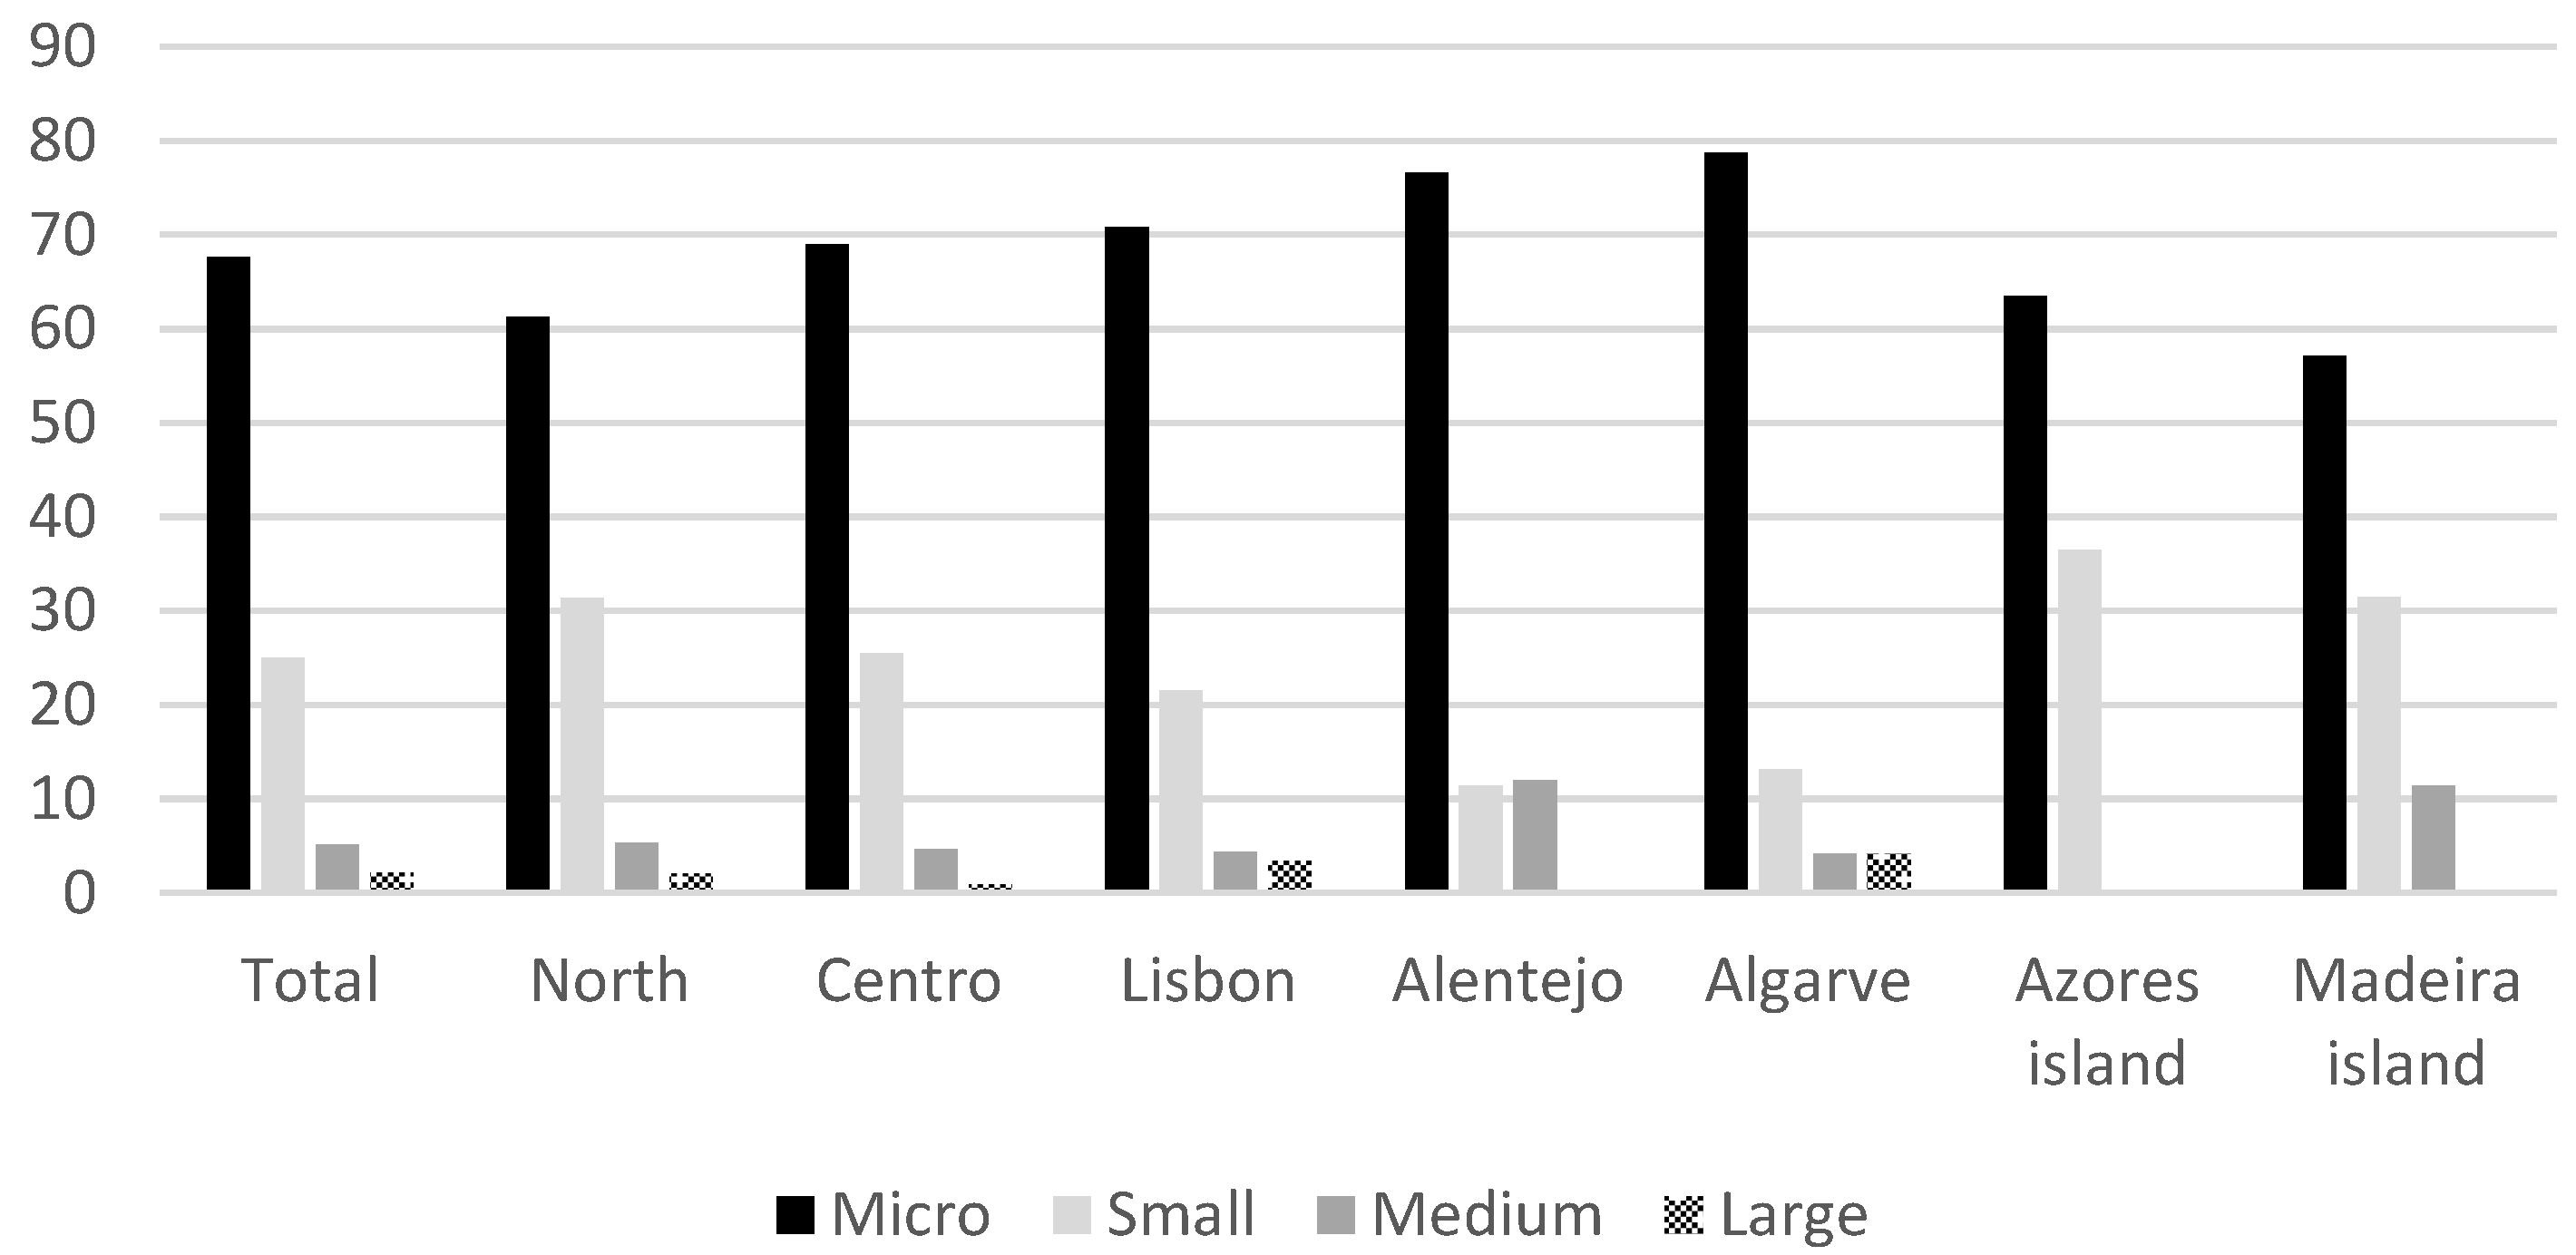
Figure 1. Regional share of sample companies by size (%).
Sustainability 14 03076 g001
Figure 2. Share of companies by size (%) comparing companies with and without subsidies.
Sustainability 14 03076 g002
Figure 3. Percentage of companies without and with subsidies by region.
Sustainability 14 03076 g003
Figure 4. Evolution of financial ratios per year (median values).
Sustainability 14 03076 g004aSustainability 14 03076 g004b
Figure 5. Relationship between barriers to EC implementation and obstacles to the sustainability of the management structure.
Sustainability 14 03076 g005
Figure 6. Debt (Mil. EUR) across industries in Portugal, 2016–2020.
Sustainability 14 03076 g006
Table 1. Regional distribution of the sample and population density.
Region# Companies# Observations% Regional StructurePopulation Density Per km2
North21394432.4167.8
Centro12454226.078.8
Lisbon253109725.4950.6
Alentejo341587.722.2
The Algarve281224.787.7
The Azores 13632.1104.4
Madeira15701.7317.2
Total68029961001728.7
Source: # is the number of companies collected from SABI database. Regional structure collected from INE. (National Statistical Office). Population density (individuals per km2) collected from Pordata.
Table 2. Descriptive statistics of accounting information (annual data).
StatisticsMeanMedianSt. DeviationMinimumMaximum
# Employees25.95.0111.20.01917.00
Wages468,796.268,834.01,834,157.30.028,159,647.1
Fuel Costs16,344.814,404.811,204.00.0282,996.8
Turnover2,427,554.80358,451.907,130,767.70077,924,553.10
Subsidies29,438.200458,422.90011,461,870.20
Total Assets1,626,417.80237,856.705,041,062.602.6129,151,553.40
Capex192,100.709230.702,197,156.20−78,900,196.0016,414,264.60
Total Equity2,331,827.00147,914.1013,232,180.80−5,626,967.10349,460,206.50
Net Income292,853.9010,885.803,611,749.20−17,531,217.6091,197,716.90
Note: # stands for number; units are euros, except for the number of employees. Source: own analysis in IBM SPSS version 27.
Table 3. Descriptive statistics of financial ratios.
StatisticsROAROELiquidityDebtSolvencyInvestment Risk
Mean85.512.41310.6183.8371.5423.7
Median2.48.3172.162.259.6140.4
St. Deviation4945.3893.523,300.14647.73703.72739.5
Minimum−7589.0−38,694.9−578.50.0−100.0−28,574.4
Maximum270,540.427,357.21,137,108. 2254,013.5153,854.373,220.1
Notes: Values in %. Source: own analysis in IBM SPSS version 27.
Table 4. Descriptive statistics of companies without and with subsidies.
VariableSubsidiesMeanMedian St. Dev.MinimumMaximumMw Test
EmployeesWithout15.04.079.80.01751.00.000
With69.116.0183.81.01917.0
TurnoverWithout1,833,330.9237,259.46,450,244.50.077,924,553.10.000
With4,775,967.01,336,323.98,976,692.20.061,284,438.4
Fuel CostWithout51,623.95992.4210,866.30.03,913,382.30.000
With182,915.630,366.3384,549.20.02,733,156.4
Wages Without288,950.751,105.61,424,591.80.027,709,193.50.000
With1,179,557.3263,956.12,831,409.2866.328,159,647.1
Net IncomeWithout509,677.723,546.04,480,877.2−10,078,566.8110,271,342.70.000
With789,889.1150,101.61,690,023.4−1,475,649.019,985,561.7
Total EquityWithout1,256,487.9181,975.54,702,012.02.6129,151,553.40.000
With3,088,405.1844,149.25,986,910.52990.583,668,002.9
Total AssetsWithout315,960.28589.74,024,146.4−17,531,217.691,197,716.90.000
With201,536.534,588.0771,575.4−4,270,435.013,241,014.9
CapexWithout85,698.33815.12,256,119.4−78,900,196.016,414,264.60.000
With602,020.685,204.11,900,213.6−15,390,718.016,002,918.0
ROAWithout106.82.55535.8−7589.0270,540.40.416
With1.32.126.9−555.767.6
ROEWithout2.98.7827.7−38,694.93702.50.014
With50.26.81116.4−1750.827,357.2
LiquidityWithout1542.3177.226,073.1−578.51,137,108.20.004
With419.1156.43916.61.196,013.7
DebtWithout213.561.95202.20.0254,013.50.892
With66.263.366.23.91433.3
SolvencyWithout435.060.24148.9−100.0153,854.30.622
With124.758.0237.5−93.02482.1
Inv. RiskWithout372.0128.62782.0−28,574.473,220.10.000
With623.3211.22561.3−4560.048,206.3
Notes: all values are in EUR except workers and financial ratios (in %); the MW test shows the value of p. Source: own analysis in IBM SPSS version 27.
Table 5. Average values of wages and fuel costs by clusters of regions and subsidies, 2016–2020.
RegionSubsidiesWagesFuel Cost
Northwithout61,826.46628.3
with296,979.328,921.9
Centrowithout60,060.68519.5
with236,459.824,662.1
Lisbonwithout48,360.65436.2
with657,047.667,386.6
Alentejowithout13,727.83392.8
with122,782.126,680.0
The Algarvewithout29,631.54766.1
with152,504.246,517.3
The Azoreswithout19,861.698.1
with108,779.912,666.8
Madeirawithout0.0161.8
with396,040.716,624.8
Table 6. Financial indices (median values) by region.
RegionSubsidiesROAROELiquidityDebtSolvencyInv. Risk
NorthWithout2.2%7.8%163.7%66.1%49.6%136.0%
With1.8%6.3%152.0%65.8%52.0%222.4%
CentroWithout2.9%8.4%219.3%52.5%88.3%140.8%
With2.2%7.5%181.6%58.6%70.7%195.3%
LisbonWithout2.7%9.9%171.9%63.1%56.0%125.1%
With3.1%9.9%157.0%62.5%60.1%214.6%
AlentejoWithout0.3%4.3%142.0%78.7%25.3%100.0%
With1.6%3.0%135.5%59.9%66.9%300.5%
The AlgarveWithout3.9%14.9%230.5%60.0%66.8%124.8%
With1.7%4.5%107.3%66.1%51.2%253.0%
Azores IslandWithout3.1%13.1%262.7%42.8%133.8%105.0%
With7.4%34.1%165.8%73.5%36.1%117.4%
Madeira IslandWithout1.9%5.2%170.9%35.8%176.3%102.3%
With1.2%2.5%178.5%36.8%171.6%163.3%
Notes: values in %. Source: own analysis in IBM SPSS version 27.
Publisher’s Note: MDPI stays neutral with regard to jurisdictional claims in published maps and institutional affiliations.