Communication

@thermogramer: Thermal Imaging as a Tool for Science Communication and E-Learning in Social Media

by
Juan Manuel Bermudez-Garcia
1,2
1
Quimolmat, Centro de Investigacións Científicas Avanzadas (CICA), Universidade da Coruña, Rúa as Carballeiras, 15071 A Coruña, Spain
2
Quimolmat, Departamento de Química, Facultade de Ciencias, Campus da Zapateira, Universidade da Coruña, 15008 A Coruña, Spain
Sustainability 2022, 14(5), 3096; https://doi.org/10.3390/su14053096
Submission received: 19 January 2022 / Revised: 25 January 2022 / Accepted: 1 March 2022 / Published: 7 March 2022

Abstract

:
The COVID-19 pandemic boosted the presence of thermal cameras in our society. These devices are becoming cheaper and smaller and can even be plugged in our smartphones. Therefore, soon enough everybody will have access to these instruments. Thermal cameras have been widely used for industrial, research and/or academic purposes. Now, in the rise of the online era, this work proposes and assesses a new application for such devices as visual engaging tools for science communication and e-learning in social media. Here, we introduce @thermogramer as a science communication channel that shows multispectral (optical and thermal) images of daily life objects to explain the science behind different topics of social interest (climate change, emerging technologies, health, and popular traditions). This young project is already present in social media, press, TV and museum’s exhibitions, and its designed content have been already useful for new inexperienced users, science educators and communicators.

1. Introduction

In the last years, thermography and thermal cameras have acquired an increasing notoriety in our society, mainly boosted by the COVID-19 pandemic. These thermal devices have been installed all around public spaces: in airports, train stations, malls, pharmacies, and hospitals, to list but a few. In this context, the principal companies of thermal cameras are selling thousands of units per month, and some of these companies increased their sales by 300% in May 2020. Accordingly, the current market of thermal imaging is estimated to be between 1 and 3 billion dollars, and it is expected to keep growing with a rate of 6% by the year 2025 [1].
We can trace the origin of thermometry (the measurement of temperature) back to the times of Galileo [2], who first described a thermoscope in 1595. This thermoscope was an early version of a thermometer, made of a glass tube opened at the bottom and inserted in a vessel with water. There, the liquid rises and falls when the temperature changes [3]. However, thermography (image representation of the heat emitted by different bodies) finds one of his fathers in the astronomer and mathematician John Herschel, son of the also astronomer William Herschel. Father and son investigated the heating power of the electromagnetic spectrum. It was John who made the very first thermal image by using a mixture of carbon and alcohol under focused sunlight, which he defined as a “thermogram” [4]. After that, there were many contributions up to reach the modern thermal imaging made by electronic thermal cameras. Today, these devices are getting smaller and cheaper in such a way that they can be even integrated and/or plugged in our smartphones.
Thermal images (or thermograms) can be defined as visual displays of the heat emitted by different objects just because they are at a certain temperature. The heat emission is known as thermal radiation, which can take place at different wavelengths from 0.1 μm to 100 μm. Therefore, thermal radiation includes part of the ultraviolet (UV) region of the electromagnetic spectrum (0.1 μm to 0.4 μm), as well as the whole visible (0.4 μm to 0.7 μm) spectrum, and a great part of the infrarred, IR, (0.7 μm to 100 μm) region. According to Wien’s law, a heat-emitting body will radiate at different wavelengths that are inversely proportional to the temperature they are at. This law follows the equation λ = b/T, where λ is the wavelength of the emission peak’s maximum, b is the Wein’s constant with a value of ~2898 μm·K, and T is the body’s temperature in Kelvin units [5]. In that way, a body at 30,000 °C (such as a lightning bolt) will radiate at 0.1 μm (in the UV region). Meanwhile, daily life objects (such as our vehicle’s engine, our coffee machine, our oven, our freezer, our hair dryer, and even our body) normally radiate in the long- and mid-wavelength IR, which range between 3 μm and 15 μm (corresponding to temperatures from +700 to −80 °C). Although, to be more precise, in our daily routine, we normally find temperatures ranging between the −20 °C (11 μm) of our freezer and the 250 °C (5.5 μm) of our oven. Accordingly, a thermal camera registers the wavelength of the object’s heat emission and transform it into temperature units. Moreover, in thermography is important to consider the radiometric chain [6,7], which comprises all the contributions to the final thermal radiation registered by the detector (including the own object, its surroundings—normally known as ambient—and the space between the object and the camera—atmosphere). For that reason, the registered signal must be corrected considering parameters such as the object emissivity (its ability to emit thermal radiation), the ambient and atmospheric temperatures, and the atmospheric transmittance (its effectiveness in transmitting thermal radiation) [7].
In the last decades, thermography has been widely explored for different applications in different fields, such as medicine and veterinary, foodstuff, industrial and/or civil engineering, among others [6,7]. Moreover, in the recent years, it has increased the number of publications about the use of thermal cameras for science education purposes in primary schools [8,9,10] and higher education degrees [11,12]. However, there is still an important gap for the general public education. In view of the increasing presence of these devices in our society, it is necessary that the general public can have access to open access platforms for a basic, easily understandable, and rigorous education in thermography, thermal cameras and thermal properties. For instance, this necessity has been specially revealed during the COVID-19 pandemic control, where non-expert volunteers where incorrectly using thermal cameras for screening people temperature, as discussed below.
Today, in the online era, social media platforms are a growing space for knowledge transfer and e-learning [13,14], as well as for promoting social change in science [15]. However, up to date, thermography—being a very visual and engaging tool—has remained scarcely used for science communication and e-learning in social media. Accordingly, there is not any previous study and/or information that addresses the potential usefulness and the potential impact that thermal imaging could have for the general public education and science communication in social media channels, which is the problem that the present work aims to shed light on.
In this work, we propose using thermal cameras as useful tools for teaching and communicating science in social media with focus on the general public education in different topics, such as climate change and global warming, emerging technologies and smart materials, health and personal self-care, thermography and thermal properties, among others. For that purpose, we design and introduce the innovative science communication channel @thermogramer in social media platforms, which—up to our knowledge—it is the first channel specifically focused on using thermal imaging on social media for those purposes. Moreover, we present practical cases demonstrating the usefulness of this channel, and we evaluate its impact in the general public.
In summary, this work aims to introduce to the scientific community an innovative method of communicating science using thermal imaging on social media. Accordingly, we expect that this work will encourage the appearance of further projects and collaborations within experts in different fields (across science, thermography, education and communication, among others) to use the emerging tool of thermal cameras to communicate science in an engaging way to the general public.

2. Materials and Methods

2.1. Multispectral Imaging

All the here presented images were taken with permission from the author from the science channel @thermogramer on Instagram. These images were performed using a multispectral FLIR One Pro camera directly plugged in a Xiaomi Redmi Note 7 Smartphone. The multispectral camera has an optical sensor that can provide a resolution of 1440 × 1080, and a thermal sensor with a resolution of 160 × 120 measuring in the range of 8–14 μm and integrating VividIR™ image processing [9]. In that manner, the camera can overlap both optical and thermal images, which can be visually compared. All thermal pictures were taken in a room with at a constantly controlled temperature and away from direct light sources, except otherwise indicated.

2.2. Social Media Platforms

Pairs of optical and thermal images of the same daily-life objects are posted on social media platforms under the user @thermogramer, especially on Twitter and Instagram, but also on Facebook, Tiktok and the website www.thermogramer.com accessed on 18 January 2022. The pairs of optical and thermal images are posted together for facilitating visual comparison to the viewers. Moreover, these pairs of images included a scientific explanation related to the heat observed in the different objects. Additionally, the social media platforms Instagram and Twitter were used to conduct a survey for evaluating the impact of @thermogramer on their followers. The survey was performed using the own tools of both platforms during a limited time of 24 h, where a sample size of n = 74 (for Instagram) and n = 77 people participated. The participants were informed that the survey results will be included in this study and not personal data are held and/or disclosed by the author.

3. Results and Discussion

3.1. Designing Simple Home-Made Tests on @thermogramer for E-Learning Thermography and Heat Science Concepts

In this section, for highlighting the usefulness of thermography as a science communication and e-learning tool in social media, we identify common mistakes usually made by new thermal imaging users in the present time, where the number of inexperienced users has increased due to the COVID-19 pandemic. Moreover, we present three selected home-made tests designed for the channel @thermogramer that try to mitigate these misuses. The main objective is helping new users (and future ones), as well as science learners, to understand the basic fundaments of thermography and enrich their basic skills and their scientific knowledge.
As it is well-known, one of the main symptoms of COVID-19 is fever. Therefore, in principle, a proper thermal screening could help to reduce the virus spread [16]. However, there are some limitations and drawbacks to this detection tool [17].
First of all, not all people having COVID-19 show fever, and not all feverish people might be infected with this disease (they could present a simple flu, for instance). Therefore, the use of thermal imaging as a detection tool for infected people can cause a false feeling of safety, which can lead people to unconsciously relax the safety measures [1].
In any case, thermal cameras, if properly used, could help us to identify a number of feverish people that could potentially be a source of contagion of COVID-19 or any other disease [16]. Nevertheless, in many occasions, thermal cameras have been operated by volunteers that have not been properly trained in thermography, and therefore, some common mistakes have been made, as explained below.
Test 1: Understanding why measuring temperature on the face/forehead is not adequate for detecting feverish people.
One of the most widespread mistakes is to measure the body’s temperature with a thermal camera considering the temperature of the face or forehead. Thermal cameras can only measure superficial temperatures such as that of our skin, which is slightly lower than our core temperature [18]. In that regard, the standard ISO/TR13154:2017 on “Deployment, implementation and operational guidelines for identifying febrile humans using a screening thermograph” recommends that we use the lacrimal area as a measuring point. This is a semi-internal part of our body where temperature is closer to our core, and it also shows a better correlation with internal temperature changes.
This is because the temperature of the face/forehead is not homogeneous and can also be affected by external factors that can hide or mask our real temperature. That is the case of cold water and/or wet wipes (if we recently washed our face) and even face cream, all three decreasing our facial temperature. Therefore, a feverish person that just moistened his/her face could trick a thermal camera and pass undetected (false negative). Meanwhile, the temperature of the lacrimal area is rarely affected by external factors.
As it can be observed in Figure 1, cold water and wet wipes modify the facial temperature in comparison with the normal resting situation. Meanwhile, the temperature of the lacrimal area remains almost invariable in all three situations.
Test 2: Understanding how the ambient temperature can influence the registered temperature.
Neglecting the influence of direct sunlight and/or artificial lights when measuring body’s temperature with a thermal camera is another common mistake. Sunlight and most artificial lights also irradiate heat that can contribute to the measured signal, which increases the registered temperature. That was the case, for example, of a healthy reporter that was wrongly identified as feverish while doing an “on-air” coverage in a hospital under strong camera illumination [19].
Light contribution can occur mainly in two ways, via reflection of the heat into the thermal camera and/or via superficial absorption of the heat irradiated by a light source.
In the first scenario, it is common that the heat irradiated by a light source can be reflected in a polished surface, such as a window or a mirror, and even in our sweaty skin. The reflected heat can, then, be registered by the thermal camera increasing the resulting temperature measure. In turn, the larger the reflectivity of an object, the larger will be the reflected heat, which will affect to the radiometric chain and must be corrected [7].
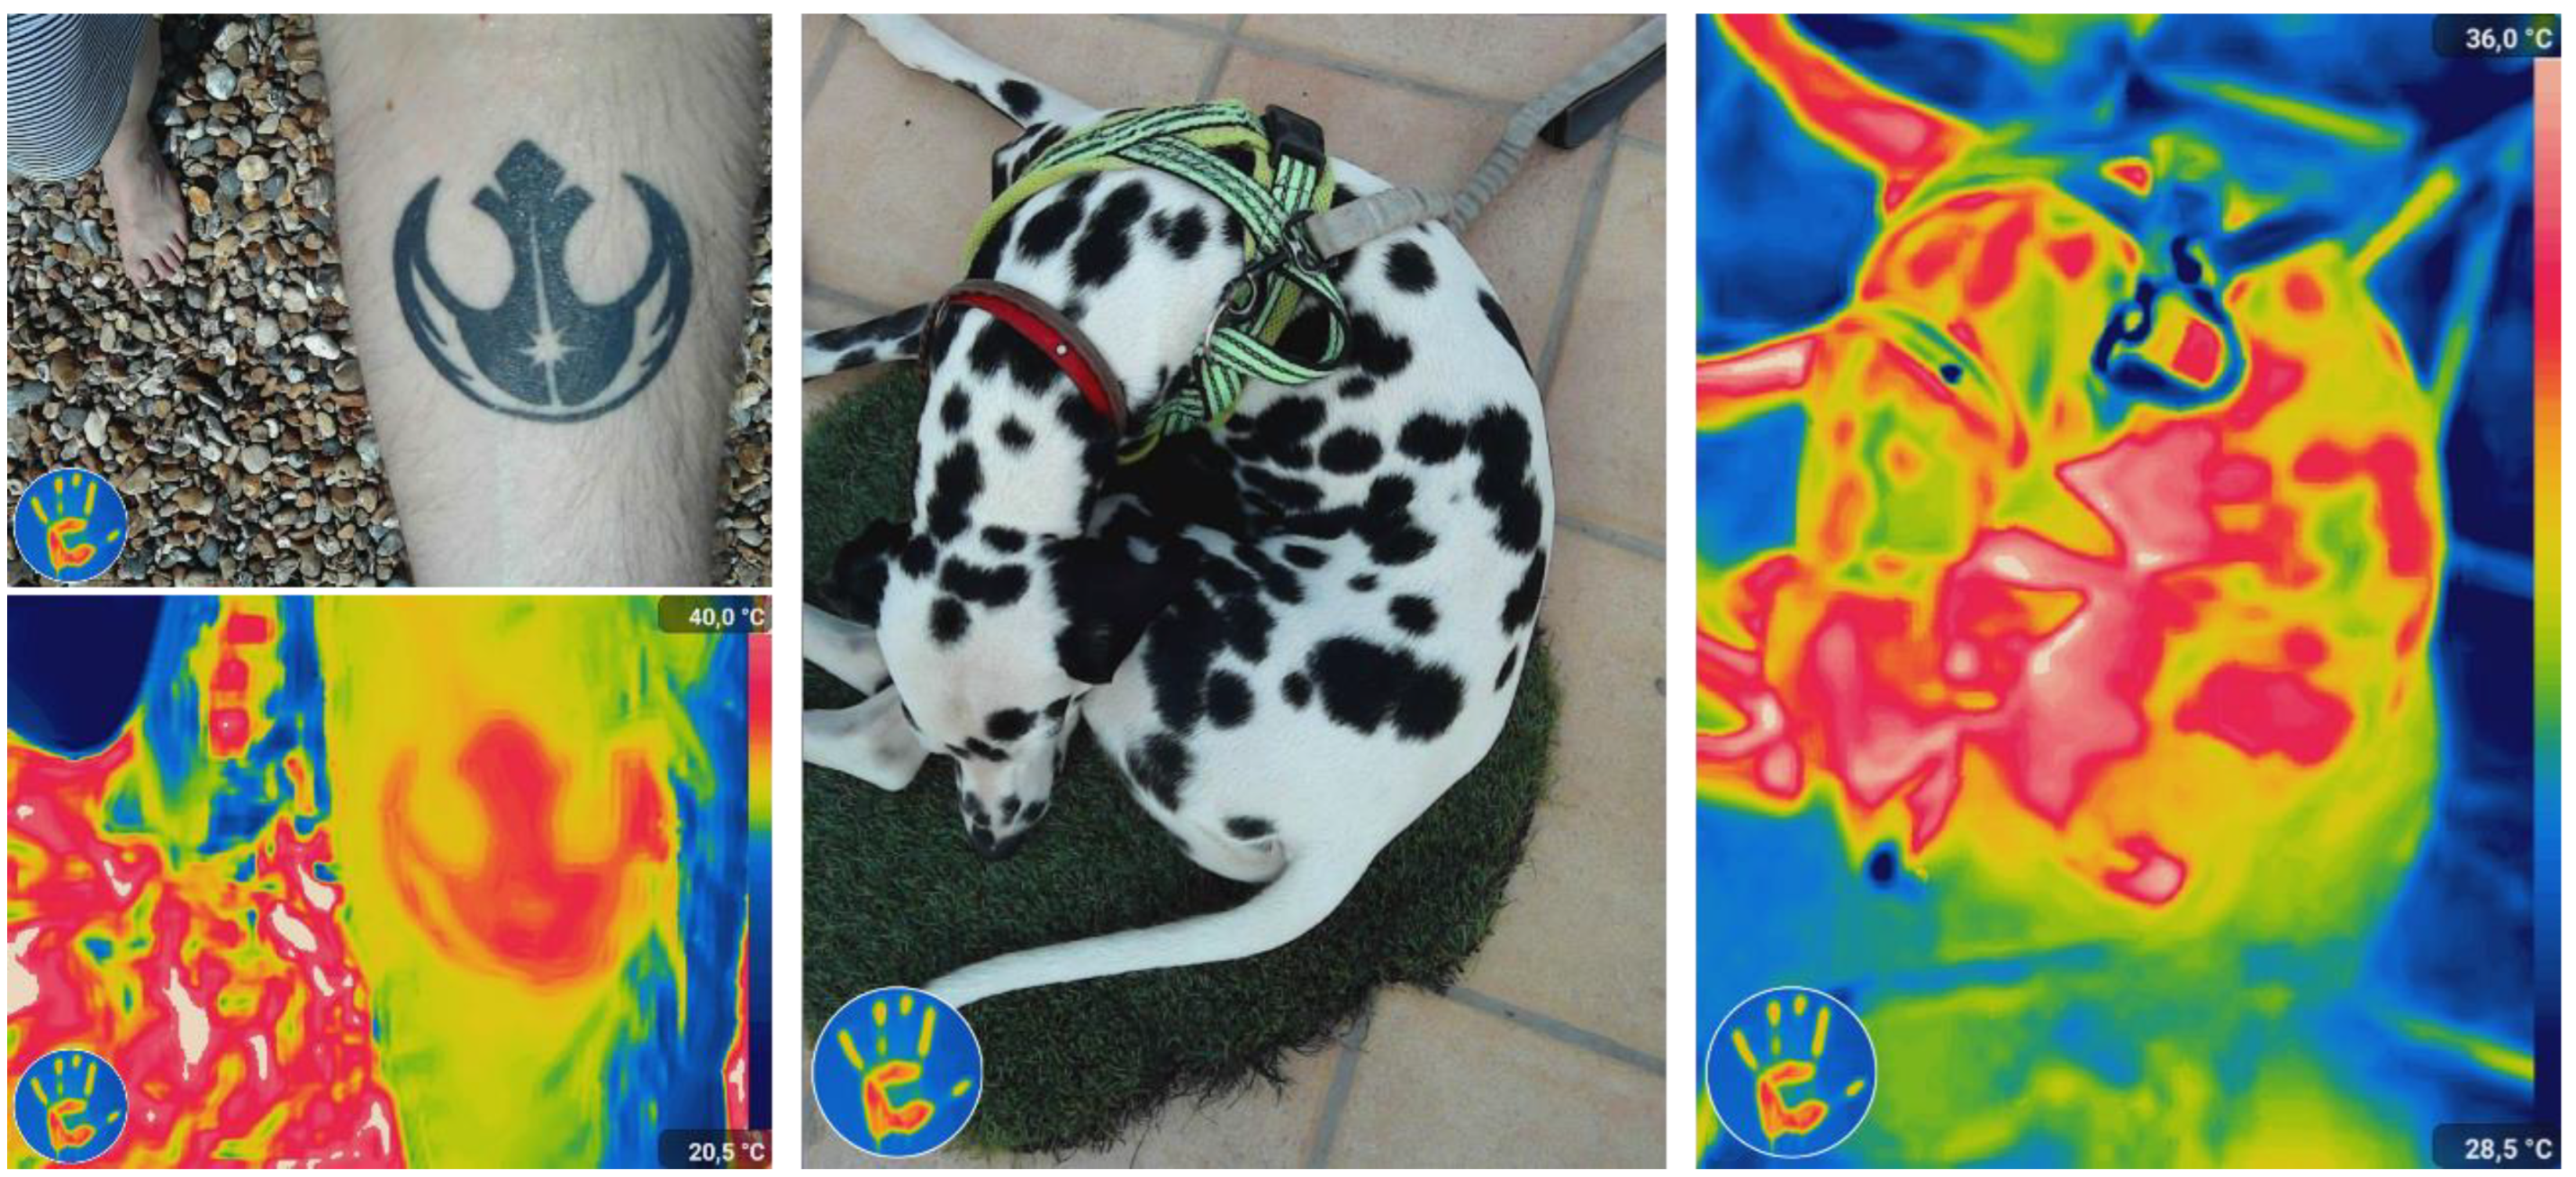
On the other hand, the exposure to sunlight can result into heat absorption by our skin, which increases its temperature. This is even easier to observe on tattooed skin, and even in a Dalmatian fur. The darker areas absorb more heat than the lighter ones, and therefore, their temperature increases, see Figure 2.
In both cases—reflection and absorption—the registered temperature will be higher than our core temperature, and will result into a false fever detection (false positive).
Test 3: Understanding transmittance and absorption.
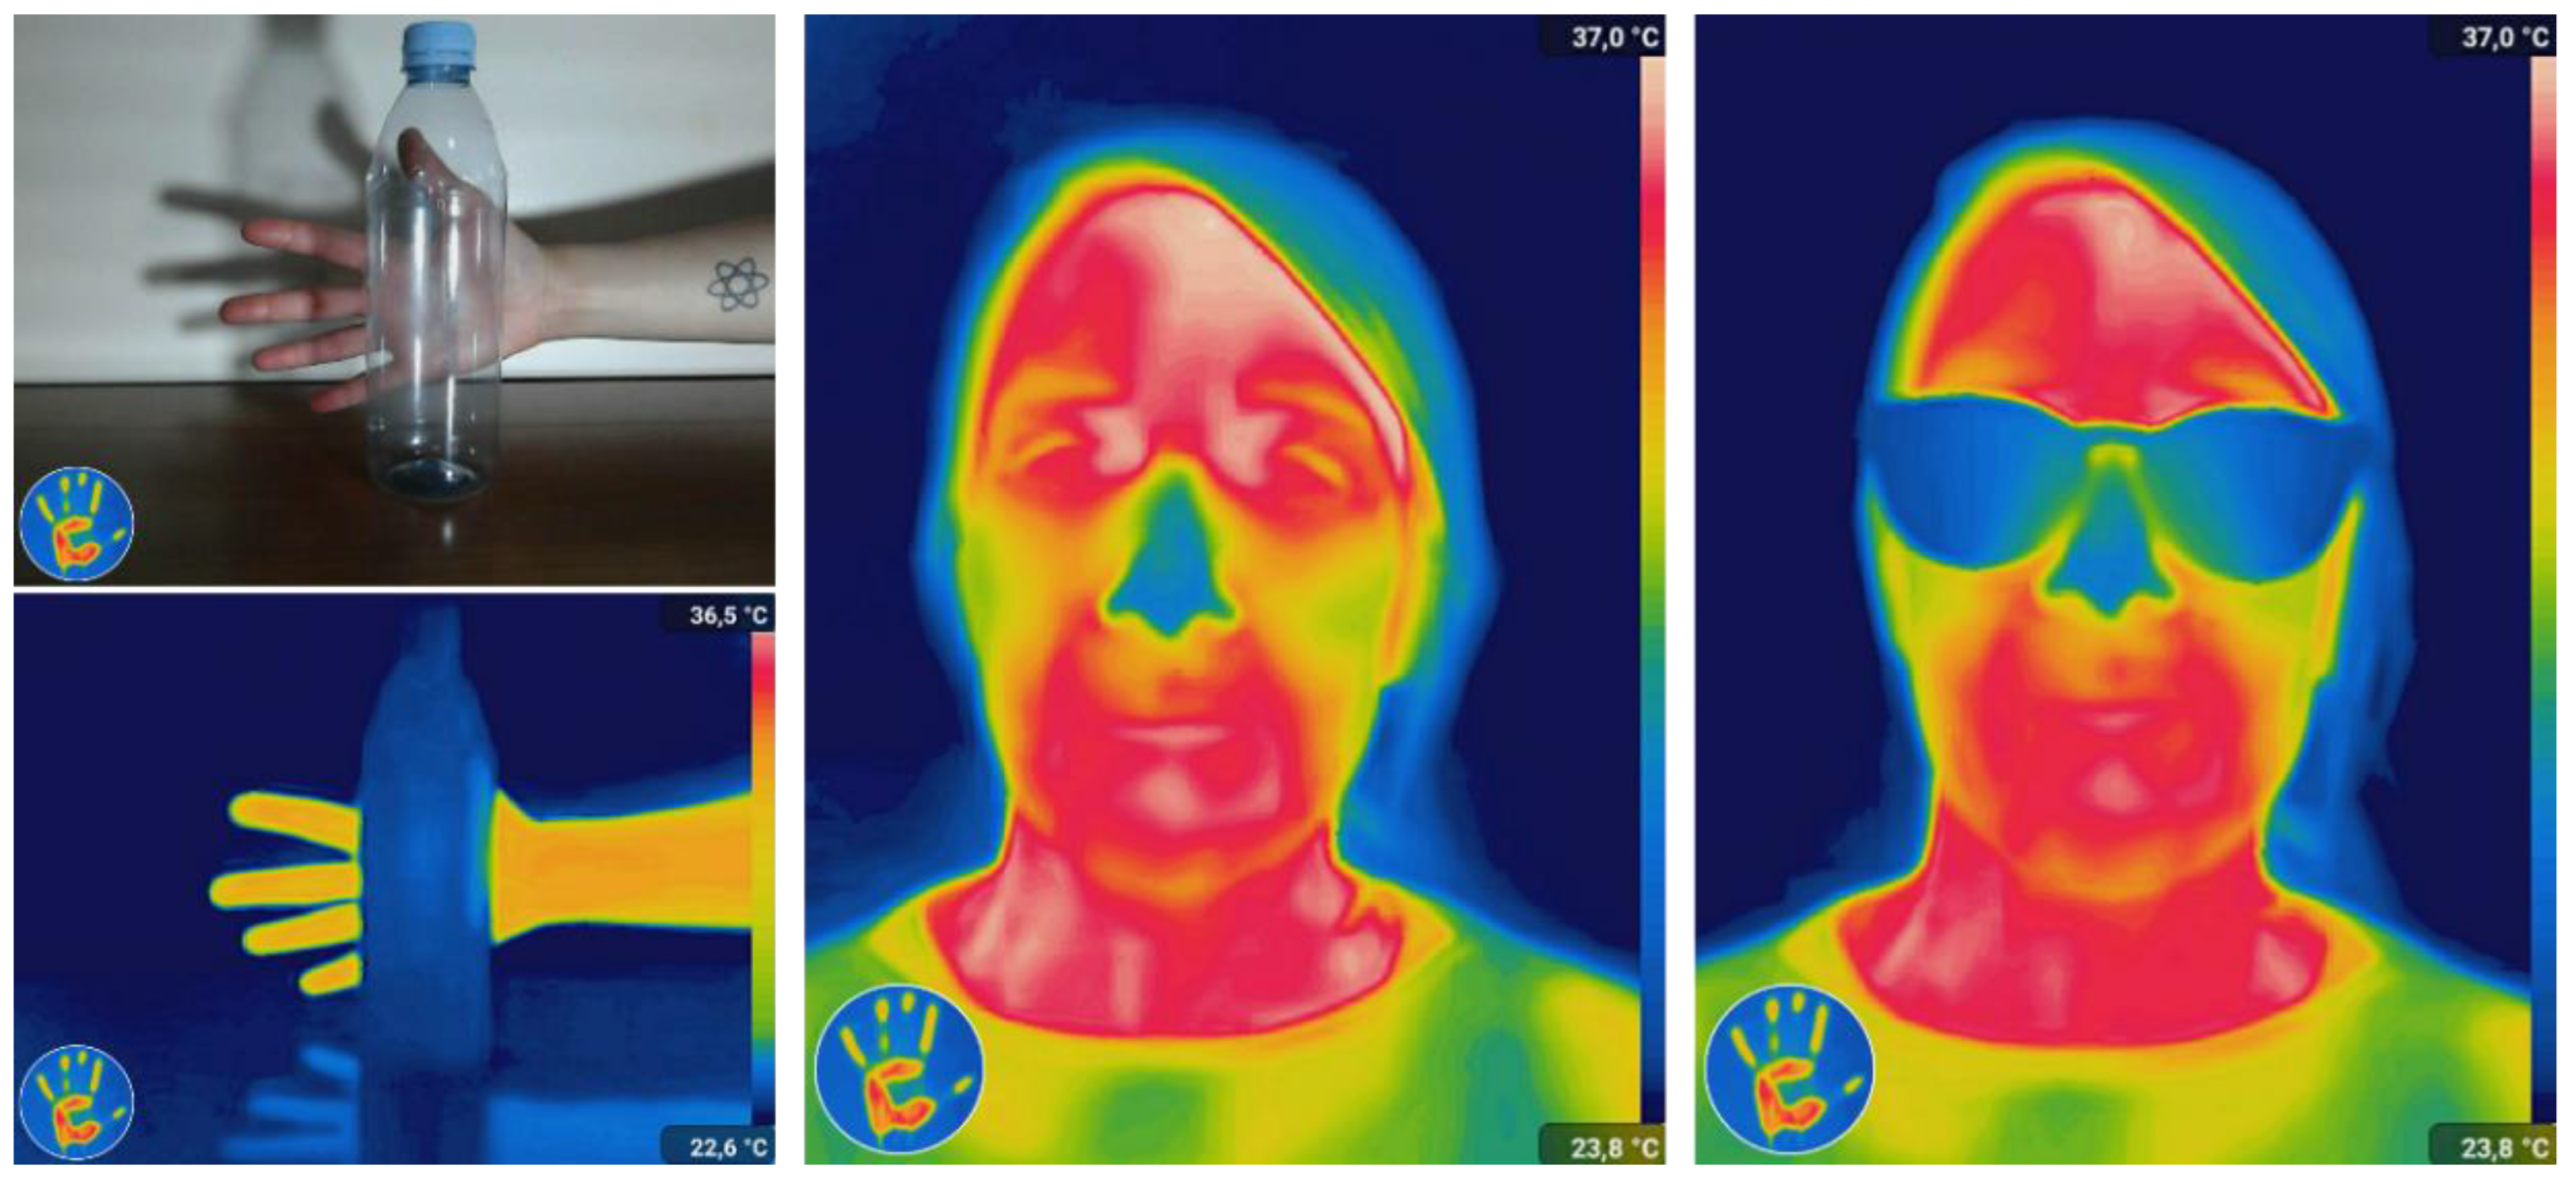
During the pandemic, some contention volunteers have been measuring people’s temperature by pointing thermal cameras through eyeglasses and even face-shields [20]. Special attention must be paid to the transmittance and absorption (abilities to transmit or absorb radiation) of those accessories and protection equipment. Spectacles lenses are made of glass and/or polymers that are transparent to the visible light wavelengths (0.4 μm–0.7 μm) so we can see through them. The same happens to face shields, which are made of the same polymer as water bottles (polyethylene terephthalate or PET) that allows the visible light to pass through. However, in both cases, these glasses and polymers absorb the thermal IR radiation emitted by our body.
In Figure 3, we can observe that, in the visible spectrum, the PET of a water bottle allows us to see a hand behind it (optical image). However, when we use a thermal camera, the heat from our hand is not capable of passing through the bottle. Something similar will happen when we wear eyeglasses or face shields. Our heat will not be able to travel across these accessories, so the thermal camera will register the temperature of such accessories instead of ours, giving rise to a lower measure. In turn, someone with fever could pass undetected in a thermography scanning if wearing those accessories (false negative).
In summary, the selected homemade tests are just one of the many examples in which thermal imaging can be used as a science communication and e-learning tool for the benefit of the general society. In this case, these examples identify and address common mistakes that are repeated by inexperience volunteers in the fight against COVID-19. However, other homemade tests are also designed and posted in @thermogramer to understand and learn about the science behind quotidian situations (such as climate change and global warming, emerging technologies and smart materials, health and personal self-care, popular foodstuff and traditions, among others, see Figure 4), which will ultimately helps the society to make informed decisions in their daily life.

3.2. Impact of @thermogramer on the General Public

@thermogramer was created as a science communication channel in social media (mainly Instagram and Twitter, but also Facebook and TikTok) that also counts with its own website (www.thermogramer.com accessed on 18 January 2022). This project aims to communicate the science behind the heat that surrounds us in our day to day, posting multispectral (thermal and optical) images of different topics of social interest, as listed before. The principles of free-access, simple scientific explanations through layman but rigorous language, and friendly and humorous interactions aims to reach as many different people as possible without targeting a specific sector of the population. Actually, very recent studies showed empirical evidences of humour as a tool to increase engagement in science communication posts on social media [21].
Because this young project was born in September 2018, @thermogramer has already attracted over 1100 followers in Instagram and almost 800 followers in Twitter. Considering the youth of the project and the specific content on thermal imaging science, it is fair to assume that this is a considerably large community. Although future efforts will be oriented towards the expansion of this channel targeting a larger number of “curious minds”.
According to the statistics provided by the used social media platforms, the profile of @thermogramer followers are people with gender parity and mostly in the range of 18 to 44 years. In that regard, and in order to assess an initial impact of @thermogramer on this community in this early stage of the project, we have performed an online survey in Instagram and Twitter. The survey consisted of a series of eight questions (single select multiple choice questions) as listed in Table 1, which were posted on both social media platforms at the same time using their own survey tools. The questions were opened to anyone willing to participate in the survey. Given the ephemeral character of the surveys in the selected platforms (specially on Instagram), results were collected after a period of 24 h.
In this period of time, a representative sample size of n = 74 for Instagram and n = 77 for Twitter were willing to participate in this study in this limited time frame. All questions and responses are summarized in Table 1.
Interestingly, both Instagram and Twitter surveys showed similar results. Around 22% of the participants declared that they did not know anything about thermography before following @thermogramer. Moreover, although a vast majority of the participants already followed other science communication accounts, most of them do not follow any account about thermal imaging different other than @thermogramer. A minimal amount of between 5 and 8% follow this project because of the thermal images alone, while the majority is interested in the combination of thermal imaging with scientific explanations. Furthermore, most of the participants agree that thermal cameras are important in our society, and it is necessary to learn the science behind these instruments if they are going to become users. Related to the knowledge acquired through the @thermogramer channels, most highlight the learning about new technologies, followed by environment and health and self-care. Finally, in the case of professional educators and science communicators, most of them indicated that they have used and/or will use content from this science communication project as teaching material.
Actually, regarding that last question, it should be noted that @thermogramer’s content have been also featured in important media platforms outside social media channels, such as the magazines of Chemical & Engineering News of the American Chemical Society [22] and Business Insider of Springer [23,24], and the Spanish National Public TV shows of “La Sexta Noche” [25], “La Hora de la 1” [26], “Zapeando” [27] and “Espejo Público” [28]. Even more recently, @thermogramer has participated as collaborator in the long-term museum exhibition “Galicia Futura” from 14 July 2021 to 09 January 2022 [29] under the umbrella of the events to commemorate the “Xacobeo Holy Year” 2021–2022 [30], and in the science communication Spanish TV show “Orbita Laika” in prime time with over 483,000 viewers [31].
Nevertheless, it should be noted that this is only a preliminary assessment of the potential impact of using thermal imaging for science communication and e-learning. Therefore, there are some limitations to this preliminary study that will be addressed as the project keeps growing. For instance, it is still early to evaluate the long-term practical implications of this project in the day-to-day lives of the general society. Future surveys with larger sample size will be used to monitor the project impact along time.
In that regard, it is true that this study could have practical implications for encouraging and guiding new researchers and experts in the field of thermography, science communication and/or education to use thermal imaging as a tool to transfer knowledge to the general society. Actually, this has already been demonstrated since traditional media, such as TV, radio, press and even museums have already used content from @thermogramer to communicate science. Moreover, as a potential practical implication for the unexperienced new users, this project will help them to make a better and conscious use of thermal imaging by learning the basic fundaments of thermal properties and thermography, even for those without any previous scientific background. In turn, this project could also inspire future generations of scientists, communicators and educators.

4. Conclusions

In conclusion, this work proposes an innovative application for thermography and for thermal cameras as visual engaging tools for science communication and e-learning in social media platforms. For that purpose, this work presents and evaluates the impact of a young project (@thermogramer) that aims to communicate science in a free-access, simple and layman language way in social media platforms (such as Instagram and Twitter, among others). Furthermore, this work compiles selected homemade test designed for posting on @thermogramer that demonstrate the usefulness of this channel, especially for new and future inexperienced users in the current pandemic times, as well as for science communicators, educators and learners. Interestingly, despite its youth, this project has managed to build a solid and growing community of followers that demonstrates the social interest and necessity for this type of initiatives. Additionally, the designed content for this project has helped its community for learning/teaching activities and has been also featured in recognized mass media such as science magazines, TV shows and museums. Therefore, these findings highlight the great potentiality of thermal imaging as a science communication and e-learning tool not only on traditional media but also on social media, which is anticipated to gain more and more interest in the near future. Accordingly, we expect that this work will encourage the community of scientists, communicators and educators to create similar innovative projects for free public education.

Funding

This work was funded by Xunta de Galicia and Spanish Ministry of Science (PDC2021-121076-I00).

Institutional Review Board Statement

The Ethics Committee for Research and Teaching of the Universidade of A Coruña declares that this publication is exempt from the need for approval from this committee. This declaration is based on the fact that the images do not meet legal requirements to be considered as unlawful interference (Organic Act 1/5 May 1982), nor personal data (Organic Act 3/5 December 2018), and the surveys carried out do not involve personal data.

Informed Consent Statement

The participants of the surveys were informed that the results will be included in this study and not personal data are held and/or disclosed by the author.

Data Availability Statement

Data and thermal images will be available by request.

Acknowledgments

The author thanks Lorena Alonso-Maranon for useful discussions. The author also thanks Xunta de Galicia for a Postdoctoral Fellowship and for the collaboration agreement Development of research strategic actions UDC I+D+i 2021-2022: CICA-Disrupting Projects 2021SEM-A3 (NanoCool).

Conflicts of Interest

The author is the creator of @thermogramer, a science communication project on social media.

References

  1. Mariš, L.; Adamová, V. Global Economic Impacts of COVID 19 to Increase the Protection of Society by Using Thermal Imaging Cameras to Measure the Temperature of Human Body. SHS Web Conf. 2021, 92, 01031. [Google Scholar] [CrossRef]
  2. Wilson, T.; Wilson, D. The Noninvasive Laboratory—History and Future of Thermography. Angiol. J. Vasc. Dis. 1985, 36, 341–353. [Google Scholar] [CrossRef]
  3. Valleriani, M. Galileo Engineer; Springer Science and Business Media: Amsterdam, The Netherlands, 2010. [Google Scholar]
  4. Ring, E.F.J. History of thermology and thermography: Pioneers and progress. Thermol. Int. 2012, 22, 3–7. [Google Scholar]
  5. Plank, M. On an Improvement of Wien’s Equation for the Spectrum. Ann. Phys. 1900, 1, 719–721. [Google Scholar]
  6. Meola, C. Infrared Thermography Recent Advances and Future Trends; Bentham Books: Sharjah, United Arab Emirates, 2012; ISBN 978-1-60805-521-0. [Google Scholar]
  7. Vollmer, M.; Möllmann, K.-P. Infrared Thermal Imaging: Fundamentals, Research and Applications, 2nd ed.; Wiley: London, UK, 2017. [Google Scholar]
  8. Ferreira, M.E.; André, A.C.; Pitarma, R. Potentialities of thermography in ecocentric education of children: An experience on training of future primary teachers. Sustainability 2019, 11, 2668. [Google Scholar] [CrossRef] [Green Version]
  9. Vollmer, M.; Möllmann, K.P. Infrared cameras as accessories to smartphones: Facts you need to know. Phys. Educ. 2018, 53. [Google Scholar] [CrossRef]
  10. Haglund, J.; Jeppsson, F.; Melander, E.; Pendrill, A.M.; Xie, C.; Schönborn, K.J. Infrared cameras in science education. Infrared Phys. Technol. 2016, 75, 150–152. [Google Scholar] [CrossRef] [Green Version]
  11. Rodriguez-Gonzalvez, P.; Rodriguez-Martín, M. Design of a didactical activity for the analysis of uncertainties in thermography through the use of robust statistics as teacher-oriented approach. Remote Sens. 2021, 13, 402. [Google Scholar] [CrossRef]
  12. Green, T.C.; Gresh, R.H.; Cochran, D.A.; Crobar, K.A.; Blass, P.M.; Ostrowski, A.D.; Campbell, D.J.; Xie, C.; Torelli, A.T. Invisibility Cloaks and Hot Reactions: Applying Infrared Thermography in the Chemistry Education Laboratory. J. Chem. Educ. 2020, 97, 710–718. [Google Scholar] [CrossRef]
  13. Collins, K.; Shiffman, D.; Rock, J. How are scientists using social media in the workplace? PLoS ONE 2016, 11, 1–10. [Google Scholar] [CrossRef] [PubMed] [Green Version]
  14. Mnkandla, E.; Minnaar, A. The Use of Social Media in E-Learning: A Metasynthesis. Int. Rev. Res. Open Distrib. Learn. 2017, 18, 227–248. [Google Scholar] [CrossRef]
  15. Yammine, S.Z.; Liu, C.; Jarreau, P.B.; Coe, I.R. Social media for social change in science. Science 2018, 360, 162–163. [Google Scholar] [CrossRef] [PubMed] [Green Version]
  16. Quilty, B.J.; Clifford, S.; Flasche, S.; Eggo, R.M. Effectiveness of airport screening at detecting travellers infected with novel coronavirus (2019-nCoV). Eurosurveillance 2020, 25, 1–6. [Google Scholar] [CrossRef] [PubMed]
  17. Slade, D.H.; Sinha, M.S. Return to work during coronavirus disease 2019 (COVID-19): Temperature screening is no panacea. Infect. Control Hosp. Epidemiol. 2021, 44, 1166–1167. [Google Scholar] [CrossRef] [PubMed]
  18. Huizenga, C.; Zhang, H.; Arens, E.; Wang, D. Skin and core temperature response to partial- and whole-body heating and cooling. J. Therm. Biol. 2004, 29, 549–558. [Google Scholar] [CrossRef] [Green Version]
  19. Lacasa, A. Journalist Discovers He Has Fever On-Air At Hospital. Fourth Estate Alliance, 17 April 2020. Available online: https://fourthestatealliance.org/on-air-journo-checks-temp-at-covid-hospital-has-fever/ (accessed on 23 December 2021).
  20. Thermal Camera Pointing through Face Shield. Europapress Photos, 11 May 2020. Available online: https://fotos.europapress.es/temasactualidad/f3073902/ (accessed on 23 December 2021).
  21. Yeo, S.K.; Su, L.Y.F.; Cacciatore, M.A.; McKasy, M.; Qian, S. Predicting Intentions to Engage With Scientific Messages on Twitter: The Roles of Mirth and Need for Humor. Sci. Commun. 2020, 42, 481–507. [Google Scholar] [CrossRef]
  22. Bourzac, K. Hot Pics. Chem. Eng. News 2019, 97, 48. Available online: https://pubs.acs.org/doi/10.1021/cen-09729-newscripts (accessed on 23 December 2021).
  23. Aguiar, A.R. Las cámaras térmicas que las empresas estáninstalando para frenar el coronavirus no soninfalibles: Se pueden “hackear” con agua fría, mascarillas o reflejos de luz. Business Insider, 11 May 2020, 1–8. Available online: https://www.businessinsider.es/pueden-hackear-camaras-termicas-frenar-coronavirus-636955 (accessed on 23 December 2021).
  24. Aguiar, A.R. Así registra una cámara térmica la temperaturade tu cara si te has mojado con agua fría o llevas gafas: Los puntos ciegos de una tecnología esencial para la desescalada. Business Insider, 12 May 2020, 1–9. Available online: https://www.businessinsider.es/6-fotos-camara-termica-frente-caras-agua-fria-gafas-638459 (accessed on 23 December 2021).
  25. “La Sexta” Noche TV Show on the Spanish National TV channel “La Sexta” (Broadcasted on 10 October 2020). Available online: https://www.atresplayer.com/lasexta/programas/lasexta-noche/2020/10-10-20-jose-luis-martinez-almeida-mercedes-mila-y-miguel-sebastian_5f80426b7ed1a89e4ce69144/ (accessed on 23 December 2021).
  26. “La Hora 1” TV Show -Termómetros, ¿cuál es el más efectivo?- on the Spanish National TV channel “La 1” (Broadcasted on 10/11/2020). Available online: https://www.rtve.es/noticias/20201110/mejor-termometro-fiebre-temperatura-coronavirus-covid/2054794.shtml (accessed on 23 December 2021).
  27. “Zapeando” TV Program, Episode 1626 on the Spanish National TV Channel “La Sexta” (Broadcasted on 29 June 2020). Available online: https://www.atresplayer.com/lasexta/programas/zapeando/temporada-1/29-06-20_5efa07077ed1a8c67af7b434/ (accessed on 23 December 2021).
  28. “Espejo Público” TV Show on the Spanish National TV channel “Antena 3” (Broadcasted on 24 August 2020). Available online: https://www.instagram.com/tv/CaqFKTPle7G/?utm_medium=copy_link (accessed on 3 March 2022).
  29. Galicia Futura” Museum Exhibition in Gaiás Museum, Santiago de Compostela (Spain) from 14 July 2021 to 9 January 2022. Available online: https://www.cidadedacultura.gal/gl/system/files/downloads/2021/07/galiciafutura_english_texts.pdf (accessed on 23 December 2021).
  30. Holy Year Xacobeo 2021–2022. Available online: https://xacobeo2021.caminodesantiago.gal/en/home (accessed on 23 December 2021).
  31. “Orbita Laika” Science Communication TV Show on the Spanish National TV Channel “La 2” (Broadcasted on 14 Decmeber 2021). Available online: https://www.rtve.es/play/videos/orbita-laika/orbita-laika-spain-quimica/6246319/ (accessed on 23 December 2021).
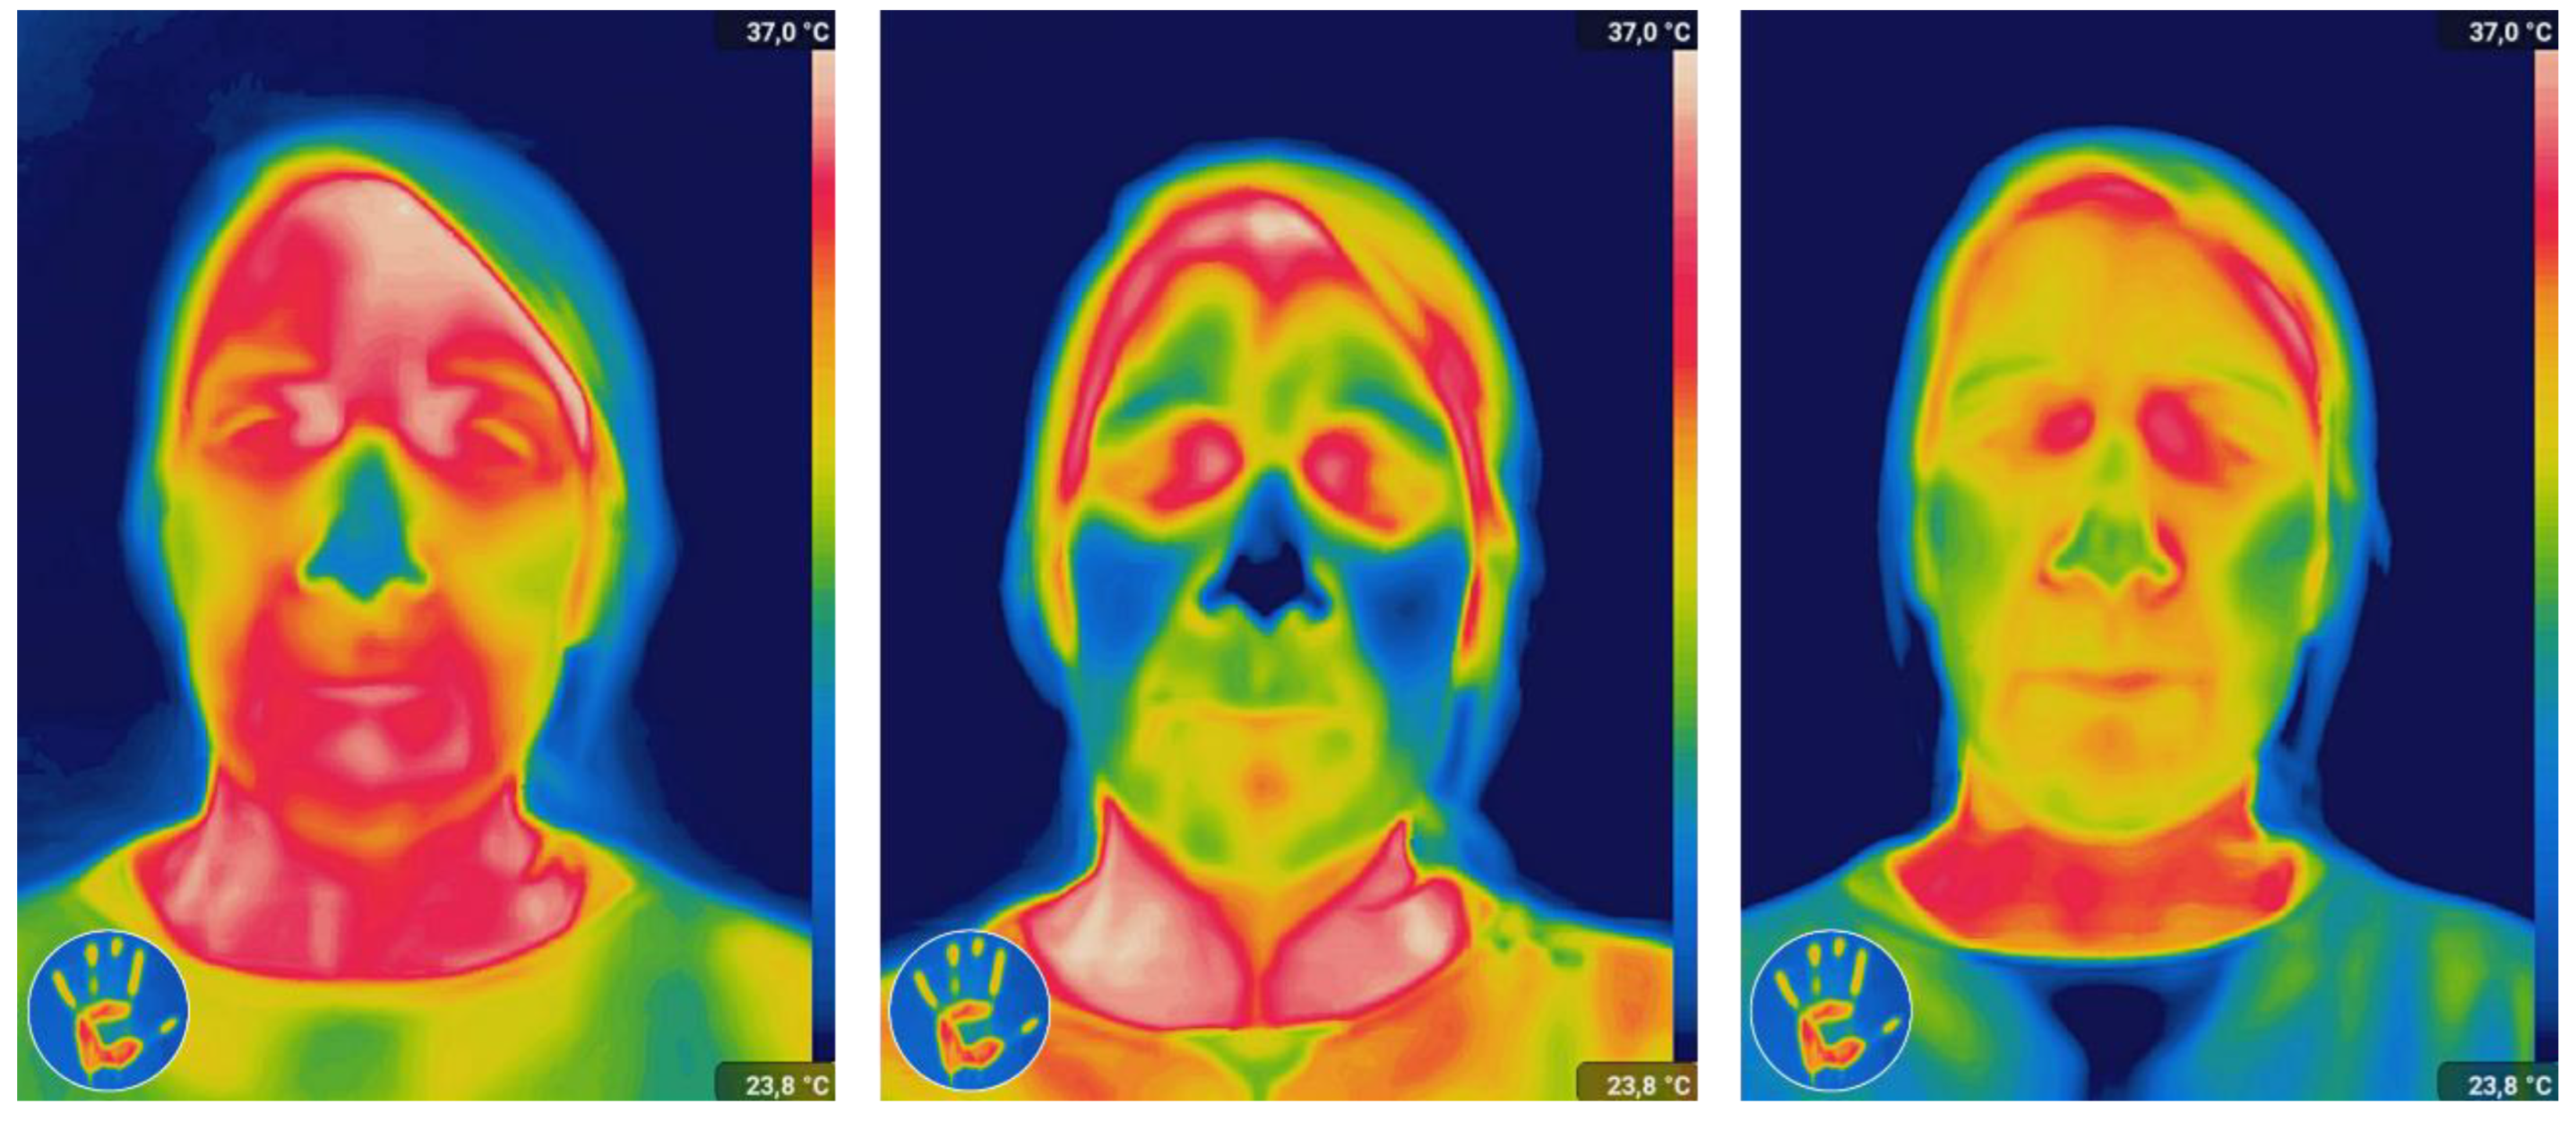
Figure 1. Homemade test 1 showing thermal images of the facial temperature of a person in normal resting situation (left), after washing her face with cold water (middle), and after washing her face with wet wipes (right). Images reproduced with permission from the social media channel @thermogramer.
Sustainability 14 03096 g001
Figure 2. Homemade test 2 showing optical and thermal images of tattooed skin (left-top and left-bottom), and optical and thermal images of a Dalmatian (middle and right) under sunlight exposure. Images reproduced with permission from the social media channel @thermogramer.
Sustainability 14 03096 g002
Figure 3. Homemade test 3 showing optical and thermal images of a hand behind a water bottle (left-top and left-bottom), and thermal images of a person without accessories and wearing spectacles (middle and right). Images reproduced with permission from the social media channel @thermogramer.
Sustainability 14 03096 g003
Figure 4. Examples of homemade tests showing thermal images of Spanish water-storage ceramic pot called “botijo” to illustrate evaporative refrigeration technologies (left), of increase of blood stream towards the breasts of a five-month pregnant woman (middle), and of the flames of the Galician burning-drink called “queimada” that reduces the alcoholic content of the initial strong spirit (right). Images reproduced with permission from the social media channel @thermogramer.
Sustainability 14 03096 g004
Table 1. Summary of questions and answers provided in the online survey performed to evaluate @thermogramer impact on the general public.
QuestionsAnswersInstagram (n = 74)Twitter (n = 77)
Did you know what is thermal imaging (or thermography) before following @thermogramer?Yes75.7%77.9%
No21.6%22.1%
I thought it was another thing1.3%0.0%
Do you follow more channels/accounts about thermal imaging or thermography?Yes6.8%2.6%
No87.8%96.1%
Do you follow more channels/accounts about science communication?Yes70.3%97.4%
No29.7%2.6%
Why do you follow @thermogramer?Thermal Images8.1%5.2%
Science explanations13.5%18.2%
Both66.2%41.6%
Other5.4%5.2%
Do you consider that thermal cameras are important in our society?Yes94.6%80.5%
No4.0%6.5%
Taking into account that soon enough we all could have thermal cameras in our smartphone, do you consider important to know the science behind these instruments?Yes89.2%77.9%
No6.8%9.1%
About what did you learn in @thermogramer?New technologies44.6%45.5%
Environment14.8%11.7%
Health and self-care 13.5%7.8%
Other5.4%10.4%
If you work in education or science communication, would you use any content from @thermogramer for teaching?Yes, I already did it.6.8%7.8%
Yes, I will do it.44.6%36.4%
No, it is not adequate for me.23.0%23.4%
Rest of percentages up-to 100 % are missing or N/A responses.
Publisher’s Note: MDPI stays neutral with regard to jurisdictional claims in published maps and institutional affiliations.