Article

Does High-Speed Rail Operation Reduce Ecological Environment Pressure?—Empirical Evidence from China

College of Public Administration, Nanjing Agricultural University, Nanjing 210095, China
*
Author to whom correspondence should be addressed.
Sustainability 2022, 14(6), 3152; https://doi.org/10.3390/su14063152
Submission received: 21 January 2022 / Revised: 3 March 2022 / Accepted: 4 March 2022 / Published: 8 March 2022
(This article belongs to the Section Environmental Sustainability and Applications)

Abstract

:
With improved productivity, the impact of social and economic development on the ecological environment is becoming more and more significant, and the transformation of transportation modes often accompanies the transformation of the economic development mode. It is essential to study the impact of high-speed rail (HSR) on the environment. This article constructs a compiled index Ecological Environment Pressure (EEP) evaluation system. The spatial analysis tool is then used to explore the temporal and spatial evolution characteristics of EEP in China. The Difference-in-Difference (DID) method and the Propensity Score Matching (PSM) method are used to quantitatively calculate the impact of HSR operations on EEP based on Panel Data. The results show that the EEP in China decreased significantly from 2003 to 2018, and therefore the quality of China’s ecological environment is improving. The regression coefficient of HSR on EEP is significantly negative, indicating that HSR operations will reduce EEP. Additionally, the HSR operation in the eastern and central regions negatively impacts the EEP. At the same time, the HSR operations will also reduce the EEP of resource-based cities, especially for resource-based cities in the central region. The degree of industrial transformation (DIT) and degree of employment transformation (DET), combined with the implementation of HSR operations, can significantly reduce the EEP. It is suggested to formulate more focused actions and policies to reduce EEP and effectively promote sustainable social development.

1. Introduction

Humans are the most active contributors to the ecosystem. Since the 1860s, humanity has created a brilliant material civilization with the help of powerful technological means [1]. Technological changes are reflected in the changes in transportation modes, which will impact the development of the ecological environment. The construction of transportation infrastructure brings convenience to people’s lives and promotes social progress but also causes damage to the environment to varying degrees. Many studies have explored the relationship between traffic activities and environmental pollution. In the early stage of research, most scholars undertake qualitative analysis studies. For example, Mohring (1987) believes that rail transit facilities can attract some private car drivers to transfer to other modes of transportation, reducing urban air pollution [2]. Scholars then began to demonstrate the various factors related to pollution emission in the transportation network and the degree of their influence.
Environmental issues are not conducive to regional economic development, which affects the growth of economic efficiency and the health of residents [3]. Therefore, a United Nations report put forward a sustainable development strategy, and sustainable development has since become the consensus of society. Countries worldwide place the issue of ecological environmental protection in a vital position in the country’s future development. At present, the world’s environmental problems mainly come from three aspects: the pressure of industrial pollution [4], the pressure of ecological restoration and protection [5], and the pressure caused by the unsatisfactory living environment [6]. Since the 1970s, due to the energy crisis, technological progress, and traffic safety issues, people have realized HSR’s social and economic value. HSR has gradually become a new demand for modern social and economic development [7,8]. With this efficient new rail transit, can the development of HSR effectively reduce EEP?
In recent years, some scholars have tried to explore the changing characteristics of the ecological environment from HSR operations. Their studies found that HSR uses less fossil fuels and contributes to the reducing of carbon emissions compared to traditional modes of transportation [9]. In the life cycle of HSR, the line construction stage’s energy consumption and carbon emissions are the largest [10]. It is widely believed that the role of HSR in reducing pollution is achieved by changing the choice of private travel modes, thereby reducing vehicle exhaust emissions. Some scholars have discussed the impact of the opening of HSR from the perspective of factor flow from space. They believe that the opening of HSR aggravates the “siphon effect” or “spillover effect” of central cities and promotes the economic growth of central cities. The transfer of industries with high energy consumption and low added value to the surrounding cities has adversely affected the ecological environment of small cities [11,12,13]. Some studies have also found that HSR can reduce pollution by replacing traditional transportation methods. However, the expansion of output scale brought about by HSR operations will also increase pollution emissions, offset the emission reduction effect and ultimately hurt the environment [14].
There are two main viewpoints in the research literature on the impact of HSR operation on the ecological environment. First, the operation of HSR will improve the quality of the regional ecological environment by significantly reducing a single indicator of the ecological environment. These indicators mainly include carbon dioxide emissions, air pollution, and soil quality. Second, compared with other modes of transportation, HSR does cause minor damage to the ecological environment, but HSR operation also negatively affects ecological and environmental indicators. In natural science, scholars often use scientific instruments to measure air quality, soil quality and water quality and then obtain the impact of HSR construction on the environment. In social science, research on the relationship between HSR and the ecological environment mainly includes HSR operation, carbon dioxide emissions, air pollution, and a green economy. At the same time, the research methods mostly use measurement methods, such as traditional mediation utility models, structural equation models, and policy evaluation models.
In conclusion, HSR is the product of this new era. There are few studies on the impact of HSR on the environment. Most of these studies focus on unilateral and single index research on HSR operation and the ecological environment, lack of research on the temporal and spatial evolution of the ecological environment. They cannot reflect the relationship between HSR operations and the overall level of ecological environment development. The research dimension is relatively single.
The purpose of this paper is to solve two research questions. First of all, from the comprehensive evaluation of the ecological environment pressure index system, does the operation of HSR also have the phenomenon of effectively alleviating the ecological environment pressure? Second, how does the operation of HSR affect the pressure on the ecological environment? This paper selects China as the research object to explore the impact of HSR construction on the pressure on the ecological environment. In the 21st century, with the rapid development of China’s economy, China’s HSR has ushered in an uptake in construction. By the end of 2019, China’s HSR operating mileage was 35,000 km, accounting for about 70% of the world’s total HSR mileage. At the same time, as the largest developing country, coordinating economic construction and environmental protection issues in China is an essential link for developing countries to implement sustainable development strategies. Therefore, it is significant to take China as a research area. The main research objectives of this paper are as follows: (1) Construct an index system that can better reflect the pressure on the ecological environment; and (2) Explore the heterogeneous impact of HSR operations under the pressure of the ecological environment. The effect of environmental stress and the mechanism of HSR construction on EEP is analyzed. Exploring the relationship between HSR construction and EEP is of great practical significance for developing countries to formulate scientific and reasonable social and economic development policies and to reduce EEP. This study provides an important reference for developing countries’ environmental protection, regional development, and ecological civilization construction.

2. Materials and Methods
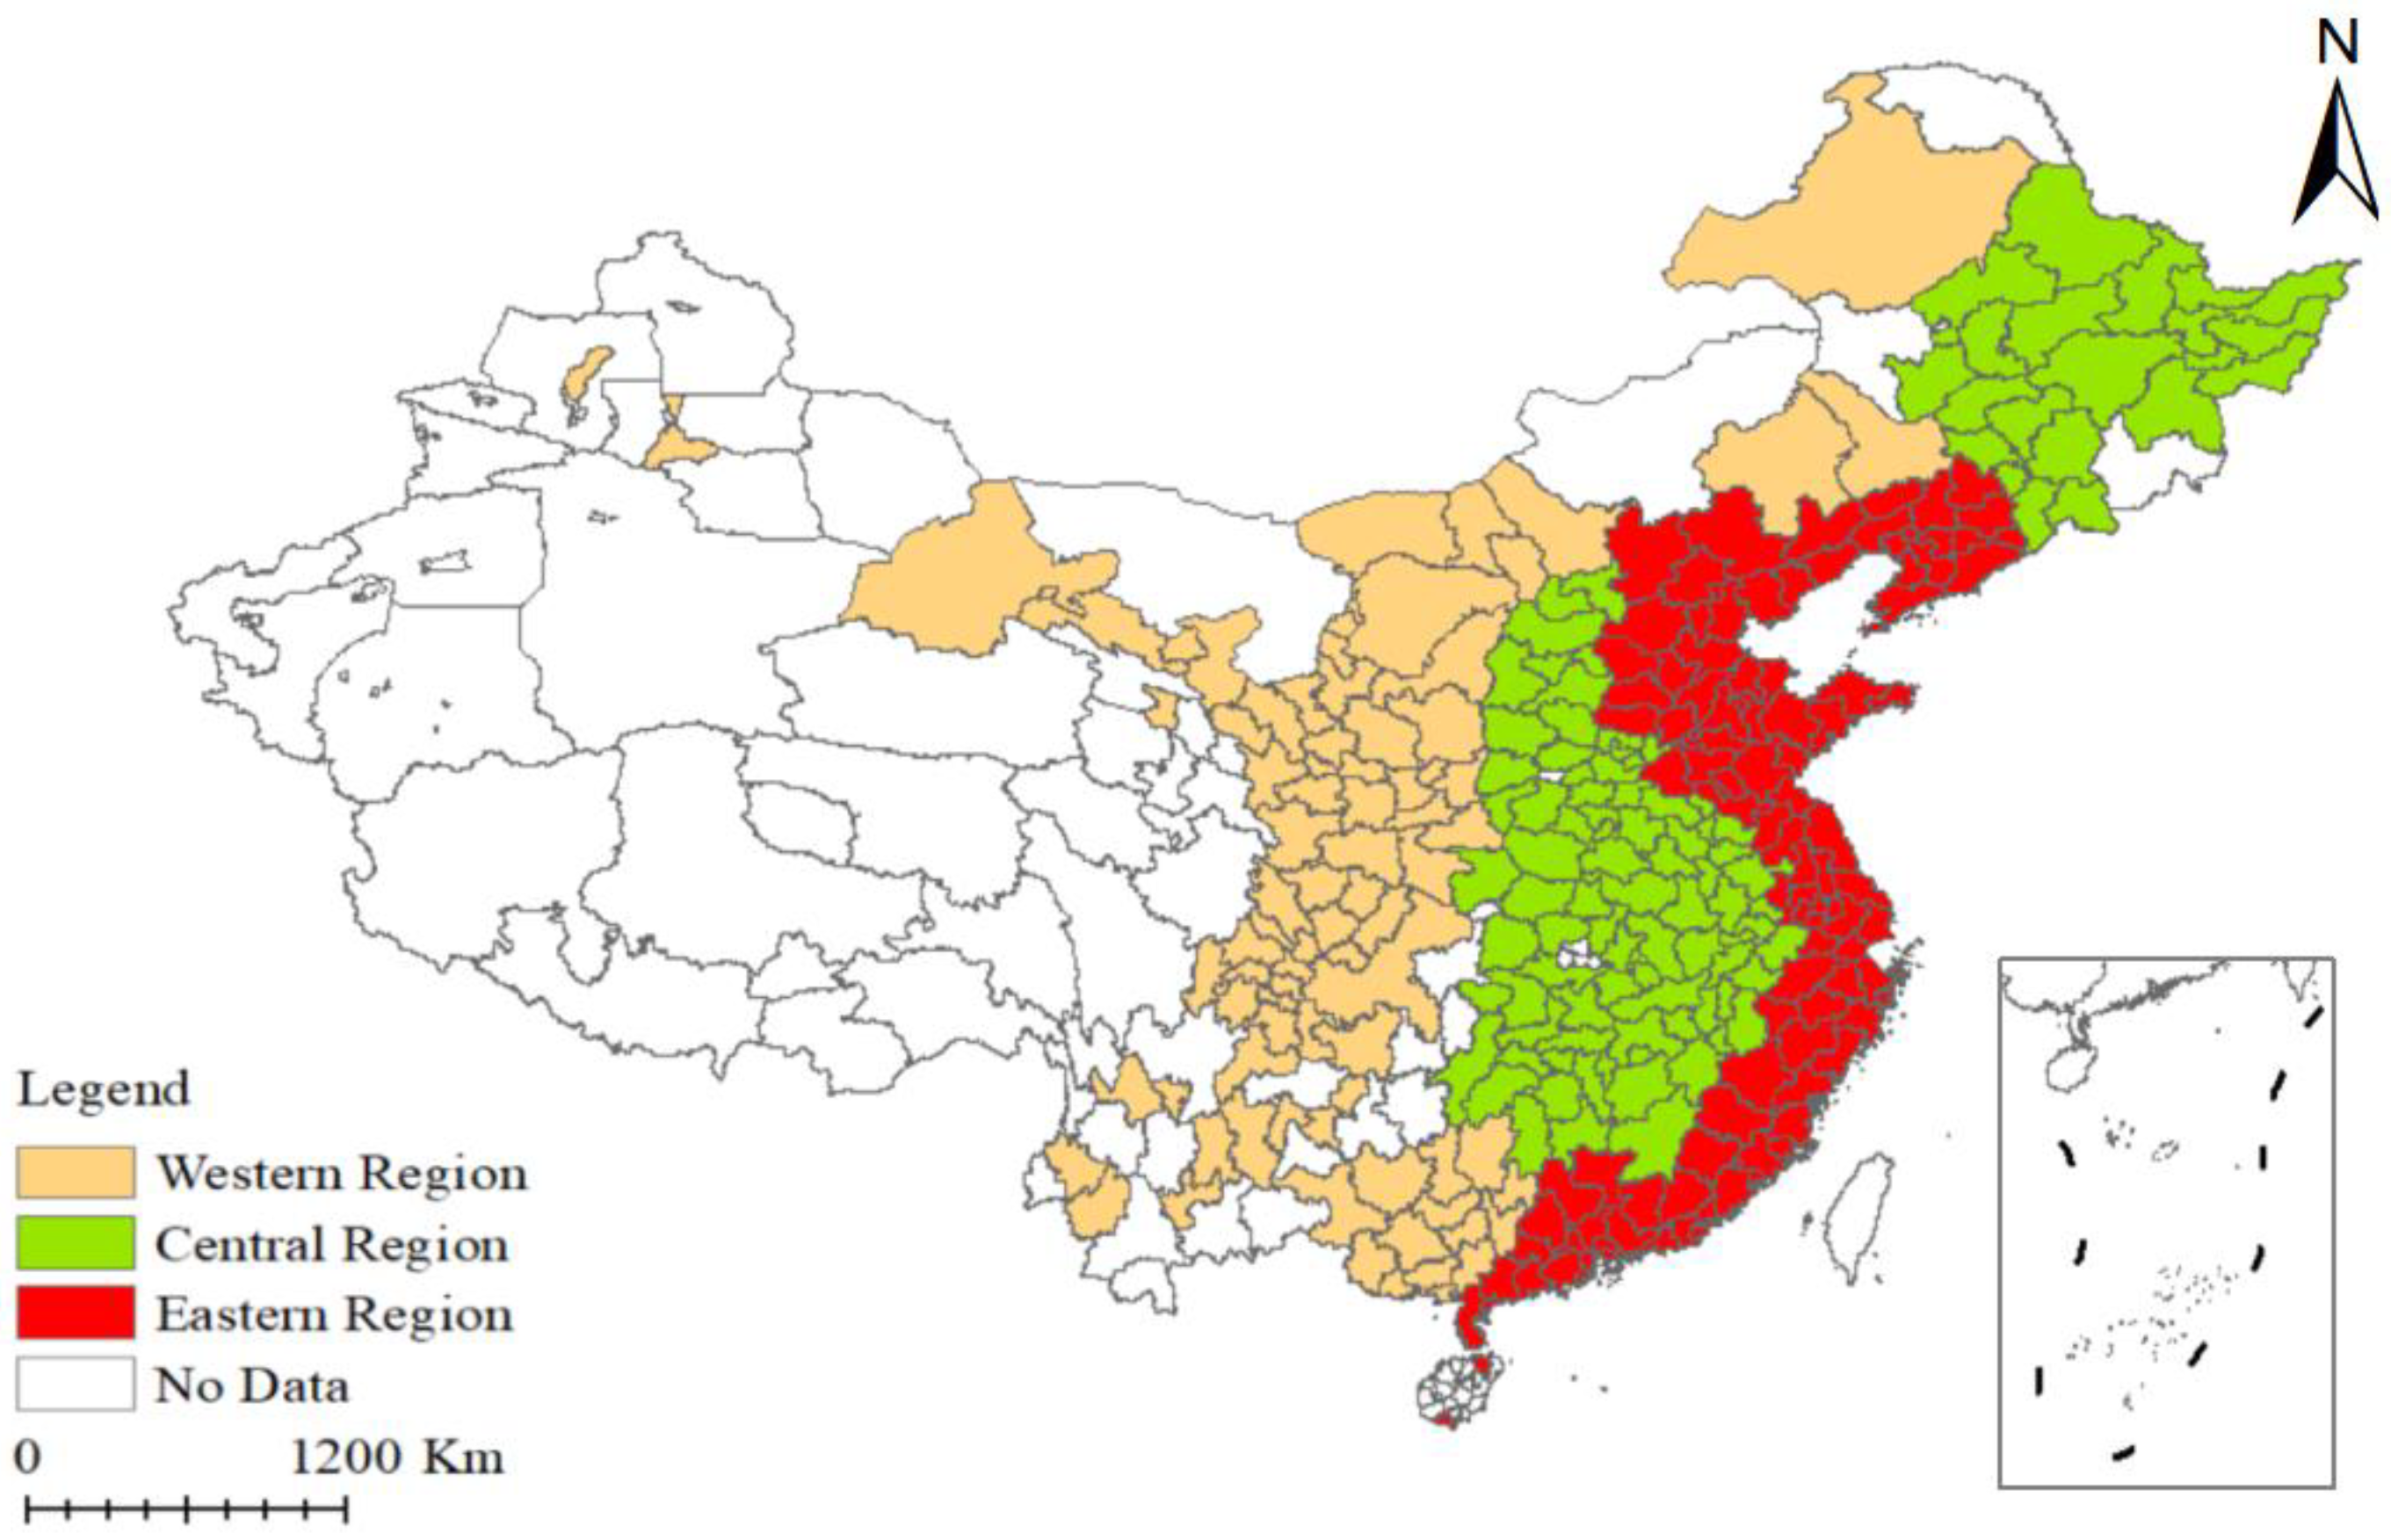
2.1. Study Area

The research area includes 284 primary research regions, including 101 research units in the eastern region, 100 research units in the central region and 83 research units in the western region, as shown in Figure 1. China’s eastern, central and western regions have different levels of economic development and different degrees of industrial transformation, which leads to differences in environmental pollution problems in different regions to a certain extent. In this paper, when studying the impact of HSR construction on the EEP of different regions, exploring the relationship between HSR construction and EEP is of great practical significance for developing countries to formulate scientific and reasonable social and economic development policies and reduce EEP. Using the panel data, based on the calculation of the EEP index, the temporal and spatial evolution characteristics of China’s urban ecological pressure are explored. The impact of HSR construction on EEP is quantitatively calculated based on the Difference-in-Difference (DID) method. The appropriate use of sub-regional research is important for formulating environmental protection policies and sustainable development policies according to local conditions.

2.2. Indicator System

As argued in previous studies, EEP includes the negative effects of resources and the environment caused by population and economic growth and human actions to improve the ecological environment. The EEP is formed by the coupling of humans’ destruction of the ecological environment and humans’ protection of the ecological environment. The EEP index system should reflect the interactive relationship between humans and the environment, which is dynamic. If human demand for the environment is excessive, it will cause damage to the ecological environment, and the EEP will increase. When human demand for the environment is appropriate and willing to protect the environment, the EEP will decrease.
Excessive demands on natural materials and energy in resource development will bring about high potential risks from the perspective of natural resources. The shortage of water resources and mineral resources are both problems that affect the future. On the one hand, the human demand for land, water, fossil fuels, organisms and other natural resources is increasing, causing the problem of resource shortage. On the other hand, human beings discharge more and more pollutants into soil, water and the atmosphere, increasing environmental pollution. Therefore, this paper selects five indicators to represent the human consumption of natural environmental resources, including soot emission [15], carbon dioxide emission [16], wastewater emission [17], social power consumption [18] and PM2.5 [19].
From the perspective of human protection of the natural environment, some countries have banned deforestation and established national ecological protection bases. Moreover, they have vigorously publicized the awareness of protecting the natural environment so that people can consciously protect it, such as by waste classification and treatment, waste recycling, planting trees and grass, and restoring vegetation coverage. At the same time, in terms of social production, more industries with high technology and high output value are used to replace industries with high energy consumption. Based on this, five indicators are selected to indicate the degree of human protection of the ecological environment, including the comprehensive utilization rate of industrial solids [20], greening areas [21], the sewage treatment rate [22], the degree of employment structure and the degree of industrial transformation [23].
This paper then establishes the EEP index rating system, as shown in Table 1. Carbon dioxide emission from scientific data [24], PM2.5 data are from the Atmospheric Composition Analysis Group of Dalhousie University. This paper adopts the mean method to fill in the areas with missing data and the years with missing data. The setting principle of action direction is if the growth of the index is conducive to reducing the EEP, the action direction is negative; if the growth of this index is conducive to the increase in the EEP, the action direction is positive.

2.3. Model Construction

2.3.1. Model Setting of EEP Calculation

Index Weight Determination Based on Analytic Hierarchy Process

In this paper, AHP is one of the important methods to calculate the weight [25]. First, the AHP is used to determine the index weight, and then the TOPSIS method is used to evaluate the system. Therefore, this paper also uses the AHP-TOPSIS method to evaluate EEP to determine the explained variables. Since the analytic hierarchy process must strictly comply with the consistency test hypothesis, the analytic hierarchy process requires more subjective scoring of multiple experts. Therefore, this research does not directly invite experts to calculate the weights through the analytic hierarchy process but uses five experts in related fields to score the indicators’ importance. It then calculates the average score of the experts and ranks the evaluation indicators according to the average of the scores of different indicators (Table S1). Based on the order of importance of the indicator, this paper compares the indicators in pairs, determines the importance of the indicator, and calculates the indicator’s weight (Table S2). Calculated by the AHP formula (Formulas (S1)–(S4)), the consistency test result in this paper is 0.002, which is in line with the hypothesis.

TOPSIS Model Based on Analytic Hierarchy Process

The TOPSIS method is ranked according to the proximity between a limited number of evaluation objects. It evaluates the relative advantages and disadvantages of existing objects [26]. At present, the TOPSIS method has been widely used in evaluating ecological environment [27]. Due to the different data dimensions, the original data needs to be standardized before the TOPSIS evaluation. The commonly used standardization methods include deviation standardization and standard deviation standardization. Considering that this paper’s index system contains positive and negative indicators, we adopt an extreme value standardization for normalization [28].
Standardization formula of negative indicators:
r i j = R i j m i n ( R i j ) m a x ( R i j ) m i n ( R i j )  
Standardization formula of positive indicators:
r i j = m a x ( R i j ) R i j m a x ( R i j ) m i n ( R i j )
Here, R i j represents the original value; r i j represents the standardized value, i represents the index and j represents the year. At the same time, this paper uses an analytic hierarchy process to determine the index weight, and the weight of each index is shown in Table 1. The weighting matrix based on the index weight:
Y = | y i j | m n = | w i r i j | m n  
The positive ideal solution and negative ideal solution are represented by the maximum ( y i + ) and minimum values ( y i ) of the index value of matrix ( Y ). The distance from each index to positive ideal solution (   d j + ) and negative ideal solution (   d j ) is calculated.
d j + = j = 1 m ( y i + y i j ) 2
d j = j = 1 m ( y i y i j ) 2
C i j = d j d j + + d j  
Based on the meaning of data standardization in this paper, the greater the C is, the greater the EEP is. On the contrary, the smaller the pasting progress is, the smaller the EEP of the city is. The calculate the regression in the follow-up and observe the regression coefficient; the pasting progress is expanded ten times. The interval C of the final posting progress is [0, 10].

2.3.2. Difference-in-Difference Method

The Difference-in-difference (DID) method allows the existence of unobservable factors. It allows unobservable factors to affect whether individuals accept the prediction, relaxes the conditions of policy effect evaluation to a certain extent, and makes the policy effect evaluation model closer to the real economy [29]. Therefore, this method has been widely used. HSR operation is generally exogenous compared with microeconomic entities, so there is no reverse causality problem. This method is very effective in preventing endogenous problems.
Moreover, under the traditional method, the policy effect is evaluated mainly by setting a virtual variable of whether the policy occurs or not and then using regression. In comparison, the model setting of the double-difference method is more scientific and can estimate the policy effect more accurately. The formula is:
C i t = α + β ( G i × D t ) + β 1 × X i t + μ i + τ t + ε i t
In the formula, G i is a grouped virtual variable (processing group = 1, control group = 0); D t is a staged dummy variable (after the operation of HSR = 1, before the operation of HSR = 0), The areas after the opening of HSR are set as the treatment group. The areas without HSR are set as the control group. An area with HSR is represented by 1, and one without HSR is represented by 0. The interaction term   G i × D t represents the effect of the treatment group after the operation of HSR, and its coefficient is the treatment effect, μ i   represents individual fixed effect, τ t represents time fixed effect and other control variables X i t .
This paper selects five indicators as control variables by referring to relevant research. Local government service capacity (GSC): this indicator is expressed by the number of local government officials. Generally speaking, the more government officials, the stronger the service capacity of government institutions. Highway traffic passenger volume (HTPV) presents the total number of passengers passing through road traffic during the year. The proportion of the employed industrial population (IEPP) is the ratio of secondary industry employment to total employment. A gross local product of the current year (GDP): gross domestic product is an important factor affecting social development and the ecological environment. Local average slope (AVERSL): the source of the slope data is the DEM spatial distribution data of China’s altitude from the Chinese Academy of Sciences. Based on this data, the average slope data of each city is obtained by processing in the ArcGIS10.2 software; the slope is an important environmental factor affecting the construction of HSR. The higher the slope is, the more complex the HSR construction is. At the same time, the slope is also an essential factor affecting the spatial distribution of carbon dioxide and PM2.5. Selecting the slope as the control variable is significant in this paper. The variable description in this paper is shown in Table 2.
This paper uses the Hausmann test to select random effects and fixed effects. Hausmann’s original hypothesis uses random effects. After the Hausmann test, as shown in Table S3, the test results show that the original hypothesis is rejected. In this paper, fixed effects are used for regression analysis.

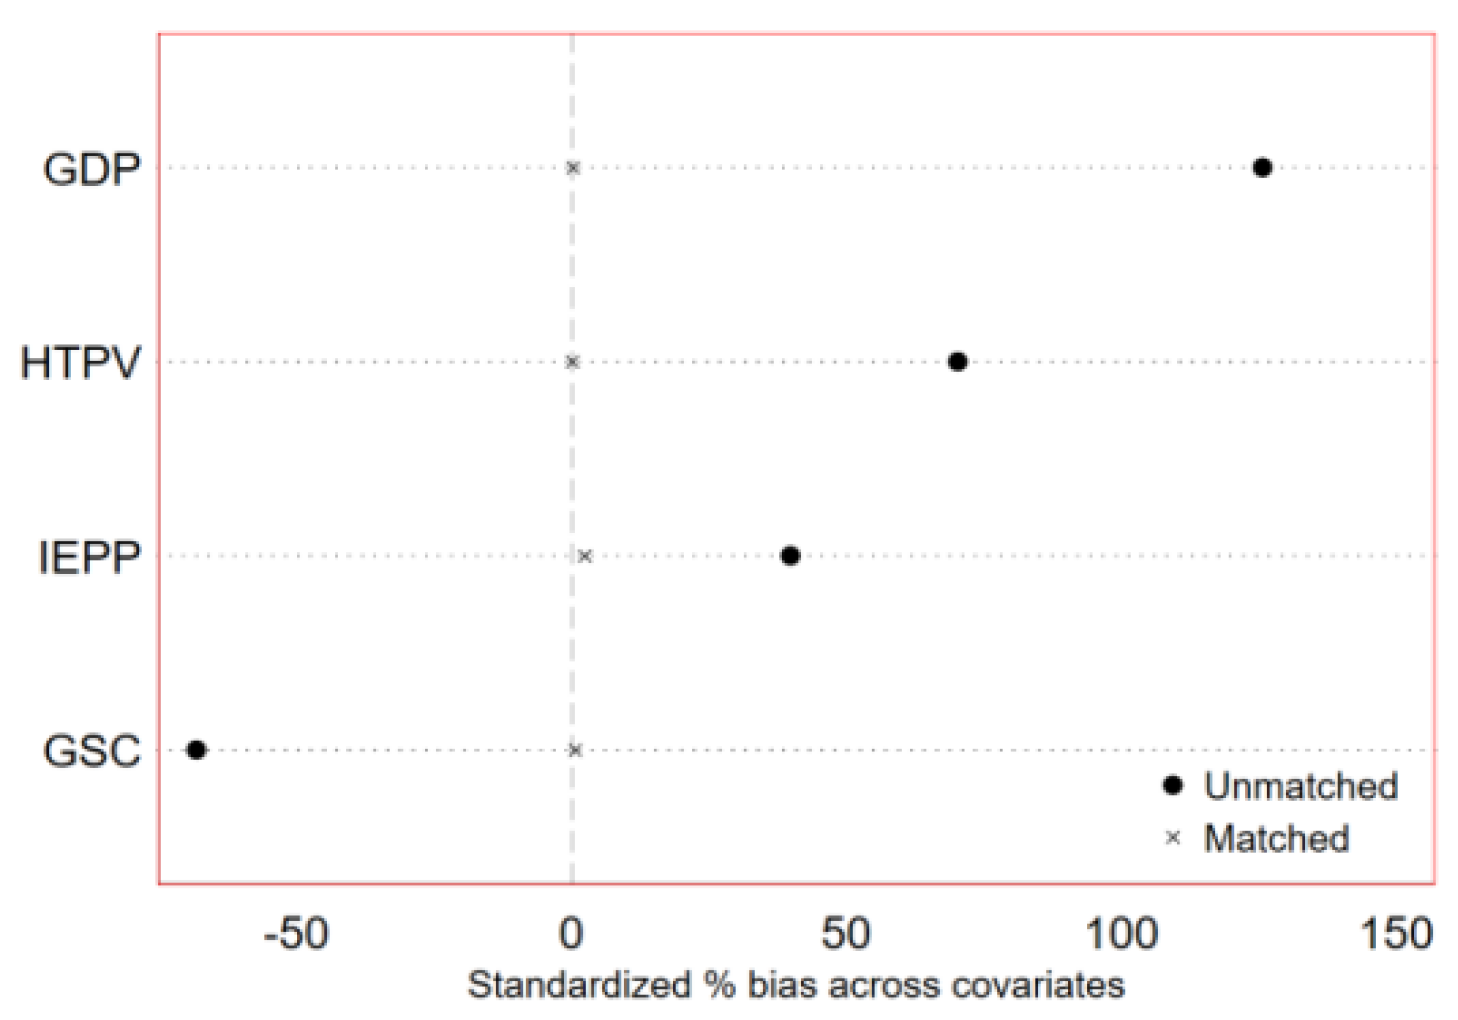
2.3.3. Propensity Score Matching Method

The propensity score matching (PSM) method reduces the influence of data bias and confounding variables to make a more reasonable comparison between the experimental and control groups [30]. Assuming that there are N individuals, each individual i (i = 1, 2, …, n) in the intervention will have two possible results, corresponding to the potential results in the non-intervention state and the intervention state, respectively. The effect of the intervention on an individual is then marked as the difference between the potential results of the intervention state and the potential results of the non-intervention state, that is:
δ i = C i ( 1 ) C i ( 0 )
  D i = 1 means accepting the intervention, that is, the intervention effect of the opening of HSR; D i = 0 means not accepting the intervention, that is, not opening HSR. Then the counterfactual framework can be expressed as the following model:
C i = ( 1 D i ) C i ( 0 ) + D i C i ( 1 )
ATT ( x ) = E { C i ( 1 ) C i ( 0 ) | D i = 1 , X = x }
The average treatment effect for the treated (ATT) is used to measure the average intervention effect of an individual in the intervening state. It represents the difference between the observation result of an individual in the intervening state of the opening of HSR and its counterfactual, which is called the standard estimator of the average intervention effect. When ATT is significant, the matching effect meets the expectation.

3. Results

3.1. Temporal and Spatial Evolution Characteristics of EEP

According to the formula calculation, the urban ecological environment pressure in China is shown in Figure 2. In 2003, the EEP in most study areas was between 2.01–4.00. The study areas between 4.01–5.00 were few and scattered; only a few areas had a low EEP. The eastern coastal areas were mainly between 3.01–4.00. In 2018, most research units were between 0.88–3.00, while the number of research areas between 4.01–5.00 decreased to 0. The EEP in China decreased significantly during the study period from the overall layout.
China’s HSR construction experienced a period of rapid development in 2008. To further study the impact of HSR on EEP, this paper takes 2008 as the dividing point of research and selects the periods from 2003 to 2008 and 2008 to 2018 for in-depth analysis, as shown in Figure 3. From 2003 to 2008, the EEP increased in most parts of China, especially in the eastern and southern regions. From 2008 to 2018, the EEP in most parts of China decreased. On the one hand, because China attaches great importance to the sustainable development of the social economy, it has successively issued a series of policies on energy conservation and emission reduction, alleviating the EEP. On the other hand, with the change of social production technology, fine production has gradually replaced the rough production mode. Enterprises reuse industrial waste through technological progress in the production process of industrial products, reducing the environmental pollution. Overall, the change of EEP is significant in the two time periods, from the increase of EEP in the first period to the decrease of EEP in the second period. It also implies that HSR construction may be closely related to EEP, but this paper still needs further verification.

3.2. Impact Analysis of HSR Construction on EEP

Taking the EEP of each study area as the explanatory variable, the operation of the HSR as the explanatory variable, and other variables as the control variable., this paper uses the DID method to study the impact of HSR on EEP. The specific regression results are shown in Table 3.
First, the panel benchmark regression is used in model 1. It can be seen that the regression coefficient of HSR on EEP is negative and has passed the 5% level significance test, indicating that the construction of HSR has the effect of alleviating urban EEP. In model 2 and model 5, using two-way fixed effects regression, it can be seen that the regression coefficient of HSR on EEP is still negative regardless of whether control variables are added to the equation and has passed the 1% level significance test. In model 3, model 4, and model 5, the time fixed effects, individual fixed effects and two-way fixed effects regression are adopted, respectively. The varied range of the regression coefficient of HSR on EEP is low. According to the regression results of models 2–5, the regression result of HSR on EEP is relatively stable. The complete regression results show that GSC will significantly reduce the EEP; IEPP will significantly increase the EEP, and the higher the regional GDP, the greater the EEP.
The test results of similar trend terms of the DID method are shown in Table 4. Before the operations of HSR, the EEP mainly increased in the three phases. After the opening of HSR, the EEP decreases and is significant at the level of 5%. During the opening period and the three phases after the opening of the HSR, the EEP tends to decrease, with a high degree of significance, and the test results of the balance trend item pass. To further verify the robustness of the regression results of the DID method, the PSM is used to regress the data again. When processing the data, mixed matching is used. The matching results are shown in Figure 4 (GSC: local government service capacity. HTPV: highway traffic passenger volume. IEPP: proportion of industrial employed population. GDP: gross local product of the current year) and Figure 5.
The results of matching variables show that the standardized deviation of variables after matching is less than 10%, and most observed values are within the common value range, so a low sample size will not be lost in tendency score matching. At the same time, after calculation, T (ATT) = −2.26 in propensity score matching, which is significant at the 5% level, which shows that the matching effect is good. The non-equilibrium panel regression is conducted again for the matched samples. The regression results are shown in model 6 in Table 3. The regression coefficient of HSR on EEP is negative and has passed the 5% significance level test, which again shows that the dual differential regression result is robust.

3.3. Heterogeneity Analysis of HSR on EEP

Due to the significant differences in resource endowments in various regions of China, we further study the impact of the operations of HSR in eastern, central and western regions of China on EEP (Table 5). Model 7, model 8 and model 9 represent the regression results of the impact of HSR operations on EEP in the eastern region, the central region and the western region, respectively. The HSR in the eastern and central regions affects the EEP. The regression coefficients are −0.082 and −0.103, respectively, passing the 5% significance level test. It shows that the opening of HSR in eastern and central China will significantly reduce the pressure on the ecological environment. In the western region, the impact of HSR on EEP is positive and not significant. On the one hand, due to the late construction of HSR in the west, the HSR has not fully played its role. At the same time, the construction of HSR is mainly concentrated in eastern and central China. The density of HSR construction in the west is low, the mitigation effect of HSR on the western EEP is not apparent, and the economy in the west is still facing the pressure of transformation. On the other hand, there are many missing data and few HSR stations in the western region, resulting in fewer data in the processing group of the research unit in the western region, which interferes with the regression results to a certain extent.
Different regions have different resource endowment conditions and development characteristics in different areas. China’s State Council defines “resource-based cities” and promoting the sustainable development of resource-based areas as a significant strategic issue for developing countries, as well as a worldwide problem [31]. First, the State Council of China has set the three indicators of industrial structure, employment structure, and resource market share, and cities that meet one of them are considered to be mining cities. Secondly, the two indicators of forest resource potential and resource development capacity are set, and cities that meet these two indicators are regarded as “forest-industry” cities. Based on the quantitative definition, 262 resource-based cities (counties) were defined by comprehensively considering cities with a long history of resource development and the distribution of national key resource-based enterprises.
In order to study the impact of HSR operation on resource-based cities, this paper divides 284 research units into non-resource-based cities and resource-based cities for regression. The research area of this paper has a total of 284 research units, including 114 resource-based cities and 170 non-resource-based cities. Since there are few HSR stations in western areas, in order to make the regression more accurate, the western data are excluded from the regression. The regression results of non-resource-based and resource-based areas are shown in model 10 and model 11. The operations of HSR in non-resource-based cities will reduce the pressure on the ecological environment. Beijing, Shanghai, Guangzhou and other non-resource-based areas have a very developed economy and rely on their particular geographical advantages to develop new industries. The development of HSR will promote these cities to transfer high pollution and high loss industries to the surrounding second and third-tier cities to reduce the EEP in this region. For resource-based cities, HSR operation does not significantly reduce the pressure on the ecological environment. Since the resource-based cities in the sample selected in this paper are mainly distributed in Central China, this paper uses the data of central China to further explore the impact of HSR operations on EEP. The regression results are shown in model 12. In the central region, the HSR operation has a significant effect on alleviating the EEP. The economy of the most resource-based sites is underdeveloped, there are many traditional industries, the industrial structure is ageing, and the economic transformation is facing significant pressure. The operation of HSR will promote the transfer of high-tech in central cities to resource-based cities and then provide power for the industrial transformation of resource-based cities.

3.4. Analysis on the Impact Mechanism of HSR Operation on EEP

The degree of industrial transformation (DIT) and degree of employment transformation (DET) [32,33] are important driving factors for ecological environment improvement. Therefore, we further analyze the impact of the interaction effect of HSR operations, industrial transformation and employment transformation on EEP. The interaction items of industrial transformation degree, employment transformation degree and HSR operations are established to further reveal the common impact mechanism of HSR operations, industrial structure and employment structure on EEP. The regression results are shown in Table 6.
The regression coefficient of the interaction between HSR operation and industrial transformation for EEP is −0.005 and passes the 5% significance level test. At the same time, the regression coefficient of the interaction between HSR operation and employment transformation for EEP is −0.004 and passes the 1% significance level test. It shows that industrial transformation and upgrading and optimization of employment structure, combined with the implementation of HSR construction policy, can significantly reduce the EEP. The synergy or interaction between industrial transformation and upgrading, employment structure optimization and HSR construction policies has significantly reduced the EEP to varying degrees [34]. The operation of HSR has promoted the adjustment of employment structure and industrial upgrading and promoted the improvement of urban functions. In the process of HSR operation, the spatial agglomeration of industries and production factors is formed through the investment needs of the HSR industry itself. It is conducive to the industrial transformation and employment of the working population and improves the environmental benefits of production enterprises. Moreover, it is conducive to the industrial transformation and employment of the working population and improves the environmental benefits of production enterprises [35]. The most direct impact of the opening and operation of the HSR is accelerating the rapid transfer of production factors and increasing passenger traffic. The increase in passenger traffic will increase the number of passengers in the region, and passengers will inevitably consume resources locally. This consumption behavior will stimulate the development of local tourism, catering, accommodation and other service industries and reduce the region’s dependence on high-pollution, low-value-added industries [36].

4. Discussion

4.1. Analysis on the Impact of HSR Operation on EEP

HSR construction has become a hot topic in global economic development in recent years. Some scholars at home and abroad are paying more and more attention to the research on the impact of HSR development on industrial development, regional economic development, and urban planning [7,11]. The existing research on HSR is mainly based on the speed of HSR and studies the economic utility of the opening of HSR [37]. The opening of HSR will strengthen the time and space connection between cities of different scales and attract the advantages of the surrounding areas to the central city. The research on the impact of HSR on industrial development uses social survey and measurement methods and takes specific industries as research objects, such as tourism and industry. Other scholars research social employment and transportation spatial accessibility through geospatial technologies. With the increasing attention to the ecological environment in the world, the governments of various regions tend to prioritise the sustainable development of the local society and economy.
Scholars usually evaluate the changes in the natural living environment after the completion of HSR by measuring the number of resources or environmental pollution factors, such as the area of arable land, air quality or pollutant emissions. As people begin to pay attention to the impact of social and economic factors on the environment, industrial transformation and employment transformation have also become important factors in evaluating the natural environment. Traditional methods mainly focus on exploring the relationship between HSR and environmental ecology from the perspective of a single indicator. This paper explores the relationship between HSR operation and the overall ecological environment from a macro perspective. In this study, firstly, we used the AHP-TOPSIS model to evaluate EEP and build a more substantial eco-environmental index evaluation system, including multi-dimensional indicators. Then, from the perspective of geography, the evaluation results of TOPSIS were presented in geographical space, making the measurement results of EEP more vivid and intuitive. We built the DID model and tested its robustness with the PSM method. Through the measurement results of these two main policy evaluation models, we scientifically confirmed that the operation of HSR can effectively reduce the overall ecological and environmental pressure, which further enriched the research on the impact of HSR on environmental and ecological quality. By solving the research problems of this study, we systematically integrated a series of problem-solving models and methods to explain the relationship between HSR and EEP better and to realize multi-disciplinary integration, including geography, statistics, economics, sociology and ecology.

4.2. Analysis on the Impact Mechanism of HSR Operation on EEP

In order to improve the ecological environment and promote the sustainable development of the social economy, the following policy suggestions are put forward according to the research conclusions, which follow below.
Firstly, the construction of HSR should be fully incorporated into the city’s future development plan. The rapid urbanization process will significantly impact the fragile ecological environment of a developing country. The considerable population pressure, increasingly scarce resources and the deterioration of environmental quality have become constraints to urban development [38]. The rapid development of urbanization in the world, as a particular ecosystem, plays a significant role in promoting economic development and social progress and continues to have serious environmental problems. The construction of HSR can effectively alleviate the pressure of the urban ecological environment and is an effective way for cities to achieve sustainable development [39]. The local government shall fully evaluate the necessity of HSR construction according to the urban development stage and development characteristics. The government management departments of cities meeting the conditions for HSR construction should fully consider the introduction of HSR in formulating long-term urban development plans and appropriately reserve the land for HSR construction in land planning.
Secondly, the construction of HSR in the central and western regions needs to be accelerated. Due to the low level of social and economic development in the western region and the low density of HSR construction in the western region, the role of HSR in alleviating the pressure on the ecological environment in the western region has not appeared. At the same time, the central and western regions are rich in mineral resources. Most of the resource-based cities designated in China are distributed in the central and western regions. The secondary industry dominates economic development, and the tertiary industry is not developed. The economy of the central and western regions is still under the pressure of transformation. The central and western regions should improve the construction of HSR infrastructure and formulate long-term development plans [31]. While implementing HSR construction, the government sector should also cultivate and expand high-tech industrial agglomeration and optimize the employment structure. According to the resource endowment of different regions, the focus should be on green industry brands, public services and characteristic industries, and improvement of the ecological protection positioning of different regions should be pursued. Give full play to the HSR operation’s environmental and ecological benefits, and strive to build a “high-tech industry sector” led by “green homes”. At the same time, the transportation planning department will vigorously implement the strategy of building an ecologically vital city and promote ecological governance, environmental protection and comprehensive utilization and development of green resources along the HSR.
Finally, due to the different economic development conditions and natural environmental conditions of different cities, HSR construction is not suitable for all regions. HSR construction should be adapted to local conditions and significant economic development initiatives. It will also improve the local natural ecological environment through industrial transformation and employment transformation. Cities with large passenger flows should seriously consider incorporating HSR into future urban planning. However, for cities whose current conditions are not suitable for HSR development at present, economic development can be reduced by delineating high-tech industrial parks and attracting high-tech industries to reduce the pressure on the ecological environment and achieve sustainable social development. At the same time, other modes of sustainable transport, such as electric vehicles [40] and environmentally friendly hybrid vehicles [41], may be integrated into the public transport system to reduce the ecological environmental pressure.

5. Conclusions

Currently, the problem of degradation of the ecological environment has gradually become an important factor restricting the sustainable development of society. In rapid urbanization, it is essential to protect the ecological environment effectively. We are fully aware of the important role of HSR construction in alleviating pressures on the ecological environment. Based on the panel data of 284 cities in China from 2003 to 2018, we have constructed an EEP evaluation that evaluates the EEP of different areas according to the TOPSIS model and uses spatial analysis tools to explore the temporal and spatial evolution characteristics of EEP. Then, based on the DID and PSM methods, we have quantitatively calculated the impact effect of HSR operations on EEP and analyzed the action mechanism of HSR operations on EEP combined with the analysis of the interaction between the DIT, DET and the operations of HSR.
During the study period, the EEP in China decreased significantly. HSR in the eastern and central regions played a significant role in reducing the EEP. However, due to the small number of HSR stations in the western region, HSR did not play a significant role, and the effect is not apparent. For resource-based cities, the HSR operation has a significant effect on alleviating the EEP. in the central region. Through the analysis of the action mechanism of HSR on EEP, it can be seen that the synergy or interaction between industrial transformation and upgrading, employment structure optimization and HSR construction policies can significantly reduce the EEP to varying degrees. Industrial transformation and upgrading and employment structure optimization, combined with HSR construction policies, can significantly reduce the EEP. The research in this article shows that the operation of HSR will reduce the pressure on the ecological environment and make relevant recommendations. However, the protection of the ecological environment requires effective measures from multiple angles.
The results of this study, combined with other research results, also show that HSR can improve a single ecological environmental indicator, reduce the pressure on the ecological environment, and improve the overall quality of the ecological environment. The construction of evaluation indicators is essential for the current comprehensive evaluation. Therefore, subsequent research will be carried out from the perspective of optimizing the index system. At the same time, some ecological environment indicators are related to the atmospheric environment in reality, and ocean currents, monsoons, and rainfall will also affect some single indicator performance in selected study areas. The causes of ecological damage and environmental pollution are complex and particular. It is challenging to achieve systematic and effective governance with a single discipline, single technology and single method. It is necessary to continue to increase the innovation of ecological and environmental protection technologies while attaching great importance to promoting related technologies. The association and integration of technology innovation, industrial innovation, and business model innovation will promote the accelerated development of energy-saving, resource recycling, and environmental protection.

Supplementary Materials

The following supporting information can be downloaded at: https://www.mdpi.com/article/10.3390/su14063152/s1, Table S1: The five experts’ scoring sheet on a single indicator; Table S2: Index importance degree comparison assignment; Table S3: Hausman model test.

Author Contributions

C.J. initiated this study with an original idea, conducted the overall analysis and wrote this article. X.L. provided very professional theoretical guidance and extremely important suggestions of improvement for the overall analysis. All authors have read and agreed to the published version of the manuscript.

Funding

This research received no external funding.

Data Availability Statement

There are two sources of HSR data: the HSR data before 1 October 2015 comes from the State Railway Administration of China (http://www.nra.gov.cn/ (accessed on 14 July 2021)), and the data after 1 October 2015 comes from the State Railway Administration of China, the China Railway 12306 website (https://www.12306.cn/index/ (accessed on 14 July 2021)), and local government website. The carbon dioxide emission and PM2.5 data were collected from http://doi.org/10.6084/m9.figshare.c.5136302.v2 (accessed on 5 July 2021) and http://fizz.phys.dal.ca/~atmos/martin/?page_id=140 (accessed on 1 March 2021); Local average slope data were collected from https://www.resdc.cn/data.aspx?DATAID=217 (accessed on 5 July 2021). Other indexs and variables are from the China Urban Statistical Yearbook (2004–2019) (https://data.cnki.net/yearbook/Single/N2021050059 (accessed on 5 July 2021)).

Conflicts of Interest

The authors declare that they have no conflict of interest.

References

  1. Hong, K.M. A Study on the Industrial Design Direction by the Near-Future Civilized Society. J. Cult. Prod. Des. 2021, 65, 93–104. [Google Scholar]
  2. Mohring, H. Optimization and scale economies in urban bus transportation. Am. Econ. Rev. 1972, 62, 591–604. [Google Scholar]
  3. Jerrett, M. Atmospheric science: The death toll from air-pollution sources. Nature 2015, 525, 330–331. [Google Scholar] [CrossRef] [PubMed] [Green Version]
  4. Sun, W.D.; Chen, Z.G.; Wang, D.Y. Can Land Marketization Help Reduce Industrial Pollution? Int. J. Environ. Res. Public Health 2019, 16, 2213. [Google Scholar] [CrossRef] [PubMed] [Green Version]
  5. Zhang, X.-P.; Hu, Z.-H.; Wei, X.-J.; Huang, Y.-W. Study on Identification of Key Areas for Ecological Protection and Restoration in Resource-exhausted Region: Take Dayu County, Jiangxi as an Example. J. Ecol. Rural Environ. 2021, 37, 1031–1040. [Google Scholar]
  6. Dai, X.H.; Li, W.C. Impact of Education, Medical Services, and Living Conditions on Health: Evidence from China Health and Nutrition Survey. Healthcare 2021, 9, 1122. [Google Scholar] [CrossRef] [PubMed]
  7. Nickelsburg, J.; Ahluwalia, S.; Yang, Y. High-speed Rail, Urbanisation, and Housing Affordability Evidence from the Shinkansen System. J. Transp. Econ. Policy 2020, 54, 267–288. [Google Scholar]
  8. Giannakos, K. Comparison of Magnitude of Actions on Track in High-Speed and Heavy-Haul Railroads Influence of Resilient Fastenings. Transp. Res. Rec. 2012, 2289, 70–77. [Google Scholar] [CrossRef]
  9. Dalkic, G.; Balaban, O.; Tuydes-Yaman, H.; Celikkol-Kocak, T. An assessment of the CO2 emissions reduction in high speed rail lines: Two case studies from Turkey. J. Clean. Prod. 2017, 165, 746–761. [Google Scholar] [CrossRef]
  10. Kaewunruen, S.; Sresakoolchai, J.; Peng, J.Y. Life Cycle Cost, Energy and Carbon Assessments of Beijing-Shanghai High-Speed Railway. Sustainability 2020, 12, 206. [Google Scholar] [CrossRef] [Green Version]
  11. Scott, A.J. World development report 2009: Reshaping economic geography. World Environ. 2008, 9, 1269–1277. [Google Scholar] [CrossRef]
  12. Sasaki, K.; Ohashi, T.; Ando, A. High-speed rail transit impact on regional systems: Does the Shinkansen contribute to dispersion? Ann. Reg. Sci. 1997, 31, 77–98. [Google Scholar] [CrossRef]
  13. Murakami, J.; Cervero, R. California high-speed rail and economic development: Station-area market profiles and public policy responses. In Symposium in University of California, Berkeley Faculty Club; University of California: Berkeley, CA, USA, 2010. [Google Scholar]
  14. Chen, Z.H.; Xue, J.B.; Rose, A.Z.; Haynes, K.E. The impact of high-speed rail investment on economic and environmental change in China: A dynamic CGE analysis. Transp. Res. Part A-Policy Pract. 2016, 92, 232–245. [Google Scholar] [CrossRef]
  15. Liu, K.; Lin, B.Q. Research on influencing factors of environmental pollution in China: A spatial econometric analysis. J. Clean. Prod. 2019, 206, 356–364. [Google Scholar] [CrossRef]
  16. Wang, Q.W.; Chiu, Y.H.; Chiu, C.R. Driving factors behind carbon dioxide emissions in China: A modified production-theoretical decomposition analysis. Energy Econ. 2015, 51, 252–260. [Google Scholar] [CrossRef]
  17. Chen, K.L.; Liu, X.Q.; Ding, L.; Huang, G.Z.; Li, Z.G. Spatial Characteristics and Driving Factors of Provincial Wastewater Discharge in China. Int. J. Environ. Res. Public Health 2016, 13, 1221. [Google Scholar] [CrossRef] [Green Version]
  18. Chen, J.Q.; Guo, Y.S.; Su, H.N.; Ma, X.J.; Zhang, Z.Y.; Chang, B.S. Empirical analysis of energy consumption transfer in China’s national economy from the perspective of production and demand. Environ. Sci. Pollut. Res. 2021, 28, 19202–19221. [Google Scholar] [CrossRef] [PubMed]
  19. Dong, F.; Yu, B.L.; Pan, Y.L. Examining the synergistic effect of CO2 emissions on PM2.5 emissions reduction: Evidence from China. J. Clean. Prod. 2019, 223, 759–771. [Google Scholar] [CrossRef]
  20. Li, X.F.; Cheng, B.D.; Hong, Q.L.; Xu, C. Can a Win-Win Situation of Economy and Environment Be Achieved in Cities by the Government’s Environmental Regulations? Sustainability 2021, 13, 5829. [Google Scholar] [CrossRef]
  21. Wang, J.N.; Yin, P.Z.; Li, D.J.; Zheng, G.Q.; Sun, B.J. Quantitative Relationship between Urban Green Canopy Area and Urban Greening Land Area. J. Urban Plan. Dev. 2021, 147, 05021016. [Google Scholar] [CrossRef]
  22. Song, J.H.; Cui, S.; Han, Q.; Li, P.; Zhang, Q.K.; Li, M.R.; Jiang, C.J. Biochemical Treatment of Municipal Sewage in Northeast China in Winter. In Proceedings of the 4th International Conference on Advances in Energy Resources and Environment Engineering (ICAESEE), Chengdu, China, 7–9 December 2018. [Google Scholar]
  23. Hou, J.; Teo, T.S.H.; Zhou, F.L.; Lim, M.K.; Chen, H. Does industrial green transformation successfully facilitate a decrease in carbon intensity in China? An environmental regulation perspective. J. Clean. Prod. 2018, 184, 1060–1071. [Google Scholar] [CrossRef]
  24. Chen, J.; Gao, M.; Cheng, S.; Hou, W.; Song, M.; Liu, X.; Liu, Y.; Shan, Y. County-level CO2 emissions and sequestration in China during 1997–2017. Sci. Data 2020, 7, 391. [Google Scholar] [CrossRef]
  25. Cui, D.H.; Zhang, X.Y. Application of Gray Analytic Hierarchy Process in Project Risk Evaluation. In Proceedings of the International Conference on Artificial Intelligence and Computational Intelligence, Shanghai, China, 7–8 November 2009; pp. 592–594. [Google Scholar]
  26. Elhassouny, A.; Smarandache, F. Neutrosophic-simplified-TOPSIS Multi-Criteria Decision-Making using combined Simplified-TOPSIS method and Neutrosophics. In Proceedings of the IEEE International Conference on Fuzzy Systems (FUZZ-IEEE) Held as Part of IEEE World Congress on Computational Intelligence (IEEE WCCI), Vancouver, BC, Canada, 24–29 July 2016; pp. 2468–2474. [Google Scholar]
  27. Yang, T.; Zhang, Q.; Wan, X.H.; Li, X.P.; Wang, Y.Y.; Wang, W. Comprehensive ecological risk assessment for semi-arid basin based on conceptual model of risk response and improved TOPSIS model-a case study of Wei River Basin, China. Sci. Total Environ. 2020, 719, 137502. [Google Scholar] [CrossRef]
  28. Li, J.; Jia, L.; Liu, Y.; Yang, Y.; Jiang, N. Measuring model of rural transformation development path in Fuping County of Beijing-Tianjin-Hebei region. Habitat Int. 2018, 74, 48–56. [Google Scholar] [CrossRef]
  29. Caniglia, E.C.; Murray, E.J. Difference-in-Difference in the Time of Cholera: A Gentle Introduction for Epidemiologists. Curr. Epidemiol. Rep. 2020, 7, 203–211. [Google Scholar] [CrossRef] [PubMed]
  30. Hu, K.; Shi, D.Q. The impact of government-enterprise collusion on environmental pollution in China. J. Environ. Manag. 2021, 292, 112744. [Google Scholar] [CrossRef]
  31. Li, Q.Y.; Zeng, F.E.; Liu, S.H.; Yang, M.A.; Xu, F. The effects of China’s sustainable development policy for resource-based cities on local industrial transformation. Resour. Policy 2021, 71, 101940. [Google Scholar] [CrossRef]
  32. Song, Y.M. Research on industrial transformation and upgrading based on low-carbon economic environment. Fresenius Environ. Bull. 2021, 30, 6988–6995. [Google Scholar]
  33. Guo, W.; Dai, H.J.; Liu, X.R. Impact of different types of environmental regulation on employment scale: An analysis based on perspective of provincial heterogeneity. Environ. Sci. Pollut. Res. 2020, 27, 45699–45711. [Google Scholar] [CrossRef]
  34. Wang, C.Y.; Meng, W.D.; Hou, X.S. The impact of high-speed rails on urban economy: An investigation using night lighting data of Chinese cities. Res. Transp. Econ. 2020, 80, 100819. [Google Scholar] [CrossRef]
  35. Li, X.; Ma, X.D. Impacts of high-speed rail development on urban land expansion and utilization intensity in China. J. Transp. Land Use 2021, 14, 583–601. [Google Scholar] [CrossRef]
  36. Zhou, B.; Wen, Z.H.; Yang, Y. Agglomerating or dispersing? Spatial effects of high-speed trains on regional tourism economies. Tour. Manag. 2021, 87, 104392. [Google Scholar] [CrossRef]
  37. Albalate, D.; Bel, G. (Eds.) Evaluating High-Speed Rail: Interdisciplinary Perspectives, 1st ed.; Routledge: London, UK, 2016. [Google Scholar]
  38. Li, J.; Jiang, C.; Xing, Z. Multi-dimensional influence measurement of urbanization on the quality of natural living environment in China. Environ. Dev. Sustain. 2021, 23, 12151–12168. [Google Scholar] [CrossRef]
  39. David, B.; Peter, H.; Stephen, M. High-Speed Rail Shrinking Spaces, Shaping Places. Built Environ. 2013, 39, 321–323. [Google Scholar]
  40. Agaton, C.B.; Collera, A.A.; Guno, C.S. Socio-Economic and Environmental Analyses of Sustainable Public Transport in the Philippines. Sustainability 2020, 12, 4720. [Google Scholar] [CrossRef]
  41. Cartenì, A.; Henke, I.; Molitierno, C.; di Francesco, L. Strong Sustainability in Public Transport Policies: An e-Mobility Bus Fleet Application in Sorrento Peninsula (Italy). Sustainability 2020, 12, 7033. [Google Scholar] [CrossRef]
Figure 1. Description of the study area.
Sustainability 14 03152 g001
Figure 2. Spatial layout of EEP.
Sustainability 14 03152 g002
Figure 3. The spatial layout of EEP changes in two stages.
Sustainability 14 03152 g003
Figure 4. Standardized deviation diagram of variables.
Sustainability 14 03152 g004
Figure 5. Common value range diagram of propensity score.
Sustainability 14 03152 g005
Table 1. Indicators of the Ecological Environment Pressure (EEP).
Target LayerIndex LayerAverageS.DMinMaxWeightAction
Direction
EEPSoot emission (10 thousand tons)2543430.3453600.0647+
Carbon dioxide emissions (10 thousand tons)25.3523.221.53230.710.0613+
Wastewater discharge (10 thousand tons)7082.3594307110,7630.0613+
Social electricity consumption (KW·h)89.871500.2316000.0360+
PM2.5 (μg/m3)36.1516.432.1890.850.1803+
Comprehensive utilization rate of industrial solid (%)78.3023.170.241000.1791
Greening area (hm2)36.7490.3895.250.0360
Sewage treatment rate (%)69.4025.750.161000.1060
Degree of employment structure (%)52.9113.179.9194.810.1060
Degree of industrial transformation (%)37.879.218.5885.340.1693
Table 2. Descriptive statistics of variables.
VariablesAverageS.DMinMax
Ecological Environment Pressure3.280.640.884.78
Local government service capacity 2.243.250.0548.19
Highway traffic passenger volume7.6211.830.06165.45
Proportion of industrial employed population43.8414.104.4684.4
Gross local product of the current year1633.26257431.0433,244.8
Local average slope2.421.970.0411.82
Table 3. Regression results of HSR construction on EEP.
VarOLSFERobustness Check
EEPModel 1Model 2Model 3Model 4Model 5Model 6
Treat × Time−0.067 **
(0.024)
−0.096 ***
(0.001)
−0.067 **
(0.013)
−0.104 ***
(0.001)
−0.097 ***
(0.001)
−0.105 **
(0.031)
GSC−0.125 ***
(0.000)
−0.099 ***
(0.001)
−0.389 ***
(0.000)
−0.117 ***
(0.006)
−0.160 **
(0.016)
HTPV0.213 ***
(0.000)
0.013
(0.322)
0.198 ***
(0.000)
−0.005 ***
(0.000)
0.232 ***
(0.000)
IEPP0.469 ***
(0.000)
0.298 ***
(0.000)
0.659 ***
(0.000)
0.412 ***
(0.000)
0.465 ***
(0.000)
GDP−0.159 ***
(0.000)
0.079 ***
(0.002)
0.120 ***
(0.000)
0.131 ***
(0.001)
−0.283 ***
(0.000)
AVERSL−0.084 ***
(0.000)
−0.046 ***
(0.002)
0.562 ***
(0.001)
−0.032
(0.825)
−0.053 **
(0.011)
yearNYYNYN
idNYNYYN
R-squared0.1010.4940.3240.3610.5060.107
*** p < 0.01, ** p < 0.05.
Table 4. Parallel trend term test.
EEPCStd.Err.p
_D_F30.0040.0530.946
_D_F20.0500.0500.323
_D_F10.0620.0420.151
HSR−0.077 **0.0320.017
_D_L1−0.069 *0.0420.010
_D_L2−0.0520.0340.124
_D_L3−0.117 **0.0460.012
Parallel Trend—‘leads’Prob > F = 0.3386 (RESULT: ‘Parallel-trend’ passed)
** p < 0.05, * p < 0.1.
Table 5. Heterogeneity analysis of HSR on EEP.
VarLocation HeterogeneityIndustrial Heterogeneity
EEPModel 7Model 8Model 9Model 10Model 11Model 12
Treat × Time−0.082 **
(0.049)
−0.103 **
(0.044)
0.069
(0.388)
−0.103 ***
(0.009)
−0.075
(0.215)
−0.266 ***
(0.003)
GSC−0.067
(0.355)
−0.122 *
(0.089)
−0.210 ***
(0.010)
−0.017
(0.795)
−0.164 **
(0.048)
0.350 ***
(0.001)
HTPV−0.009
(0.718)
−0.035
(0.302)
0.024
(0.272)
−0.021
(0.411)
−0.008
(0.780)
−0.043
(0.324)
IEPP0.683 ***
(0.000)
0.116
(0.155)
0.513 ***
(0.000)
0.497 ***
(0.000)
0.176 *
(0.100)
0.119
(0.368)
GDP0.083
(0.122)
−0.028
(0.728)
0.216 ***
(0.004)
0.05
(0.353)
0.124
(0.129)
0.081
(0.421)
AVERSL10.98 **
(0.013)
25.1 ***
(0.005)
−0.137
(0.403)
9.382 **
(0.035)
−0.834
(0.269)
3.042
(0.391)
yearYYYYYY
idYYYYYY
R-squared0.5080.5200.5290.5330.44060.476
*** p < 0.01, ** p < 0.05, * p < 0.1.
Table 6. Regression results of the impact mechanism of HSR operation on EEP.
VarBenchmark Regression
EEPModel 13Model 14
Treat × Time × DET −0.004 **
(0.034)
Treat × Time × DIT−0.005 **
(0.050)
Treat × Time−0.037
(0.243)
−0.153 ***
(0.000)
DET −0.012 ***
(0.000)
DIT−0.041 ***
(0.000)
Control VariableYY
yearYY
idYY
R-squared0.6790.501
*** p < 0.01, ** p < 0.05.
Publisher’s Note: MDPI stays neutral with regard to jurisdictional claims in published maps and institutional affiliations.

