Article

An Approach to Assessing Shopper Acceptance of Beacon Triggered Promotions in Smart Retail

by
Nataša Đurđević
1,*,
Aleksandra Labus
1,*,
Dušan Barać
1,
Miloš Radenković
2 and
Marijana Despotović-Zrakić
1
1
Faculty of Organisational Sciences, University of Belgrade, 11000 Belgrade, Serbia
2
School of Computing, Union University, 11000 Belgrade, Serbia
*
Authors to whom correspondence should be addressed.
Sustainability 2022, 14(6), 3256; https://doi.org/10.3390/su14063256
Submission received: 31 January 2022 / Revised: 4 March 2022 / Accepted: 7 March 2022 / Published: 10 March 2022
(This article belongs to the Special Issue Internet of Things and Digital Economy)

Abstract

:
This paper studies shopper acceptance for using beacons in the purchase process. The main goal is to examine shopper response to beacon-triggered promotions and propose a model that would help retail practitioners plan the implementation of beacons in stores. The model was evaluated via an in-market test to examine the effects of beacon-triggered promotion on shopper attention, technology acceptance, and the decision to purchase. The test was conducted in Belgrade, Serbia in 10 representative stores where beacons were implemented with 10 twin control stores. The SimplyTastly mobile application was used for sending notifications. Furthermore, two more in-market beacon activations were analysed in Croatia and Bulgaria. The results showed that shoppers accepted beacon technology and that beacon-triggered promotion had a positive impact on shopper attention, purchase behaviour, and the decision to purchase. The results show that the proposed model could serve as a sound basis for the implementation of beacon technology in retail.

1. Introduction

The development of mobile and Internet of Things (IoT) technologies has significantly affected marketing [1]. It becomes smarter when fulfilling the need for individualised, personalised, context-relevant, real-time, immediate, interactive communication with consumers and shoppers, facilitating conversion to purchase, enhancing experiences, and improving business results [2,3,4]. By connecting things to the Internet, the IoT encourages interactions between marketers and customers. Consequently, companies embrace new technologies that facilitate new market behaviours, interactions, and experiences [5]. Using the IoT and mobile technologies, sellers can interact with customers by motivating them with the right messages and at the right time to make a purchase [1]. The pervasive technologies and the IoT have radically altered the retail landscape [6]. Despite a lot of expected positives of the IoT, this technology still has not reached the expected mass implementation by the retail and consumer goods sector, and this raises the need to understand and help close this gap.
The problem of IoT implementation in retail is multifaceted and can be explored from different perspectives. It can start either from the organisational and internal infrastructure needs or the customer [2,7,8,9]. Several research papers deal with the user (both organisational and consumer) perceptions and model the technology acceptance [10,11,12,13,14,15,16]. Another aspect of IoT implementation is the technology itself, infrastructure requirements, benefits, and limitations of options like radio frequency identification (RFID), near-field communication (NFC), Wi-Fi technologies, and Bluetooth Low Energy (BLE) (beacons), among others [9,17,18,19,20,21]. The focus of recent research papers is placed on more advanced sensor- and IoT-interrelated technologies. These deal with emotion recognition [22], upgrades to RFID sensors [23], the evolution of security-related solutions [24], and the use of blockchain in supply chain management [25]. Specific solutions have been the focus in a few papers, either as proposals of novel solutions such as real-time locating systems [8], RFID-enabled service systems [14], smart shopping systems [19], BLE-based services [20], customer profiling by vision and radio beacon fusion [21], integrated centralised frameworks for device data collection and reporting [26], Path-Intelligent Global System for Mobile communication sensors [27], and smart store frameworks [28] or the validation of implemented technologies through beacons for proximity target marketing [29], social presence and convenience evaluation models of smart retail technologies in real cases [30], and IoT investment valuation [31]. Understanding the applications and benefits of the IoT and smart retail technologies is another research topic that has significant attention from scholars [7,26,32,33,34,35,36]. However, only a few recent papers aimed to resolve the gap of frameworks and processes that could be useful for retail practitioners in the deployment of the IoT in a retail environment [2,37,38,39,40,41]. Despite the initial hype around beacon technology [42] and trials with implementation, this technology still lacks mass adoption in retail. Beacons are an IoT technology with the potential for implementation in retail and marketing but with still limited understanding of their acceptance, impact, and viability. In recent research [40], the authors identified the challenges for beacon implementation as follows: a lack of understanding of (1) how this technology can create value for the customer, (2) how to deploy and integrate into existing retailers’ information and technology systems, (3) how to overcome the legislative and perception challenges of privacy protection and security, and (4) financial constraints vs. expected (unknown) benefits.
Reviewing the literature, we can conclude that there is a gap in the theory about organisational decision making regarding the implementation of the IoT and specifically beacons in retail, integrating the technology acceptance aspect, deployment planning and infrastructure, organisational and financial requirements, and expected business results. For retailers or brand owners, a decision framework for beacon network implementation would be a helpful tool to plan, execute, and measure the impact on value creation of this technology. How practitioners should assess the assumptions of smart retail technology perceptions and the likelihood of adoption was suggested in [38]. Pilots are suggested to research the acceptance of beacon services by shoppers in retail [43]. Another model for consideration when implementing the IoT is the input-process-output framework, designing the concept as the input, evaluation the option in the process and before implementation, and the impact in practice as the output [44].
The present study is an attempt to help address a few research questions. Since there is still limited evidence of beacon effectiveness and a lack of understanding of their potential to create value for the customer, with our in-market experiment, we aim to explore whether beacon-triggered shopper promotions are more effective than traditional in-store promotions. The in-market experiment of beacon deployment examines shopper response to beacon-triggered promotions in terms of noticeability, acceptance, and the impact on purchase behaviour.
Furthermore, we aim to propose a prediction model that organisations could use at the planning stage of beacon implementation to target the desired level of shopper response and to maximise the desired business outcome. The proposed model combines the execution parameters of the beacon implementation and the Unified Theory of Acceptance and Use of Technology (UTAUT) as a framework for beacon activation acceptance pre-assessment. This paper is set up to provide a framework and new evidence to support managerial decisions related to beacon technology introduction in retail. The outcomes give a further theoretical contribution and useful guidelines for marketers and decision makers.
The main contributions of the paper are the following:
-
A proof of concept for beacons as a vehicle for shopper engagement and promotional activities in a retail environment, which adds to the prior studies confirming the positive impact on sales this technology can have.
-
This research builds on knowledge regarding shoppers’ acceptance and interaction with smart retail technology and beacons specifically. We use the UTAUT acceptance model and real in-market tests and methodology to evaluate the beacons’ impact.
-
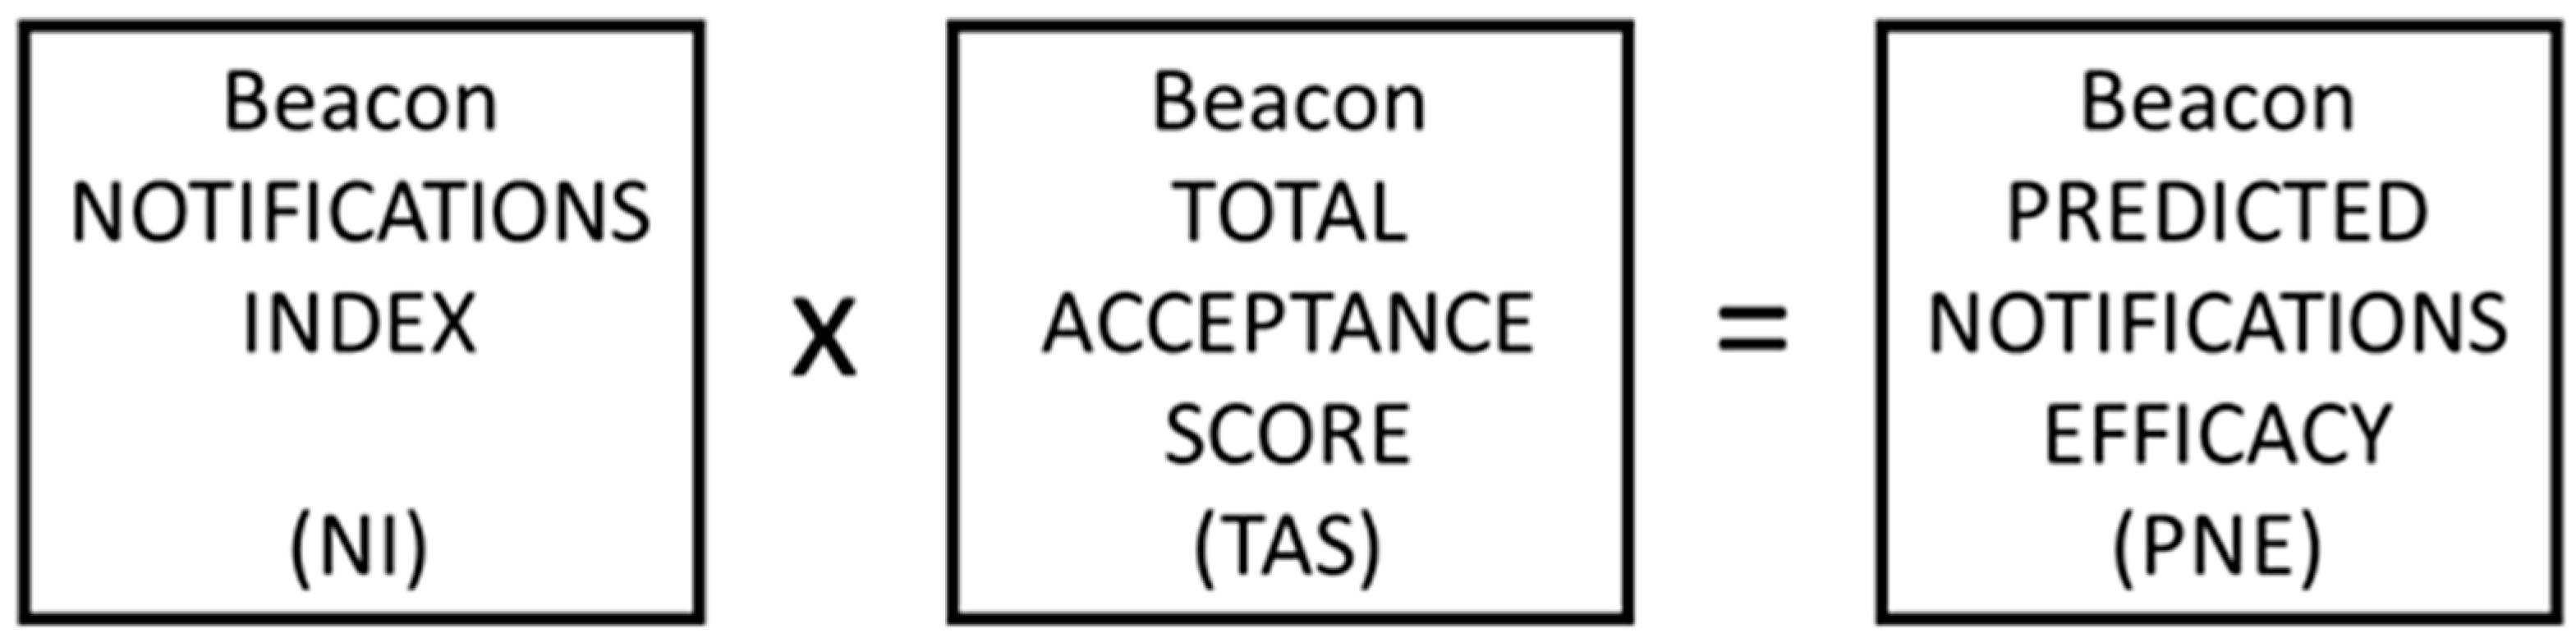
The development of a model for marketing decision makers in retail and consumer sector goods that can help them plan the implementation of beacons to engage shoppers. We introduce new metrics of beacon efficacy. The model is not only a theoretical construct, but it can also be a useful tool for practitioners dealing with beacon implementation.
The rest of the paper is structured as follows. Section 2 covers a literature review about smart retail and relevant IoT technologies, a more detailed review of beacons, and theoretical frameworks for technology acceptance. Section 3 deals with the method explanation. In Section 4, we present and discuss the results. Section 5 summarises the work with theoretical contributions, managerial implications, limitations, and future research, and we close with the conclusions in Section 6.

2. Literature Review

2.1. Internet of Things and Smart Retail Technologies

Despite the fast growth of connected sensors and optimistic projections for the future in many domains of application, the retail industry is not at the forefront of IoT adoption [6]. There has been notable progress in technology improving its advantages, such as the decreasing technology costs, the increasing computing power of devices, and improved interoperability, privacy, and security [2]. Some of the barriers for adoption identified a decade ago remain unresolved [18]. Issues related to scalability, standards, data integrity, and privacy are still in focus for many researchers and practitioners.
IoT application in retail with the use of smart retail technology creates an interactive retail system that delivers retail services to consumers through a network of smart or intelligent objects and devices [15,33]. Such smart technologies create smart retailing practices, a concept where retailers and consumers use technology to improve the quality of their shopping experiences [32,33,35]. A smart store environment can provide an understanding of customer behaviour and turn that understanding into actionable insights [28].
Previous studies have identified that consumers value smart technology in the retail environment. Specific findings indicate that smart retail technologies lead to more favourable behaviour towards the retail store, smart technology, and shopping outcomes [45], converting purchases and improving business in terms of efficiency, productivity, cost optimization, increased revenues [2,38], creating value from data [3], and helping shoppers make their purchase decisions [16]. Furthermore, smart retail technologies have the embedded possibility of personalisation and interactivity, which are critical digital stimuli that can enrich a customer’s experience [4]. Personalisation in retail store marketing was identified to have five drivers (utilitarian, hedonic, control, interaction, and integration) and four barriers (exploitation, interaction misfit, privacy, and lack of confidence) [46]. Due to the concept of omnichannel retailing, consumers have become more knowledgeable, demanding, collaborative, and interactive [47]. The exploration of the usefulness of innovative technologies in retailing reviewed several IoT-based solutions that create a smart retail environment, like electronic shelf labels, smart trolleys, RFID, and self-service checkouts [16]. The authors identified their benefits and limitations for both retailers and customers, with the underlying conclusion that congruence of technology with shopper goals increases the perceived technology utility. In the extensive inventory analysis of smart retail technologies, the authors indicated that most inventoried technologies provide cost savings, convenience, and utilitarian value, while only a few technologies offer hedonic or symbolic benefits [41].
A frequently researched topic is the impact and effectiveness of the IoT in retail. Companies that introduce the IoT in retail perform better financially [48]. Different authors have found significant positive implications in various domains. The opportunity for mass marketing and the retail application of the IoT comes from assumed benefits to a business and the generation of higher revenues from improved customer experience and loyalty or a reduction of costs driven by productivity and efficiencies in demand management and logistics [39]. In particular, the earlier stages of the customer journey appear to be the most instrumented [49]. Directly related to the customer, the benefits of sensors and actuators are seen in the possibilities for context-relevant, personalised, real-time, interactive communication with consumers and shoppers that can drive traffic and transactions [2], facilitate movement along the path to purchase, and enhance their experience—smart customer experience—in providing opportunities for retailers to interconnect, empower, and engage consumers [6,50,51]. Recent research by Bayer et al. [37] identified that IoT commerce adds new affordances to customers, specifically context-aware services, natural interactions, and automated customer processes.
The IoT can be deployed to improve logistics and infrastructure for more effective retail business and store management [2]. While retailers see benefits from IoT technologies in the supply chain, there is still a degree of concern related to the costs and trustworthiness of this technology and sensitivity to external drivers [52]. Additional findings regarding the IoT in the retail supply chain indicate a lack of regulation and governance, Internet infrastructure, and human skills [33]. When considering the adoption of the IoT, organisations also face certain risks, like the risk of out-of-date or obsolete technology, which usually has a significant cost of implementation, and the risk of out-of-use or insufficient adoption by consumers [39]. Incremental revenue from smart retail technologies can be sourced from attracting new shoppers, increasing the share of volume from existing shoppers and extracting greater consumer surplus, and this impact is moderated by the shoppers’ perception of the value of smart technologies and its satisfaction, fairness, and privacy [32,38]. IoT solutions for retail improve sales, reduce operating costs, improve customer relationships, enable better real-time services, reduce customer retention, and improve the decision-making process [36]. A useful framework for technology evaluation is based on the value IoT retail solutions create and the area of impact [7]. This framework combines the technology’s capability, enabling (immediate) or enhancing (potential) and the area of impact for demand (consumer) or supply (retailer). The aggregation of IoT applications tracking in-store movement, path analysis, layout designs, store staff allocation, and personalised marketing can increase the probability of purchase [28].
There are several research papers related to the tools and technologies that can help shopper and staff insight generation or efficient store, equipment, and inventory management, as summarised in Table 1.

Beacons

Being standard to most smartphones nowadays, beacons have become interesting to marketers as a tool for real-time, contextual, micro-location-sensitive, and personalised communication at or close to the point of purchase, enabling sensitivity to local promotional offers and being expected to create an enhanced brand experience and boost business efficiency.
A literature review of the IoT in retail found a few examples of beacon use, with possibilities for indoor positioning and proximity targeting [21,29], contextual and personalised communication with shoppers, in-store advertising and couponing, digital price tags, in-shelf digital advertising [43,56,57], sensing social interactions [58], or the example from Macy’s ShopBeacon via the Shopkick application providing shopper engagement and higher promotional relevance [31]. Additionally, beacons can be a part of intelligent navigation that enables marking the location of objects and navigating people in indoor spaces like shopping malls [59]. Users have a positive mindset for using the navigation systems in indoor spaces based on beacon-based services [19].
BLE (beacon) is a modification to the standard Bluetooth protocol to allow short-range, low-bandwidth, low-latency, very efficient communication [20]. A beacon continually broadcasts a universally unique identifier, creating a mesh network connected to the specified platform and application programming interface (API) [60].
One of the challenges for mass beacon activations is the shoppers’ use of mobile applications that should be installed on their mobile devices. Beacons installed in stores need to communicate with mobile applications [12]. The applications can serve as a source of location identifier, proximity detector, or personal interaction systems [60]. Research has validated that shoppers are interested in receiving relevant deals, offers, and personalised engagements [60,61] on their phones. Beacon technology was introduced in retail to examine the possible applications, technical requirements, and the potential impact of beacon-based services on the retailer’s business model [43]. Analysis of the results showed that (1) customers were willing to use beacons in the hypermarkets, electronic markets, and shopping malls, and (2) retailer data created from beacon interactions provided valuable information about the customers’ behaviour and preferences. Different content of beacon notifications in the real store environment was tested to determine what drives shopper adoption and the likelihood to buy [13]. The study findings support the usefulness of product information, other customers’ reviews, and personalised offers, while dynamic pricing shows a negative implication due to the perceived unfairness of such a tactic.
The nature of smart mobile devices with their applications unique to smartphone technology enables the use of sensors for the right real-time, location-sensitive, contextual interaction with customers, establishing performance expectancy and hedonic motivation as key influences on the intent to use proximity sensors in retail stores [12]. These sensors can generate differentiated value in targeting by geo-location, by ambient contextual attribution, or by use of biometrics, building a theory of mobile marketing and possibilities that only this technology provides [5]. Such applications impact the whole purchase decision-making process and give the possibility to influence it at any stage and not only in the store. There are four pillars of mobile shopping (consumer–retailer interconnectedness, consumer empowerment, proximity-based consumer engagement, and web-based consumer engagement) that define the relationships between the retailer and consumer through the lenses of interconnectivity, empowerment, and engagement [50]. Shoppers perceive a significant benefit in personalised interaction and enhanced shopping experience [62], particularly in real time during the shopping experience [4], and higher value would be given to personalisation than to location congruency [63]. People are willing to allow access to their personal information for expected benefits of value or an enhanced experience.
The literature analysis showed an evident gap related to insights about how beacons can influence shopper decision making. Furthermore, there are still inconsistent findings and gaps in theoretical knowledge related to the impact of the IoT and beacons specifically on business results or consumer satisfaction, the cost of technology introduction and maintenance or consequent organisational changes [40], or the shopper facing or infrastructure and organisational view dichotomy, respectively [34]. This gap in beacon technology acceptance research from both the end user’s and the retailer’s organisational perspectives is worthy of academic attention as an enabler for the wider adoption of this technology in practice.

2.2. Technology Acceptance

The critical factor of IoT deployment for customer engagement is the customers’ acceptance of such novel communication and activation vehicles. Using various theoretical frameworks such as the Technology Acceptance Model (TAM) [64], the Theory of Reasoned Action (TRA) [65], the Theory of Planned Behaviour (TPB) [66], the Unified Theory of Acceptance and Use of Technology (UTAUT) [67], UTAUT2 [68], and other builds on the UTAUT2 construct [69], scholars have been researching acceptance and adoption in the context of smart retail. The UTAUT synthesises previous models and has remained foundational to technology acceptance studies both in organisational and non-organisational contexts. The UTAUT identifies four key factors: performance expectancy (PE), effort expectancy (EE), social influence (SI), and facilitating conditions (FC), as well as four moderators (age, gender, experience, and voluntariness) related to predicting behavioural intention (BI) to use a technology and actual technology use (TU) [69]. The theory identifies that PE, EE, and SI influence BI as a dependent variable, while FC and BI determine TU. Age, gender, experience, and voluntariness can moderate (M) the factors and behaviour [67,68].
While significant attention is given to technology acceptance, literature dealing with smart retail technology acceptance is limited. One of the first research studies related to smart retail technologies explored consumer acceptance of RFID services [14]. This study explored the acceptance of RFID, identifying that performance, effort expectancy, and individual traits (such as technology anxiety and information privacy concerns) affect consumer attitudes towards RFID technology and services. In the research of the antecedents of the perceived shopping value of smart retail technologies, it was found that perceived complexity, advantage, novelty, and the risk of using smart retail technologies determine consumers’ perceived shopping value, which may also influence store loyalty and technology adoption [11]. The smart consumer experience enhances satisfaction and reduces the risk towards smart retail technologies [15]. Customer satisfaction can be enhanced when customers positively perceive the advantage and interactivity of smart retailing experiences [51]. There are also research studies related to the acceptance of IoT technologies in retail stores. Network externalities have a significant impact on users’ perceived benefit and, consequently, adoption of the IoT [70]. PE and hedonic motivation have a strong impact on the BI of proximity sensors in stores, while privacy concern negatively influences BI [12]. The embedded technological nature of the IoT directs user perception and acceptance research to be based on technology acceptance models [34]. Furthermore, a survey with 196 retail shoppers pointed out that perceived complexity and perceived risk lead to customer exhaustion, while perceived advantage and perceived compatibility lead to higher customer engagement [49]. For younger consumers, previous knowledge and experience with technology positively impact the readiness to use smart retail technologies in stores [71]. For organisational users like entrepreneurs, the technology knowledge was added into the UTAUT2 model, and its relationship to IoT adoption was confirmed [10]. The same research confirmed the relevance of PE, SI, FC, hedonic motivation, and habit on BI, while it did not support the influence of EE and price value.
The wholistic scope of UTAUT integrating users’ perceptions, expectations, experience, and the role of facilitating conditions is the reason for using the UTAUT model in our research. Additionally, the relevance of the UTAUT for both the adoption and initial use stages [69] enabled the analysis and incorporation into our proposed decision framework. A literature review on UTAUT studies [72] indicated that the cumulative predictive power of independent variables was not consistently confirmed in subsequent studies. Only PE and BI qualified as the best predictors of TU. Another literature review on UTAUT [73] concluded that UTAUT in its current formulation appears to be a viable model for investigating IoT adoption by organisations. They identified coverage of most PE and FC factors, while SI focused on security and privacy, and there were no particular findings regarding EE.
Based on the literature review, we selected the UTAUT framework as it was suitable for our study. Furthermore, since there is a gap in the literature dealing with beacon acceptance research using this model, our work can contribute to a new pool of knowledge in this area.

3. Method

3.1. Research Questions

Beacons are an IoT technology with the potential for implementation in retail and marketing but still with limited understanding of their acceptance, impact, and viability. For retailers or brand owners, a decision framework for beacon network implementation would be a helpful tool to plan, execute, and measure the impact on value creation of this technology. Our main research questions (RQ) were as follows:
  • RQ1: Are beacon-triggered shopper promotions more effective than traditional in-store promotions?
  • RQ2: Can there be a model to target the desired level of shopper response to beacon-triggered promotions, a model that could be used in advance to plan activity parameters to maximise the outcome appropriately?
  • RQ3: Can we utilise the UTAUT framework as a predictor of beacon activation acceptance by shoppers?
  • RQ4: Assuming positive outcomes for RQ2 and RQ3, can the beacon activation prediction model be applied to plan this technology’s implementation?

3.2. Model Development

To develop the prediction model, we will start from the process of beacon interaction with a smartphone user. This is demonstrated in Figure 1.
A beacon-enabled device within the retail outlet sends a signal picked up by a mobile phone with the appropriate application installed, Bluetooth connection enabled, and notifications within the application allowed. Input about the activated application user is processed by the platform by predefined protocols and security parameters within the cloud hosting environment. An algorithm defines the message to be activated on the user’s smartphone. The message is sent to the application, and the smartphone receives the notification. From there, the shopper can choose to open, accept, and act accordingly or decline the notification (Figure 1). Several factors would influence the scale of shopper reactions:
(a)
Availability of the relevant application on the user’s smartphone.
The nature of beacon technology assumes a mobile application as the key architecture node where notifications are sent [21,40]. Shoppers need to have the retailer’s or a third-party app on their phones to enable the interaction [7,12,13,29,40,50,71] and support achieving sales and mobile marketing goals [60].
(b)
Adequate application and phone settings to allow the interaction between devices.
The customer’s phone and relevant application need to be set up adequately to enable the interaction with an in-store beacon as a location-sensing device [12], allowing BLE protocol on the phone, opting in for location and notifications within the app, and consenting to marketing communication [40]. Privacy concern as a perceived risk is often found to be the factor negatively affecting technology adoption [12,46,49] and needs to be addressed with appropriate app consents and opt-in options.
(c)
Number of beacons in the environment to trigger the engagement process.
Depending on the store format, customer profile, and shopping occasions, as well as retailers’ commercial objectives, retail outlets may choose a different number of beacons to be placed within the outlet [12,59]. Their placement should not be incidental but rather integrated into the retailer’s business model and serve the purpose of better customer service [28]. The beacon may attract traffic to the store (outdoor positioning) or provide customer engagement within the store (indoor positioning) [60]. The cost and technical performance need to be monitored and adequately managed [20]. A beacon’s sensor network needs to enable advertising messages sent in close proximity for the beneficial impact of location–ad congruency on purchases [29,50].
(d)
Time intervals and total duration of the engagement period allowing for frequency of interactions.
Price offers or other promotional activities have a better impact if limited in time and aligned to the store’s customer profile and shopping occasions [59]. Additionally, to avoid spamming customers, notifications should be sent at adequate intervals. The level of beacon activity also has implications on energy usage and the device’s lifetime [20]. Understanding and impacting customer footfall and their time spent in store [60] should be aligned to the notification frequency to avoid the overload [40].
(e)
Ease of use, relevance, and perceived value of the received notification message.
The deployment of beacons should fulfill the utilitarian role the technology can provide to customers [41,46]. The relevance of location-congruent ads has been confirmed in multiple studies [40,63,74]. Perceived ease of use and perceived usefulness were confirmed as determinants of behaviour intent towards smart retail technologies [12,15,62]. On the opposite side, perceived technology complexity will negatively influence its adoption [11]. Serving mobile coupons [29], personalised offers [13], or supporting cost and effort reduction value for shoppers [40] drives customer relevance and the likelihood for purchase.
Based on this, we propose the following beacon-triggered activation prediction model (Figure 2). The Beacon Notification Index (NI) covers the parameters (a–d), while the Total Acceptance Score (TAS) measures the parameter (e). Then, by multiplying the two, the Predicted Notifications Efficacy (PNE) is derived.
The Notifications Index was calculated as NI = N/(B × D × U), where N = number of notifications, B = number of beacons, D = period of activation in days, and U = number of application users (in millions).
There is a need to pre-assess shopper acceptance of new technologies before implementation [38]. With that objective, we propose the Total Acceptance Score (TAS), which uses the UTAUT framework based on its suitability for IoT acceptance [73]. The TAS measures PE, EE, SI, and FC on a 7-point Likert scale [68] and claimed BI. The average of all the factors’ scores, presenting the level of relevance and appeal, is expressed as a percentage of the ideal maximum score of 7. This percentage is then multiplied by the BI percentage to reach the TAS.
By correcting the activity appeal and intention to participate (TAS) with the implementation parameters (NI), we can reach the Predicted Notifications Efficacy (PNE), which is the estimate of the efficacy of the planned beacon-triggered activity.

3.3. Study Design

To address the research questions and validate the conceptual model, the following approach was applied.
Quasi-experiments in a limited number of stores are suggested for assessing the assumptions of smart retail technology perceptions and the likelihood of adoption, comparing the outcome against a matched sample [38]. Another suggestion is pilot studies as a means to research the acceptance of beacon services by shoppers in retail [43]. We were given access to data from the three beacon-triggered promotional use cases conducted by a major beverage company in Serbia, Croatia, and Bulgaria. An in-market test was conducted in Serbia as an experiment, and two more in-market beacon activations in Croatia and Bulgaria were referenced as benchmarks to support the findings. All three cases were used to determine the effect of beacon-triggered promotional communication on shoppers and address RQ1 and RQ2. What was measured was the effectiveness of beacons as a tool to attract shopper attention, influence shopper decisions, and result in incremental sales, assuming the beacon technology’s acceptance by shoppers. All three cases were related to beacon-triggered shopper activations, using the IoT to inform and engage shoppers in the vicinity of a retail outlet to participate in special or ongoing promotions accessible in those outlets. Shoppers are willing to use beacons in hypermarket and shopping mall environments [43]. The expectation regarding such activations is to leverage the unique communication tool during the path to purchase, addressing the pillar of proximity-based consumer engagement [50] and facilitating the conversion to purchase by providing the cost and effort reduction value to shoppers [41], thus generating incremental sales that the IoT-based personalised offer service increases sales versus traditional methods [13].
The details of the first experiment are explained in the following paragraphs. A market test of beacon-triggered promotion was conducted in partnership with the leading beverage producer and the leading local retailer in Serbia. The store sample had 10 representative stores in Belgrade and 10 twin control stores of the same profile. Based on the retailer’s data, the stores were selected based on the following criteria: same store format (size and assortment), not outliers in terms of sales, and covering a broad city geography. Beacons were placed in the test stores with a set reach of 20 m, and the objective was to interact with the existing users of the SimplyTastly mobile application. SimplyTastly has been in the market since 2015, designed as a native Android and iOS application and having 160,000 users at the time of the experiment. Its purpose was to facilitate cooking and grocery shopping. Its main features included recipe searching, shopping list generation, retailer leaflet and promotion overviews, and retail outlet mapping. Connectivity with beacons was enabled within the application, but it was not the main feature and reason for users to download and use it. Beacons were sending notifications to shoppers while they were still outside but in close proximity to the store. The notification offered a special deal to shoppers: purchase 1 litre of a beverage and 500 g of meat to get a 15% discount that could be redeemed at the cashier. Beacon functionality within the app was programmed to connect to any beacon type. In this experiment, Estimote Bluetooth location beacons were deployed. They were compatible with the beacon packets for both iOS and Android. The backend process between the application and the beacon is illustrated in Figure 3. The smartphone with the SimplyTastly app would detect the beacon within the 20-m range. The app would contact the host server via the Internet connection available on the phone. After checking for the active promotions and user eligibility, the server would send the notification to the shopper’s smartphone. The response time was up to 1 s. This whole process was happening in the background without the shopper’s active involvement. Beacon installation in stores was coupled with store staff training, explaining to them how the equipment worked, the promotion’s content, how to respond to the shoppers’ questions, and how the redemption worked. The promotion ran in 2 waves of 2 weeks during the summer of 2017.
The user experience during the experiment is illustrated in Figure 4. When in the proximity of the test outlet, if the shopper had the application enabled, the beacon would activate and send the notification about the 15% discount offer on the beverage and meat purchase available in the outlet (step 1). The shopper received the notification on his or her smartphone (step 2). Shoppers had the option to accept or decline the notification (step 3). If the notification was accepted, a virtual coupon was added to the shopping list (step 4). Redemption at the cashier (step 5) included a pre-programmed discount calculation for the two items as a paired purchase. The accepted coupons were not burned within the application, but they were automatically deleted from the shopping list in the application after 24 h. Finally, the algorithm was programmed to send a new notification to the same shopper after 24 h if in the vicinity of the beacon. The interaction between the beacon and the SimplyTaslty application on shoppers’ smartphones did not require any particular prior knowledge.
The in-market test was designed in line with previous research, which confirms that goal congruence has a positive impact on the use of smart retail technologies and purchases [11], and the research confirms location congruence’s relevance [63,74].
The two benchmarking pilot cases had different set-ups in terms of location-goal congruency. A beacon pilot in Bulgaria was conducted in 2017 via a proprietary teen application and beacon-enabled coolers. The parameters were as follows: 11,000 application users, 2800 beacons across the country, 8-week long activation of a national promotion with special benefits if activated by the beacon, and a reminder to participate in the national programme. The beacons sent notifications to users when passing by the retail outlets. The case from Croatia took place during the summer of 2018 with a similar set-up to that in Bulgaria: 2 months running a summer national promotion and beacons installed in coolers (11,500) sending push notifications to promotional application users (100,000 people) passing by the outlets, reminding them of the promotion and inviting them to participate for a chance to win a prize.
In terms of user experience, the promotions in Croatia and Bulgaria were similar. When in the proximity of the beacon, a notification about the ongoing national promotion would be sent to users inviting them to purchase the product and enter codes located under the closure of the beverage to participate for a chance to win a prize. Both of the above-mentioned promotions were at the national level, with a longer duration and broader store coverage with the beacons. Another difference between these two promotions compared with the one in Serbia was in the promotional mechanism. In Serbia, the shopper would have an immediate reward of a discount on the purchased items, while in Croatia and Bulgaria, the shoppers only had a chance to win a prize.
For all three in-market tests, the parameters of the number of beacons (B), notifications (N), users (U), and days of activation (D) would be used to calculate the Notifications Index as NI = N/(B × D × U).
To address RQ3, the outcome of these tests was expressed using the UTAUT framework based on its suitability for IoT acceptance [73], assigning the outcomes of the recorded behaviours to UTAUT factors. First, the same framework was used to simulate a pre-implementation evaluation of acceptance [38]. Secondly, the theoretical construct of the UTAUT was used to structure the lessons learned from the actual implementation of beacons as a means of triggering shoppers to participate in promotions.
In terms of the UTAUT context dimensions [69], our study had the parameters shown in Table 2. To our knowledge, based on the literature review, there are extensions of the knowledge scope in terms of the focus on beacon technology, implementation in a developing and small market like Serbia, the expansion of the knowledge base related to the retail sector and consumer packaged goods (CPG), and the design of the test capturing the adoption as well as initial use phases.
Using the reference of the prior research [15,67,75], Table 3 shows the defining statements for each of the UTAUT model factors and the recorded behavioural outcome or the business metric that resulted during the market test.
PE is defined in terms of perceived usefulness (PE1) [64,76], outcome expectation (PE2) [77,78], and relative advantage (PE3) [79], measured by the applied promotional discount, notification acceptance, and actual redemption (absolute and relative to other promotional mechanisms). EE from the user’s perspective is defined by perceived ease of use (EE1) [64,76], ease of use (EE2) [79], and complexity (EE3) [80], for which the acceptance of a notification and redemption are taken as measures. SI, defined as the influence of others [78], or observability [79], defined as visibility to others, were less relevant in this specific case; as user demographics were not captured, the participation in the promotion did not require any interaction with others, nor was it directly visible to others. FC, in this case, can be summarised in terms of the objective technology-related prerequisites [80] for participation such as a phone (FC1) and Bluetooth (FC2) being turned on during the store visit, a preinstalled application (FC3), and in-app notifications being enabled (FC4) or compatibility [79] with existing needs and experiences related to shopping behaviour, like visiting specific stores during promotion weeks (FC5) and relevance of the offer to specific shoppers (FC6). Technology requirements were a critical enabler, since if any were not present, the shopper would not be able to interact with the beacon and decide on the promotion’s relevance.
As a demonstration of the intention to use the technology, in this case, notification acceptance (vs. refusal) and the redemption rate (redeemed vs. non-redeemed offers) were taken as the measure of BI. Actual TU is defined as redemption and the purchase rate compared with the standard promotional mechanisms and control store sales.
Finally, to address RQ4, the Notifications Index and Total Acceptance Score were multiplied to calculate the estimate of the efficacy of the planned beacon-triggered activity (i.e., the Predicted Notifications Efficacy). These estimated outcomes were compared to the actual redemption rates to determine the predictive potential of the model.

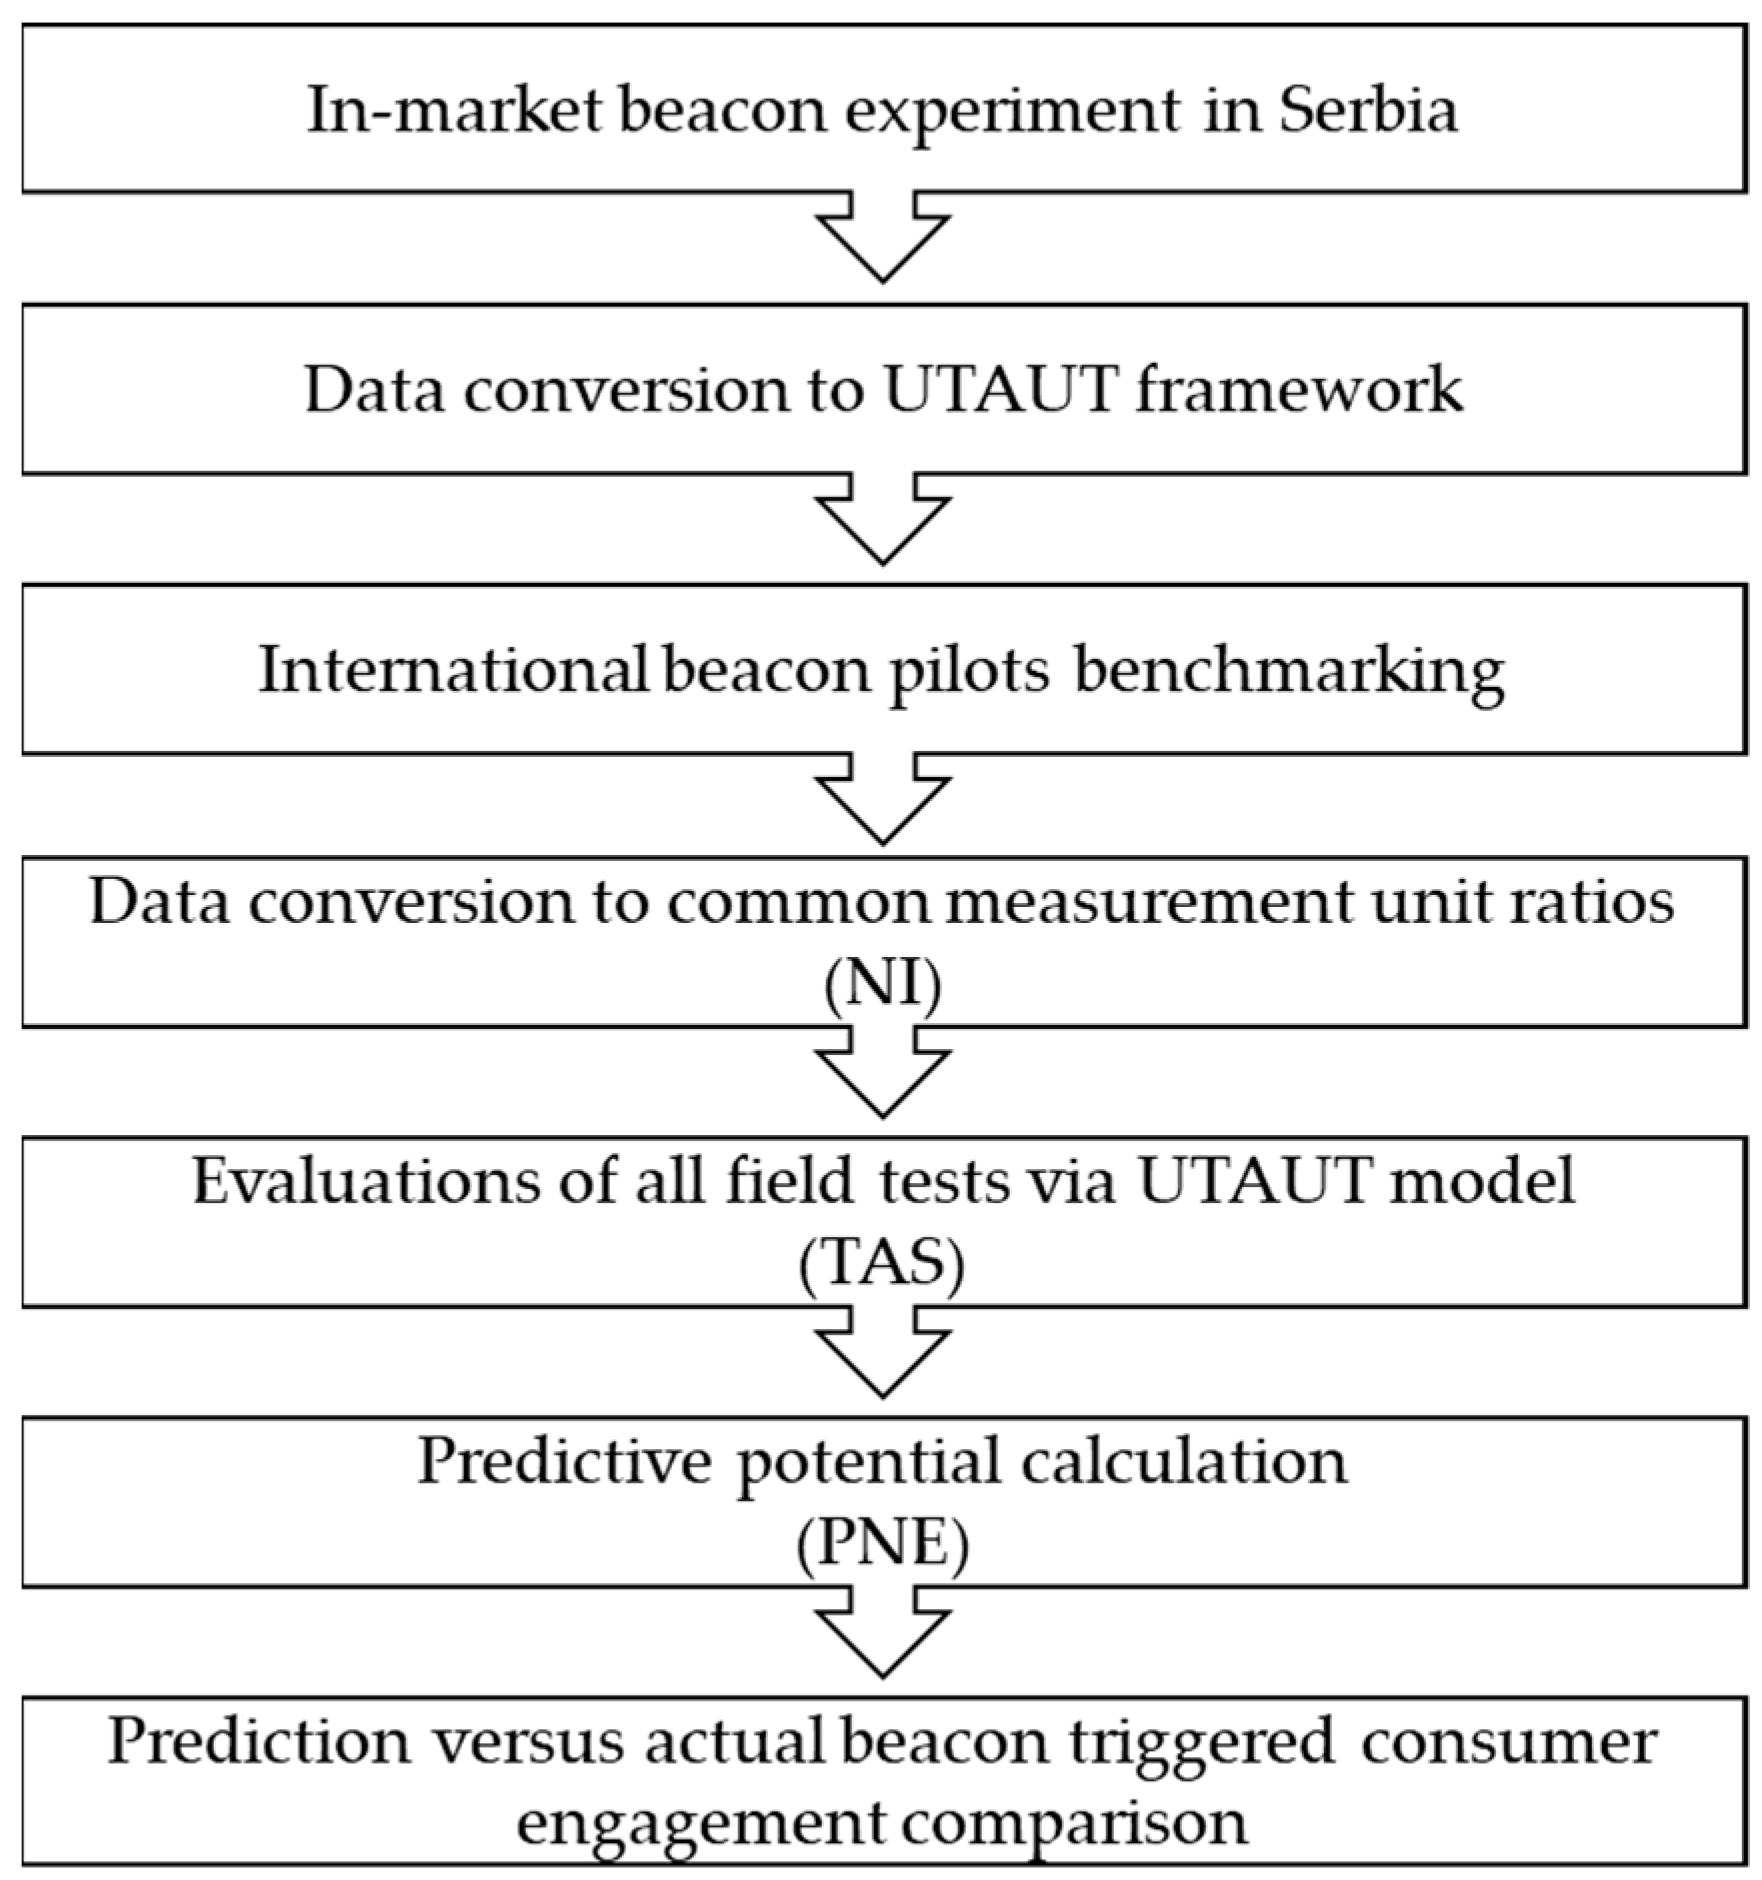
3.4. Research Procedure

The following research procedure was implemented as illustrated in Figure 5. The in-market experiment with beacons in Serbia was executed in the field. In addition to results analytics (shown later in Figure 6), we defined each UTAUT factor by the item collected in the experiment (previously illustrated in Table 3). The other two pilot tests with beacons in Croatia and Bulgaria were used for benchmarking. Since each of the three cases had a very different number of beacons, application users, and duration parameters, we converted the absolute figures to ratios to achieve a common measurement unit. The outcome was the calculated NI. Intending to establish the basis for the prediction of the technology use, we simulated the evaluations of each in-market test using the UTAUT model. The details of the choice of factors and the scoring are provided in Section 4.2. These scores were used to calculate the TAS. The complete calculation method is explained in Figure 6. With NI and TAS available, PNE could be calculated, and this was the following step. Finally, the predicted values of expected use were compared to the achieved results of the in-market tests.
An additional explanation for the calculations, illustrated later in Table 5, is shown with Equations (1)–(5) below. The formula is given for any case, as technology acceptance factors may be derived from the various numbers of individual variables that constitute a factor. Therefore, factor PE (Equation (1)) would be calculated as the sum of the means of each constituting variable divided by the number of variables. In our case, PE had three variables: perceived usefulness, outcome expectation, and relative advantage (explained in Section 4.2). As shown in Equation (5), such derived values for each factor were summed up and divided by the number of factors (the UTAUT model had four [67]). This value was divided by seven, representing the maximum value of the applied seven-point Likert scale. Seven is also the ideal maximum score for a factor that the intended users may not perceive. Therefore, this discrepancy was included in the predicted effectiveness calculation. Finally, the impact of the moderating variables (M) and expressed behaviour intent of using the technology were used as multipliers to reach the TAS value.
PE =   ( m e a n PE 1 , m e a n PE 2 ,   , m e a n PEn ) n PE
EE =   ( m e a n EE 1 , m e a n EE 2 ,   , m e a n EEn ) n EE
SI =   ( m e a n SI 1 , m e a n SI 2 ,   , m e a n SIn ) n PE
FC =   ( m e a n FC 1 , m e a n FC 2 ,   , m e a n FCn ) n PE
TAS = (   ( PE , EE , SI , FC ) / 4 ) / 7 × M × BI

4. Results and Discussion

The analysis of the results was organised into three sections. The first section aimed to address RQ1 and RQ2. This was related to the experiment’s parameters and the benchmark cases to establish the NI and the effectiveness analysis of the beacon-triggered promotions. The second section dealt with the simulation of the UTAUT framework as a predictive tool for TAS and the final PNE score analysis addressing RQ3 and RQ4.

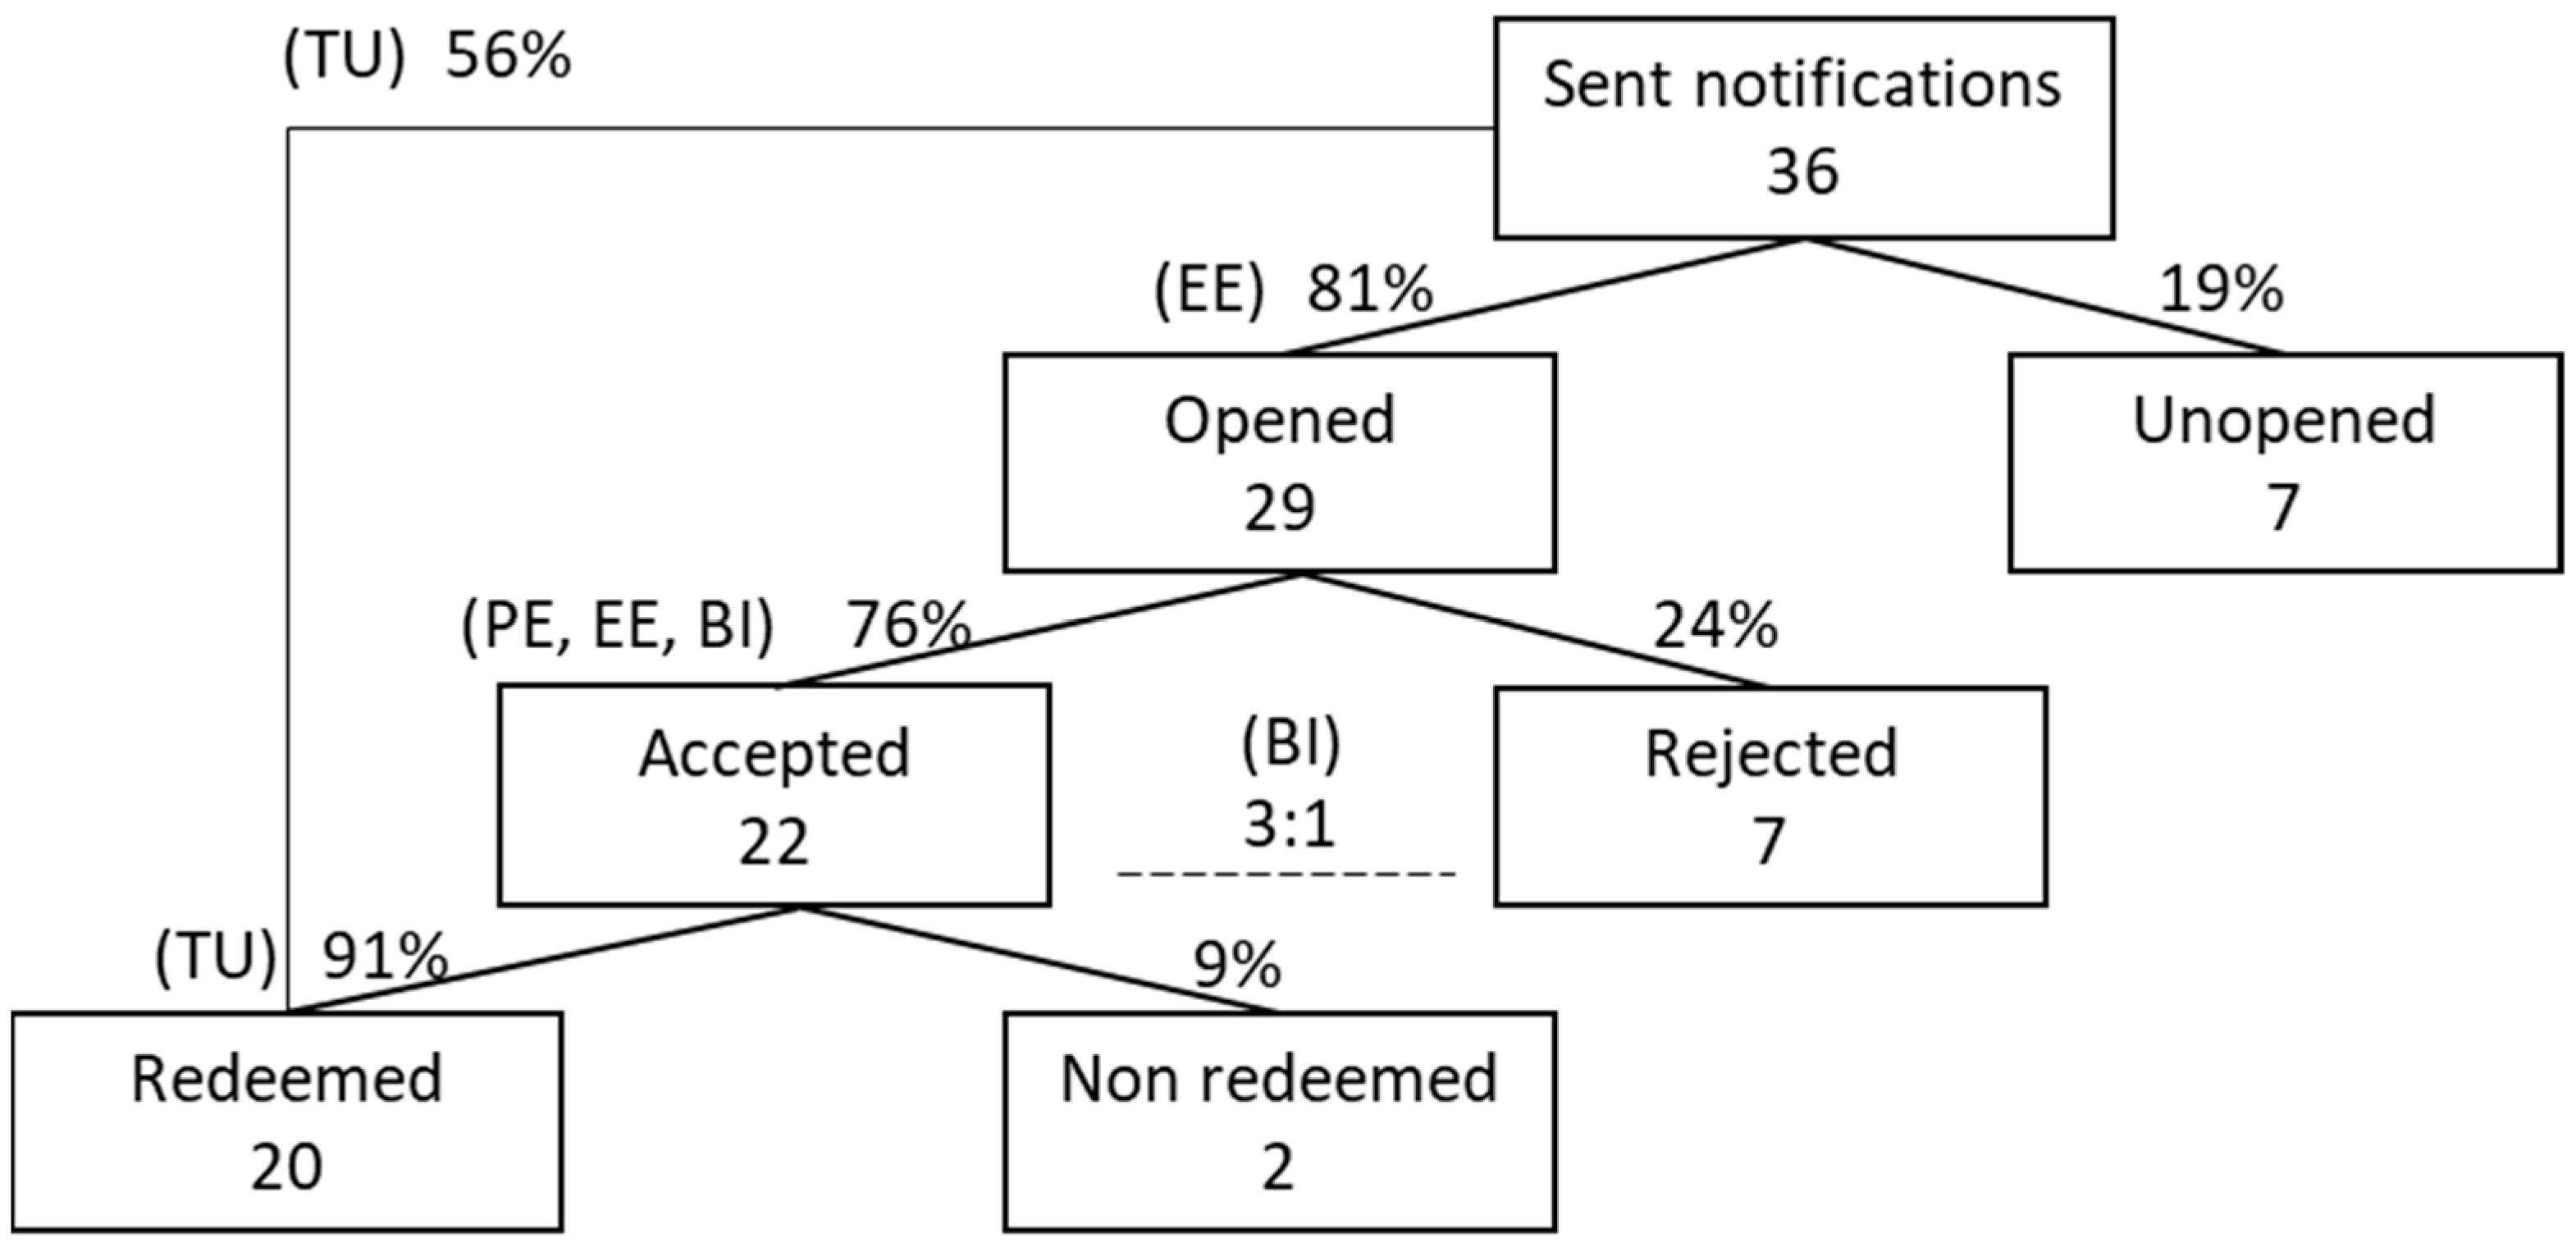
4.1. Beacon Experiment Effectiveness and Parameter Analysis

During the two in-market test waves in Serbia, the combined results were as illustrated in Figure 6.
A total of 36 notifications was sent out to random people who entered the selected stores, had the SimplyTastly application installed on their smartphones, and fulfilled the following FC: the phone was on, notifications and location were enabled, and Bluetooth was on. The in-market test was designed in line with previous research, which confirmed a positive impact of goal congruence on purchases [11] and location congruence relevance [63,74]. From 36 sent notifications, 29 (81%) were opened, confirming the noticeability [74] and readiness to proceed with participation. Out of the opened notifications, 22 (76%) were accepted, supporting the acceptance by shoppers and the positive benefit perception impact to BI. The acceptance ratio of 3:1 supports the impact of BI on TU. Finally, 20 notifications (91% of those accepted) were redeemed. When comparing the redeemed vs. sent notifications, a 56% redemption rate was achieved. Such a rate is significantly higher versus the historical average (according to internal company data) (TU), supporting the positive finding for RQ1. There were no purchases of the promoted combinations at the control stores during the activation period. Therefore, we conclude that all purchases were incremental (TU). This result supports the positive impact of beacon technology on influence shoppers’ attention and purchase decisions, indicating higher efficiency versus the historical internal benchmarks. This is also in line with the previous findings that IoT-based personalised offer services increase sales versus traditional methods [13]. These results confirm the proposition on beacon effectiveness in response to RQ1 regarding noticeability, acceptance, and the effective impact on purchase behaviour.
There was no interference during the activation but complete reliance on random factors, which were the facilitating factors (FC) in this case, namely that the application users were shopping in test pr control outlets, that they had notifications and location enabled in the application, that they had Bluetooth on, that their phones were on during shopping, and that they would hear and act on the notification received, with all of these being technology-related barriers connected with beacons [40]. With these conditions fulfilled, shoppers were receiving the notifications and engaged as per Figure 4, which confirmed the effect of FC on BI. The high level of notification acceptance led to the assumption that the shoppers did not find this means of communication intrusive or negative. On the contrary, high acceptance and redemption created the assumption of high perceived value, which is one of the key factors of IoT acceptance by shoppers [38,62,81]. All received responses were entirely voluntary (M), although this model factor was not measured.
We are aware that the sample of 36 incidences of sent notifications in the Serbian experiment is low. We are, however, choosing to use the results as relevant indicators due to the following reasons: real in-market circumstances, the wide spread of selected stores to avoid geographical population skew, full randomness of the incidences, availability of the control stores for sales comparison, a statistical minimum of 30 for the quantitative sample size, further benchmarking vs. two other market cases and additional analysis used for modeling, and treating the experiment results as indications to support the assumptions [82].
The achieved redemption rate in Bulgaria was 24%, which was higher than the 5% rate achieved without using beacons for the same promotion, with a claimed positive experience from the users. In Croatia, the achieved redemption rate was 8%, which was higher than the rate of 6% achieved without using beacons. These two cases support the findings that mobile advertising increases effectiveness in the case of location incongruency [74] and the findings on the greater impact of the IoT service level versus the traditional environment [13]. The results of all three in-market tests are illustrated in Figure 7.
The test in Serbia had complete goal and location congruency with the notifications sent to shoppers who were already inside the outlet and ready to buy something. In addition, the reward was instantaneous (i.e., redeemed at the cashier upon purchase without registering any additional codes or the offer of a chance to win), delivering on the sweet spot of IoT: the immediate benefit connecting demand and supply [7]. The use of such technology facilitates skipping some of the purchase cycle steps, allowing one to jump from “consideration” to “choice” [37]. The test had a few simple steps for the user (no additional learning requirements, registration, nor code entry), where the findings about no relationship between commitment to learn and a customer’s likelihood to engage with smart technology in retail are confirmed [71], as well as findings that performance expectancy is one of the key influences to using proximity sensors inside the store [12]. These parameters of PE and EE must perform effectively to influence BI and TU.
In reference to RQ2, the benchmark analysis of the quantitative parameters of each test is summarised in Table 4. The low numbers of the beacons per user and notifications per user were because in Serbia, only 10 beacons were available in the market for the test, while in Bulgaria and Croatia, there has already been commercial deployment of beacon-enabled coolers across the markets (2800 and 11,500 beacons, respectively). The NI was calculated as the ratio of notifications by the number of beacons multiplied by days and by users to eliminate the effect of the different number of application users or beacons or the duration of the activity. Such an approach gave a comparable base between the different test cases. This NI would be applied as the multiplier correction factor to the Total Acceptance Score.
The number of notifications was only one parameter that would define the promotion’s success as the one most directly linked to technology. The redemption rate depended on N and on other parameters of the promotional activity provided in Table 3.
Establishing the NI can become a tool to plan the scale of beacon-related activities to reach the desired number of notifications (N). Now, we could plan the scale of required users (U), duration of the programme (D), or required number of beacon devices (B) to reach, for example, 100,000 notifications. Secondly, the NI should not exceed the value of one, as that would mean that one user would receive more than one notification per day. Such a level of intrusion would be likely to diminish the positive value of relevant content. Each of the scenarios can be costed out and used to select the most optimal and financially sound solution, with the possibility to compare the cost of acquiring additional users versus prolonging the activity or increasing the number of beacons.

4.2. Beacon Predictive Framework Analysis

Using similar metrics of actual behaviour rather than claimed user opinions, we simulated the scores of each of the three cases of beacon-triggered promotions using the seven-point Likert scale [68] per each model factor. We used this result to compare the NI from Table 4 with the TU scores in Table 5 to predict the efficacy of the notifications and compare this to the achieved redemption rates in each case. These results are given in Table 5.
The PE scores were derived by assigning value to perceived usefulness, outcome expectation, and relative advantage, assuming higher scores if the message was delivered in proximity to the product inside the store [38,63], congruent with the shopping goal [16,63], and when shoppers were in the shopping modus [83]. The EE scores were derived by assigning value to perceived ease of use, ease of use, and complexity, assuming higher scores if there was a simple and easy flow [45], perceived convenience [30], and higher user self-efficacy [45]. Since none of the tests had interactions with others (neither the influence of others nor visibility to others), SI was not scored. FC was assessed while assuming the objective technology-related prerequisites [80] for participation, such as the phone and Bluetooth being turned on in the store, a preinstalled application and in-app notifications enabled, and compatibility [79] with existing needs and experiences related to shopping behaviour such as the number of shopping weeks, and the relevance of offered deal in terms of convenience and functional value [40], as well as the potential for upselling and cross-selling [43]. BI and TU were scored based on the levels of notification acceptance and redemption. Since no factor other than the voluntariness of M was registered, and each test assumed fully voluntary user action, a score of one was assigned across the board.
If all conditions were fully satisfied, the users would rate each factor the maximum score of seven. However, not all the variables met the expectations, and the factors’ mean scores were lower than seven. For the prediction, the achieved evaluation score (d in Table 5) should be divided by seven to have the starting point for further calculations of the predicted efficacy (e in Table 5). The TAS was calculated as e × f × g and represented the indication of users’ potential engagement with the technology. However, not all users would have the possibility to engage with the technology in the market. Therefore, the field parameters needed to be included and expressed as the NI. The final PNE (i in Table 5) was derived from the multiplication of the TAS and NI. The actual redemption rates are shown in line j of Table 5. All three cases showed the directional congruence of the expected and actual outcomes, with the model indicating somewhat lower scores than the actual ones. The results in this section address RQ3 and RQ4 for the suitability of the UTAUT framework for the assessment and the applicability of a prediction model for beacon activation implementation planning.
The number of notifications alone did not guarantee acceptance and redemption. Comparative evaluation of the three cases indicated that the utility level of the promotion (PE) [41], the immediacy of the reward (PE) [11], and the ease of participation (EE) [14,15,38] seemed to drive higher acceptance (BI) and redemption (TU), generating incremental revenue (TU). FC is a critical enabler of user response which enables TU, as higher coverage of beacons and a higher number of application users provided a broader base of users to trigger the desired response and try to influence the purchase. The scope and ease of network externalities [70], knowledge, and habit of smart retail technology use [10] can further drive adoption by users.
The PNE becomes a valuable tool for decision makers. With the PNE as a predicted redemption level, managers can decide if this generates a sufficient sales uplift to justify the investment. Additionally, they can model the parameters to improve the perception of PE, EE, SI, or FC or adjust the duration, beacon network, or app users on the other side. Comparing the investments needed with the expected incremental sales value can help the managers make the right decisions for their organisations.

5. Implications, Limitations, and Future Research

5.1. Theoretical Contributions

The main contribution of this research is that it provides a proof of concept for beacon-triggered promotions in the retail environment. It contributes to the smart retail literature by providing evidence of beacon implementation’s effectiveness in triggering shopper responses to promotional activities. Using beacons for shopper activation and conversion to purchase seems to be an effective tool that can bring significantly better results when compared with traditional engagement mechanisms. This adds to the prior pool of research that identified similar findings [13,28,38,74].
There is still a limited amount of research papers dealing with IoT adoption in the retail and CPG industries and none deploying the UTAUT model for beacon technology acceptance in retail. Our research is building on the knowledge about shopper behaviour and interaction with beacons in real market circumstances, which is an approach suggested in previous studies [38,43]. Comparative evaluation of the three cases indicates that the utility level of the promotion (PE) [41], the immediacy of the reward (PE) [11], and the ease of participation (EE) [14,15,38] seem to drive higher acceptance (BI) and redemption (TU), generating incremental revenue (TU).
Finally, this paper proposes a new model that practitioners can use when planning the beacon-triggered shopper engagement activities. We are introducing metrics such as the Notifications Index, Total Acceptance Score, and Predicted Notifications Efficacy, which are new to the theory. While some recent papers dealt with the challenges of beacons [40] and smart retail technology implementation [2,37,38,39,40,41], none are integrating the logistical parameters and the user perceptions as pre-assessments and a planning tool.

5.2. Managerial Implications

The main goal of the paper was to make an impact on the practice in the field of proximity retail marketing [84]. The research results discussed in this paper have valuable new insights for marketing practitioners dealing with retail. Our research indicates the positive impact of beacon technology on shoppers during purchases, attracting their attention and influencing the decision to purchase, resulting in incremental sales. Shoppers seem to accept technology. These findings support considerations for broader implementation of beacons to drive better business results, helping to articulate meaningful use cases [40]. Expanding the knowledge pool about beacon retail services helps increase knowledge about this technology among entrepreneurs as an important factor that drives adoption [10].
While it is important to reach scale with the expansion of IoT solutions and shopper activations, securing the actual performance of the technology in terms of relevance and ease of use is critical to achieving technology adoption and business results. Assuming the positive role the IoT has as an enabler of demand impact [7], the possibility to shorten the purchase cycle [37] or to minimise the risk that retailers see in the loss of cross-selling opportunities due to smart retail technology implementation [16] can all be overcome by beacon retail services as in the Serbian case example.
The technology itself cannot solve the problem of irrelevant or complex promotion that can disengage shoppers. The functional technology is an enabler [41], with beacon technology being simple and effective, but marketers need to understand the shoppers’ needs and design promotional tools that will provide a superior user experience. The proposed beacon activation prediction model combines the logistic parameters and user perceptions pre-assessment as a process, and tool practitioners can use this to optimise their investments and help improve operational efficiency. The proposed model factors and modeling the desired response behaviour or business outcome can help identify the weaknesses of specific technology solutions, evaluate the technical and financial viability of necessary improvements. Varying individual factors and comparing their costs can help managers compare the options of different solutions that can drive the desired business outcomes.
Assuming compliance with shoppers’ opt-in rights, privacy, and security, which can be risks and have a direct negative impact on the outcomes [7,12,45], perceived value benefits have the potential to drive further adoption of IoT-triggered marketing tactics. In the analysed in-market tests, we saw how IoT-enabled solutions created what Shankar et al. [83] defined as the win-win-win outcome between manufacturers, retailers, and shoppers.
The beacons achieved the best outcomes in combination with AR or VR as an enabler for creating new types of consumer interfaces, such as smart dressing rooms, simulated shelves, virtual product displays, and interactive virtual shelf-talkers [84].

5.3. Limitations and Future Research

While the analysed in-market test in Serbia had the benefit of real market conditions and real shopper behaviour, it was limited in terms of scale; the geographical coverage was limited to only one city, having only a sample of 10 outlets and resulting in only 36 notifications sent out during the test period. Benchmarking with tests in Bulgaria and Croatia indicated a reduced positive impact when activated at the national level and over a longer period. Repeating the test in Serbia at an expanded store base and for longer would help determine the acceptance level and degree of diminishing returns, which is an important managerial question. Validation of the NI would also require more cases. Running the user survey to assess and confirm the TAS would be important to confirm the proposed model as a predictor of technology efficacy.
The moderation effect, in this case, was not recorded, as the application and the promotion did not require any registration. The only active factor in this case was the voluntary nature of participation. The beacon was interacting with the SimplyTastly application users completely randomly without any prior notifications or explanations. It would be worthwhile to research the impact of different socio-demographic parameters like age, gender, or income level that may influence reactions to beacons.
We were not given access to the financial data, which is one of the limitations of this paper. Comparing the investments needed to bring the beacon technology to life in a promotional activity against the realised incremental revenue from a sales uplift would have been valuable. The costs should be differentiated between direct variable costs and the allocated depreciation of fixed assets deployed in future activities. The sales uplift was recorded in the tests, which gave the basis for incremental revenue and profit calculation.
Additional value with the IoT solution could come from possibilities for personalisation [40], thus assuming even higher value creation. Personalisation was not tested in this case, but it would be valuable to determine the impact of personalisation on acceptance and the use of beacons.
Sustaining the IoT system and leveraging its use for more targeted and productive promotional activities bears the recurring cost to the enterprise, driving higher efficiency to expected returns. Analysis of benefits versus the cost of maintaining the IoT system is an important field of interest for managers, and return on investment models could be informed by the technology acceptance findings.
Running dedicated post-experience research with users would help confirm their perceptions about the technology, the implications on brand acceptance, the imagery of activated brands, the retailer [41], readiness to use the functionality, and perceived benefits.

6. Conclusions

This paper reviewed new possibilities for improving marketing and retail practices by implementing IoT solutions. The existing literature indicates the effectiveness of smart retail practices enabled by IoT technology such as beacons. At the same time, there is a gap in predictive frameworks for effective planning of beacon technology implementation by retail practitioners. Our research, grounded in a real in-market experiment in Serbia and benchmark cases in Bulgaria and Croatia, provides a novel model that can help to target the desired level of shopper response to beacon-triggered promotions. The UTAUT framework can be utilised to generate the TAS predictive measure. The beacon implementation plan details and the NI score can be used to model the implementation design parameters. Multiplication of the TAS and NI provides the PNE as a measure of the predicted level of response. The PNE can be a useful tool for practitioners to model the costs and expected results and thus optimise beacon implementation.

Author Contributions

N.Đ., methodology, software, formal analysis, investigation, resources, data curation, writing—original draft preparation, visualisation, and funding acquisition; A.L., conceptualisation, methodology, validation, formal analysis, writing—original draft preparation, and visualisation; D.B., methodology, conceptualisation, writing—review and editing, and supervision; M.R., methodology, validation, and writing—review and editing; M.D.-Z., conceptualisation, writing—review and editing, supervision, project administration, and funding acquisition. All authors have read and agreed to the published version of the manuscript.

Funding

This research was funded by the Ministry of Education, Science, and Technological Development of the Republic of Serbia, grant number 11143.

Institutional Review Board Statement

Ethical review and approval were waived for this study due to the fact that data about consumer behaviour was collected from the applications and for the use of relevant applications and participation in promotional activities customers accepted the terms of use of the apps. The authors were given access only to the total of the responses required by the research design.

Informed Consent Statement

Informed consent was obtained from all subjects involved in the study.

Data Availability Statement

The data presented in this study are available on request from the corresponding author. The data are not publicly available due to confidentiality constraints from the partner company.

Conflicts of Interest

The authors declare no conflict of interest. The funders had no role in the design of the study; in the collection, analyses, or interpretation of data; in the writing of the manuscript, or in the decision to publish the results.

References

  1. Gong, W. The Internet of Things (IoT): What Is the Potential of the Internet of Things (IoT) as a Marketing Tool? Bachelor’s Thesis, University of Twente, Enskode, The Netherlands, 2016; pp. 1–13. [Google Scholar]
  2. Labus, A.; Despotovic Zrakic, M.; Durdevic, N.; Bogdanovic, Z. Internet of things in marketing and retail. In Proceedings of the International Conference on Advances in Information Processing and Communication Technology-IPCT 2016, Rome, Italy, 18–19 August 2016; pp. 20–24. [Google Scholar]
  3. Mazzei, M.J.; Noble, D. Big data dreams: A framework for corporate strategy. Bus. Horiz. 2017, 60, 405–414. [Google Scholar] [CrossRef]
  4. Parise, S.; Guinan, P.J.; Kafka, R. Solving the crisis of immediacy: How digital technology can transform the customer experience. Bus. Horiz. 2016, 59, 411–420. [Google Scholar] [CrossRef]
  5. Lamberton, C.; Stephen, A.T. A thematic exploration of digital, social media, and mobile marketing: Research evolution from 2000 to 2015 and an agenda for future inquiry. J. Mark. 2016, 80, 146–172. [Google Scholar] [CrossRef]
  6. Kaur, J.; Santhoshkumar, N.; Nomani, M.Z.M.; Sharma, K.D.; Maroor, P.J.; Dhiman, V. Impact of Internets of Things (IOT) in retail sector. Mater. Today Proc. 2021, 51, 26–30. [Google Scholar] [CrossRef]
  7. Caro, F.; Sadr, R. The Internet of Things (IoT) in retail: Bridging supply and demand. Bus. Horiz. 2019, 62, 47–54. [Google Scholar] [CrossRef] [Green Version]
  8. Ferracuti, N.; Norscini, C.; Frontoni, E.; Gabellini, P.; Paolanti, M.; Placidi, V. A business application of RTLS technology in Intelligent Retail Environment: Defining the shopper’s preferred path and its segmentation. J. Retail. Consum. Serv. 2019, 47, 184–194. [Google Scholar] [CrossRef]
  9. Rajabi, N.; Hakim, A. An intelligent interactive marketing system based-on Internet of Things (IoT). In Proceedings of the 2015 2nd International Conference on Knowledge-Based Engineering and Innovation (KBEI), Tehran, Iran, 5–6 November 2015; pp. 243–247. [Google Scholar] [CrossRef]
  10. Abushakra, A.; Nikbin, D. Extending the UTAUT2 Model to Understand the Entrepreneur Acceptance and Adopting Internet of Things (IoT); Springer International Publishing: Berlin/Heidelberg, Germany, 2019; Volume 1027. [Google Scholar]
  11. Adapa, S.; Fazal-e-Hasan, S.M.; Makam, S.B.; Azeem, M.M.; Mortimer, G. Examining the antecedents and consequences of perceived shopping value through smart retail technology. J. Retail. Consum. Serv. 2020, 52, 101901. [Google Scholar] [CrossRef]
  12. Cordiglia, M.; van Belle, J. Consumer Attitudes Towards Proximity Sensors in the South African Retail Market. In Proceedings of the 2017 Conference on Information Communication Technology and Society (ICTAS), Durban, South Africa, 8–10 March 2017. [Google Scholar]
  13. Fagerstrøm, A.; Eriksson, N.; Sigurdsson, V. Investigating the impact of Internet of Things services from a smartphone app on grocery shopping. J. Retail. Consum. Serv. 2020, 52, 101927. [Google Scholar] [CrossRef]
  14. Pramatari, K.; Theotokis, A. Consumer acceptance of RFID-enabled services: A model of multiple attitudes, perceived system characteristics and individual traits. Eur. J. Inf. Syst. 2009, 18, 541–552. [Google Scholar] [CrossRef]
  15. Roy, S.K.; Balaji, M.S.; Quazi, A.; Quaddus, M. Predictors of customer acceptance of and resistance to smart technologies in the retail sector. J. Retail. Consum. Serv. 2018, 42, 147–160. [Google Scholar] [CrossRef] [Green Version]
  16. Renko, S.; Druzijanic, M. Perceived usefulness of innovative technology in retailing: Consumers’ and retailers’ point of view. J. Retail. Consum. Serv. 2014, 21, 836–843. [Google Scholar] [CrossRef]
  17. Al-Fuqaha, A.; Guizani, M.; Mohammadi, M.; Aledhari, M.; Ayyash, M. Internet of things: A survey on enabling technologies, protocols, and applications. IEEE Commun. Surv. Tutor. 2015, 17, 2347–2376. [Google Scholar] [CrossRef]
  18. Atzori, L.; Iera, A.; Morabito, G. The Internet of Things: A survey. Comput. Netw. 2010, 54, 2787–2805. [Google Scholar] [CrossRef]
  19. Budakova, D.; Dakovski, L. Smart shopping system. IOP Conf. Ser. Mater. Sci. Eng. 2019, 618, 012036. [Google Scholar] [CrossRef]
  20. Radhakrishnan, M.; Misra, A.; Balan, R.K.; Lee, Y. Smartphones and BLE services: Empirical insights. In Proceedings of the 2015 IEEE 12th International Conference on Mobile Ad Hoc and Sensor Systems, Dallas, TX, USA, 19–22 October 2015; pp. 226–234. [Google Scholar] [CrossRef]
  21. Sturari, M.; Liciotti, D.; Pierdicca, R.; Frontoni, E.; Mancini, A.; Contigiani, M.; Zingaretti, P. Robust and affordable retail customer profiling by vision and radio beacon sensor fusion. Pattern Recognit. Lett. 2016, 81, 30–40. [Google Scholar] [CrossRef]
  22. Pal, S.; Mukhopadhyay, S.; Suryadevara, N. Development and progress in sensors and technologies for human emotion recognition. Sensors 2021, 21, 5554. [Google Scholar] [CrossRef]
  23. Costa, F.; Genovesi, S.; Borgese, M.; Michel, A.; Dicandia, F.A.; Manara, G. A review of rfid sensors, the new frontier of internet of things. Sensors 2021, 21, 3138. [Google Scholar] [CrossRef]
  24. Malhotra, P.; Singh, Y.; Anand, P.; Bangotra, D.K.; Singh, P.K.; Hong, W.C. Internet of things: Evolution, concerns and security challenges. Sensors 2021, 21, 809. [Google Scholar] [CrossRef]
  25. Al-Rakhami, M.S.; Al-Mashari, M. A blockchain-based trust model for the internet of things supply chain management. Sensors 2021, 21, 1759. [Google Scholar] [CrossRef]
  26. Anderson, M.; Bolton, J. Integrating sensor devices in a service oriented framework: A retail environment case study. In Proceedings of the 2016 IEEE Symposium on Service-Oriented System Engineering (SOSE), Oxford, UK, 29 March–2 April 2016; pp. 244–250. [Google Scholar] [CrossRef]
  27. He, Z.; Wilson, J. Path intelligence GSM sensor: A novel enabling technology for retail mobile location analytics. In Proceedings of the 2016 IEEE 83rd Vehicular Technology Conference (VTC Spring), Nanjing, China, 15–18 May 2016; pp. 2–6. [Google Scholar] [CrossRef]
  28. Hwangbo, H.; Kim, Y.S.; Cha, K.J. Use of the Smart Store for Persuasive Marketing and Immersive Customer Experiences: A Case Study of Korean Apparel Enterprise. Mob. Inf. Syst. 2017, 2017, 4738340. [Google Scholar] [CrossRef] [Green Version]
  29. Allurwar, N.; Nawale, B.; Patel, S. Beacon for Proximity Target Marketing. Int. J. Eng. Comput. Sci. 2016, 5, 16359–16365. [Google Scholar] [CrossRef]
  30. Grewal, D.; Roggeveen, A.L.; Nordfält, J. The Future of Retailing. J. Retail. 2017, 93, 1–6. [Google Scholar] [CrossRef]
  31. Lee, I.; Lee, K. The Internet of Things (IoT): Applications, investments, and challenges for enterprises. Bus. Horiz. 2015, 58, 431–440. [Google Scholar] [CrossRef]
  32. Gregory, J. The Internet of Things: Revolutionizing the Retail Industry. Accent. Strateg. 2015, 1–8. Available online: https://retail.iotforpartners.com/view/content/9k483 (accessed on 30 January 2022).
  33. Kamble, S.S.; Gunasekaran, A.; Parekh, H.; Joshi, S. Modeling the internet of things adoption barriers in food retail supply chains. J. Retail. Consum. Serv. 2019, 48, 154–168. [Google Scholar] [CrossRef]
  34. Lu, Y.; Papagiannidis, S.; Alamanos, E. Internet of things: A systematic review of the business literature from the user and organisational perspectives. Technol. Forecast. Soc. Chang. 2018, 136, 285–297. [Google Scholar] [CrossRef] [Green Version]
  35. Pantano, E.; Timmermans, H. What is Smart for Retailing? Procedia Environ. Sci. 2014, 22, 101–107. [Google Scholar] [CrossRef] [Green Version]
  36. Tallapragada, V.V.S.; Rao, N.A.; Kanapala, S. EMOMETRIC: An IOT Integrated Big Data Analytic System for Real Time Retail Customer ’ s Emotion Tracking and Analysis. Int. J. Comput. Intell. Res. 2017, 13, 673–695. [Google Scholar]
  37. Bayer, S.; Gimpel, H.; Rau, D. IoT-commerce-opportunities for customers through an affordance lens. Electron. Mark. 2020, 31, 27–50. [Google Scholar] [CrossRef] [Green Version]
  38. Inman, J.J.; Nikolova, H. Shopper-Facing Retail Technology: A Retailer Adoption Decision Framework Incorporating Shopper Attitudes and Privacy Concerns. J. Retail. 2017, 93, 7–28. [Google Scholar] [CrossRef]
  39. Pantano, E.; Priporas, C.V.; Dennis, C. A new approach to retailing for successful competition in the new smart scenario. Int. J. Retail Distrib. Manag. 2018, 46, 264–282. [Google Scholar] [CrossRef]
  40. van de Sanden, S.; Willems, K.; Brengman, M. In-store location-based marketing with beacons: From inflated expectations to smart use in retailing. J. Mark. Manag. 2019, 35, 1514–1541. [Google Scholar] [CrossRef]
  41. Willems, K.; Smolders, A.; Brengman, M.; Luyten, K.; Schöning, J. The path-to-purchase is paved with digital opportunities: An inventory of shopper-oriented retail technologies. Technol. Forecast. Soc. Chang. 2017, 124, 228–242. [Google Scholar] [CrossRef]
  42. Gartner. 3 Insights from Gartner Hype Cycle for Digital Marketing and Advertising 2018. 2018. Available online: https://www.gartner.com/en/marketing/insights/articles/3-insights-from-gartner-hype-cycle-for-digital-marketing-and-advertising-2018 (accessed on 5 December 2018).
  43. Thamm, A.; Anke, J.; Haugk, S.; Radic, D. Towards the Omni-Channel: Beacon-Based Services in Retail. In Business Information Systems, Proceedings of the 19th International Conference, BIS 2016, Leipzig, Germany, 6–8 July 2016; Springer: Berlin/Heidelberg, Germany, 2016; Volume 255. [Google Scholar] [CrossRef] [Green Version]
  44. Korte, A.; Tiberius, V.; Brem, A. Internet of things (Iot) technology research in business and management literature: Results from a co-citation analysis. J. Theor. Appl. Electron. Commer. Res. 2021, 16, 2073–2090. [Google Scholar] [CrossRef]
  45. Roy, S.K.; Balaji, M.S.; Sadeque, S.; Nguyen, B.; Melewar, T.C. Constituents and consequences of smart customer experience in retailing. Technol. Forecast. Soc. Chang. 2017, 124, 257–270. [Google Scholar] [CrossRef]
  46. Riegger, A.S.; Klein, J.F.; Merfeld, K.; Henkel, S. Technology-enabled personalization in retail stores: Understanding drivers and barriers. J. Bus. Res. 2021, 123, 140–155. [Google Scholar] [CrossRef]
  47. Hsia, T.L.; Wu, J.H.; Xu, X.; Li, Q.; Peng, L.; Robinson, S. Omnichannel retailing: The role of situational involvement in facilitating consumer experiences. Inf. Manag. 2020, 57, 103390. [Google Scholar] [CrossRef]
  48. Tang, C.P.; Huang, T.C.K.; Wang, S.T. The Impact of Internet of Things Implementation on Firm Performance; Elsevier Ltd.: Amsterdam, The Netherlands, 2018; Volume 35. [Google Scholar]
  49. Gong, T.; Wang, C.Y.; Lee, K. Effects of characteristics of in-store retail technology on customer citizenship behavior. J. Retail. Consum. Serv. 2021, 65, 102488. [Google Scholar] [CrossRef]
  50. Faulds, D.J.; Mangold, W.G.; Raju, P.S.; Valsalan, S. The mobile shopping revolution: Redefining the consumer decision process. Bus. Horiz. 2018, 61, 323–338. [Google Scholar] [CrossRef]
  51. Kim, Y. Revitalization of offline fashion stores: Exploring strategies to improve the smart retailing experience by applying mobile technology. Sustainability 2021, 13, 3434. [Google Scholar] [CrossRef]
  52. Tu, M. An exploratory study of internet of things (IoT) adoption intention in logistics and supply chain management a mixed research approach. Int. J. Logist. Manag. 2018, 29, 131–151. [Google Scholar] [CrossRef]
  53. Gaur, L.; Singh, G.; Ramakrishnan, R. Understanding consumer preferences using IoT smartmirrors. Pertanika J. Sci. Technol. 2017, 25, 939–948. Available online: http://www.pertanika.upm.edu.my/pjst/browse/regular-issue?article=JST-S0271-2017 (accessed on 30 January 2022).
  54. Lee, I. Big data: Dimensions, evolution, impacts, and challenges. Bus. Horiz. 2017, 60, 293–303. [Google Scholar] [CrossRef]
  55. Radhakrishnan, M.; Sen, S.; Vigneshwaran, S.; Misra, A.; Balan, R. IoT+Small Data: Transforming in-store shopping analytics & services. In Proceedings of the 2016 8th International Conference on Communication Systems and Networks (COMSNETS), Bangalore, India, 5–10 January 2016; pp. 1–6. [Google Scholar] [CrossRef]
  56. Grewal, D.; Noble, S.M.; Roggeveen, A.L.; Nordfalt, J.; Noble, S.M. The future of in-store technology. J. Acad. Mark. Sci. 2020, 48, 96–113. [Google Scholar] [CrossRef] [Green Version]
  57. Roy, S.K.; Balaji, M.S.; Nguyen, B. Consumer-computer interaction and in-store smart technology (IST) in the retail industry: The role of motivation, opportunity, and ability. J. Mark. Manag. 2020, 36, 299–333. [Google Scholar] [CrossRef]
  58. Girolami, M.; Mavilia, F.; Delmastro, F. Sensing social interactions through BLE beacons and commercial mobile devices. Pervasive Mob. Comput. 2020, 67, 101198. [Google Scholar] [CrossRef] [PubMed]
  59. Statler, S. Beacon Technologies; Apress: Berkeley, CA, USA, 2016; pp. 347–358. [Google Scholar] [CrossRef]
  60. Nowodzinski, P.; Lukasik, K.; Puto, A. Internet Of Things (Iot) in a Retail Environment. The New Strategy for Firm’s Development. Eur. Sci. J. 2016, 7881, 1857–7881. [Google Scholar]
  61. Session, M. Retail Shopping Delivering Omnichannel Experiences through Loyalty Marketing Automation, a Marketer’s Guide to Delivering Real-Time, Personalized Engagements. 2015. Available online: http://cdn2.hubspot.net/hubfs/534866/SessionM_Retail_White_Paper.pdf?t=1494352350248 (accessed on 10 September 2017).
  62. Balaji, M.S.; Roy, S.K. Value co-creation with Internet of things technology in the retail industry. J. Mark. Manag. 2017, 33, 7–31. [Google Scholar] [CrossRef]
  63. van ’t Riet, J.; Hühn, A.; Ketelaar, P.; Khan, V.-J.; Konig, R.; Rozendaal, E.; Markopoulos, P. Investigating the Effects of Location-Based Advertising in the Supermarket: Does Goal Congruence Trump Location Congruence? J. Interact. Advert. 2016, 16, 31–43. [Google Scholar] [CrossRef]
  64. Davis, F.D. Perceived Usefulness, Perceived Ease of Use, and User Acceptance of Information Technology. MIS Q. 1989, 13, 319–340. [Google Scholar] [CrossRef] [Green Version]
  65. Ajzen, I.; Fishbein, M. Attitudinal and normative variables as predictors of specific behavior. J. Pers. Soc. Psychol. 1973, 27, 41–57. [Google Scholar] [CrossRef]
  66. Taylor, S.; Todd, P. Decomposition and crossover effects in the theory of planned behavior: A study of consumer adoption intentions. Int. J. Res. Mark. 1995, 12, 137–155. [Google Scholar] [CrossRef]
  67. Venkatesh, V.; Morris, M.G.; Davis, G.B.; Davis, F.D. User acceptance of information technology: Toward a unified view. MIS Q. Manag. Inf. Syst. 2003, 27, 425–478. [Google Scholar] [CrossRef] [Green Version]
  68. Venkatesh, V.; Thong, J.Y.L.; Xu, X. Consumer Acceptance and Use of Information Technology: Extending the Unified Theory of Acceptance and Use of Technology. MIS Q. 2012, 36, 157–178. [Google Scholar] [CrossRef] [Green Version]
  69. Venkatesh, V.; Thong, J.Y.L.; Xu, X. Unified theory of acceptance and use of technology: A synthesis and the road ahead. J. Assoc. Inf. Syst. 2016, 17, 328–376. [Google Scholar] [CrossRef]
  70. Hsu, C.-L.L.; Lin, J.C.C. An empirical examination of consumer adoption of Internet of Things services: Network externalities and concern for information privacy perspectives. Comput. Human Behav. 2016, 62, 516–527. [Google Scholar] [CrossRef]
  71. Foroudi, P.; Gupta, S.; Sivarajah, U.; Broderick, A. Investigating the effects of smart technology on customer dynamics and customer experience. Comput. Hum. Behav. 2018, 80, 271–282. [Google Scholar] [CrossRef]
  72. Williams, M.D.; Rana, N.P.; Dwivedi, Y.K. The unified theory of acceptance and use of technology (UTAUT): A literature review. J. Enterp. Inf. Manag. 2015, 28, 443–448. [Google Scholar] [CrossRef] [Green Version]
  73. Carcary, M.; Maccani, G.; Doherty, E.; Conway, G. Exploring the Determinants of IoT Adoption: Findings from a Systematic Literature Review; Springer International Publishing: Berlin/Heidelberg, Germany, 2018; Volume 330. [Google Scholar]
  74. Ketelaar, P.E.; Bernritter, S.F.; van’t Riet, J.; Hühn, A.E.; van Woudenberg, T.J.; Müller, B.C.N.; Janssen, L. Disentangling location-based advertising: The effects of location congruency and medium type on consumers’ ad attention and brand choice. Int. J. Advert. 2017, 36, 356–367. [Google Scholar] [CrossRef]
  75. Mital, M.; Chang, V.; Choudhary, P.; Papa, A.; Pani, A.K. Adoption of Internet of Things in India: A test of competing models using a structured equation modeling approach. Technol. Forecast. Soc. Chang. 2018, 136, 339–346. [Google Scholar] [CrossRef]
  76. Davis, F.D.; Bagozzi, R.P.; Warshaw, P.R. User Acceptance of Computer Technology: A Comparison of Two Theoretical Models. Manag. Sci. 1989, 35, 982–1003. [Google Scholar] [CrossRef] [Green Version]
  77. Compeau, D.; Higgins, C.A.; Huff, S. Social cognitive theory and individual reactions to computing technology: A longitudinal study. MIS Q. Manag. Inf. Syst. 1999, 23, 145–158. [Google Scholar] [CrossRef]
  78. Compeau, D.; Higgins, C. Computer Self-Efficacy: Development of a Measure and Initial Test. MIS Q. 1995, 19, 189–211. [Google Scholar] [CrossRef] [Green Version]
  79. Moore, G.C.; Benbasat, I. Development of an instrument to measure the perceptions of adopting an information technology innovation. Inf. Syst. Res. 1991, 2, 192–222. [Google Scholar] [CrossRef] [Green Version]
  80. Thompson, R.L.; Higgins, C.A.; Howell, J.M. Personal Computing: Toward a Conceptual Model of Utilization. MIS Q. 1991, 15, 125–143. [Google Scholar] [CrossRef]
  81. Brown, T.E. Sensor-based entrepreneurship: A framework for developing new products and services. Bus. Horiz. 2017, 60, 819–830. [Google Scholar] [CrossRef]
  82. Bock, T.; Sergeant, J. Small sample market research. Int. J. Mark. Res. 2002, 44, 235–244. [Google Scholar] [CrossRef] [Green Version]
  83. Shankar, V.; Inman, J.J.; Mantrala, M.; Kelley, E.; Rizley, R. Innovations in shopper marketing: Current insights and future research issues. J. Retail. 2011, 87, S29–S42. [Google Scholar] [CrossRef]
  84. Wedel, M.; Bigné, E.; Zhang, J. Virtual and augmented reality: Advancing research in consumer marketing. Int. J. Res. Mark. 2020, 37, 443–465. [Google Scholar] [CrossRef]
Figure 1. Beacon activation process.
Sustainability 14 03256 g001
Figure 2. Beacon-triggered activation prediction model.
Sustainability 14 03256 g002
Figure 3. Backend process between SimplyTastly and the beacon.
Sustainability 14 03256 g003
Figure 4. SimplyTastly beacon-triggered promotion user experience steps (* English translation of Serbian text).
Sustainability 14 03256 g004
Figure 5. Research steps illustration.
Sustainability 14 03256 g005
Figure 6. Results of in-market beacon test.
Sustainability 14 03256 g006
Figure 7. Results of three in-market beacon tests, comparing beacon-activated to non-beacon activated redemption.
Sustainability 14 03256 g007
Table 1. Smart retail solutions overview.
Smart Retail SolutionFunctionalityFindingReference
Real-time locating systemShopper path monitoring system Enables identification of best performing store areas, shopper dwell time in different locations, prediction of shopper paths, and segmentation of shopping missions[8]
The EmoMetric intelligent trolleyTracking customers’ emotions and providing behavioural insight High accuracy of the technique and big data integration[36]
SmartMirrorsTechnology that helps facilitate shopper decision making Enables shopper prospecting with data integration[53]
Scan and GoAutomatic scanning of items and payment using smartphonesConvenience and time saving[30]
Que VisionReduce waiting in queuesGenerated the most positive attitudinal perceptions and did not generate privacy concerns, high perceived usefulness, ease of use, and adoption likelihood[38]
Smart shelvesWeight-sensitive for inventory management, digital pricing, and beacon-activated mobile advertising possibilitiesSomewhat negative attitudinal perception and high privacy concern, high perceived usefulness, ease of use, and adoption likelihood[38]
Tesco refrigerator sensorsUsing IoT to optimise refrigerator temperature and realise significant cost savingsSensors optimise refrigerator performance for energy saving[54]
Path Intelligence for mobile location analyticsNovel solution for GSM sensor technology Enables mobile location analytics[27]
Predictive inventory management and merchandise layout planningTracking shopper behaviour at shelvesIn-lab environment achieving high accuracy for item picking and shelf locations[55]
Kroger’s Retail Site IntelligenceOne platform of multiple technologies and services Better shopper experience, easier location of products, and faster check out[31]
BLE-based indoor location trackingContinuous indoor locationMore intermittently operated BLE solution with trigger activation only during relevant time periods satisfies energy constraints[20]
Table 2. SimplyTastly beacon-triggered promotion test UTAUT context dimensions.
Context DimensionTest Parameters
User classConsumer or shopper
TechnologyBeacon-triggered mobile notification for a promotion
TaskParticipation in promotion
Location (geography)Serbia (Croatia, Bulgaria)
Location (sector)Retail or CPG
TimeAdoption or initial use
Table 3. Conceptual framework of the test.
Model FactorsFactor DefinitionReferenceFactor Item
Performance Expectancy (PE)PE1. Promotion is usefulPerceived Usefulness [64,76]Percent of savings, acceptance, redemption
PE2. Promotion is beneficialOutcome Expectation [77,78]Percent of saving, redemption
PE3. Such promotion is better vs. othersRelative Advantage [79]Redemption rate
Effort Expectancy (EE)EE1. Easy to usePerceived Ease of Use [64,76]Acceptance level
EE2. Easy to accessEase of Use [79]Accept, redeem
EE3. Clear what to doComplexity [80]Redemption rate
Social Influence (SI)SI1. Influence of othersInfluence of Others [78]Not recorded or application rating
SI2. Visible to othersObservability [79]No
Facilitating Conditions (FC)FC1. Phone on in-storeObjective Technology-Related Prerequisites [80]Turned on
FC2. Bluetooth onTurned on
FC3. Application installedPercent of population vs. benchmarks
FC4. Notifications enabledEnabled
FC5. Shopping at test store weeksCompatibility [79]Low
FC6. Relevance of promotion combination offerHigh-frequency items
Behaviour Intention (BI)BI1. Notification acceptance Refusal vs. acceptance rate
BI2. Redemption Redeemed vs. non-redeemed
Technology Use (TU)TU1. Redemption Vs. standard
TU2. Purchase rate Vs. control (incremental)
Table 4. Summary of quantitative parameters of beacon-triggered promotions in in-market tests.
Test ParametersSerbiaBulgariaCroatia
Application users (in millions) (U)0.1600.0110.100
Beacons (B)10280011,500
Period in days (D)285660
Notifications (N)3685015,100
Notifications Index (NI): N/(B × D × U)0.800.490.22
Table 5. UTAUT scores and promotional efficacy of in-market tests.
Model FactorsTest Scores
SerbiaBulgariaCroatia
a. Performance expectancy (PE) score6.335.334.00
b. Effort expectancy (EE) score6.676.005.00
c. Facilitating conditions (FC) score5.835.505.50
d. Mean of PE, EE, and FC6.285.614.83
e. Deviation of d. from ideal score of 70.900.800.69
f. Moderating variables (M)1.001.001.00
g. Behaviour intention (BI)0.690.400.25
h. Total Acceptance Score (TAS) (e × f × g)0.620.320.17
k. NI (from Table 4)0.800.490.22
i. Predicted Notifications Efficacy (PNE) (h × k)0.500.160.04
j. Technology use (TU): actual redemption rate0.560.240.08
Publisher’s Note: MDPI stays neutral with regard to jurisdictional claims in published maps and institutional affiliations.

