Abstract
Climate disasters pose a risk to residents’ well-being globally. However, information about the impact of climate disasters among urban and rural residents remains lacking, especially in Indonesia. This study aims to fill the gap by investigating the impact of climate disaster on subjective well-being based on urban and rural typology model. The data were cross-sectional, involving 7110 Indonesian residents who had experienced climate disasters, 3813 from urban areas and 3297 from rural areas. An ordered probit model was employed to estimate the impact of climate disasters on subjective well-being (i.e., happiness and life satisfaction). In general, the empirical results show that climate disasters do not significantly affect the happiness of Indonesian residents, but they significantly and negatively impact their life satisfaction. Further analysis reveals that climate disasters impact urban and rural residents differently. The subjective well-being of rural residents is more severely affected than those living in urban areas. Further estimation also indicated that climate disaster significantly reduces residents’ subjective well-being at the lowest income level for both rural and urban residents. Our finding confirms that rural residents remain the most vulnerable to the impacts of climate change.
1. Introduction
Climate change has impacted the environment and various aspects of human life in recent decades. Its immediate indicator is the change in global temperature [1], which has risen by nearly 1.8 degrees Fahrenheit since 1880 [2]. Floods, droughts, tropical cyclones, and earthquakes are some of the catastrophic impacts, which have happened more frequently across the globe. Fang et al. [3] reported that there have been 13,386 climate disasters globally since 1970, resulting in 3.6 million deaths, 7.7 billion casualties, and USD 3.3 trillion economic losses. In the future, the occurrences of climate disasters are anticipated to increase in intensity and frequency [4]. For instance, Lenderink and Van Meijgaard [5] predicted that extreme rain events would become more frequent in the future. Similarly, Taherkhani et al. [6] projected that extreme weather phenomena would continue to increase due to the sea-level rise. Indonesia has been impacted by extreme weather severely. From 1815 to 2019, there were 10,438 floods, 6050 landslides, 2124 droughts, and 1914 forest fires [7]. Aside from fatality, climate disasters such as these cause significant ecological, economic, social, and physiological losses [8].
Literature has extensively documented the impacts of climate disasters with various social indicators. There are two strands of research on the nexus between climate disasters and society. The first focuses on the association with economic losses [9,10,11,12]. For example, Dasgupta, Laplante, Murray, and Wheeler [9] examined the economic impact of sea-level rise in 84 developing countries, claiming that increasing sea level per meter can reduce agricultural land by 7%, which means 10% of GDP losses in the agricultural sectors. Ullah, Shah, Saqib, Yaseen, and Haider [12] assessed the households’ vulnerability to floods in Pakistan, highlighting the vulnerability of the daily wagers as they lost their primary source of income. Due to their financial limitations, these residents living in poverty were also unable to mitigate the impact of floods, i.e., reconstruct their house or move to a safer place. Similarly, Nguyen, Le, and Vo [11] compared the households in flood-prone areas and safer areas and found that the former earned less income and had a higher expenditure. They also reported that climate disasters caused 57% of economic losses in Vietnam, and 37.3% were affected by the floods. In Indonesia, Djalante, Garschagen, Thomalla, and Shaw [10] estimated that between 1900 to 2015, the total economic losses due to climate disasters were at approximately USD 44 million, and the death toll was 238,000.
The impact of climate disasters on well-being and intangible assets can also be severe [13]. The death toll and physical damages leave residents traumatized, and the environmental destruction causes biodiversity loss and disturbed ecosystems [14]. Therefore, the second strand of research focuses on the association between climate disasters and residents’ well-being [15,16,17], which can either be physiological, i.e., health problems or psychological, i.e., stress and anxiety [18]. A study involving 422 respondents from France, Hudson, Botzen, Poussin, and Aerts [17] found that climate disasters, especially floods, reduced residents’ subjective well-being. Calvo, Arcaya, Baum, Lowe, and Waters [15] compared the happiness level of the Americans before and after Hurricane Katrina and found a significant decrease even after a year had passed. Hamama-Raz, Palgi, Leshem, Ben-Ezra, and Lavenda [16] revealed that the subjective well-being of the Filipinos was negatively impacted because they lost their home and resources and experienced disturbances to their physical health.
The severity of the impact may depend on socio-economic and demographic profiles, according to Sam et al. [19], and the difference is usually stark between urban and rural areas. The urban infrastructure is often more developed, and residents have more stable income sources. Meanwhile, the rural infrastructure is not as advanced, and most residents depend on natural resources for income [20] as they primarily work in the agriculture, fisheries, and forestry sectors. Therefore, climate disasters may affect rural and urban dwellers in different magnitudes. Although previous literature has documented the impact of climate disasters on subjective well-being, research has not compared how the effect may be different between the urban and rural areas. Therefore, this study seeks to address the gaps and is motivated to support the United Nations’ Sustainable Development Goal of “no one must be left behind” by calling for the reduction of urban–rural inequality and the improvement of mental health and wellness for all humanity.
This study contributes to the literature from two essential aspects. First, this study provides the comparison impact of climate disaster subjectively between urban and rural residents. Second, we investigate the disaggregated impact of climate disaster on the subjective well-being by household income level. The existing literature mainly examined the homogenous impact of climate disaster [17,18,21,22]. Residents from different income levels, on the other hand, may behave differently when impacted by a climate disaster. The current study aims to investigate the impact of climate disaster on subjective well-being based on the urban and rural typology model. The finding will have a practical implication on urban and rural development policy making and climate change mitigation.
2. Materials and Methods
2.1. Research Data
This study employs open-access data from the Indonesian Life Survey Family 5 (IFLS-5), and it can be accessed on http://www.rand.org/labor/FLS/IFLS.html (accessed on 2 November 2021). The survey was conducted from 2014 to 2015 and was firstly initiated by RAND Corporation, which collaborated with METRE Survey and Gadjah Mada University. The IFLS is a national survey collecting detailed data from about 23,776 individuals from 15,067 households. The survey was ethically reviewed and approved by Institutional Review Boards in the United States and Gadjah Mada University in Indonesia.
The respondents had previously experienced a climate disaster. The exclusion criteria of the IFLS data were those who had never experienced a climate disaster and those with missing information. As such, we included 7110 respondents, with 3813 living in urban areas and 3297 living in rural areas. The questionnaire was divided into three parts. The first was about a climate disaster. The respondents were asked how many times they had experienced climate disasters in the last five years. The second was about the socio-demographic profiles, including age, gender, marital status, family members, education, health condition, income, and assets. The third was about subjective well-being.
2.2. The Measurement of Key Variables
Climate disaster is the first key variable. This variable is measured by the respondents’ intensity of disasters experienced in the last five years, including flood, landslide, volcanic eruption, earthquake, windstorm, forest fire, and drought. The second key variable is subjective well-being, which is one of the most significant current discussions to understand people’s well-being conditions. The importance of non-monetary components has become more acknowledged in the last decade, which is now recognized as a multidimensional concept spanning multiple aspects of life [23]. Classic well-being indicators, such as income, have also been criticized for being too one-sided and incapable of accounting for non-monetary components of life, such as happiness and life satisfaction. Easterlin [24] argues that wealth cannot increase happiness significantly [20,25,26]. As a result, researchers in disciplines such as economics and political science were attracted to the idea of subjective well-being [27,28]. Personal cognition and emotional judgment of life quality are both considered to constitute subjective well-being. [29,30]. According to Diener et al. [31], subjective well-being is “a broad category of phenomena that include people’s emotional responses, domain satisfactions and global judgments of life satisfaction”. To assess subjective well-being, international literature has traditionally utilized two indicators, namely happiness and life satisfaction Happiness is a sort run measure to symbolize the emotional quality of everyday experience, whereas life satisfaction refers to long-term ideas and sentiments about life [20,32]. To measure the happiness variable, the respondents were asked: “After everything you have gone through, would you say you were very happy, happy, unhappy, or very unhappy”? The responses’ scoring is 1 for very unhappy, 2 for unhappy, 3 for happy, and 4 for very happy. Meanwhile, for life satisfaction, the respondents were asked: “In general, how satisfied are you with your life”? There were five scale options to choose from 1 for not satisfied at all, 2 for not very satisfied, 3 for somewhat satisfied, 4 for very satisfied, and 5 for completely satisfied.
2.3. Econometric Analysis
This study employs an ordinal probit model to estimate the impact of climate disasters since the dependent variables are ordinal, i.e., subjective well-being (happiness and life satisfaction). Therefore, we assumed that subjective well-being is the function of the climate disaster and socio-demographic variables. Specifically, the model can be written as follows:
where . denotes subjective well-being (i.e., happiness and life satisfaction), determined with ordinal variables and unknown cut-offs ,…..; is explanatory variables, i.e., age, gender, marital status, family members, education, health condition, income, and assets; and represent the parameters to be estimated; and is a random error term.
3. Results
3.1. Descriptive Statistics
Table 1 presents the descriptive statistics of the variables used in this study. The results show that the average natural frequency by the respondent is 2.4042, revealing that the respondents have experienced climate disasters approximately two to four times in the last five years. The average values of subjective well-being indicators are 2.9809 for happiness and 3.2446 for life satisfaction. This finding suggests that the well-being of Indonesian residents who had experienced climate disasters was relatively good. Regarding the socio-demographic profiles, the average age of the respondents was 37.1716 years old, with 52.28% female and 72.53% married. In addition, the average family member in a household is approximately four to five, and 45.14% of them have a child under 15 years old. The majority of the respondents graduated from primary school (32.41%), and only 3.16% graduated from university. The mean value of self-report health status was 2.8964, suggesting a good condition. The average income earned by the respondent was about IDR1,047,927 per month. Almost 93% owned a television set, 72.02% owned a mobile phone, and 75.19% owned a private vehicle, i.e., a motorcycle or car. Finally, only 25.82% of the respondents owned financial savings.

Table 1.
Descriptive statistics.
Table 2 presents the mean differences of the study variables between the urban and rural residents in Indonesia. There is no significant difference between urban and rural residents’ experience in climate change, suggesting that both urban and rural residents have experienced similar climate disasters. The subjective well-being indicators show different results. There is no significant difference in the happiness level, but the residents’ life satisfaction is significantly higher in urban areas. Those living in urban areas are more satisfied with their life than those living in rural areas.
Table 2.
Mean difference of selected variables between urban and rural residents.
Meanwhile, the socio-demographic variables show that the urban residents are more educated, earn more, and own a television and/or mobile phone, a vehicle, and financial capital (savings). For instance, the urban residents’ education level is tertiary. In rural areas, most residents graduated from junior high school or primary school. Many of them receive no education at all. Those in urban areas also earn more, IDR276,668 higher than those in rural areas. Overall, with such significant differences between urban and urban residents, it is likely that the climate disasters will impact them differently, especially in terms of their well-being.
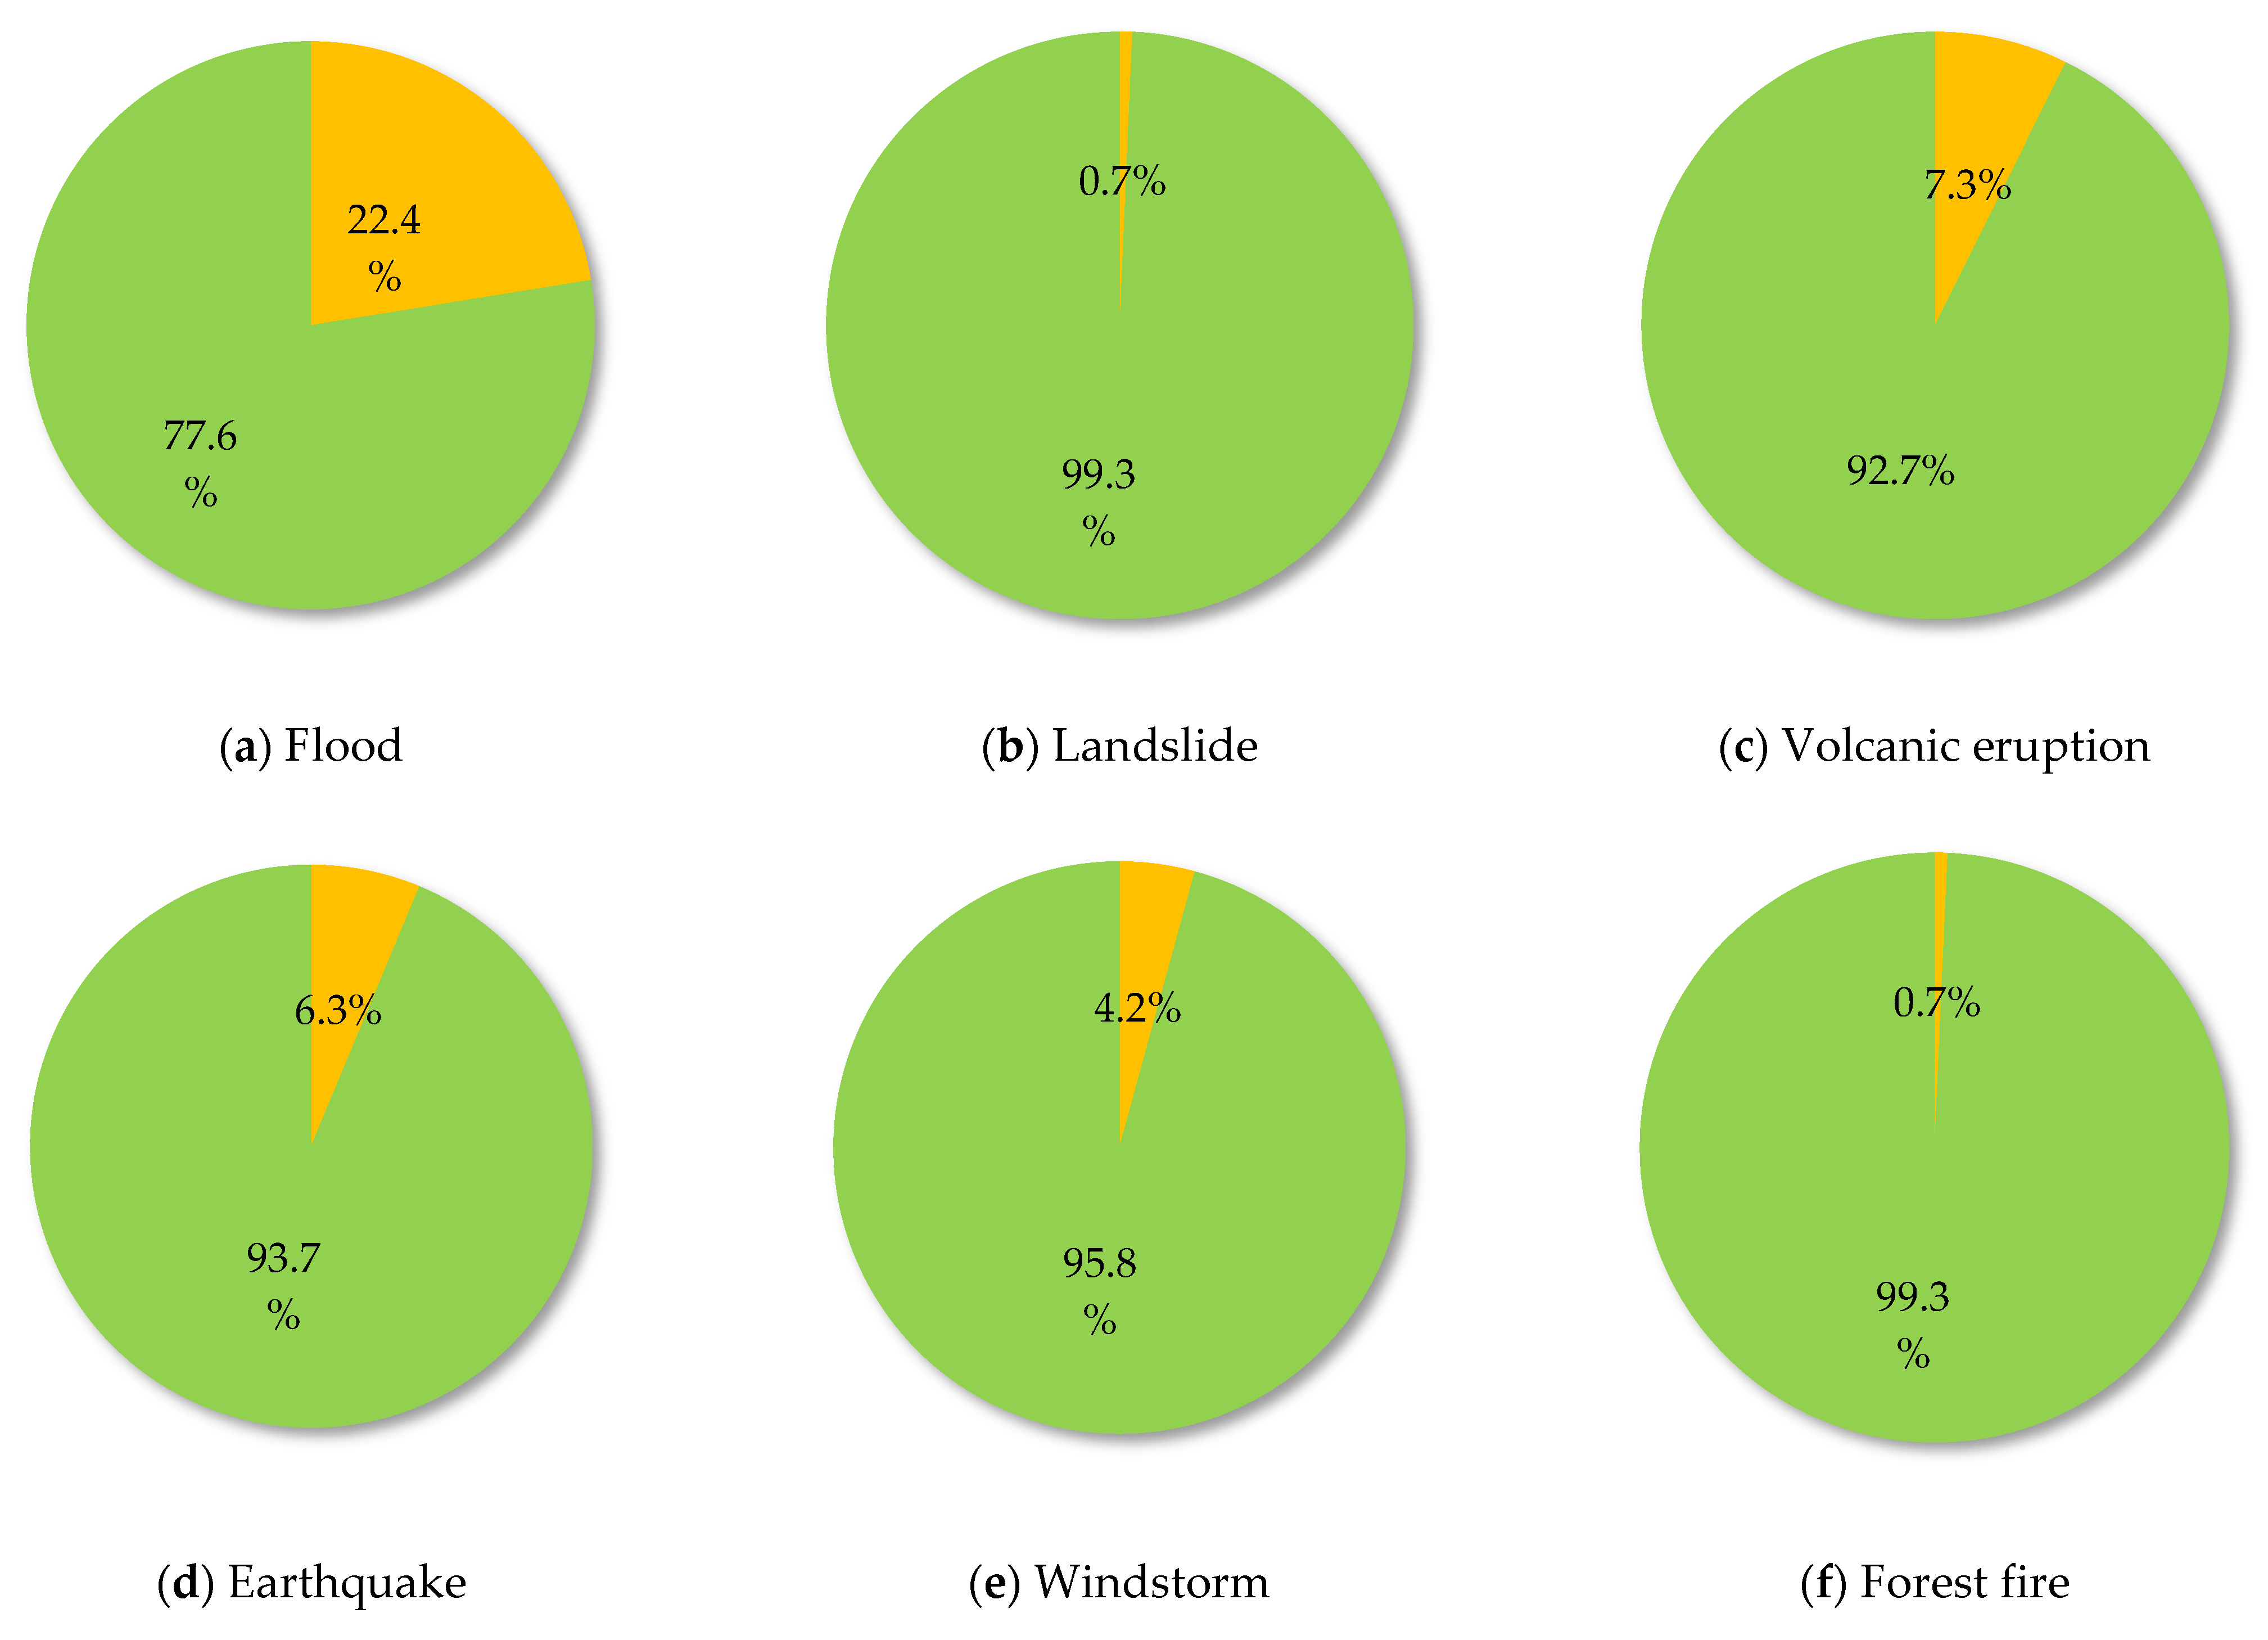
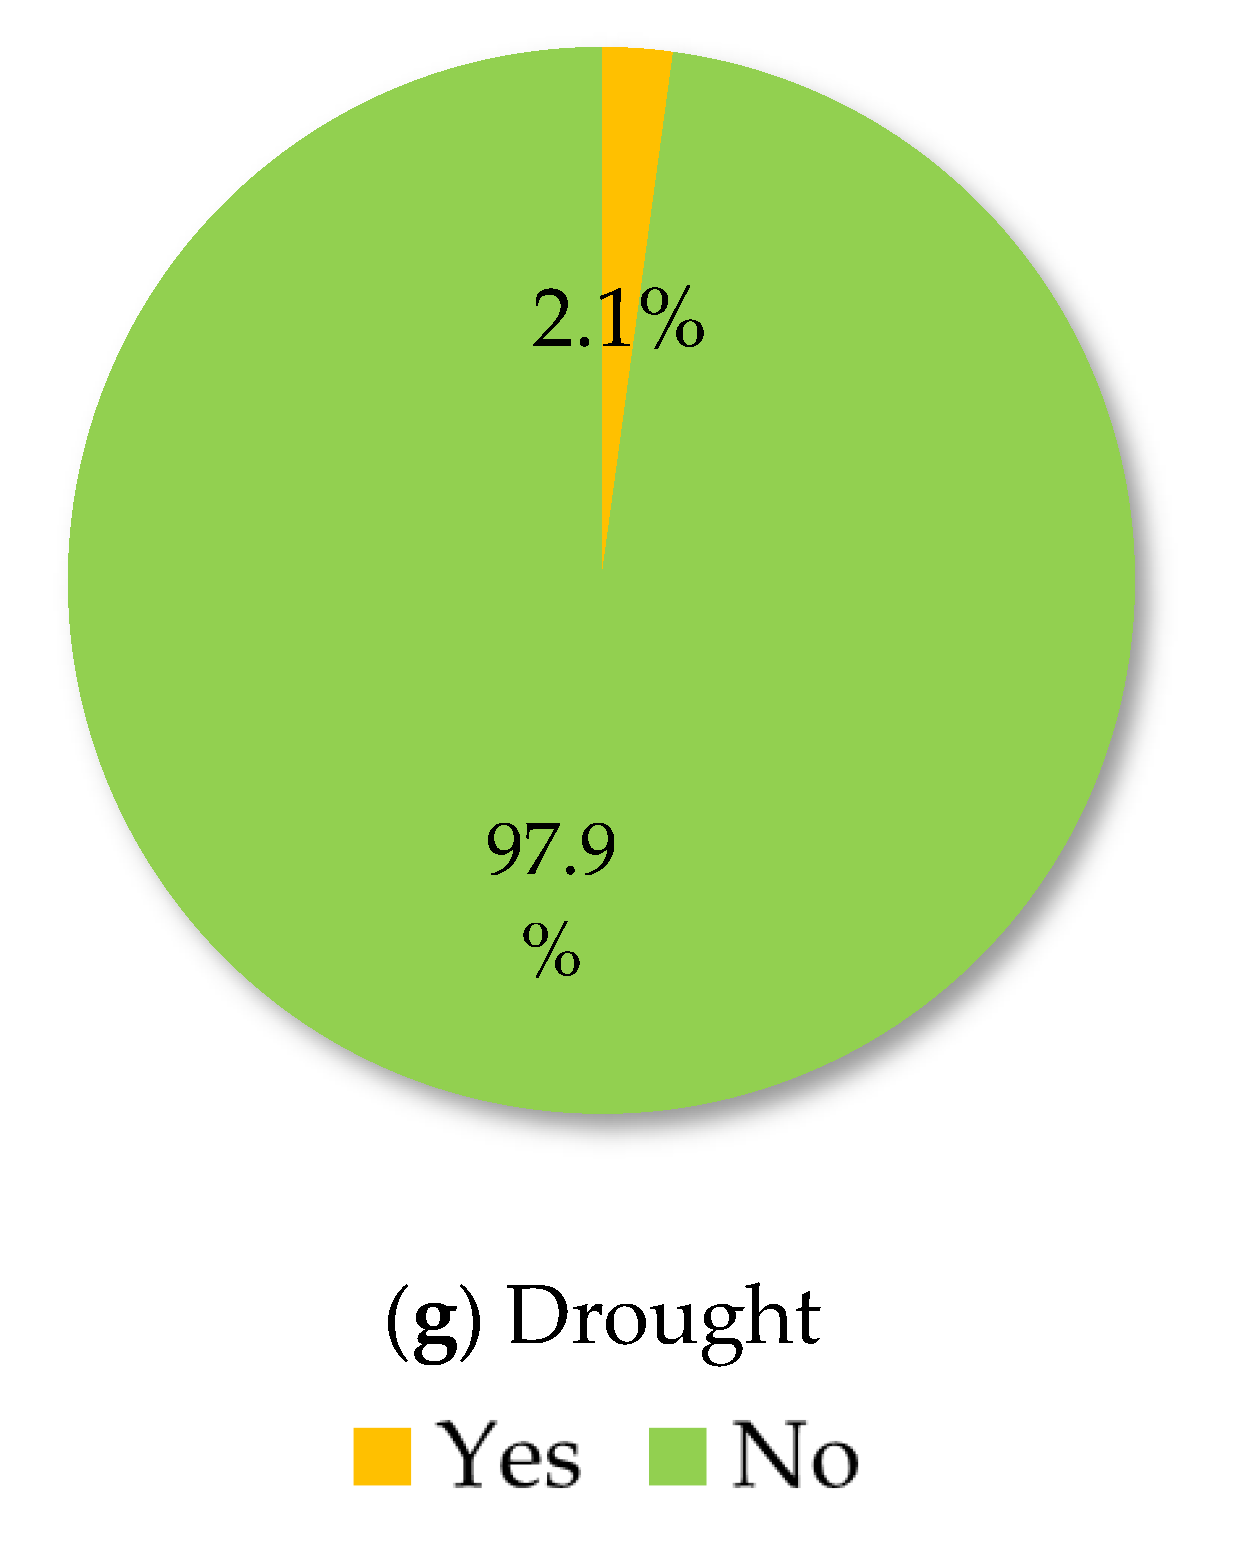
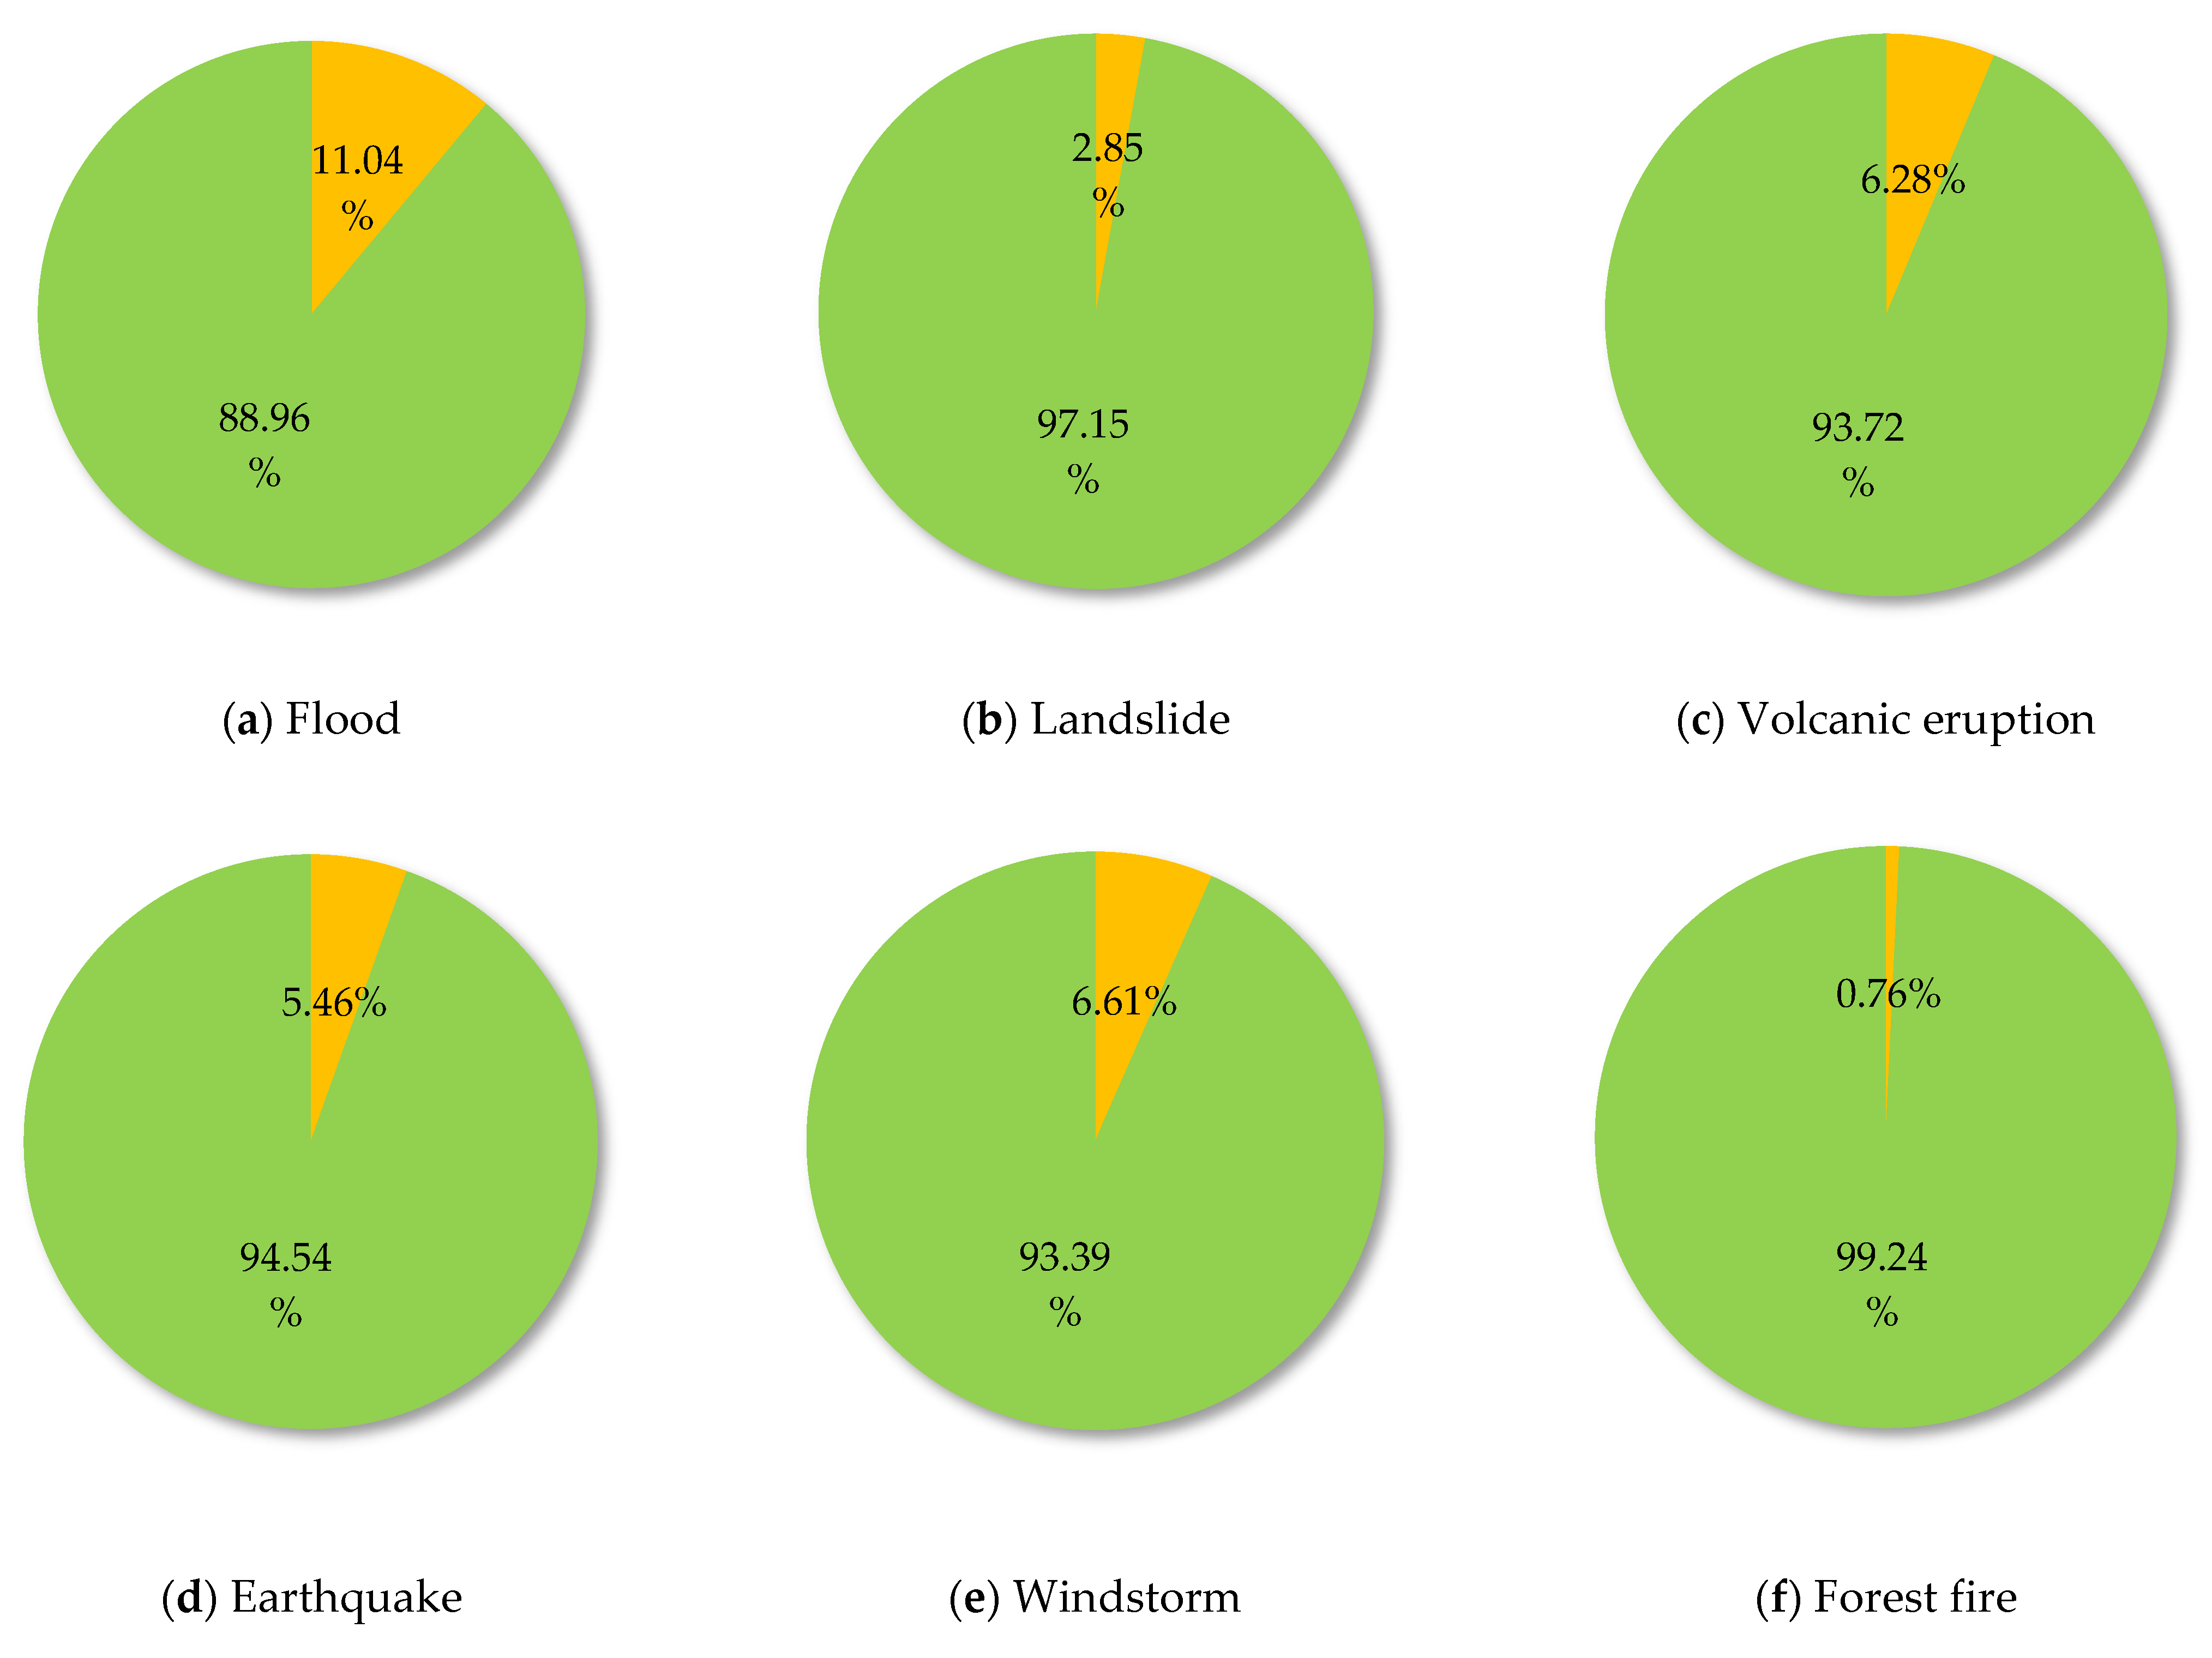
As we mentioned earlier, there were seven types of natural disaster that were reported by the respondents, namely flood, landslide, volcanic eruption, earthquake, windstorm, forest fire, and drought. Some respondents could have experienced several climate disasters. Figure 1 and Figure 2 present the percentage of climate disasters experienced by urban and rural residents respectively. In general, flood was the most common natural disaster experienced by rural and urban residents, followed by volcanic eruption, earthquake, drought, and windstorm. In contrast, the climate disasters that were experienced the least by the respondents were landslides and forest fires. Interestingly, based on urban and rural typology, relative with rural area, floods were climate disasters that occurred more frequently in urban areas. In fact, we found 22.5% of our respondents who live in urban areas have experienced flooding but only 11% for the rural respondents. Chen et al., 2015 claimed that rapid urbanization has a negative influence on urban hydrological systems, notably in terms of increasing the danger of urban floods and creating significant losses due to flooding. On the other hand, the most common disasters experienced by rural communities compared to cities are drought and landslides.
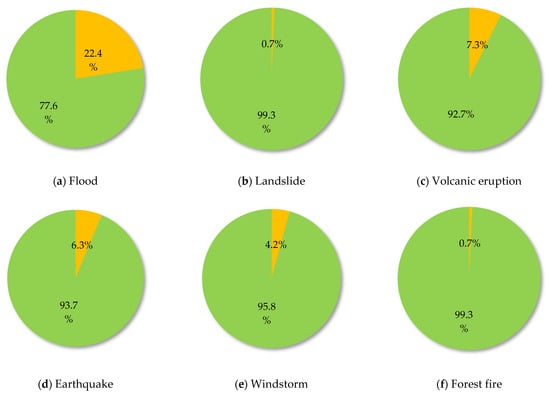
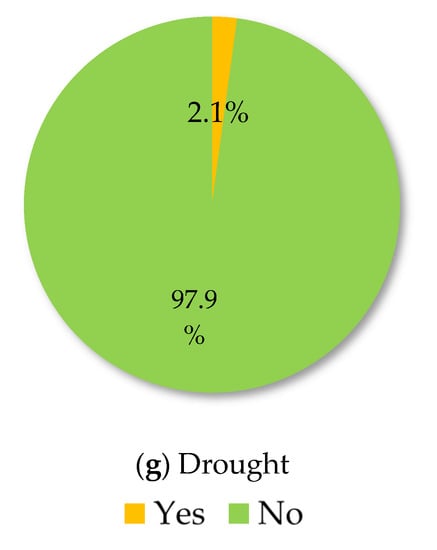
Figure 1.
Respondents’ experience of climate disasters in urban areas.

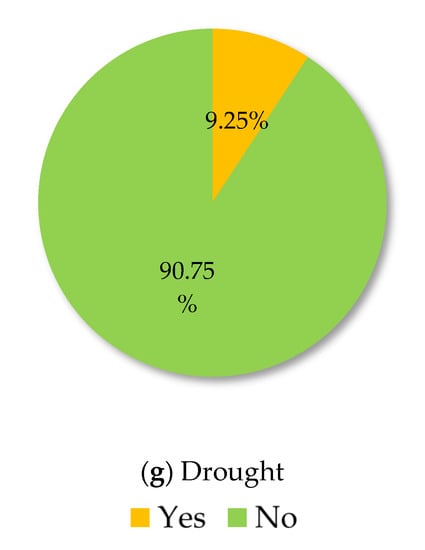
Figure 2.
Respondents’ experience of climate disasters in rural areas.
3.2. The Impact of Climate Disasters on Subjective Well-Being: A Pooled Model
The impact of climate disasters on subjective well-being indicators (happiness and life satisfaction) was estimated by an ordered probit model and presented in Table 3 specifically in the third row, column two for happiness, and column three for life satisfaction. The estimation result indicates that climate disasters have an insignificant effect on residents’ happiness, but it has a negative impact on life satisfaction with statistical significance at 5% level.
Table 3.
The impact of climate disasters on subjective well-being: pooled model.
Table 3 also presents the influence of the control variables on residents’ subjective well-being. Generally, the results show that subjective well-being is positively and significantly influenced by gender, marital status, health condition, income, and the ownership of a television, private vehicle, and financial savings, but it is negatively and significantly influenced by age. The older the person, the lower the happiness and life satisfaction levels are, consistent with a previous study about age and subjective well-being [33,34,35]. Female residents are associated with higher subjective well-being than male residents. The gender variable shows a negative and significant coefficient, which is different from the finding by Stevenson and Wolfers [36], stating that men tend to have higher happiness levels than women. However, Brereton et al. [37] and Fujita et al. [38] claimed that there is a negative association between men and subjective well-being. The inconsistency in the findings might be due to the different socio-economic conditions of research locations.
Marital status has a positive effect on happiness and is statistically significant at a 1% level, suggesting that marriage increases residents’ happiness level. Using national surveys, Stack and Eshleman [39] found a strong association between marital status and happiness, through increasing financial satisfaction and health status. Having a child under 15 significantly reduces life satisfaction. The main reason is that residents need time and effort to take care of their children, and they must juggle with other responsibilities. Meanwhile, the number of family members has a positive and significant impact on both subjective well-being indicators. This finding implies that residents with more family members are happier and more satisfied. According to Zhu et al. [40], the number of family members influences family functionality, which helps residents deal with stress better and offers them emotional and financial support, hence making them happier.
Self-reported health indicates positive coefficients on happiness and life satisfaction with statistical significance at a 1% level. This result suggests that better health conditions lead to higher happiness and life satisfaction levels. This finding is not surprising because health is essential to achieving well-being. For instance, being ill becomes a barrier for residents to fulfil their needs such as earning income and affording entertainment [41,42]. Income is positively associated with happiness and life satisfaction, statistically significant at a 1% level, suggesting that those with a higher income are generally happier and more satisfied with their lives. A study conducted by Sohn [43] investigating the determinant of happiness in Indonesia produces a similar finding, highlighting the positive effect of income on happiness. Mobile phone ownership increases subjective well-being significantly because it can connect residents. Television ownership also has a positive and significant effect on happiness and life satisfaction as it is a source of entertainment or information, including weather forecasts. Private vehicle ownership has a positive and significant coefficient on subjective well-being because it allows residents to be mobile and active. Lastly, the variable cut 1 to cut 4 given at the bottom of the empirical results of the ordered probit model illustrates where the latent variables are cut in order to create the three groups based on the ordinal value of our dependent variable, namely happiness and life satisfaction.
3.3. The Impact of Climate Disasters on Subjective Well-Being: An Urban and Rural Model
This section provides the impact of climate disasters on subjective well-being among urban and rural residents. The result is presented in Table 4 and Table 5 for urban and rural residents, specifically in the second rows. The results indicate that the climate disasters do not significantly affect urban residents’ happiness and life satisfaction. However, the results show a negative effect on happiness and life satisfaction among the rural residents with statistical significance at 10% and 5% for happiness and life satisfaction respectively. Furthermore, Table 4 and Table 5 also provide the influence of control variables on subjective well-being. The finding is similar to the pool model in Table 3. However, the interesting result is that education level is strongly associated with happiness and life satisfaction in urban areas. This is because, in urban areas, residents with higher levels of education are in a fiercer competition to get better jobs. In rural areas, education has no significant effect on subjective well-being. This is because most rural residents are farmers or fishers, so they do not necessarily reach a higher education level.
Table 4.
The impact of climate disasters on subjective well-being: urban model.
Table 5.
The impact of climate disasters on subjective well-being: rural model.
3.4. Disaggregate Analysis
Given the results of pool model and urban–rural model, only showing the homogenous estimates of climate disaster effect on residents’ subjective well-being, this study further investigates a disaggregate analysis to understand the heterogeneous effect of climate disaster by considering the household income level. Table 6 provides the empirical estimation for the happiness model; it was indicated that the climate disaster significantly and negatively impacted rural residents’ happiness at the middle income level (household income quantile 2) but not for residents at the household income tertile 1 and 3. For the urban residents, it has not significantly affected their happiness for all household income levels (household income quantile 1, 2, and 3). For the life satisfaction measure, it was negatively and significantly affected by climate disaster only at the lowest level (household income quantile 1) for both urban and rural model, and it did not significantly affected the households at the middle and highest income level (household income quantile 2 and 3).
Table 6.
Disaggregate analysis.
4. Discussion
This section begins by discussing the subjective well-being impact of climate disaster on Indonesian residents, specifically comparing the subjective impact of climate disaster between rural and urban residents. In general, this study revealed that climate disaster reduced overall life satisfaction of Indonesian residents. Residents who have experienced more climate disasters tend to have lower life satisfaction than those who have experienced fewer disasters. This is because life satisfaction is a long-term indicator of subjective well-being [20], influenced by infrastructure damages, the grief for death, income reduction, and health issues [15,16,17]. This finding is in line with previous studies that show a negative association between climate disasters and life satisfaction in Ukraine [44], Japan [45], and America [46], although these studies did not investigate the effect of climate disasters on specific groups such as urban and rural.
Furthermore, this study also makes the first attempt by investigating the different impact of climate disaster on subjective well-being among rural and urban residents. The finding indicated that climate related disasters do not play an essential role in urban residents’ subjective well-being. However, they significantly reduce rural residents’ subjective well-being, including their happiness and life satisfaction. This finding suggests that rural residents are more vulnerable to climate disasters. There are two tentative explanations. First, the infrastructure in the rural areas is not well developed, such as roads, electricity, and education facilities. Second, rural residents usually depend on natural resources as the primary source of their income, such as agriculture, livestock, forestry, and fisheries sectors. Hence, when these sectors are affected by climate disasters, most rural residents lose their income, and it is difficult to recover from the climate disaster’s damage. Meanwhile, urban residents have more stable jobs, so it is easier to recover from the climate disaster’s damage.
Research often attributes the increasing frequency of natural disasters to climate change [47,48]. These disasters are considered imminent threats to human life, causing infrastructure damage, losses in productive assets, death tolls, and casualties [49]. In Pakistan, for example, households lost their livelihoods because they depended on the agricultural sector, which was severely impacted by a flooding disaster since 2010 [12]. Empirical evidence from past research shows how climate disasters have caused many casualties. For example, heatwaves in 1981–2010 resulted in deaths by respiratory diseases in Europe [50]. In France, the heatwave in 2003 caused 70,000 deaths; this subsequently prompted the French authorities to establish the Health Watch Warning System [51]. Natural disasters like these cause not only physical health problems but also induce stress and anxiety [17]. This study confirms that climate disasters negatively impact subjective well-being in the long term, measured by perceived life satisfaction.
Identifying vulnerable people and locations at risk of natural disasters is still debatable in the international literature. Our study claims that natural disasters have a higher impact on rural (as opposed to urban) areas and low-income communities (Table 6). This may be caused by poor development plans in vulnerable areas such as the rural and remote areas, indicating that the losses and damages should not solely be attributed to climate change. Raju and da Costa [52] also claimed that ‘climate’ or ‘natural’ losses and casualties are also closely linked to vulnerability, which is often man-made through unplanned urbanization, structural inequality, and marginalization based on religion, caste, class, ethnicity, gender, or age. Vulnerability is thus a result of social and political processes, including poor governance. Raju et al. [53] also argue that blaming nature or climate change absolves people’s responsibility and could be treated as a political narrative. In other words, city administrations need to evaluate the social and physical vulnerabilities before drawing any conclusions as to what causes the severe losses and damages.
5. Conclusions
Based on the cross-sectional data from 7110 Indonesian residents with climate disaster experience, we used an ordered probit model to estimate the subjective well-being between urban and rural residents. In general, the finding indicates that climate disasters do not significantly affect happiness, but they negatively affect life satisfaction substantially. Interestingly, the disaggregate estimation from urban and rural residents shows that climate disasters do not significantly affect the urban residents. However, they significantly impact the rural residents. This result confirmed that residents living in rural areas are more vulnerable to climate disasters than residents in urban areas. We also found that subjective well-being is significantly influenced by gender, marital status, health condition, income, and possession of a television, private vehicle, and financial savings, and it is negatively and significantly influenced by age.
Given the strong impact of climate disasters on rural residents’ subjective well-being, this study suggests developing targeted climate disasters adaptation and mitigation policy, including developing resilient rural infrastructure, upskilling rural workers, and improving the education facility, including natural information warning systems so that residents can anticipate and mitigate the damage.
Author Contributions
Conceptualizations, methodology, and validation, M.S.R., N.D.A., M.S. and H.S.; investigation, resources, data curation M.S.R., N.D.A., A.M., R.O., J.T. and J.C.K., formal analysis, writing—original draft preparation, M.S.R., M.S., H.d.S., J.T., R.E.S. and Y.Y., writing—review and editing, M.S.R., H.S., A.M., R.O., J.C.K., H.d.S., M.P., J.T., R.E.S. and Y.Y. All authors have read and agreed to the published version of the manuscript.
Funding
This research received no external funding.
Institutional Review Board Statement
Not applicable.
Informed Consent Statement
Not applicable.
Data Availability Statement
The data of this study are available at http://www.rand.org/labor/FLS/IFLS.html (accessed on 2 November 2021).
Conflicts of Interest
The authors declare no conflict of interest.
References
- Rahman, M.; Toiba, H.; Huang, W.-C. The impact of climate change adaptation strategies on income and food security: Empirical evidence from small-scale fishers in Indonesia. Sustainability 2021, 13, 7905. [Google Scholar] [CrossRef]
- Melillo, J.M.; Richmond, T.; Yohe, G. Climate change impacts in the United States. Third Natl. Clim. Assess. 2014, 52. Available online: https://www.nrc.gov/docs/ML1412/ML14129A233.pdf (accessed on 19 January 2022).
- Fang, J.; Lau, C.K.M.; Lu, Z.; Wu, W.; Zhu, L. Natural disasters, climate change, and their impact on inclusive wealth in G20 countries. Environ. Sci. Pollut. Res. 2019, 26, 1455–1463. [Google Scholar] [CrossRef] [PubMed] [Green Version]
- Runkle, J.; Svendsen, E.R.; Hamann, M.; Kwok, R.K.; Pearce, J. Population health adaptation approaches to the increasing severity and frequency of weather-related disasters resulting from our changing climate: A literature review and application to Charleston, South Carolina. Curr. Environ. Health Rep. 2018, 5, 439–452. [Google Scholar] [CrossRef] [PubMed]
- Lenderink, G.; Van Meijgaard, E. Increase in hourly precipitation extremes beyond expectations from temperature changes. Nat. Geosci. 2008, 1, 511–514. [Google Scholar] [CrossRef]
- Taherkhani, M.; Vitousek, S.; Barnard, P.L.; Frazer, N.; Anderson, T.R.; Fletcher, C.H. Sea-level rise exponentially increases coastal flood frequency. Sci. Rep. 2020, 10, 6466. [Google Scholar] [CrossRef] [PubMed]
- Yulianto, S.; Apriyadi, R.K.; Aprilyanto, A.; Winugroho, T.; Ponangsera, I.S.; Wilopo, W. Histori Bencana dan Penanggulangannya di Indonesia Ditinjau Dari Perspektif Keamanan Nasional. PENDIPA J. Sci. Educ. 2021, 5, 180–187. [Google Scholar] [CrossRef]
- Knez, I.; Butler, A.; Sang, Å.O.; Ångman, E.; Sarlöv-Herlin, I.; Åkerskog, A. Before and after a natural disaster: Disruption in emotion component of place-identity and wellbeing. J. Environ. Psychol. 2018, 55, 11–17. [Google Scholar] [CrossRef]
- Dasgupta, S.; Laplante, B.; Murray, S.; Wheeler, D. Sea-Level Rise and Storm Surges: A Comparative Analysis of Impacts in Developing Countries; World Bank Policy Research Working Paper: Washington, DC, USA, 2009. [Google Scholar]
- Djalante, R.; Garschagen, M.; Thomalla, F.; Shaw, R. Disaster Risk Reduction in Indonesia; Springer: Fujisawa, Japan, 2017. [Google Scholar]
- Nguyen, M.-H.; Le, D.P.; Vo, T.T. Vulnerability to Natural Disaster and Welfare Effect: A Case Study of Flood Risk in Vietnam’s North Central Region. J. Asian Afr. Stud. 2021, 56, 1879–1898. [Google Scholar] [CrossRef]
- Ullah, F.; Shah, S.A.A.; Saqib, S.E.; Yaseen, M.; Haider, M.S. Households’ flood vulnerability and adaptation: Empirical evidence from mountainous regions of Pakistan. Int. J. Disaster Risk Reduct. 2021, 52, 101967. [Google Scholar] [CrossRef]
- Lamond, J.E.; Joseph, R.D.; Proverbs, D.G. An exploration of factors affecting the long term psychological impact and deterioration of mental health in flooded households. Environ. Res. 2015, 140, 325–334. [Google Scholar] [CrossRef] [Green Version]
- Prettenthaler, F.; Kortschak, D.; Hochrainer-Stigler, S.; Mechler, R.; Urban, H.; Steininger, K.W. Catastrophe management: Riverine flooding. In Economic Evaluation of Climate Change Impacts; Springer: Berlin/Heidelberg, Germany, 2015; pp. 349–366. [Google Scholar]
- Calvo, R.; Arcaya, M.; Baum, C.F.; Lowe, S.R.; Waters, M.C. Happily ever after? Pre-and-post disaster determinants of happiness among survivors of Hurricane Katrina. J. Happiness Stud. 2015, 16, 427–442. [Google Scholar] [CrossRef] [Green Version]
- Hamama-Raz, Y.; Palgi, Y.; Leshem, E.; Ben-Ezra, M.; Lavenda, O. Typhoon survivors’ subjective wellbeing—A different view of responses to natural disaster. PLoS ONE 2017, 12, e0184327. [Google Scholar] [CrossRef] [Green Version]
- Hudson, P.; Botzen, W.W.; Poussin, J.; Aerts, J.C. Impacts of flooding and flood preparedness on subjective well-being: A monetisation of the tangible and intangible impacts. J. Happiness Stud. 2019, 20, 665–682. [Google Scholar] [CrossRef]
- Rehdanz, K.; Welsch, H.; Narita, D.; Okubo, T. Well-being effects of a major natural disaster: The case of Fukushima. J. Econ. Behav. Organ. 2015, 116, 500–517. [Google Scholar] [CrossRef]
- Sam, A.S.; Kumar, R.; Kächele, H.; Müller, K. Vulnerabilities to flood hazards among rural households in India. Nat. Hazards 2017, 88, 1133–1153. [Google Scholar] [CrossRef]
- Zheng, H.; Ma, W. Click it and buy happiness: Does online shopping improve subjective well-being of rural residents in China? Appl. Econ. 2021, 53, 4192–4206. [Google Scholar] [CrossRef]
- Lohmann, P.; Pondorfer, A.; Rehdanz, K. Natural hazards and well-being in a small-scale island society. Ecol. Econ. 2019, 159, 344–353. [Google Scholar] [CrossRef]
- Tiefenbach, T.; Kohlbacher, F. Disasters, donations, and tax law changes: Disentangling effects on subjective well-being by exploiting a natural experiment. J. Econ. Psychol. 2015, 50, 94–112. [Google Scholar] [CrossRef]
- Conceição, P.; Bandura, R. Measuring Subjective Well Being; Office of Development Studies, United Nations Development Programme (UNDP): New York, NY, USA, 2008. [Google Scholar]
- Easterlin, R.A. Does economic growth improve the human lot? Some empirical evidence. In Nations and Households in Economic Growth; Elsevier: Amsterdam, The Netherlands, 1974; pp. 89–125. [Google Scholar]
- Sujarwoto, S. Does Happiness Pays? A Longitudinal Family Life Survey. Appl. Res. Qual. Life 2021, 16, 679–701. [Google Scholar] [CrossRef]
- Zhu, Z.; Ma, W.; Leng, C.; Nie, P. The relationship between happiness and consumption expenditure: Evidence from rural China. Appl. Res. Qual. Life 2021, 16, 1587–1611. [Google Scholar] [CrossRef]
- Dominko, M.; Verbič, M. The economics of subjective well-being: A bibliometric analysis. J. Happiness Stud. 2019, 20, 1973–1994. [Google Scholar] [CrossRef]
- Stutzer, A.; Frey, B.S. Reported Subjective Well-Being: A Challenge for Economic Theory and Economic Policy; CREMA Working Paper: Amsterdam, The Netherlands, 2003. [Google Scholar]
- Cheng, G.; He, S.; He, Q.; Xie, X.; Tian, G.; Jiang, N.; Li, C.; Min, X.; Li, R.; Shi, Y. Gender and residence differences in the association between social support and subjective well-being among Chinese oldest-old: A national longitudinal study. Arch. Gerontol. Geriatr. 2022, 98, 104545. [Google Scholar] [CrossRef]
- Diener, E.; Lucas, R.E.; Oishi, S. Subjective well-being: The science of happiness and life satisfaction. Handb. Posit. Psychol. 2002, 2, 63–73. [Google Scholar]
- Diener, E.; Suh, E.M.; Lucas, R.E.; Smith, H.L. Subjective well-being: Three decades of progress. Psychol. Bull. 1999, 125, 276. [Google Scholar] [CrossRef]
- Nie, P.; Ma, W.; Sousa-Poza, A. The relationship between smartphone use and subjective well-being in rural China. Electron. Commer. Res. 2021, 21, 983–1009. [Google Scholar] [CrossRef]
- Anna, Z.; Yusuf, A.A.; Alisjahbana, A.S.; Ghina, A.A. Are fishermen happier? Evidence from a large-scale subjective well-being survey in a lower-middle-income country. Mar. Policy 2019, 106, 103559. [Google Scholar] [CrossRef]
- Knight, J.; Lina, S.; Gunatilaka, R. Subjective well-being and its determinants in rural China. China Econ. Rev. 2009, 20, 635–649. [Google Scholar] [CrossRef] [Green Version]
- Ngamaba, K.H. Determinants of subjective well-being in representative samples of nations. Eur. J. Public Health 2017, 27, 377–382. [Google Scholar] [CrossRef] [Green Version]
- Stevenson, B.; Wolfers, J. Subjective well-being and income: Is there any evidence of satiation? Am. Econ. Rev. 2013, 103, 598–604. [Google Scholar] [CrossRef] [Green Version]
- Brereton, F.; Clinch, J.P.; Ferreira, S. Happiness, geography and the environment. Ecol. Econ. 2008, 65, 386–396. [Google Scholar] [CrossRef]
- Fujita, F.; Diener, E.; Sandvik, E. Gender differences in negative affect and well-being: The case for emotional intensity. J. Personal. Soc. Psychol. 1991, 61, 427. [Google Scholar] [CrossRef]
- Stack, S.; Eshleman, J.R. Marital status and happiness: A 17-nation study. J. Marriage Fam. 1998, 60, 527–536. [Google Scholar] [CrossRef]
- Zhu, Z.; Ma, W.; Leng, C. ICT adoption, individual income and psychological health of rural farmers in China. Appl. Res. Qual. Life 2020, 17, 71–91. [Google Scholar] [CrossRef]
- Binder, M.; Coad, A. “I’m afraid I have bad news for you…” Estimating the impact of different health impairments on subjective well-being. Soc. Sci. Med. 2013, 87, 155–167. [Google Scholar] [CrossRef] [Green Version]
- Carrieri, V. Social Comparison and Subjective Well-Being: Does the Health of Others Matter? Bull. Econ. Res. 2012, 64, 31–55. [Google Scholar] [CrossRef] [Green Version]
- Sohn, K. Height and happiness in a developing country. J. Happiness Stud. 2016, 17, 1–23. [Google Scholar] [CrossRef]
- Danzer, A.M.; Danzer, N. The long-run consequences of Chernobyl: Evidence on subjective well-being, mental health and welfare. J. Public Econ. 2016, 135, 47–60. [Google Scholar] [CrossRef]
- Hommerich, C. Trust and subjective well-being after the great east Japan earthquake, tsunami and nuclear meltdown: Preliminary results. Int. J. Jpn. Sociol. 2012, 21, 46–64. [Google Scholar] [CrossRef]
- Berlemann, M.; Eurich, M. Natural hazard risk and life satisfaction–Empirical evidence for hurricanes. Ecol. Econ. 2021, 190, 107194. [Google Scholar] [CrossRef]
- Bowen, K.J.; Ebi, K.L. Health risks of climate change in the World Health Organization South-East Asia region. WHO South-East Asia J. Public Health 2017, 6, 3–8. [Google Scholar] [CrossRef] [PubMed] [Green Version]
- Schiermeier, Q. Disaster toll tallied. Nature 2012, 481, 124–125. [Google Scholar] [CrossRef] [PubMed] [Green Version]
- Lazzaroni, S.; van Bergeijk, P.A. Natural disasters’ impact, factors of resilience and development: A meta-analysis of the macroeconomic literature. Ecol. Econ. 2014, 107, 333–346. [Google Scholar] [CrossRef] [Green Version]
- Åström, C.; Orru, H.; Rocklöv, J.; Strandberg, G.; Ebi, K.L.; Forsberg, B. Heat-related respiratory hospital admissions in Europe in a changing climate: A health impact assessment. BMJ Open 2013, 3, e001842. [Google Scholar] [CrossRef] [PubMed] [Green Version]
- Pascal, M.; Sweeney, J.; Cullen, E.; Schwartz, J.; Goodman, P. Heatwaves and mortality in Ireland, planning for the future. Irish Geogr. 2013, 46, 203–211. [Google Scholar] [CrossRef]
- Raju, E.; da Costa, K. Governance in the Sendai: A way ahead? Disaster Prev. Manag. Int. J. 2018, 27, 278–291. [Google Scholar] [CrossRef]
- Raju, E.; Boyd, E.; Otto, F. Stop blaming the climate for disasters. Commun. Earth Environ. 2022, 3, 1. [Google Scholar] [CrossRef]

Publisher’s Note: MDPI stays neutral with regard to jurisdictional claims in published maps and institutional affiliations. |
© 2022 by the authors. Licensee MDPI, Basel, Switzerland. This article is an open access article distributed under the terms and conditions of the Creative Commons Attribution (CC BY) license (https://creativecommons.org/licenses/by/4.0/).