Article

Comparative Analysis on Dehumidification Performance of KCOOH–LiCl Hybrid Liquid Desiccant Air-Conditioning System: An Energy-Saving Approach

1
Department of Mechanical Engineering, Maulana Azad National Institute of Technology, Bhopal 462003, Madhya Pradesh, India
2
School of Mechanical Engineering, Vellore Institute of Technology, Vellore 632014, Tamil Nadu, India
3
Department of Mechanical Engineering, College of Engineering, King Khalid University, P.O. Box 394, Abha 61421, Saudi Arabia
4
Department of Engineering Management, College of Engineering, Prince Sultan University, P.O. Box 66833, Riyadh 11586, Saudi Arabia
*
Author to whom correspondence should be addressed.
Sustainability 2022, 14(6), 3441; https://doi.org/10.3390/su14063441
Submission received: 27 January 2022 / Revised: 9 February 2022 / Accepted: 11 February 2022 / Published: 16 March 2022

Abstract

:
Conventional air conditioners (AC) operate on vapor compression refrigeration (VCR) technology, which is a heavy consumer of electricity, and the used refrigerants harm the environment. In humid and hot areas, a liquid desiccant AC system integrated with a VCR system has been proposed as a better alternative to traditional standalone VCR system, as it is an energy-efficient system that can remove latent air load, air pollutants from the processed air, and it is energy-saving. In this study, a hybrid liquid desiccant air conditioning (LDAC) system with a capacity of 5.5 kW was designed and developed by integrating these two different technologies, and the vapor pressure of potassium formate (KCOOH) solution at different solution temperatures and concentrations were monitored experimentally to determine the optimal concentration range. Moreover, a comparative study was conducted to analyze the dehumidification performance of lithium chloride (LiCl) and KCOOH solutions. Experiments are designed by using Minitab 19 software, which employs the design of an experimental technique through full factorial design by considering four variables, namely, type of desiccant, inlet air flow rate, inlet desiccant temperature, and inlet air humidity. To study and compare dehumidification characteristics of both solutions, three responses were considered, i.e., the coefficient of performance of a hybrid system, the heat load of dehumidifier, and specific humidity change. Experimental results revealed that 70% of KCOOH solution exhibited comparable vapor pressure to that of 36% LiCl solution. Additionally, the dehumidification ability of the KCOOH solution was better than that of the LiCl solutions.

1. Introduction

Humans spend nearly 90% of their lifetime in buildings, so it is essential to provide occupants with acceptable indoor environmental conditions. There are several evaluation factors for interior environments, where the indoor temperature and humidity level are the two most critical parameters [1]. The VCR systems consume the majority of power during the peak summer hours of daylight, particularly in regions with hot and humid climates. Globally, ACs based on a VCR system control the indoor building’s environment by removing sensible and latent loads. According to the Brookings India study, the consumption of energy by the AC from total business power consumption will grow from 50% currently to 75% by 2030 [2,3]. As a result, it was criticized for its poor humidity management and high reliance on electricity [4,5]. The same report forecasts that by 2030 the share of power usage for household comfort will rise from present day 7% to 45%. In the past few years, the concept of LDAC has proven to be a more viable alternative to standalone VCR systems as the latent heat load is governed by environmentally friendly liquid desiccant dehumidification technology, which is hygroscopic and can employ renewable energy [6]. In past experiments, various forms of renewable energy have been used to power the LDAC system. LDAC system technology markedly attracted researchers because (a) renewable or waste heat can be employed to regenerate the desiccant solution, (b) the desiccant can be used as heat exchanging media, as it can be precooled or preheated in the cooling system, (c) the dehumidification performance of LDAC system is very good, and (d) microbial contamination, as bacteria can be resisted [7].
In an LDAC system, the liquid desiccant solution circulates to provide a dehumidification process through a dehumidifier, which is the primary component of the LDAC system and is responsible for air dehumidification. The dehumidifier of the LDAC system contains a high concentration and low-temperature desiccant solution that has low vapor pressure in comparison to the partial pressure of water vapor in atmospheric air [8,9]. As a result, the absorption of water vapor from the air could be accomplished via a positive pressure gradient. However, when water vapor is absorbed by the liquid desiccant solution, its concentration drops, and for it to reuse it, it requires the regeneration process that is conducted by the regenerator of the LDAC system. The regeneration process of liquid desiccant requires high vapor pressure and temperature conditions. Generally, the regeneration temperature of liquid desiccant is around 70 °C, which can be obtained through the use of sources of renewable energy such as biomass, geothermal, and solar energy. Moreover, the regeneration process occurs when water vapor evaporates into the ambient air by creating a positive vapor pressure gradient between desiccant solution and atmospheric air. There are several properties of liquid desiccant that are critically required to effectively perform its function, including vapor pressure [8,9,10]. Other characteristics such as nonvolatility, high chemical stability, nontoxicity, odorlessness, and low viscosity are also significant.
Various renewable energy types and waste heat are prominently employed for the regeneration of processed air in LDAC systems, leading to higher energy savings over those of conventional VCR systems [11,12,13,14]. Bourdoukan et al. [15] examined a desiccant air-handling system driven by a vacuum tube collector, demonstrating the use of solar vacuum collectors in desiccant colling technologies. Liang et al. [16] used geothermal energy incorporated with an LDAC system to improve the performance efficiency and cooling ability of the desiccant cooling system. The LDAC system can be effectively integrated with other cooling technologies to enhance performance. Khalil [17] observed a COP of 3.8 while using a hybrid system being driven by LiCl as desiccant and R-134 as the refrigerant. The overall cooling capacity of a system was increased from 0.75 tons of refrigeration (TR) to 1.75 TR due to the integration of the VCR unit. The experimental findings and theoretical simulation proposed by Yamaguchi et al. [18] reported a COPsys and COPhp of 2.7 and 3.8 of hybrid LDAC in which processed air was dehumidified from 14 and 8.1 g/kg and was cooled from 30 to 22.1 °C.
Triethylene glycol (TEG) was used as a liquid desiccant in the LDAC system, as various studies were carried out [19,20,21,22]. Elsarrag et al. [23] created a mathematical model to estimate the dehumidification effectiveness of a packed bed dehumidifier using TEG. The model’s simulation results were consistent with those obtained experimentally. The TEG solution concentration had to be between 90% and 98% to obtain the necessary dehumidification efficiency [24]. Consequently, the viscosity of TEG was extremely high, which led to higher power consumption and the unstable operation of the system [25]. Thus, TEG is an unpredictable liquid desiccant that potentially threatens the health of residents. Therefore, many researchers introduced different saline solutions such as calcium chloride (CaCl2), lithium bromide (LiBr), LiCl, and KCOOH as alternative liquid desiccants. These are nonvolatile as compared to TEG, and have lower viscosity and vapor pressure. Due to the crystallization tendency of CaCl2, the solution of LiCl and LiBr is highly favorable for liquid dehumidification. Numerous studies were conducted to determine their thermal characteristics and dehumidification effectiveness [26,27,28]. The empirical correlations were developed by Conde [26] to predict the thermal properties such as density, surface tension, vapor pressure, and heat capacity with acceptable deviations. Kaita et al. [29] and Patek et al. [30] examined the thermal characteristics of LiBr and developed high-accuracy empirical correlations. The efficiency of the LDAC system can be enhanced by utilizing the external cooling source for the internal cooling of the dehumidifier [31,32,33], which would enhance dehumidification efficiency by lowering the temperature of the desiccant solution. However, as a result of the salty liquid desiccant, substantial deterioration, or erosion of the metal of the dehumidifier occurs, as witnessed in many technical applications. Hence, several researchers are working to provide better replacements for saline desiccant solutions or dehumidifier materials. M. R. H. Abdel-Salam et al. [32,34] developed a three-fluid intrinsic cooled dehumidifier using lightweight and high-strength titanium tubes to obtain a better elasticity modulus, enough heat conductivity, good corrosion resistance, and light weight. However, for the liquid desiccant, lithium nitrate (LiNO3) has emerged as a better alternative. Luo et al. [35] suggested that LiNO3 has satisfactory vapor pressure and is less prone to corrosion as compared to the LiBr solution. Various standard liquid desiccants were proposed by Abdel-Salam et al. [36] such as formaldehyde, toluene, NOx, and SOx. The KCOOH solution emerged as an alternative desiccant among all liquid desiccants because of its lower corrosion affinity, lower cost, and better environmental friendliness. Wang et al. [37] examined the mass and heat transfer of a counter-flow packed dehumidifier employing KCOOH solution in a hot and humid environment, and discovered that the liquid–air flow rate ratio had a greater effect on desiccant temperature and concentration. Absorption and desorption experiments were performed by Riffat et al. [38] consisting of an LiBr and KCOOH solution, and findings indicated that the rate of absorption of KCOOH solution was about 5% less than that of the LiBr solution; in the desorption process, the opposite trends were found. Results indicated 9.6%–15.1% energy savings.
In view of the literature [33,34,35,36,37,38,39,40,41], many aspects of the KCOOH desiccant solution still need to be addressed by researchers. Experimental data on the vapor pressure of KCOOH are unique but were insufficient in the previous investigations, even though vapor pressure is the most crucial thermal property of liquid desiccants. To address the aforementioned research discrepancy, one of the objectives of this study was to collect novel experimental data on the vapor pressure of KCOOH solutions at different temperatures and concentration ranges. A literature review confirmed that hybridization of the LDAS system and the conventional VCR system can improve overall performance; hence, this structural merger leads towards energy conservation. The novelty of this work is in collecting experimental data on the vapor pressure of KCOOH solution, which are unique and important for the research. Additionally, the dehumidification performance of the KCOOH was analyzed and compared to the LiCl using the full factorial DOE technique for the first time to analyze and optimize influencing variables of dehumidification.

2. Experimental Description

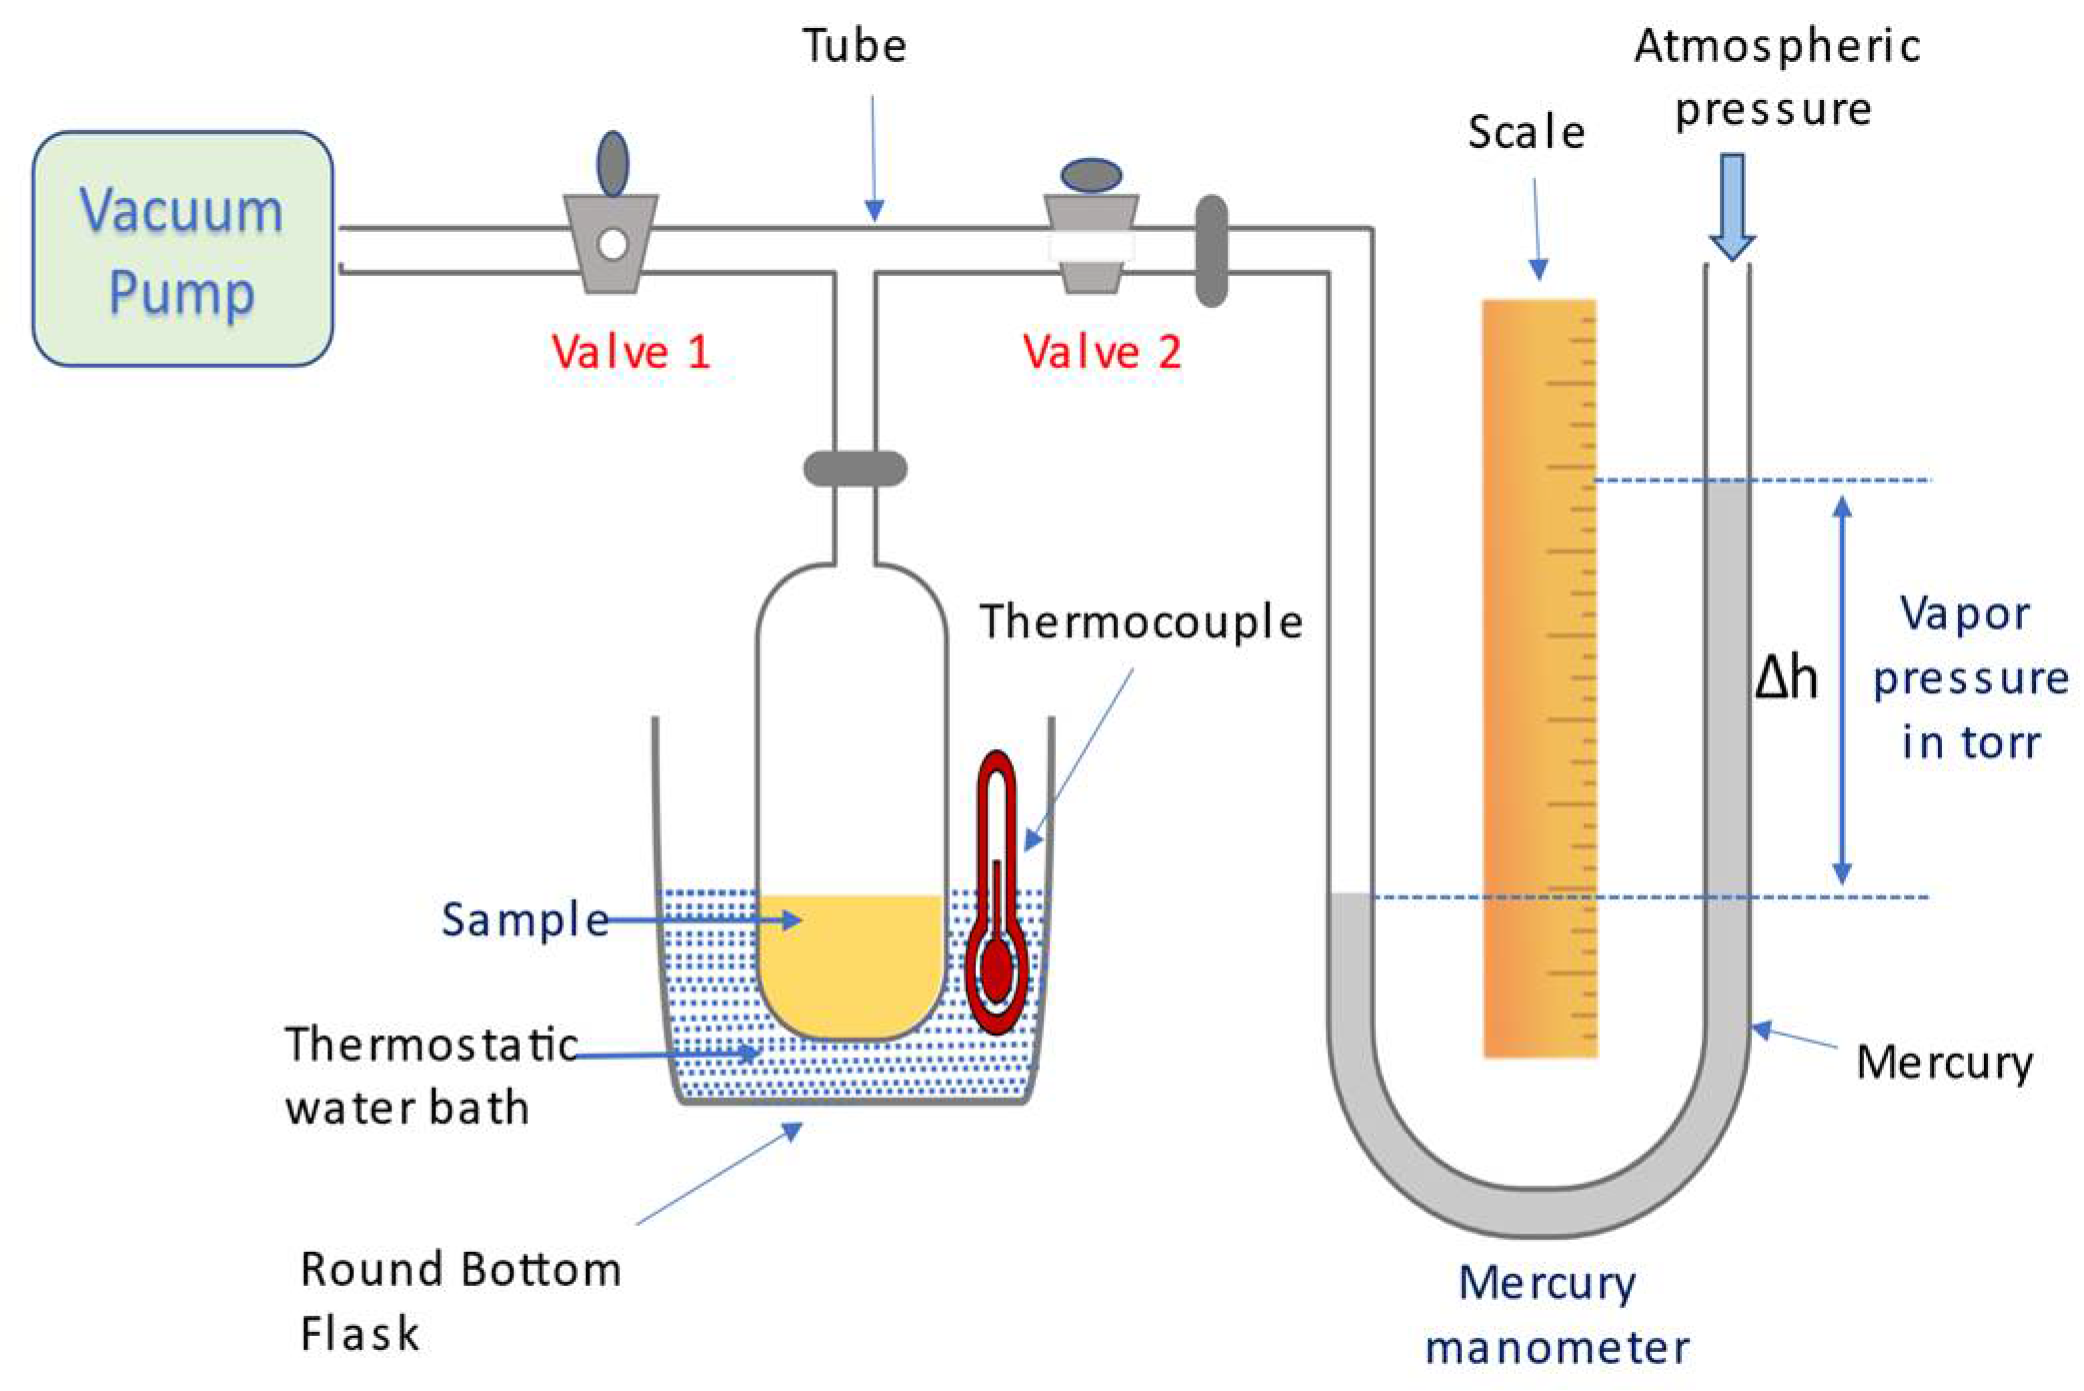
2.1. Manometric Method of Vapor Pressure Measurement

The equipment used to determine the static vapor pressure of KCOOH solutions is depicted in Figure 1. The manometric technique was chosen to determine the static vapor pressure of the KCOOH solution due to its greater accuracy than that of other methods. The flask was submerged in a thermostatic water bath regulated by a Lauda Thermostat UB20 (±0.01 K) and a thermometer. The flask was fitted with a tube having two ends: one end was connected to the vacuum pump to create the vacuum inside the chamber, and the other to the manometer to measure the vapor pressure. The solutions were synthesized with the use of a Mettler AE200 balance with 1 mg resolution. A sample of KCOOH solution whose pressure to be measured was stored in a round bottom flask, and the liquid was frozen with the use of frozen liquid. The frozen liquid was melted to release entrapped air in the liquid. The above-mentioned process was repeated till almost all the air was removed. Then, the liquid was warmed in the thermostat at the required temperature and valve 1 was closed and valve 2 was opened. The difference in the heights of Hg (mercury) columns in the manometer’s two limbs had indicated the vapor pressure of the solution.
The vapor pressure of distilled water was computed and compared between 20 and 47 °C using the reference values from Table 1. Vapor pressure increased from 2289 to 10,489 Pa at this temperature range. The mean absolute relative deviation ( M D ) was around 1.23%, as shown in Equation (1). The lower values of MARD demonstrated the reliability of the experimentally obtained results. P R   and P E denote reference and experimental values, respectively.
M D = 1 N i = 1 N | P R P E P E |
The difference in vapor pressure between solution and processed air is the primary driving force for the mass transfer of vapors. Generally, KCOOH solutions with a high concentration have low vapor pressure, resulting in increased dehumidification performance. However, a higher concentration is not recommended because vapor pressure, which is the main driving force for the regeneration, is controlled by the concentration range of the desiccant solution. Thus, a balance between the performance of dehumidification/regeneration and the concentration of liquid desiccant is required [36]. The concentration range of 32% to 38% LiCl solution was chosen for the study on the basis of a review of the literature [37,38,39]. The matching vapor pressure range was computed to obtain an approximate range of KCOOH solution concentrations. By monitoring the vapor pressure of a LiCl solution with concentrations varying from 32% to 38%, the approximate concentration and vapor pressure of the KCOOH solutions were determined. The final values of the KCOOH solution’s mass concentration were observed to range from 63% to 74% when subjected to the temperature range of 20 to 40 °C. Figure 2 depicts variation in the vapor pressure of LiCl and KCOOH solutions with respect to temperature. It is self-evident that, when there was a decrease in solution concentration and an increase in the temperature of the solution, the vapor pressure of the solution rose.
As shown in Figure 3, the vapor pressure of 70% KCOOH and 36% LiCl solutions rose from 699 to 2151 Pa and 651 to 2283 Pa, respectively, when the temperature increased from 20 to 40 °C. Consequently, at the given temperature range, the vapor pressure of these two liquids was the same, which accounted for the driving force for the dehumidification performance [40,41]. The performance of two liquids was compared in the following experiments.

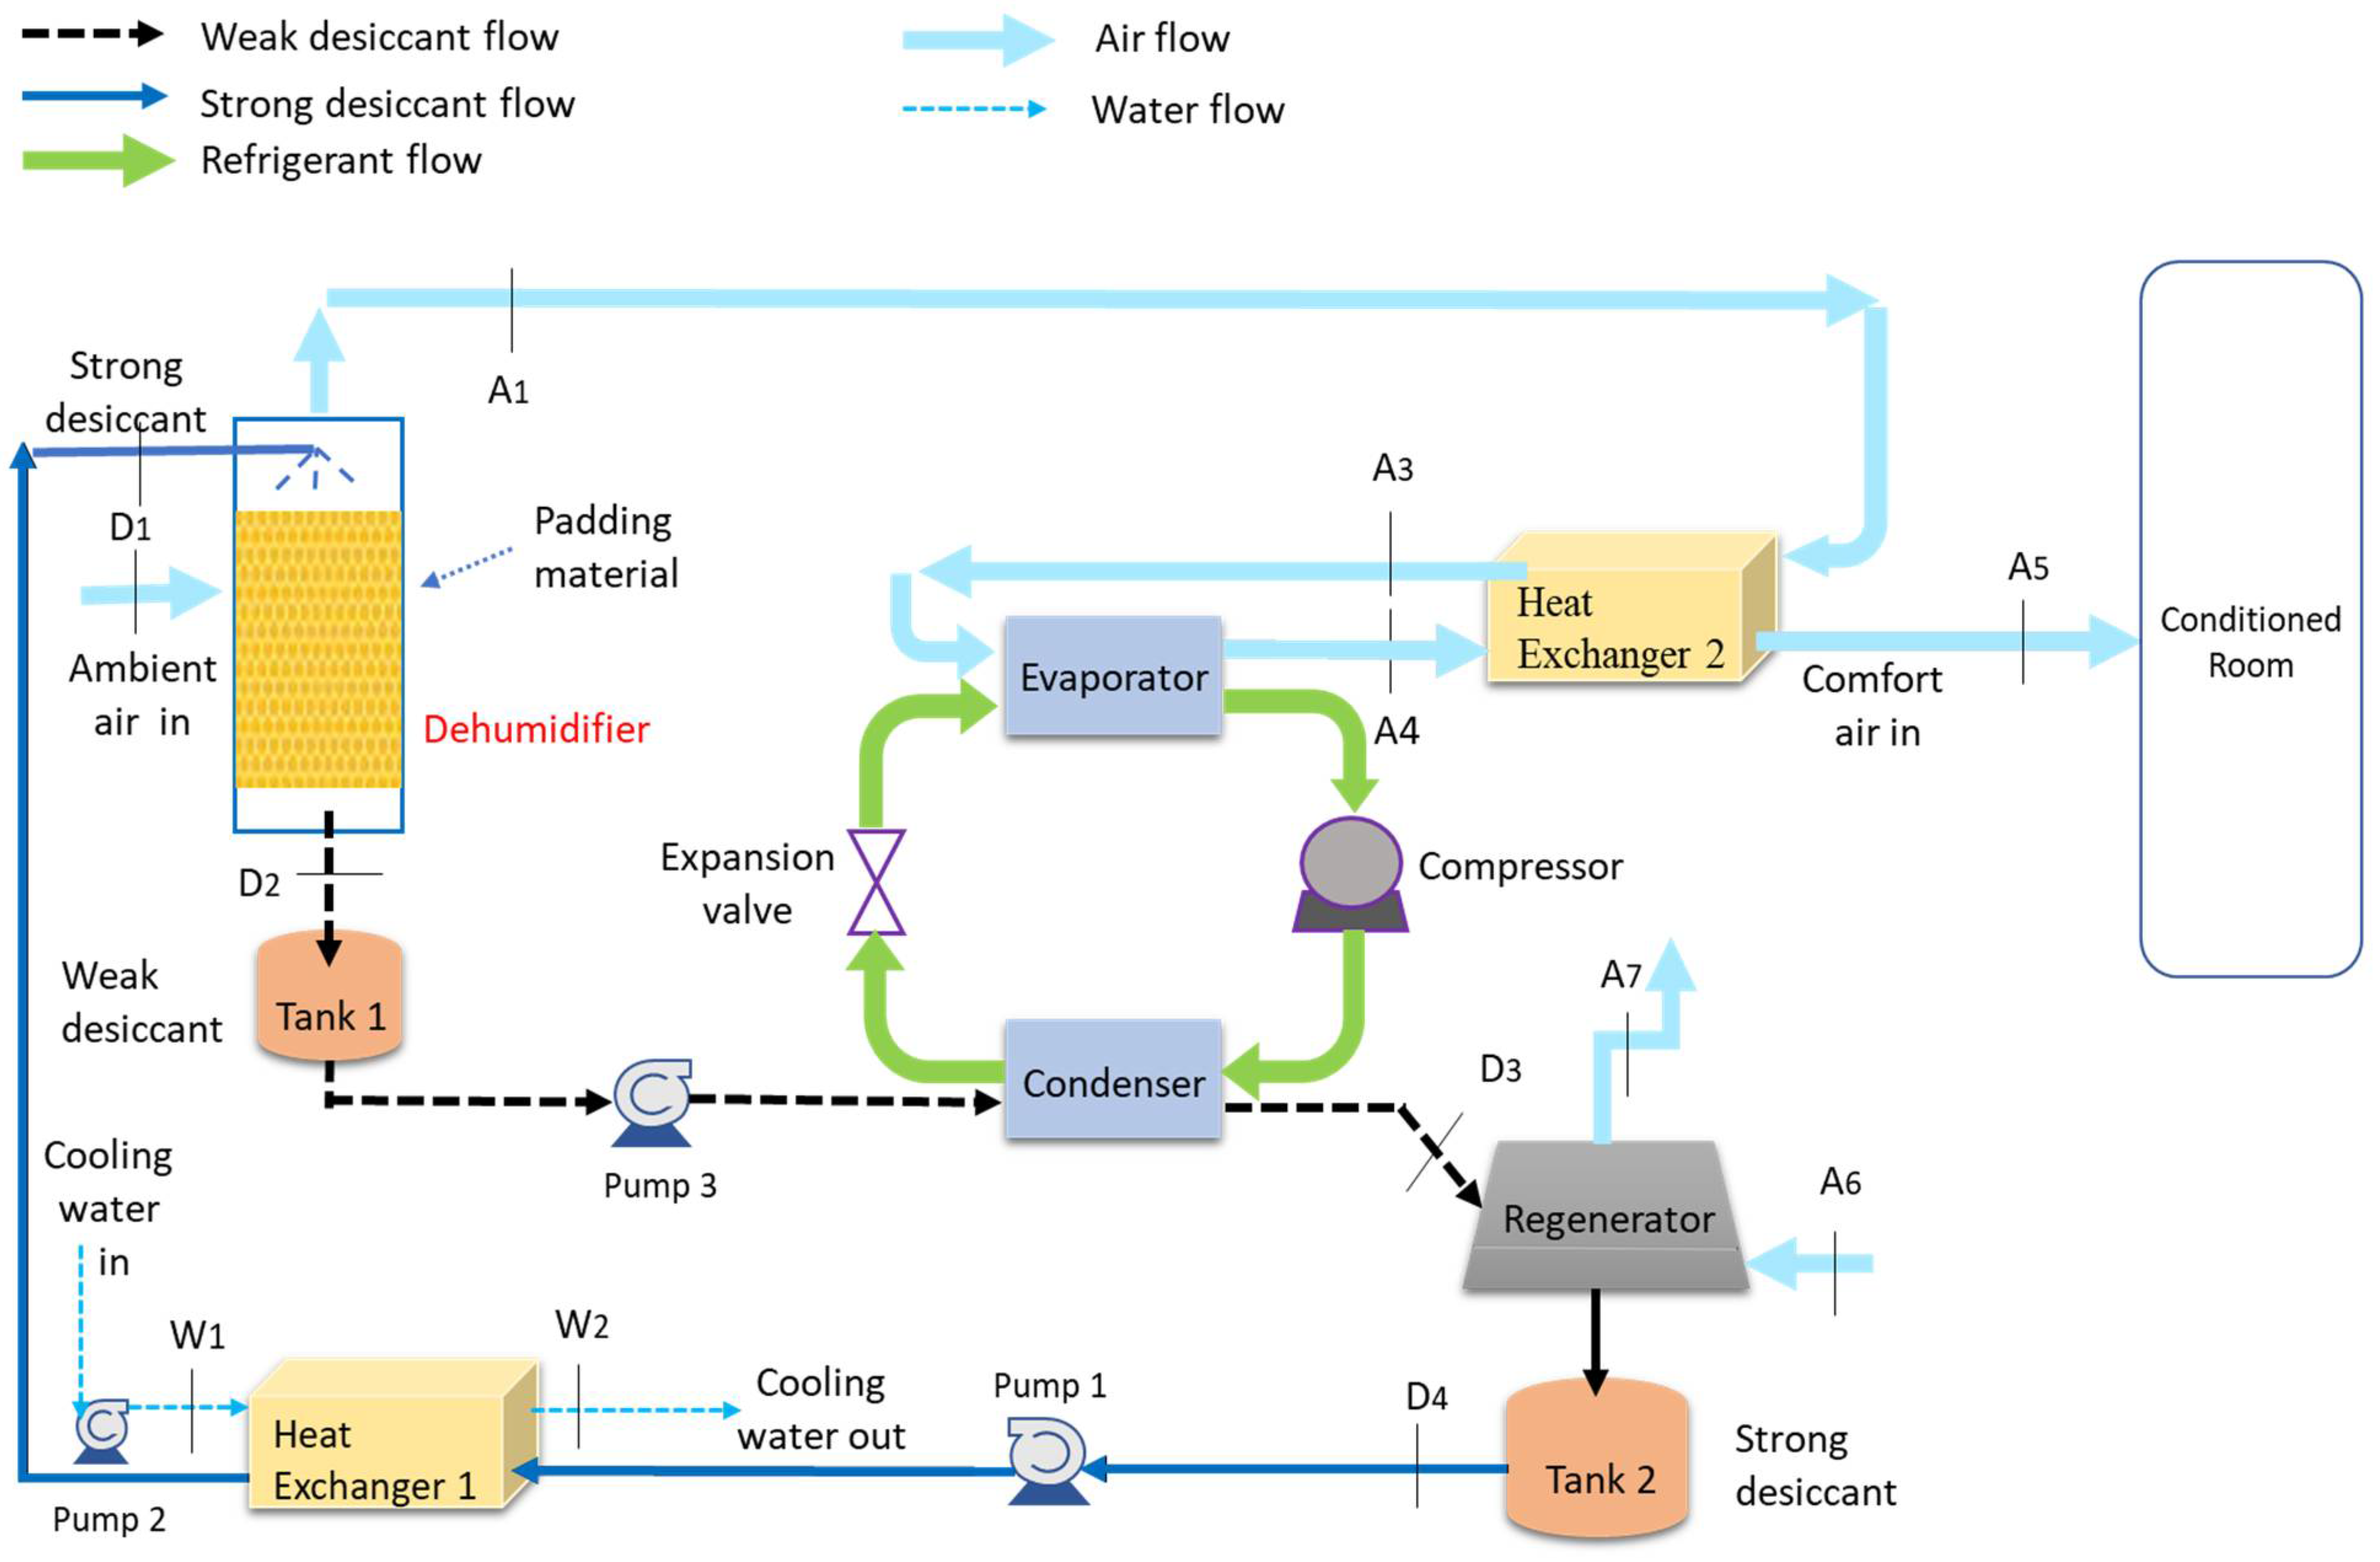
2.2. Experimental Setup of Hybrid LDAC System

Figure 4 depicts a hybrid LDAC system integrated with a VCR system comprising two cycles, the refrigerant and liquid desiccant cycles. The refrigerant cycle was powered by a VCR system that utilized R134a as the refrigerant, a fin, a closed compressor (1-TR), evaporator, tube condenser, capillary tube, and expansion valve. The whole system was wrapped in neoprene foam to avoid heat loss between the system and surroundings. The dehumidifier was built of plexiglass (transparent) material and had a rectangular cross-section of 1000 × 400 × 400 mm with a packed-bed and counter-flow type. The brown honeycomb sheets were utilized as packing material in the dehumidifier with the same dimensions to fulfill the purpose of humid air dehumidification. The dimensions of the packing material were 400 × 400 × 400 mm.
First, inlet hot and humid air (A1) enters the dehumidifier section where vapor from the air is absorbed to lower the temperature and humidity of the processed air. The difference in vapor pressure between two interacting liquids causes the mass transfer of vapors. Air-to-air heat recovery heat exchanger 2 transfers heat from the air to the cold air from the evaporator and precools the air that departed from the dehumidifier exit (A2). Moreover, this precooled air enters the evaporator (A3) to remove leftover latent and sensible heat from the processed air by lowering the air temperature below the dew point. Exit air (A4) from the evaporator, which is at dew point temperature, is heated to comfort state condition (A5) by heat exchanger 2 through heat recovery. Therefore, the load on the compressor is reduced, and by employing heat exchanger 2, the requirement of the heater is eliminated from A4 to A5.
The liquid desiccant (D1), which is at low temperature and high concentration, is sprayed in the dehumidifier section of the liquid desiccant cycle, which absorbs the water vapor from the air. Afterwards, this strong desiccant solution becomes weak due to the dehumidification process in which the absorbing capacity of the desiccant is reduced. This weak desiccant solution must be regenerated for further use. The LDAC system regenerates the weak desiccant solution from D2 to D3 employing condenser heat, bypassing the desiccant solution via the condenser. The hot and weak desiccant solution (D3) is then transported to the regenerator section, where the liquid desiccant is regenerated by removing moisture from the liquid desiccant. In the regeneration process, less humid air (A6) from the environment or the heated air from the room exit is assisted. The weak desiccant solution rejects moisture to the less humid air, leaving it free to escape into the atmosphere (A7). The strong hot desiccant solution (D4) is transferred via heat exchanger 1 after the regeneration process to reduce the temperature of the desiccant solution for improved dehumidification. Chilled water (W1) enters heat exchanger 1 to reduce the temperature of the desiccant solution and exits at (W2) to cool the desiccant solution for use as an input in a dehumidifier (D1).
The use of condenser heat and heat recovery in heat exchanger 2 improves the energy-saving capacity of hybrid LDAC. The outgoing liquid desiccant flow rate is determined using a known-capacity vessel and a timer, which is used to record the time required to fill the known volume. A single switching and control panel serves as the hub for all electrical connections. On this control panel, an energy meter is used to determine the capacity (as kW) that has been used at a certain time. Various parameters that need to be measured for the experimentation are relative humidity, airflow rate, solution flow rate, the temperature of both air and desiccant solution, and data on energy consumption. Temperature (PT -100 RTD) and RH (MTC-1101) sensors are placed at vital locations for recording data. The specific gravity is measured by the hydrometer, and air velocity and flow rate are measured by a digital anemometer (HTC AVM-06). The liquid desiccant solution flow rate is measured with a stopwatch by measuring the time to fill up a vessel with a specific volume.

2.3. Uncertainty Assessment
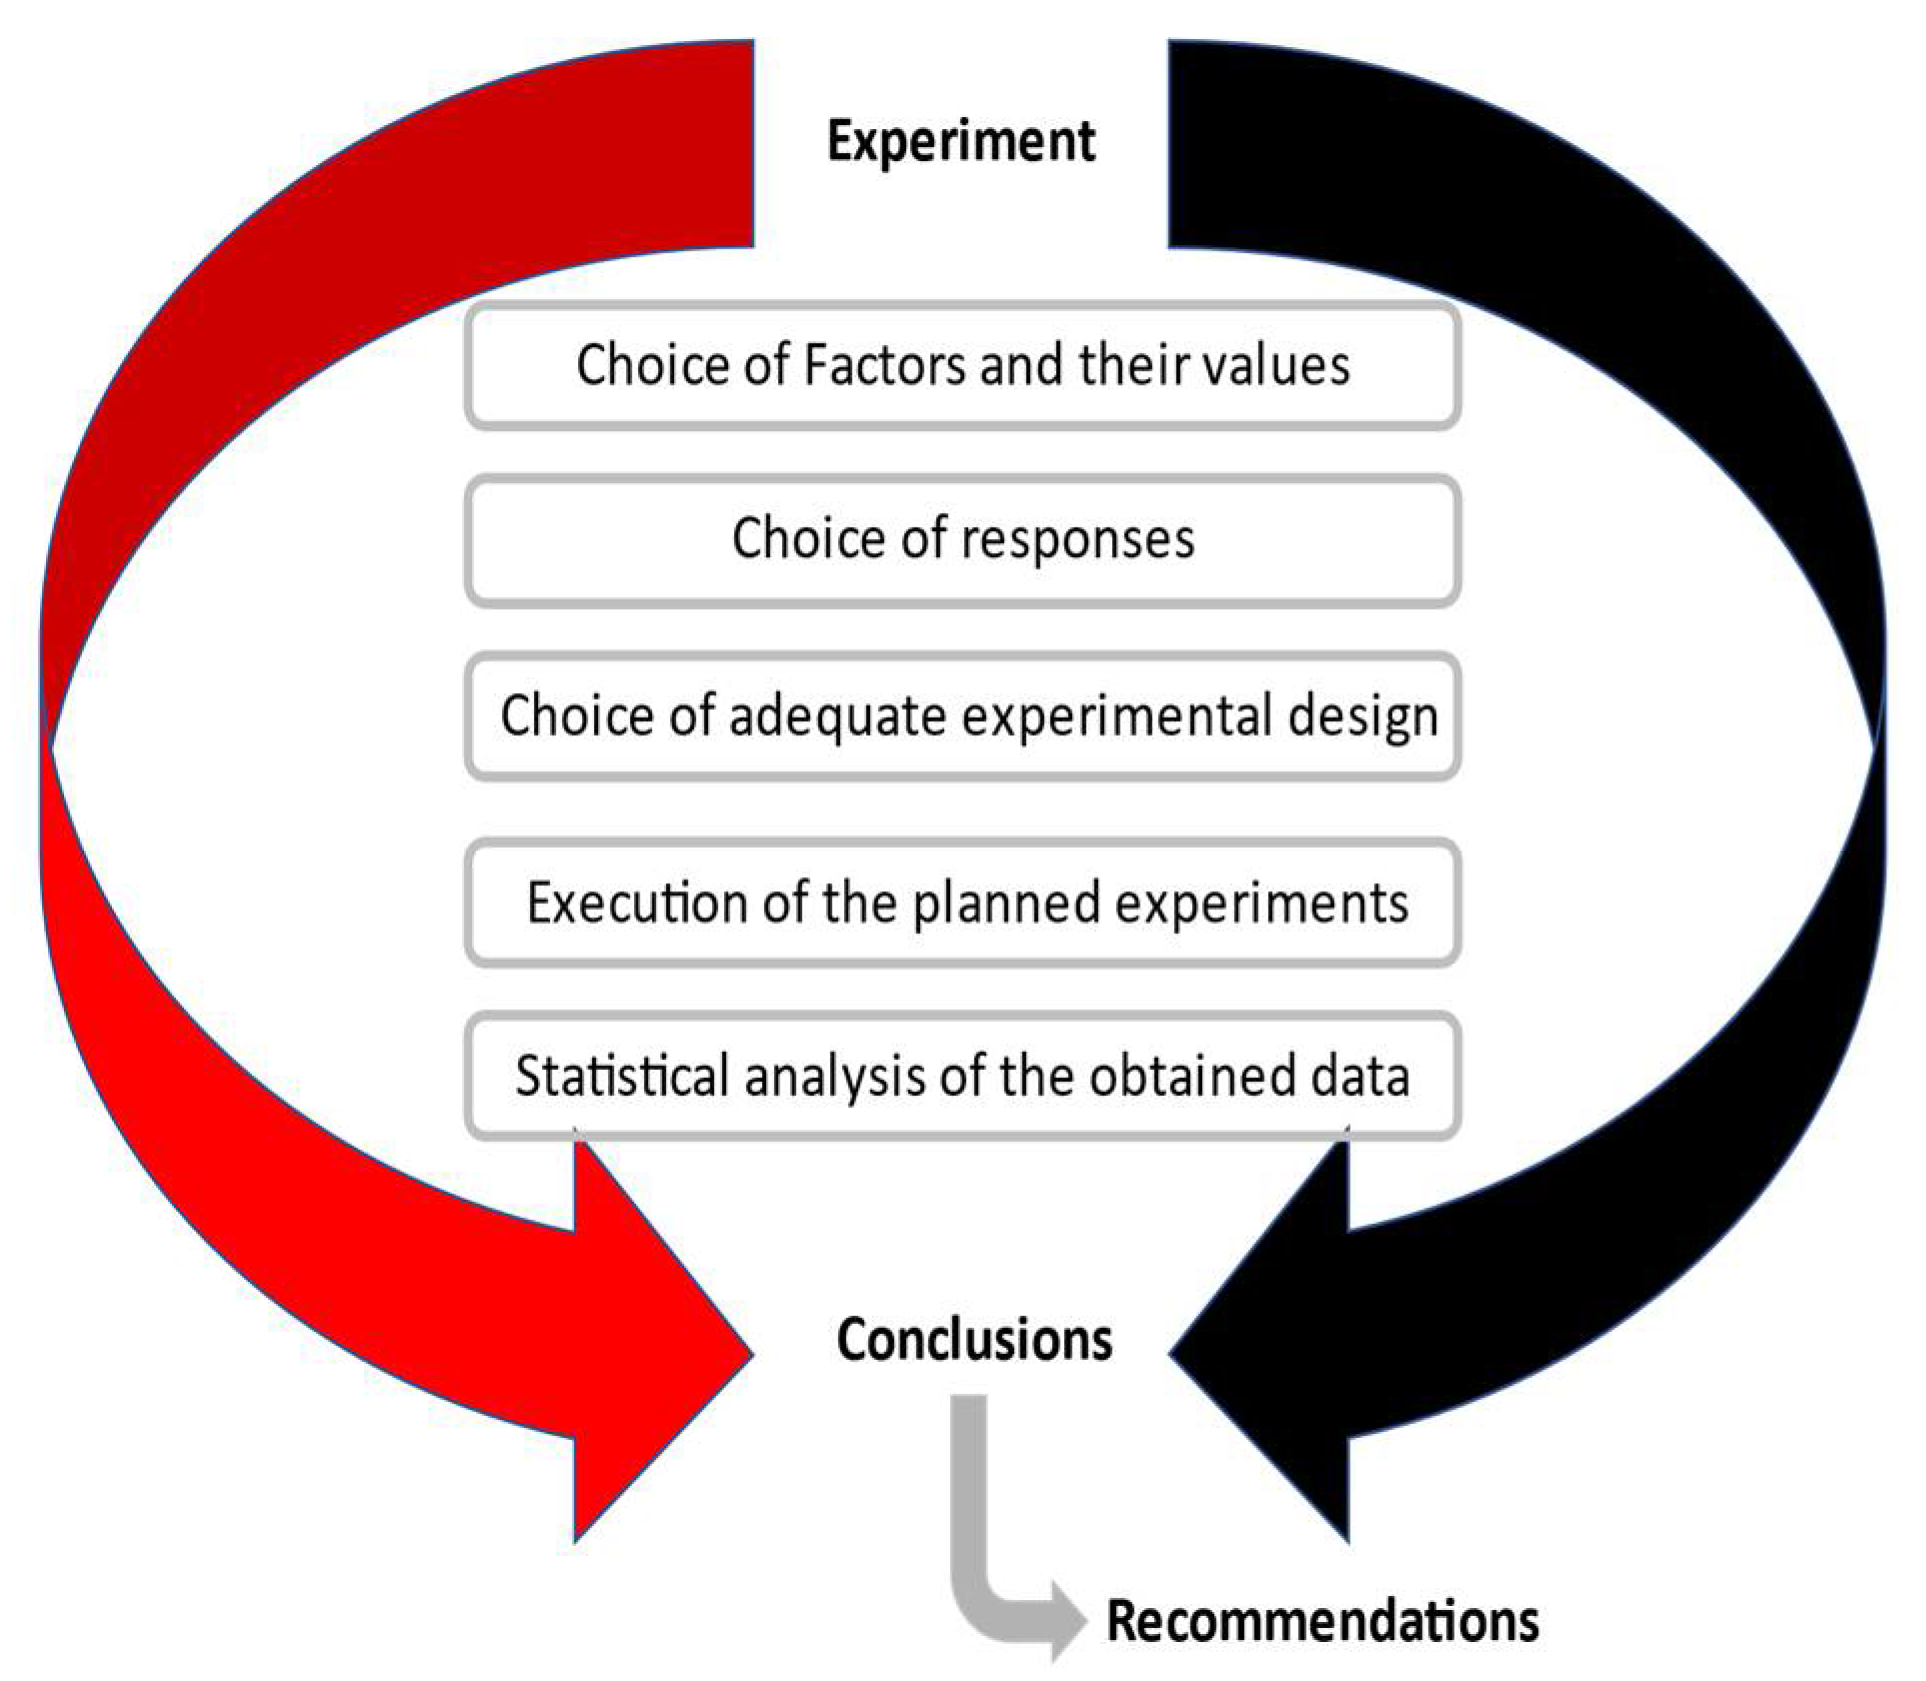
The uncertainty of measured values (in this case, flow rate, temperature, and relative humidity) is managed by sensors with specific precision. Other parameters were computed using specific formulae. Their uncertainty was determined by the method of uncertainty propagation given by Equation (2) [42,43,44,45].
y y = ( ln y x 1 δ x 1 ) 2 + ( ln y x 2 δ x 2 ) 2 + + ( ln y x n δ x n ) 2
where y and δ x n represent indirect calculated parameter and uncertainty of the nth direct calculated parameter, respectively. According to the precision of the corresponding sensors, uncertainties associated with direct means parameters can be found in Table 2. In addition, uncertainties concerning the parameters measured are set out in Table 3.

3. Methodology

3.1. Experimental Design

DOE, a statistical technique, is used to analyze input (predicted) and output (response) variables, and different interactions that may be possible between the input variables in all feasible combinations (Design of Experiments for Engineers and Scientists—Jiju Antony—Google Books, n.d.). The general structure for conducting experiments with DOE methodology is shown in Figure 5 [46,47,48,49,50].

3.2. DOE Structure

The full factorial design obtained from DOE was employed to determine the effect of input parameters on the dehumidification performance of KCOOH solution in hybrid LDAC system: type of desiccant, inlet air flow rate ( m a 1 ˙ ) , inlet desiccant temperature ( T d 1 ) , and inlet air humidity ( w 1 ) . It comprised 1-factor-2-levels and 3-factors-3-levels using statistical software MINITAB 2021. Figure 6 illustrates the comprehensive method for full factorial design obtained from DOE. Table 4 represents all four variables and their levels. The benefit of the full factorial approach is that it is more precise than any other statistical technique. The downsides of this strategy are the large number of trials, the high costs associated with the experiments, and the additional time required to conduct the experiments.
The mass flow rate of air was kept low to avoid desiccant carryover in the processed air [41]. The concentration of the two desiccants was kept fixed at 36% for LiCl and 70% for KCOOH solution to compare the dehumidification performance of the two desiccants. Throughout the experiments, inlet air temperature was kept constant at 36 °C by employing a steam generator. A temperature sensor (precision: 0.1 °C, magnification: 0.01 °C) ensured accurate temperature regulation. A total of 54 experiments were conducted by using the full factorial design. In Table 5, the different combinations were shown for all experiments.

3.3. Performance Index

The three following responses were examined on the basis of the extent of the given setup.
(a)
Specific humidity change   ( Δ w = w a 1 w a 2 ) (in grams per kg of dry air):
The specific humidity change in the dehumidifier was calculated using the temperature, and relative humidity of the air. Response variables were obtained at the input and output of the dehumidifier.
(b)
Heat load of dehumidifier Q d (in K J / k g ):
The value of latent heat load removed by the dehumidifier section was obtained by the following expression:
Q d = C p a × ( T a 1 T a 2 ) + Δ h a b s × ( w a 1 w a 2 )
where Δ h a b s denotes the absorption enthalpy (total amount of heat released per kilogram of water vapor) including latent heat of evaporation ( h f g ) and dilution enthalpy ( Δ h d i l ) and can be expressed as follows:
Δ h a b s = h f g ( T a , w ) + Δ h d i l ( T d , X )
(c)
Coefficient of performance of the hybrid system ( C O P H y b r i d ):
The coefficient of performance of hybrid LDAC is provided by the following equation:
C O P H y b r i d = Q d + Q v Q r + W
where Q d and Q v represent the rate of heat removed by the dehumidifier section and the VCR section respectively. Furthermore, Q r denotes the amount of heat required by the regenerator throughout the process. W is the sum of all power consumed in the hybrid system such as solution pump, condenser, compressor, condenser, and two air blowers. The value of Q v can be calculated by the expression given below:
Q v = m a [ C p a × ( T a 3 T a 4 ) + h f g × ( w a 3 W a 4 ) ]
Here, the evaporator inlet and outlet are represented by state points 3 and 4.

4. Results and Discussion

The full factorial design technique is quite costlier when only a few variables are examined. However, the full factorial design is used for encapsulating additional data such as second-order interactions. In the orthogonal design of experiments such as Taguchi and RSM, the number of experimental runs is minimized at the expense of experimental cost. The full factorial design iterates overall potential outcomes with given experimental data. The experiment runs were conducted according to the design proposed by the full factorial approach under constant environmental conditions (Ta1 = 36 °C and a 1   = 60%). All three response parameters (i.e., Δ w , Q d and C O P H y b r i d ) were measured for each of the 54 experimental runs and are summarized in Table 6.
Experimental results substantially impacted all three response parameters for various combinations of runs. As m a 1 increased at constant T d 1 and w 1 , Δ w and Q d decreased. Similarly, the increase in T d 1 at constant m a 1 and w 1 provided the same result as m a 1 . Furthermore, for fixed T d 1 and m a 1 , COPHybrid, Δ w , and Q d increased with an increase in w 1 . From all experimental runs, it was observed that in experimental run 20 of Table 6, all three responses had a maximal value when m a 1 and T d 1 had a minimal value, while w 1 was the maximum for 70% KCOOH solution. However, in experimental run 52, all three responses had a minimal value when m a 1 and T d 1 had a maximal value, while w 1 had a minimal value for 36% LiCl. Therefore, Table 6 shows that m a 1 and T d 1 should have a low value, while w 1 should have a high value for the optimal output.

4.1. Regression Correlations

The competence of the regression model was assessed in Table 7 using analysis of variance (ANOVA). Each of the three responses was analyzed using regression, and trial correlations that were produced (acceptable within the specified range). Table 8 shows that each individual variable had a significant effect on all three responses. Moreover, all interaction effects were significant except that of m ˙ a 1 × w 1 for response C O P H y b r i d . As the respective value of R2 was exceptionally close to 100%, all three presented response models had a perfect fit with the experimental data.

4.2. Effect of Variables

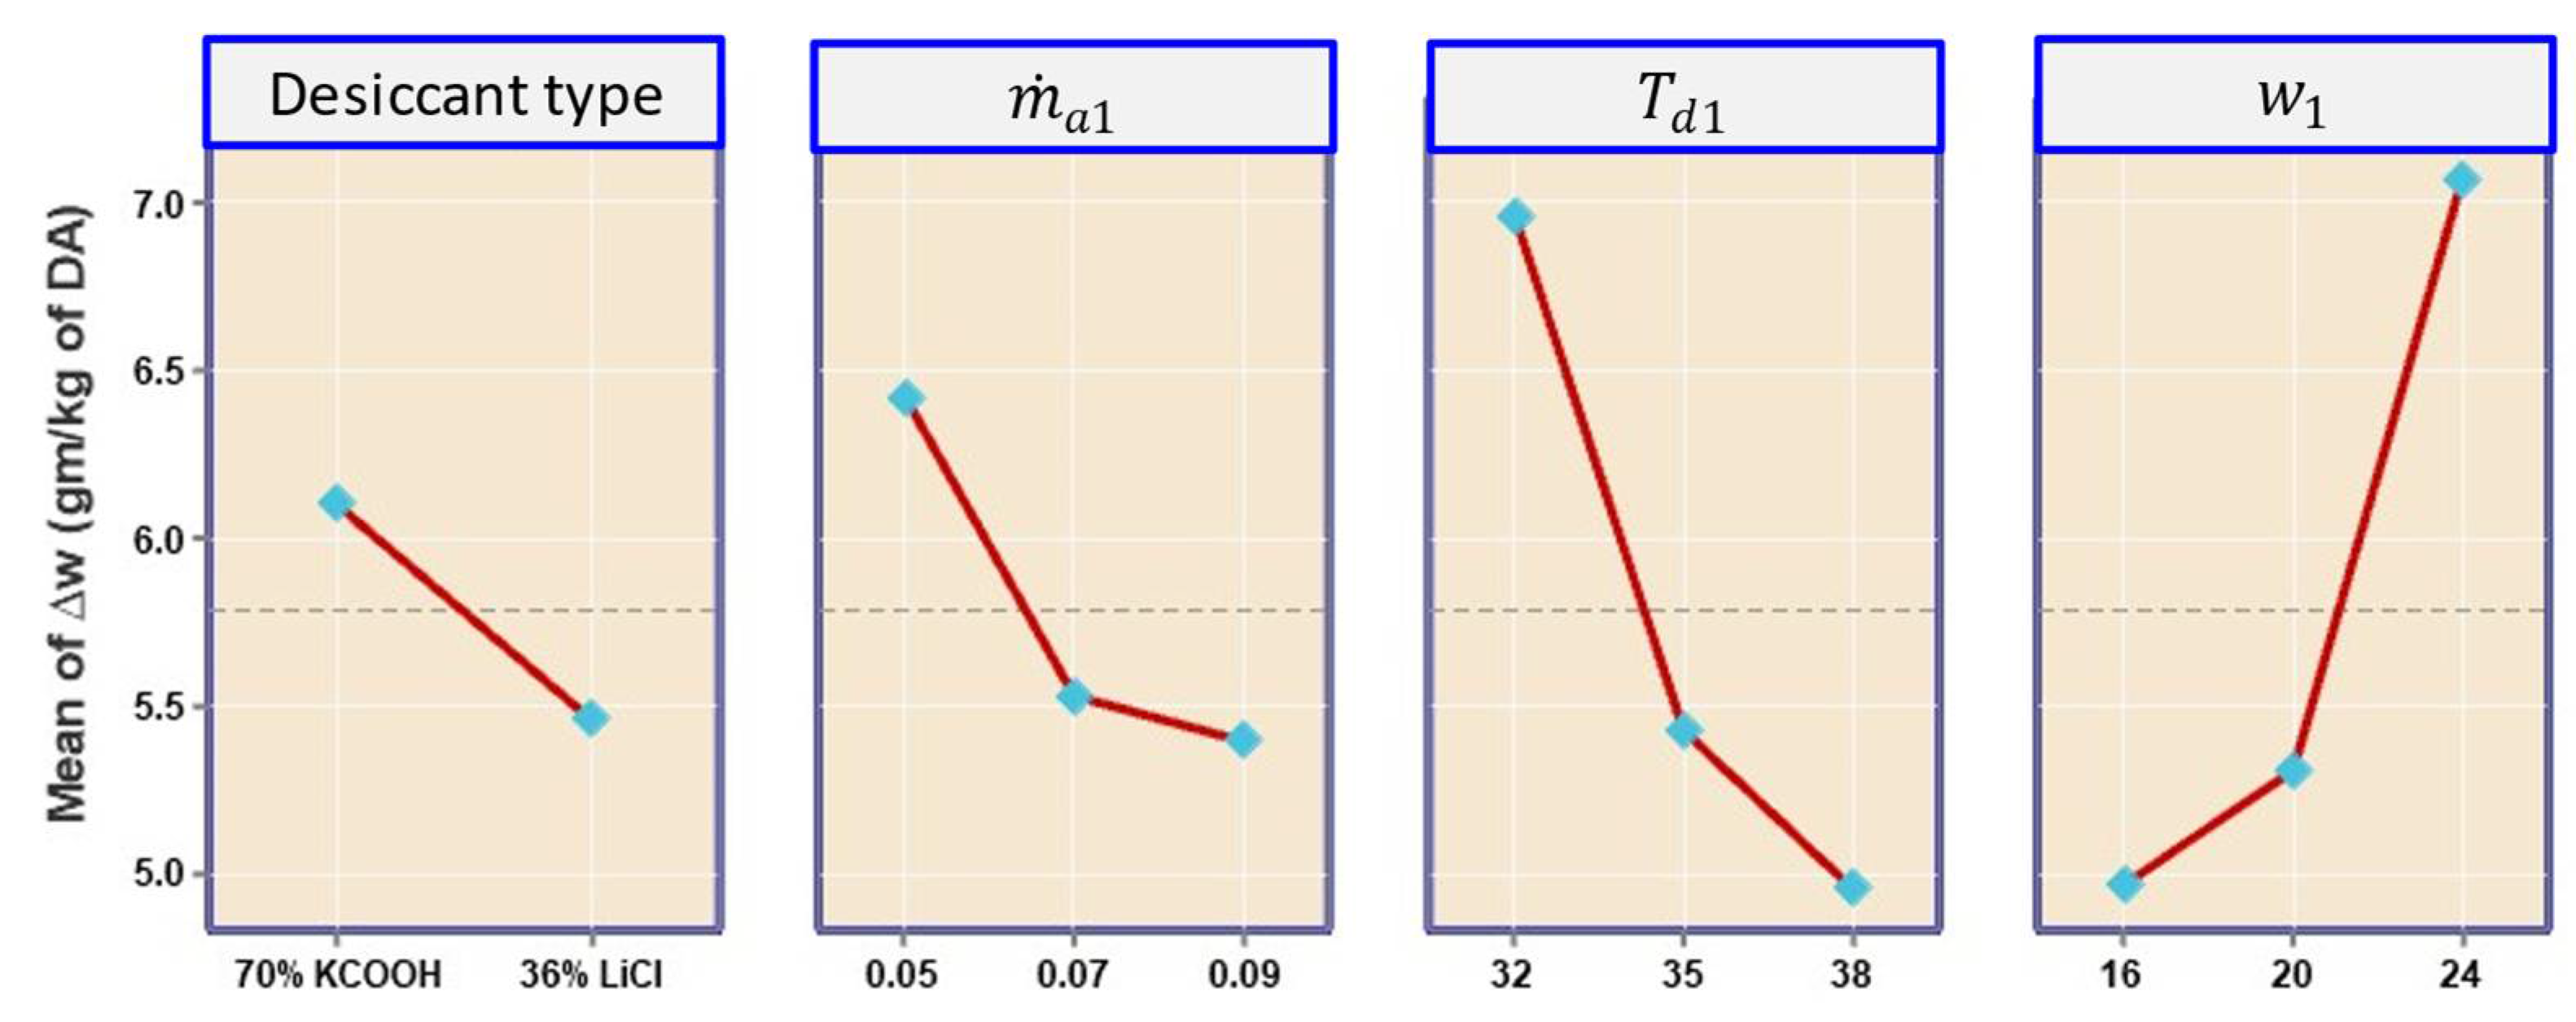
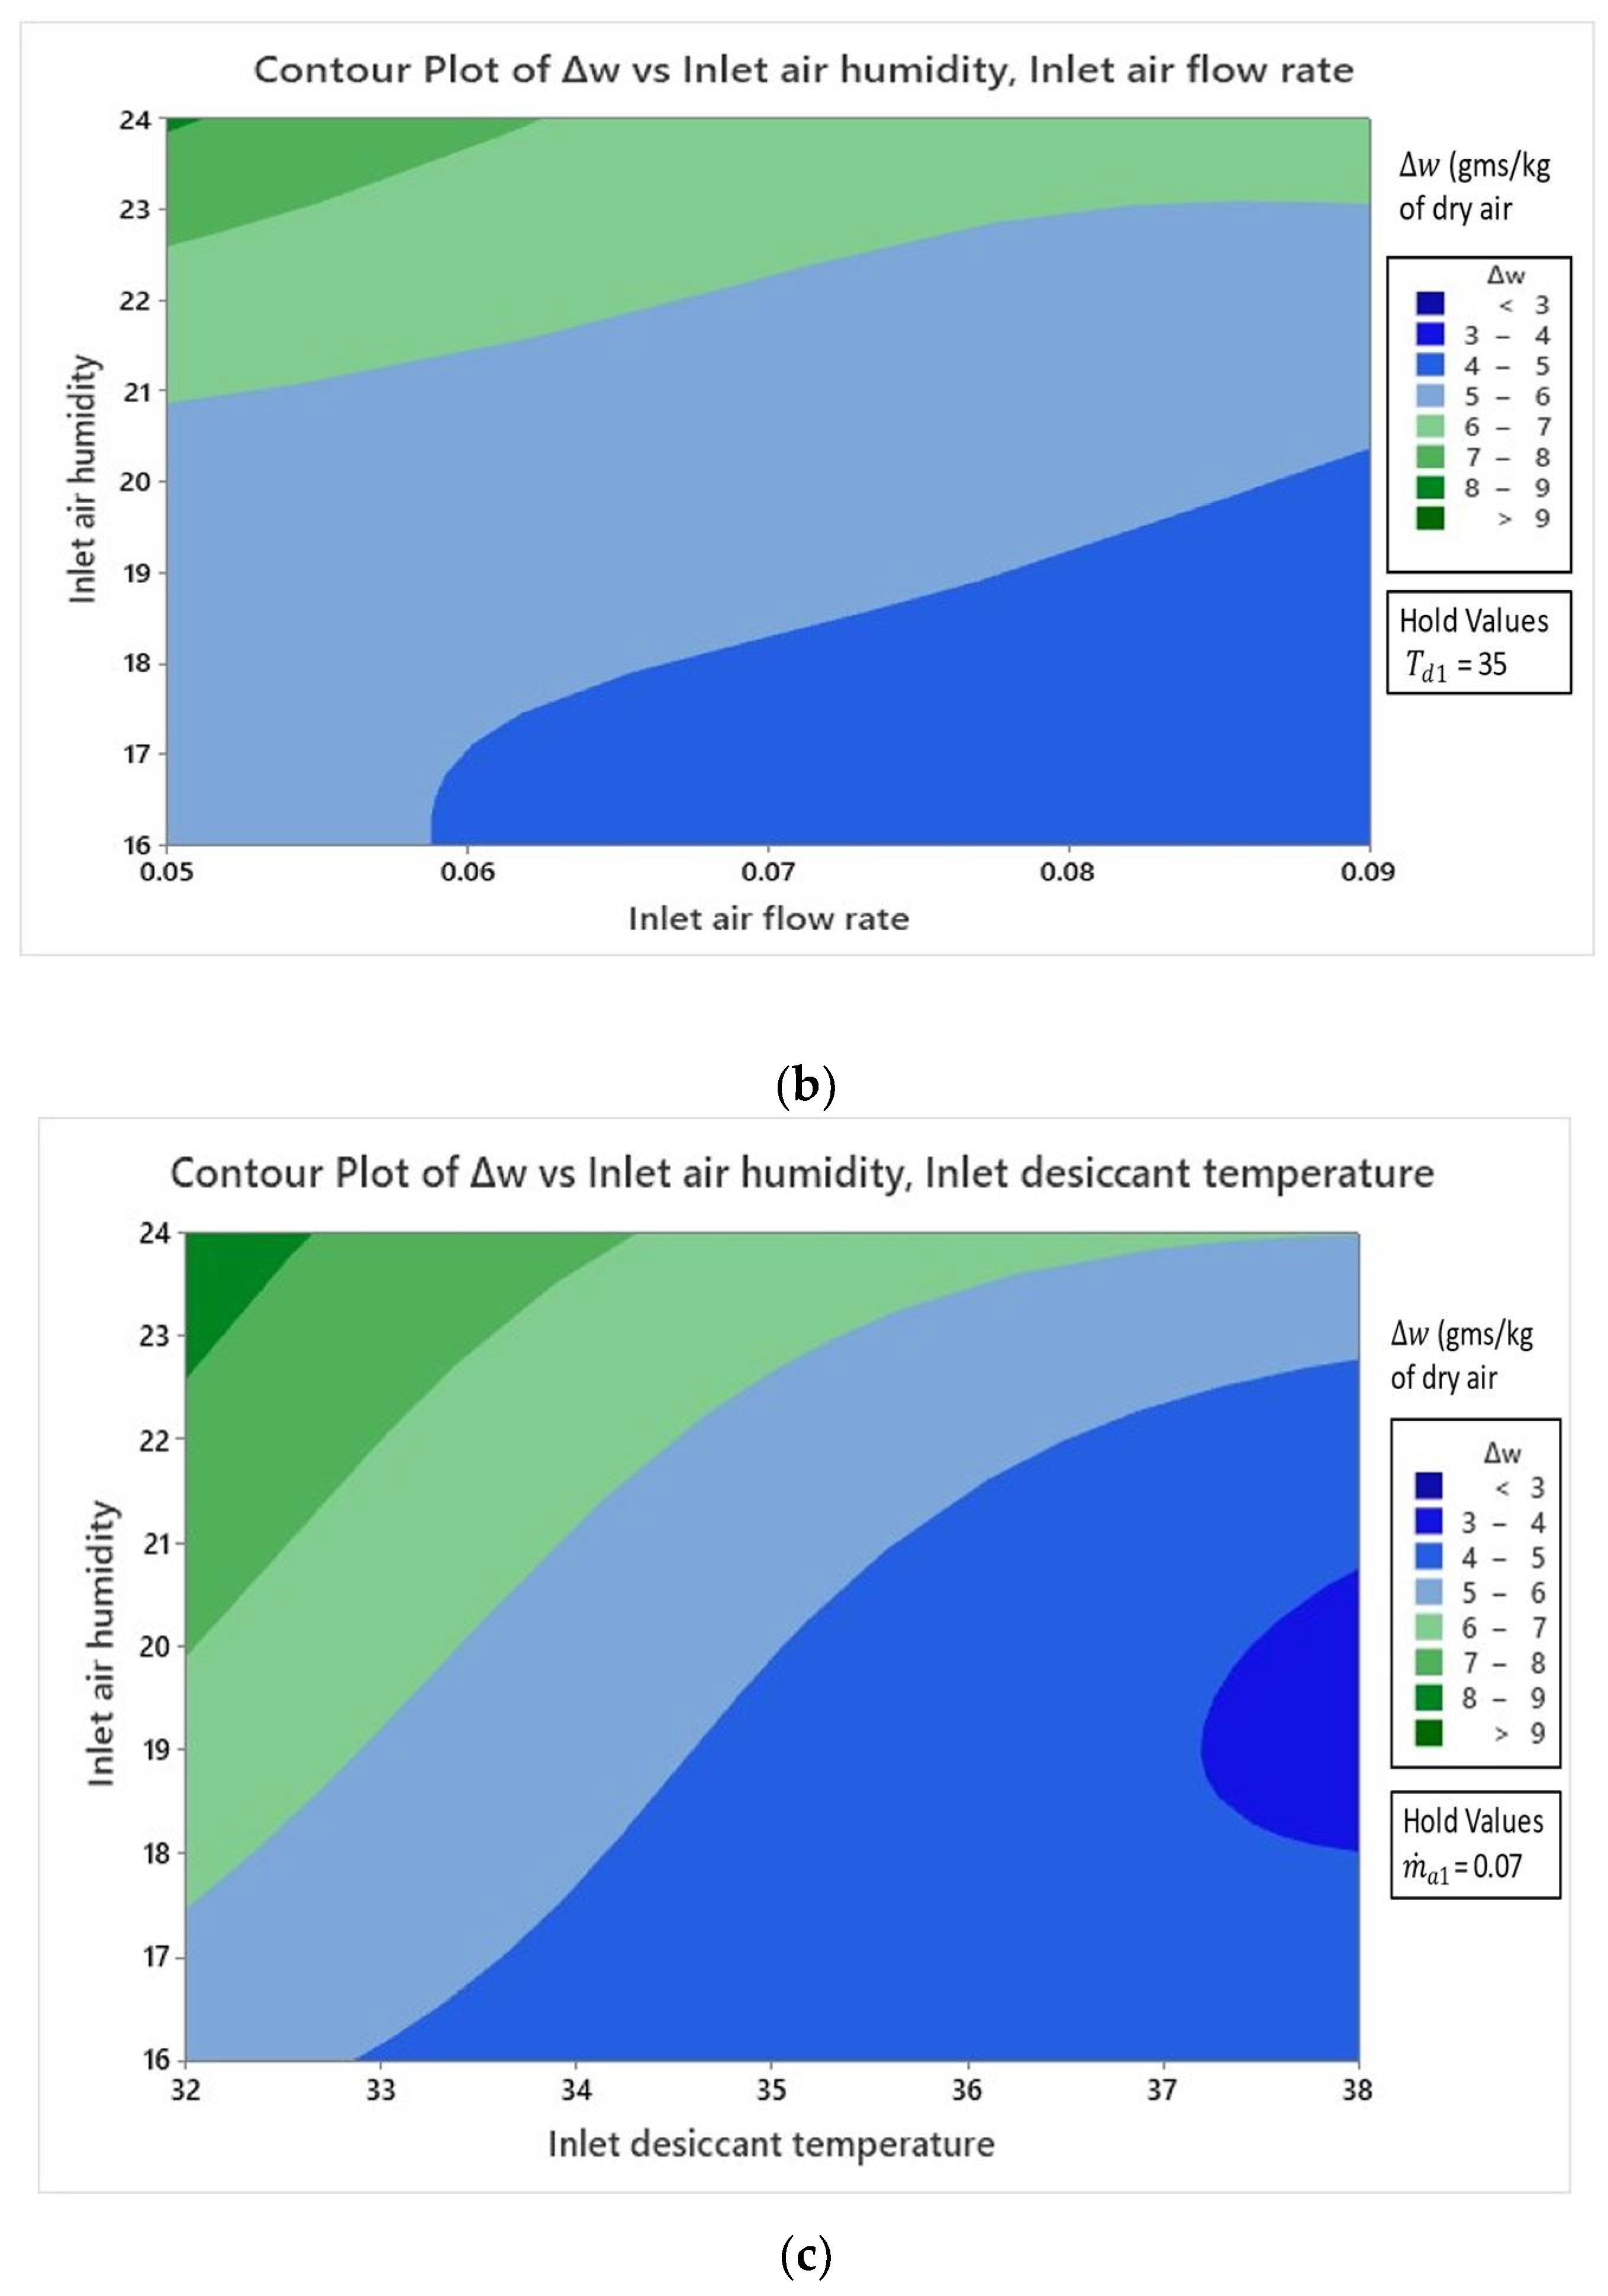
4.2.1. Effect on Specific Humidity Change

To know the influencing parameters, the effect of factors and their interactions on response parameters was investigated. Figure 7 shows the main effect plot of Δ w in which the rigid trend between all three responses and all four variables can be seen. The graph was developed employing mean fitted values of the response parameters. In addition, 70% of KCOOH solution significantly impacted the Δ w response as compared to 36% LiCl solution. Furthermore, as T d 1 and m ˙ a 1 increased, a substantial drop in Δ w was observed. However, as w 1 increased, Δ w increased. The sum of square value and the p value are shown in Table 8, and noteworthy consequences could be observed.
  • The contributions of linear terms T d 1 , w 1 , and m ˙ a 1 were 30.97%, 35.81%, and 8.72%, respectively.
  • The contribution of cross iteration ( m ˙ a 1 × T d 1 ) was only 0.29%, and the highest contribution was indicated by ( T d 1   ×   Δ w ) with 10.23%, indicating the least significance among all cross-interactions.
Figure 8 illustrates the contour (interaction) plots of the Δ w interaction effect by maintaining one component constant (at a moderate level) and changing the other two. Figure 8a depicts the interaction between T d 1 and m ˙ a 1 at constant w 1 , with the darkest green region exhibiting the greatest response (>9 g/kg of dry air) when both variables were at their minimal values. Furthermore, when these two variables increased, the response began to decrease. From this, we can conclude that the lower values of factors were suggestive to obtain a high value of the response. Figure 8b indicates the interaction between w 1 and m ˙ a 1 at constant T d 1 in which a higher response was observed (>9 g/kg of dry air) at higher w 1 and lower value of m ˙ a 1 . Figure 8c shows the interaction between w 1 and T d 1 at a constant value of m ˙ a 1 , which indicates that the lowest values of both factors yielded the maximal response. Additionally, at constant m ˙ a 1 , the Δ w response was more sensitive to inlet air humidity compare to inlet desiccant temperature.

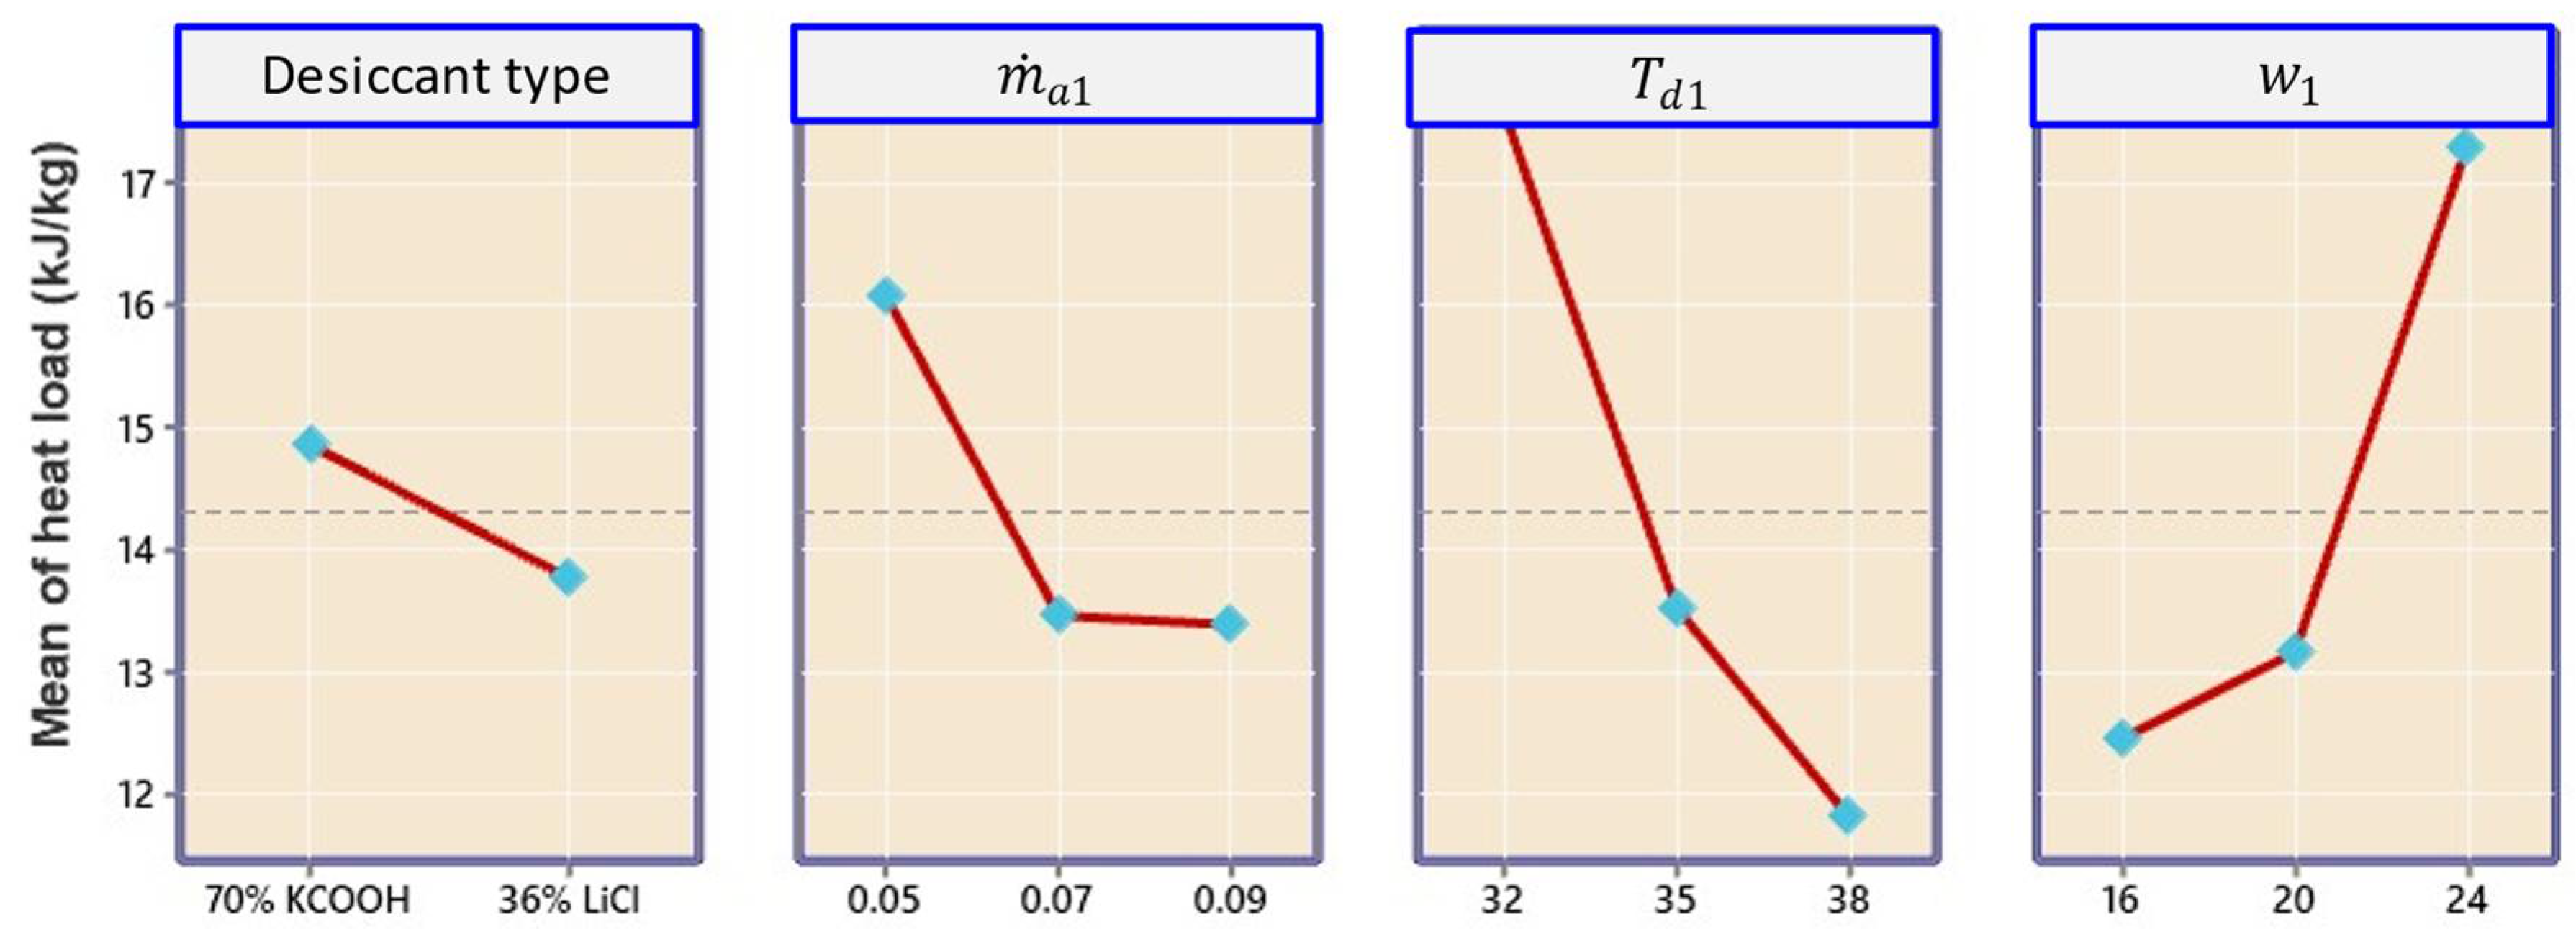
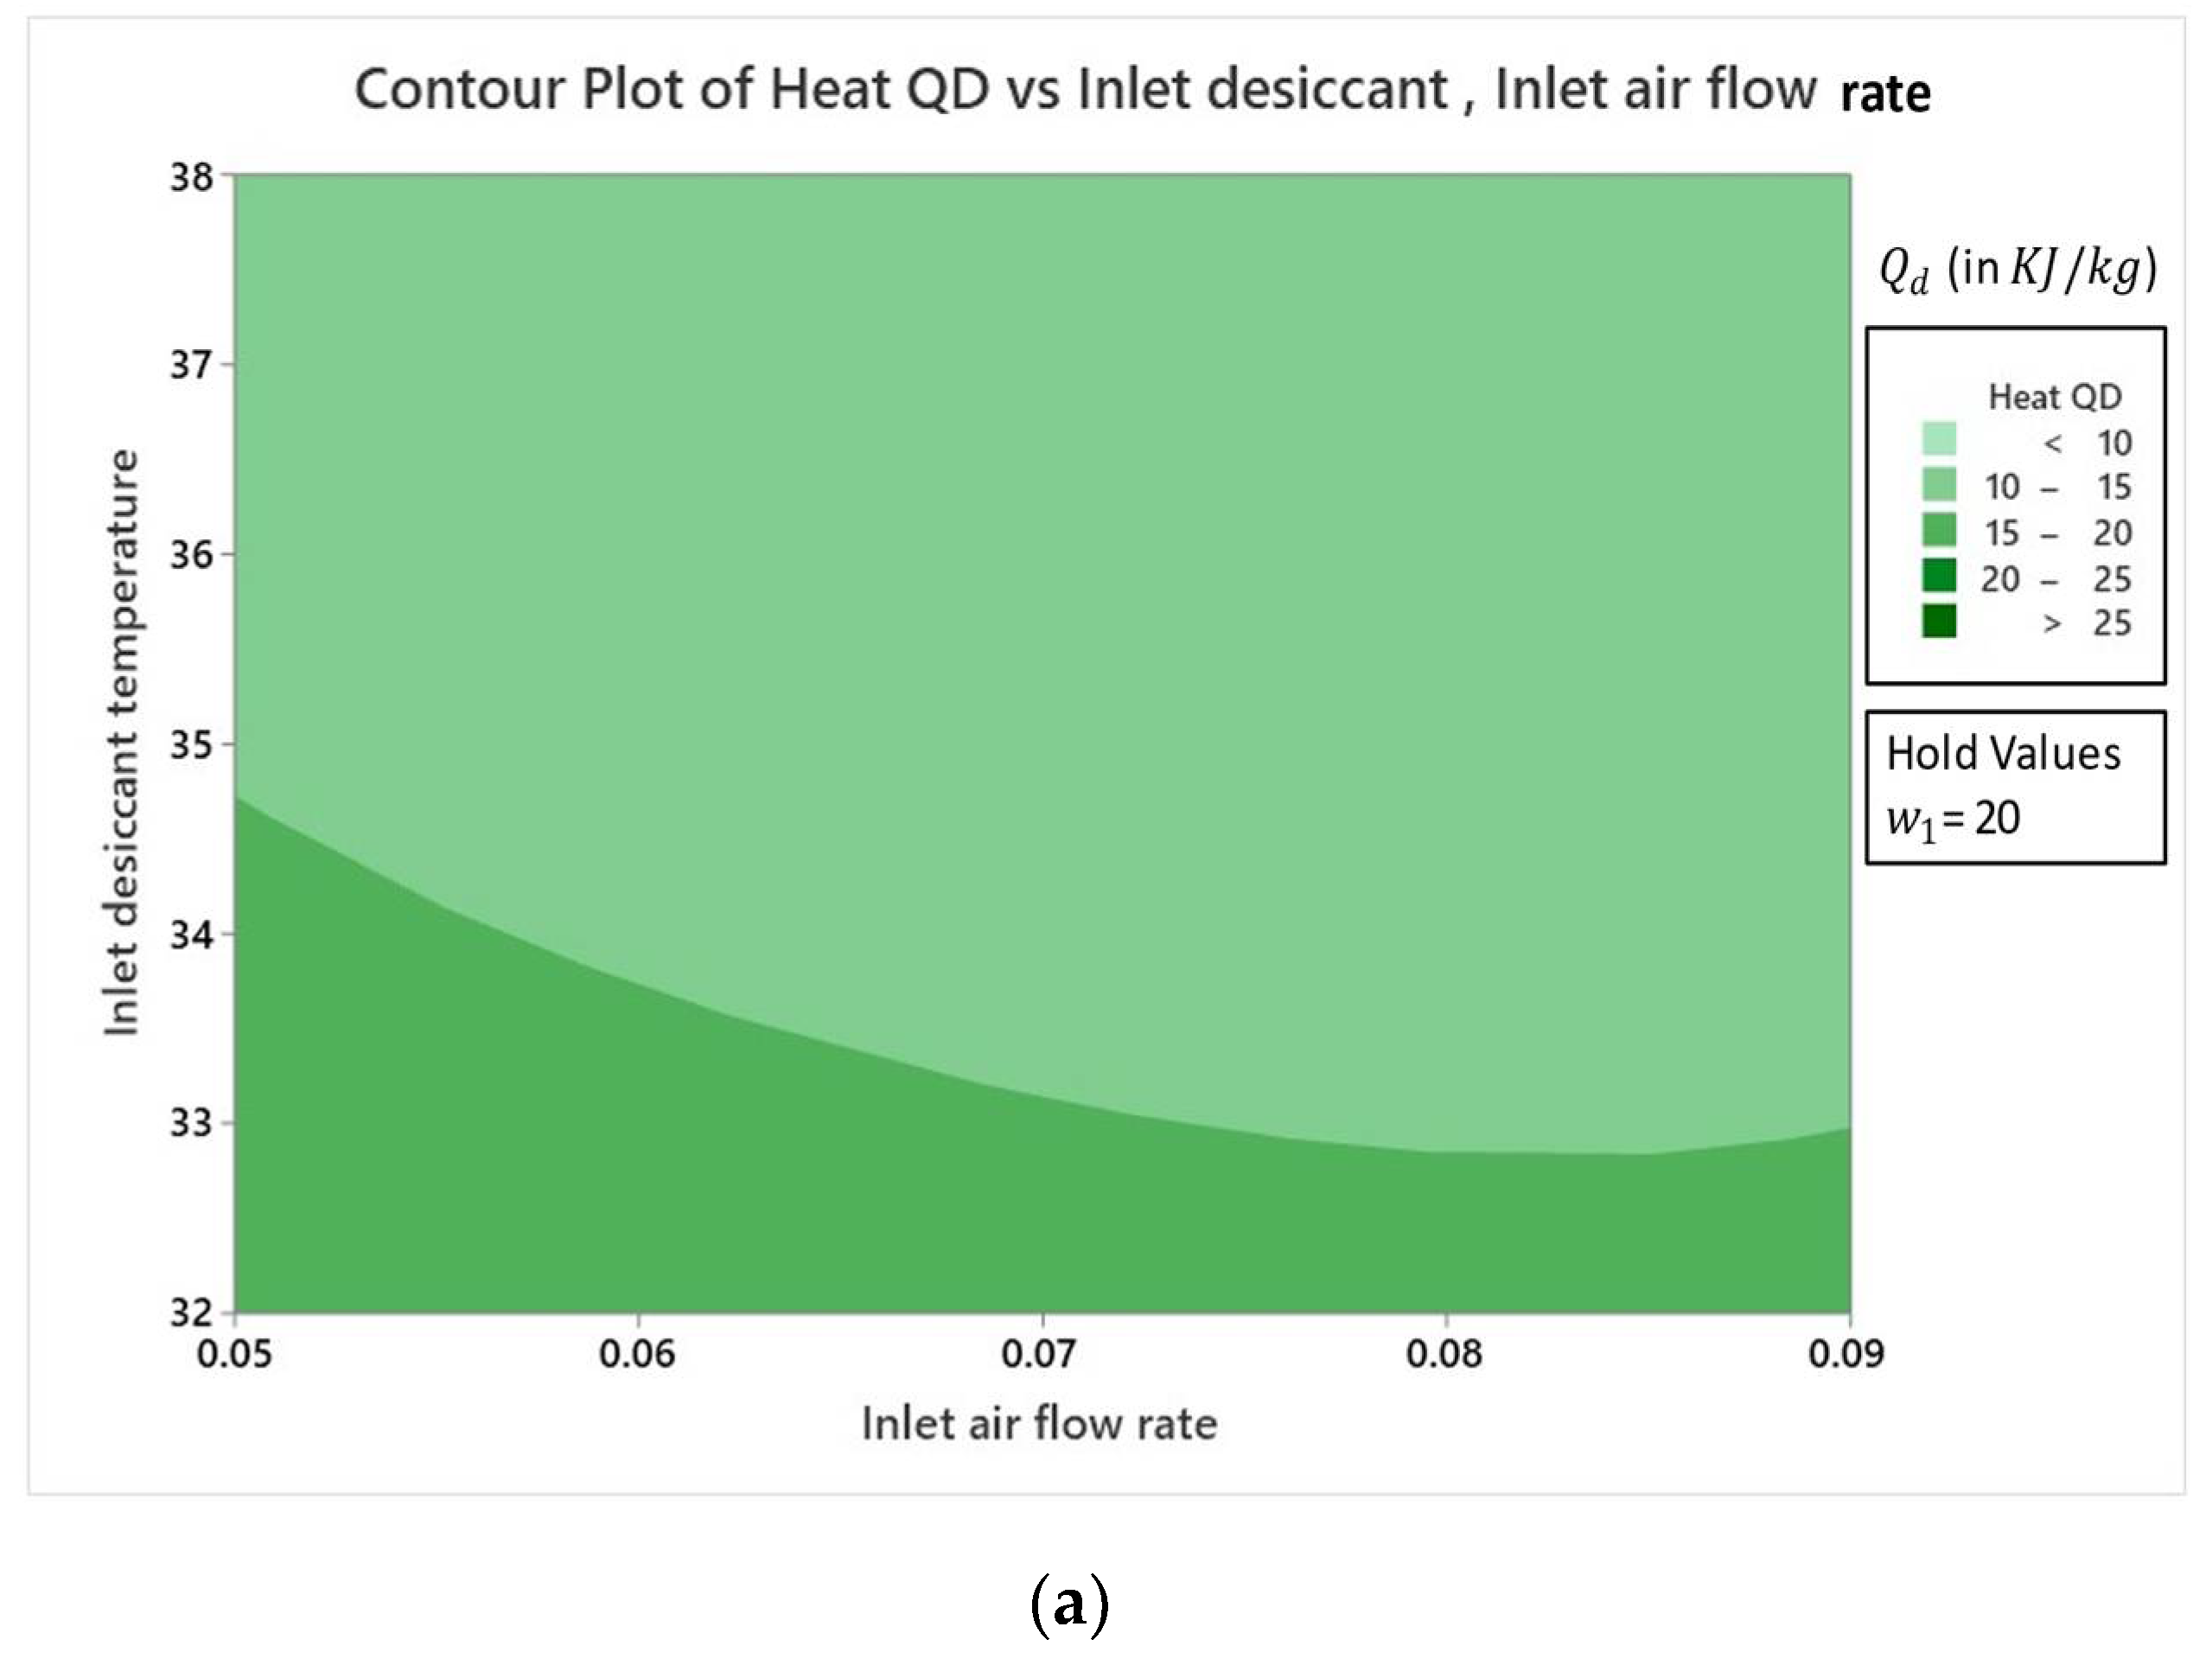
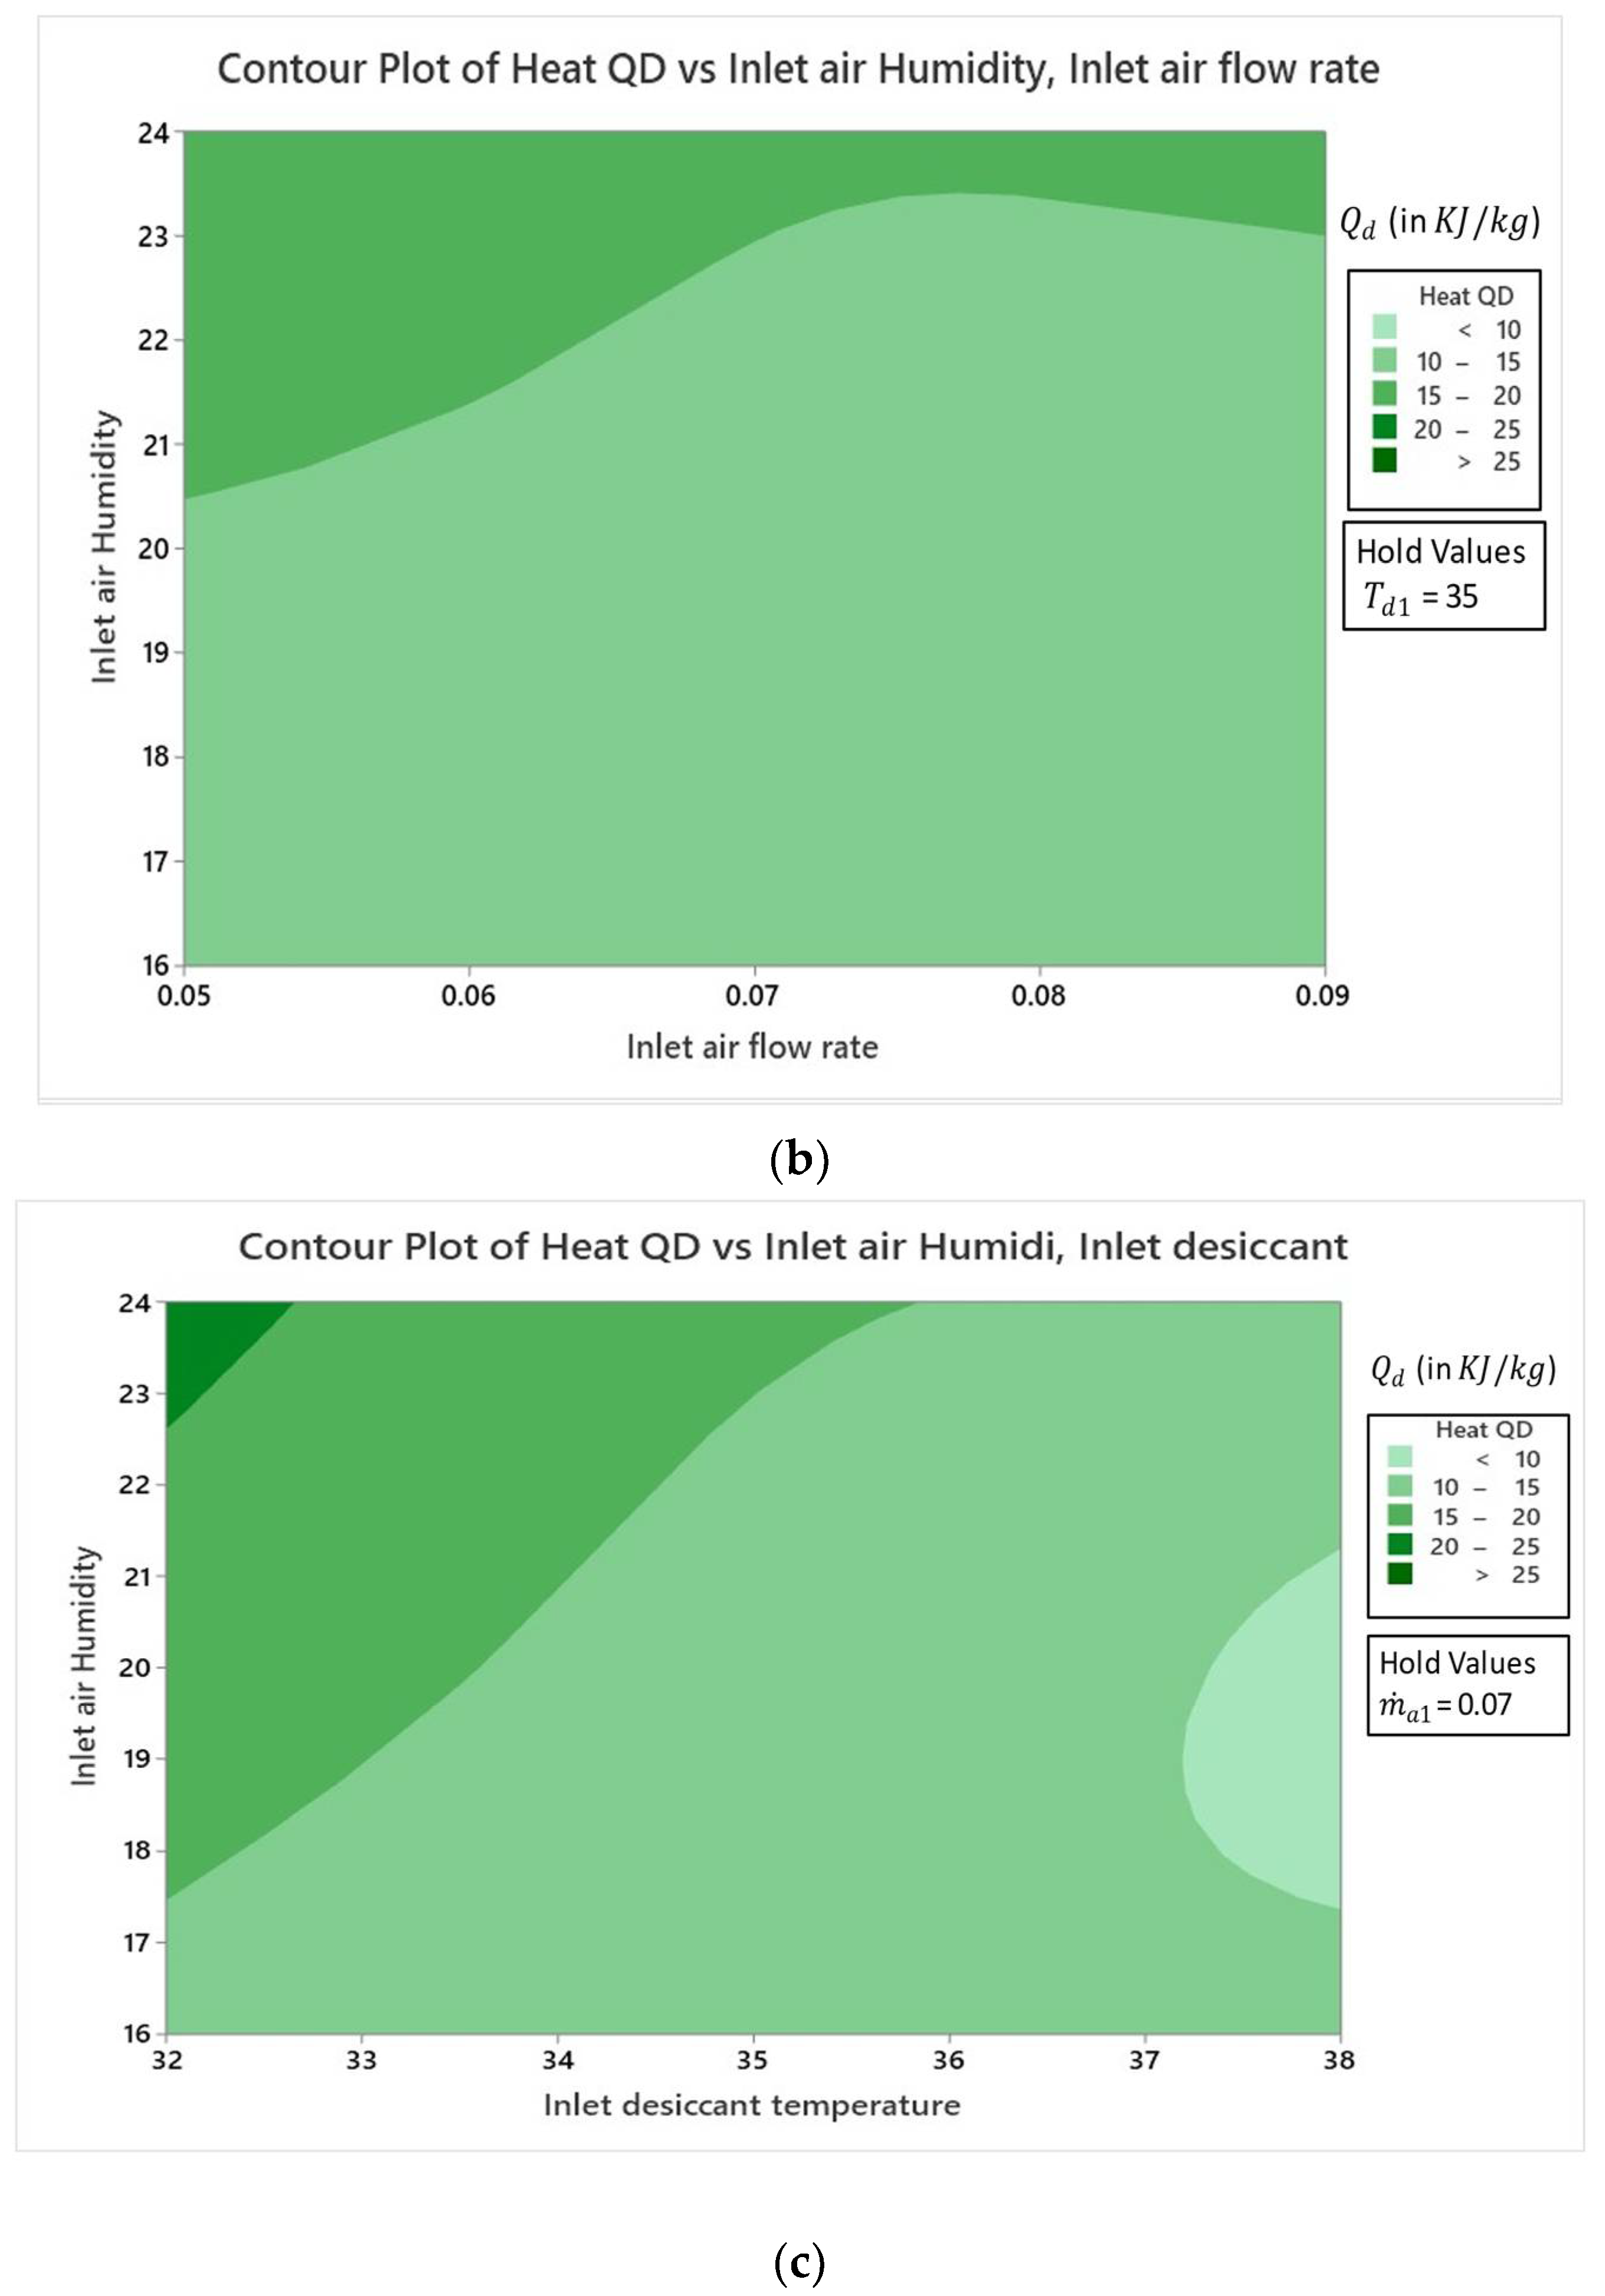
4.2.2. Effect on Dehumidifier Heat Load

The main effect plot for the Q d is shown in Figure 9. The trend of all four factors for response Q d behave like Δ w , as these responses were proportional to each other. Figure 9 shows that the 70% KCOOH solution significantly impacted Δ w as compared to 36% LiCl solution. Furthermore, while increasing the m ˙ a 1 and T d 1 , there was a significant decrease in Q d , but after 0.07 kg/sec, an approximately constant trend could be seen from Q d . However, as w 1 increased, Q d increased. The dominating factor for Q d was T d 1 , as the curve had a steeper trend. Furthermore, the significant values for Q d could be observed from the ANOVA table are as follows:
  • The contributions of linear terms T d 1 , w 1 , and m ˙ a 1 were 36.06%, 27.79%, and 9.41%, respectively.
  • The contribution of cross-iteration ( m ˙ a 1 × T d 1 ) was only 1.04%, and the highest contribution was indicated by T d 1   ×   Δ w with 8.16%, signifying that cross-interaction had the least effect.
Figure 10 indicates the contour plots for Q d . The interaction effect of Q d is presented in Figure 10 by fixing one variable (at a moderate level), and the two other variables varied. Figure 10a indicates the interaction between T d 1 and m ˙ a 1 at constant w 1 in which the dark green area shows the maximal response (10–20 KJ/kg) when both variables were at the lowest levels. Furthermore, when these two variables increased, Q d began to decrease, but after 0.08 kg/sec, there was an increase in Q d . From this, we can remark that the lower values of factors were suggestive to obtain a high value of the response. Figure 10b indicates the interaction between w 1 and m ˙ a 1 at constant T d 1 in which higher response was observed at higher values of w 1 and lower values of m ˙ a 1 . Figure 10c shows the interaction between w 1 and T d 1 at a constant value of m ˙ a 1 , which indicates that lowest values of T d 1 and highest values of w 1 yielded maximal Q d (>20 KJ/kg). Moreover, at constant m ˙ a 1 , the response was more sensitive to w 1 than that to T d 1 .

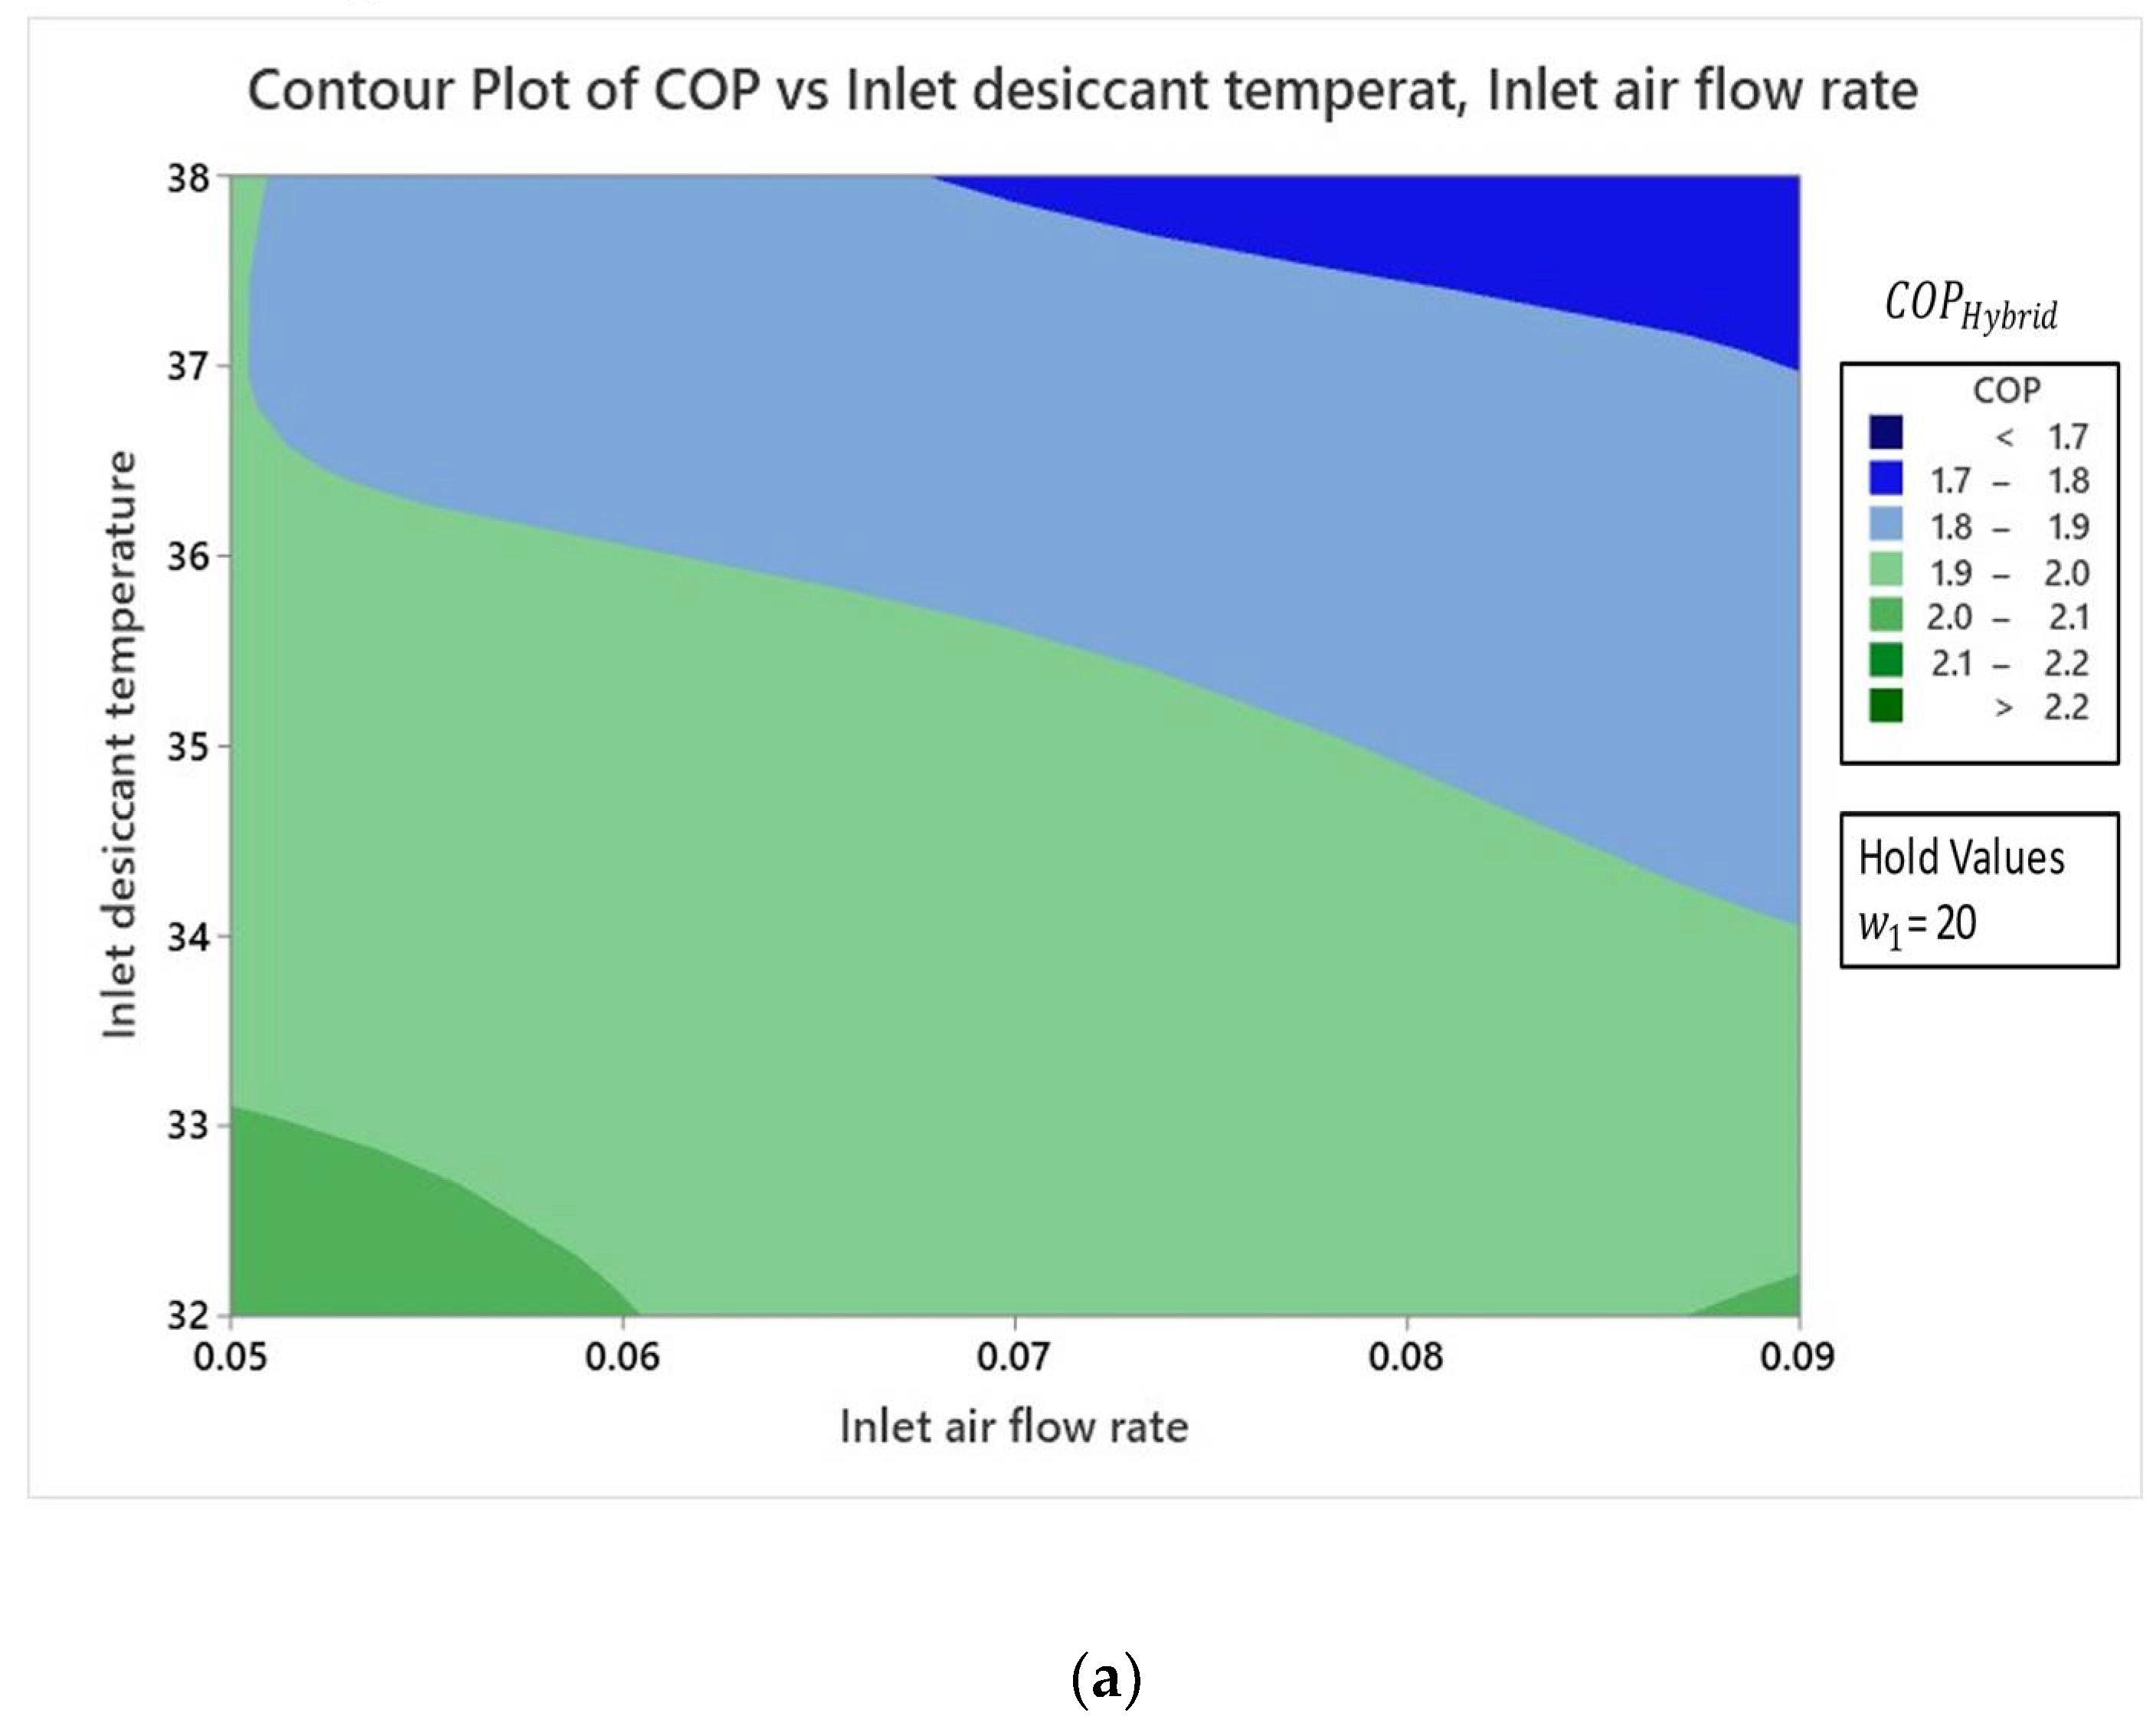
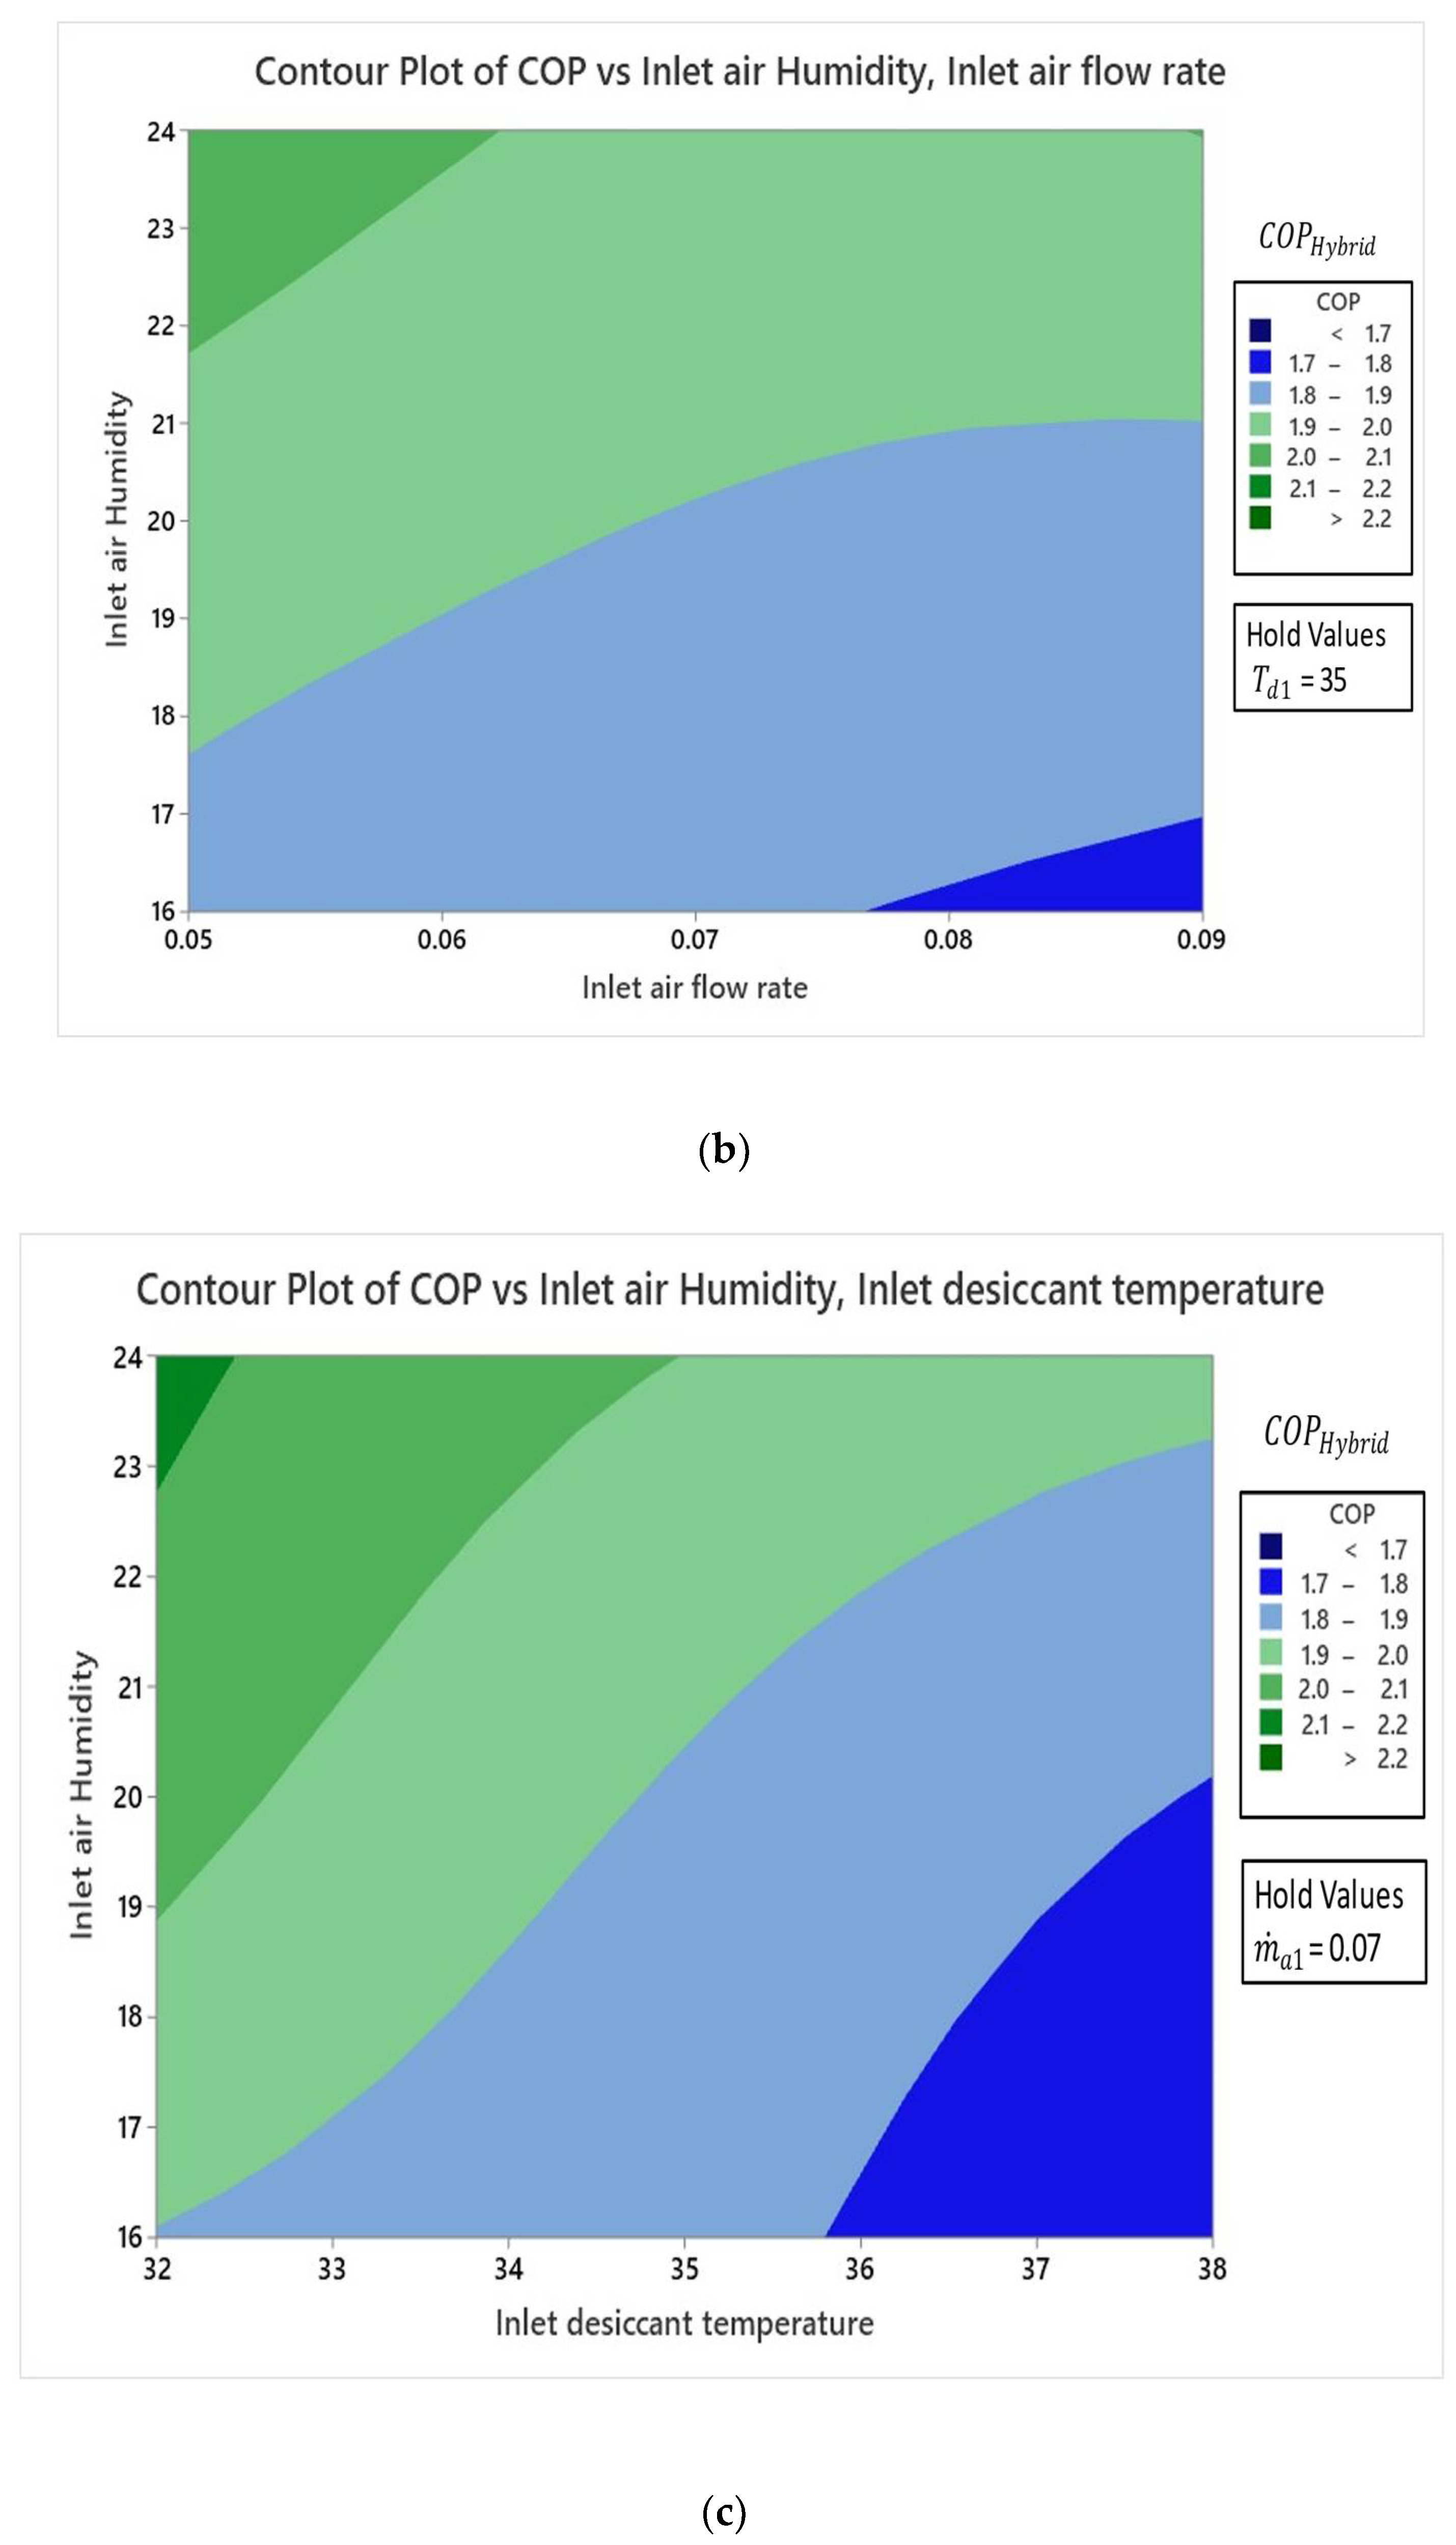
4.2.3. Effect on Coefficient of Performance

For the final C O P H y b r i d response parameter, Figure 11 shows the main effect plot for the C O P H y b r i d in which dominancy of w 1 can be seen as it increased the C O P H y b r i d value from 1.82 to 2.23 when the value increased from 16 to 24 and all other variables remained constant in their mean values. Similarly, the impact of T d 1 justified the sharp decrease in the trend of C O P H y b r i d as the value of T d 1 from 32 to 38. The effect of the m ˙ a 1 was not as pronounced in response to C O P H y b r i d , though the decrement in the curve can be recognized. Moreover, the sum of squares value extracted from the ANOVA table shows remarkable significance levels on the C O P H y b r i d ; the response was as follows:
  • The contributions of linear terms T d 1 , w 1 , and m ˙ a 1   were 9.13%, 33.28%, 34.42%, and 7.36%, respectively.
  • The contribution of cross-iteration ( m ˙ a 1 × T d 1 ) was only 2.91%, which was the highest contribution among all cross-interactions, having the least effect on C O P H y b r i d .
Furthermore, Figure 12 indicates the contour plots for response C O P H y b r i d . Figure 12a shows that the high sensitivity of T d 1 on C O P H y b r i d correlated to m ˙ a 1 . The lowest value of T d 1 at any value of m ˙ a 1 depicts value of C O P H y b r i d greater than 1.96. Figure 12b shows the interactions between m ˙ a 1 and w 1 and depicts the dominancy of w 1 rather than m ˙ a 1 for the C O P H y b r i d . The higher value of w 1 and lower value of m ˙ a 1 yielded a maximal value of C O P H y b r i d . Figure 12c shows the interaction between w 1 and T d 1 at a constant value of m ˙ a 1 , which indicated that low values of T d 1 and high values of w 1 yielded the maximal response (>20 KJ/kg). Furthermore, at constant m ˙ a 1 , the C O P H y b r i d response was sensible towards w 1 rather than T d 1 .

5. Conclusions and Future Research Scope

This study analyzed the vapor pressure of KCOOH at a varying concentration ranging from 63% to 74% and temperature ranging from 20 to 47 °C. For this purpose, a compact hybrid LDAC system with a capacity of 5.5 kW was designed and developed. In comparison to the frequently used LiCl solution, the dehumidification characteristics of the KCOOH solution were determined, compared, and assessed. The trial runs were designed with four factors and three response parameters employing a full factorial design approach. Generated data from the experiments were in terms of the vapor pressure of the KCOOH solution, specific humidity change, heat load of dehumidifier, and COPhybrid. Prominent conclusions drawn from this experiment are as follows:
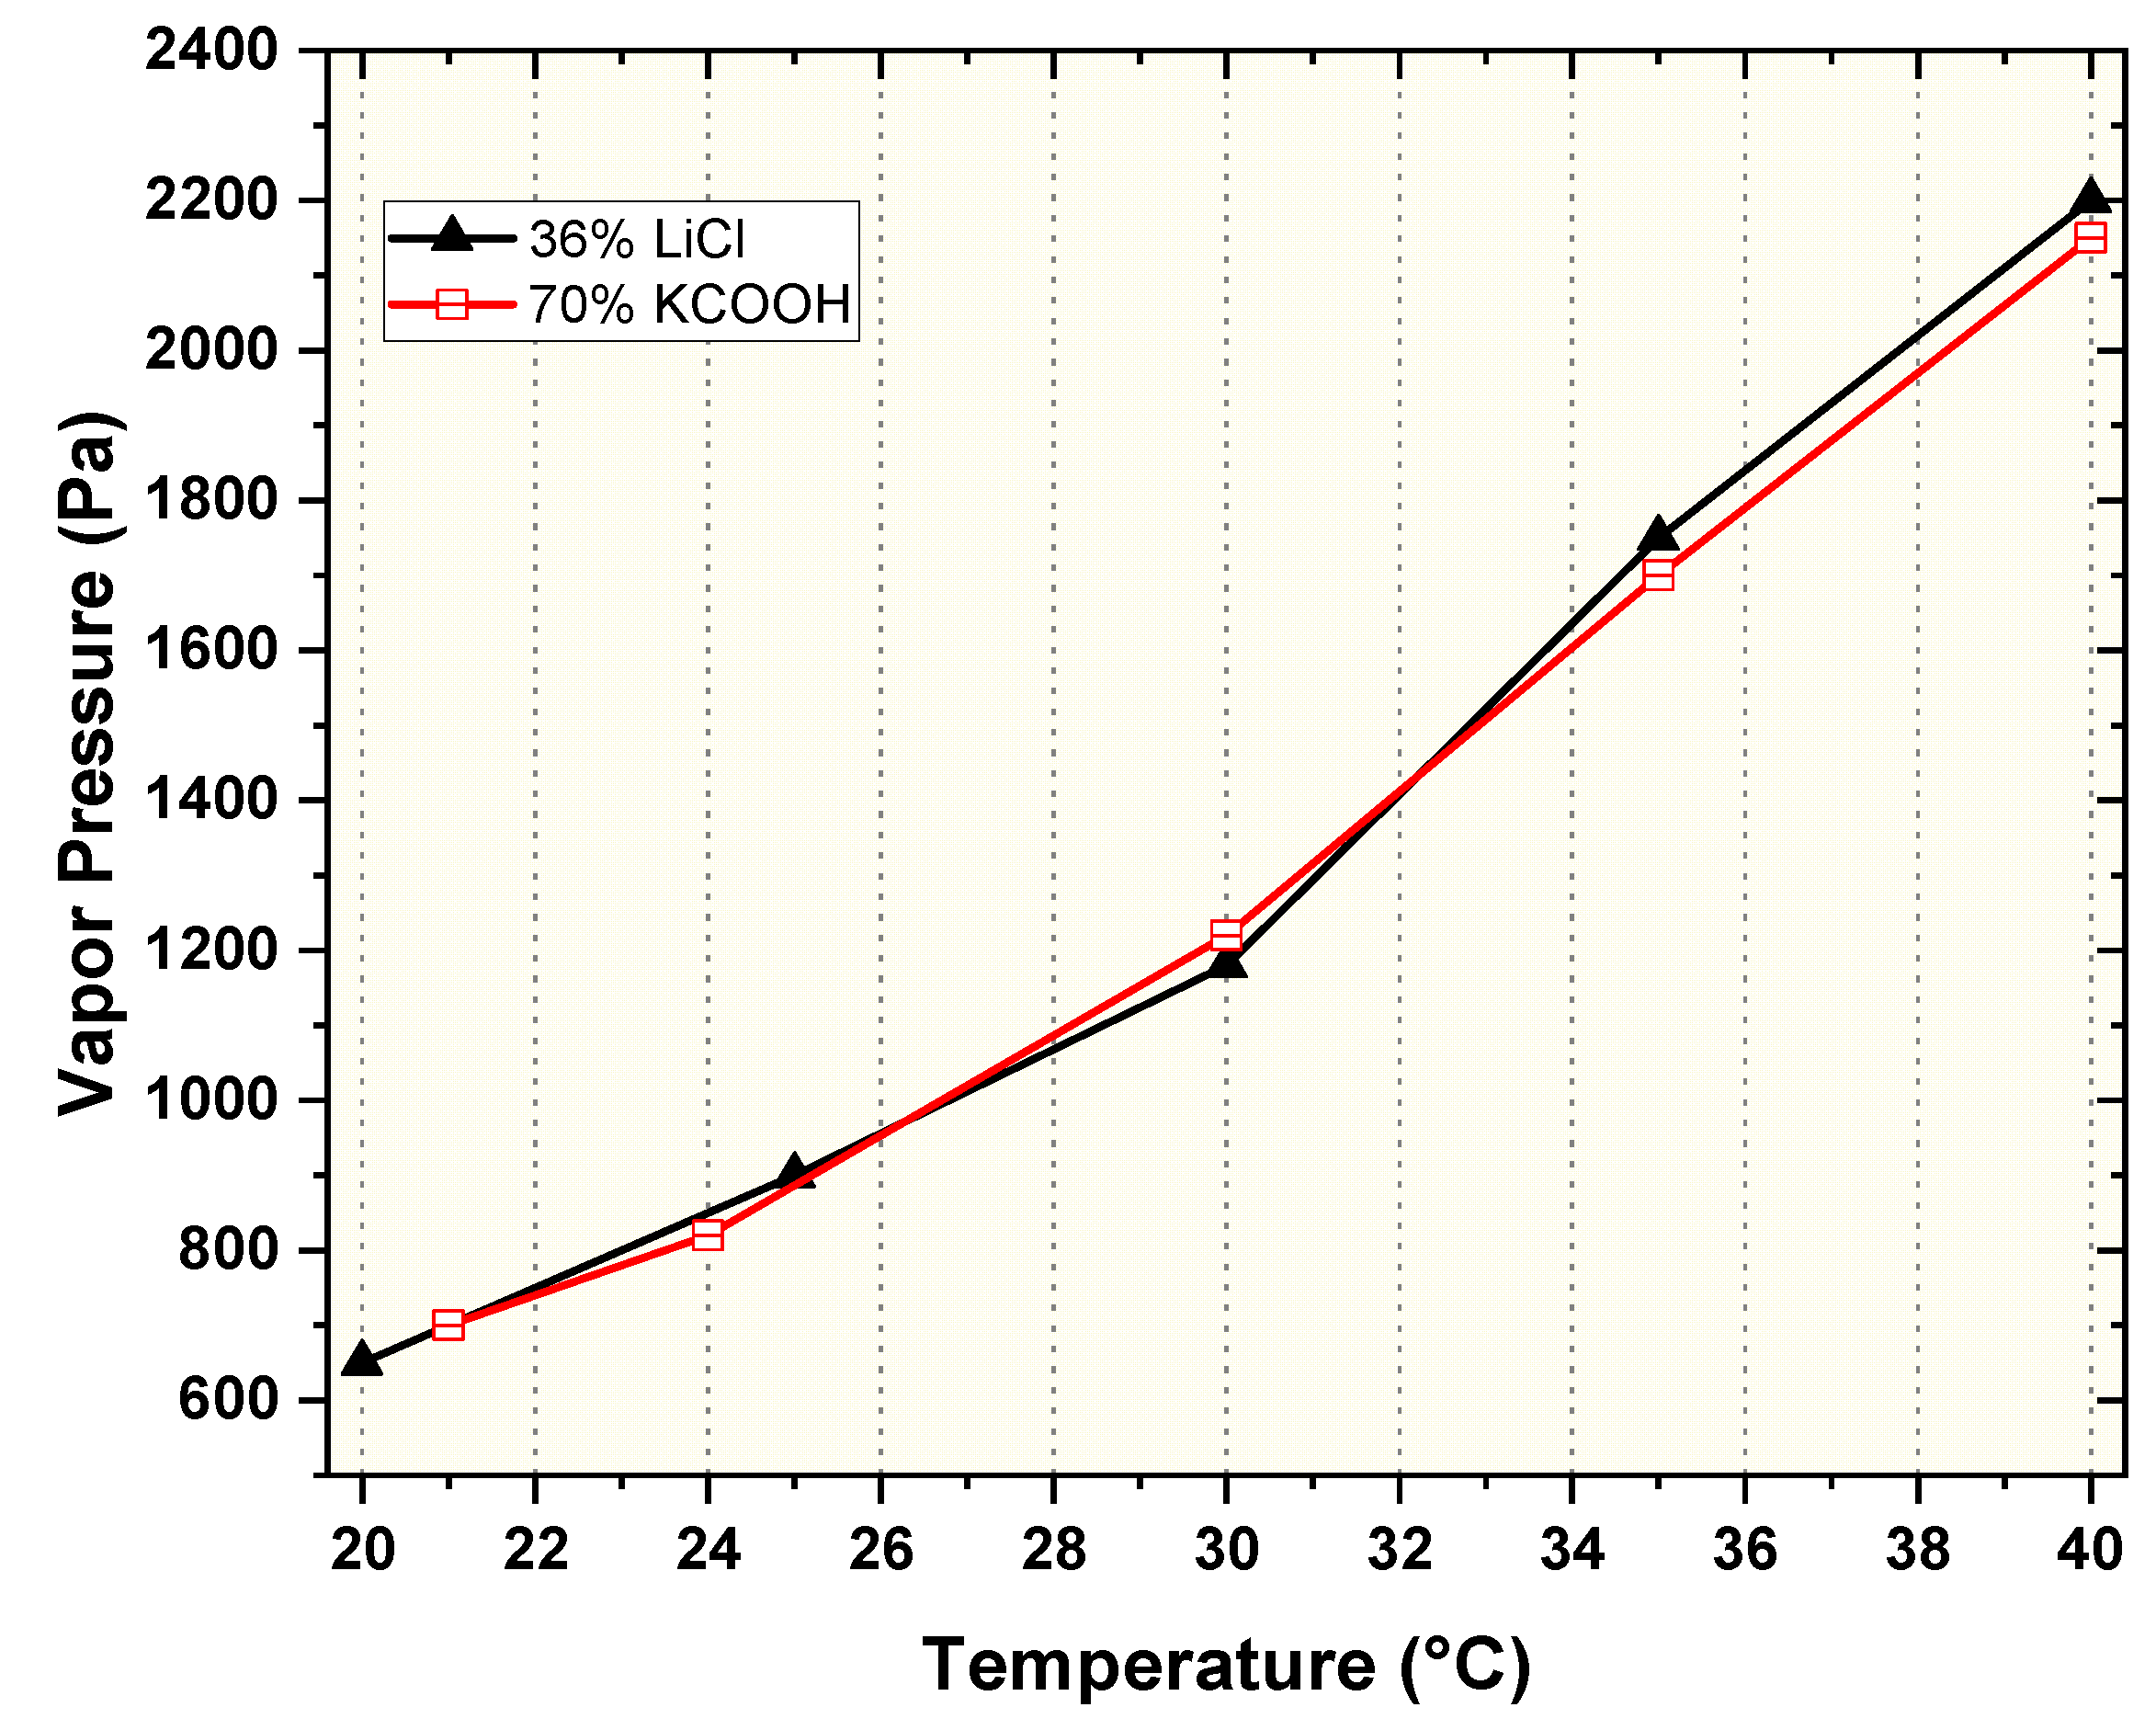
  • The outcome of vapor pressure readings specifies that KCOOH solution with 70% concentration had similar vapor pressure as that of the LiCl solution with 36% concentration, and temperature range was between 20 and 47˚C. The cost of the KCOOH solution was approximately 22% of that of the LiCl solution, resulting in a more economical hybrid system while employing KCOOH as a liquid desiccant.
  • In maximizing the response parameters, it is desirable to have lower T d 1 , lower m ˙ a 1 , and higher w 1 .
  • From the experimental results, the superior dehumidification performance of the hybrid system could be observed while employing the KCOOH solution as compared to the LiCl solution, and KCOOH is highly environmentally friendly; therefore, KCOOH can be on the list of future-generation desiccants.
  • Result analysis showed that the influence of inlet air humidity had a dominating impact on all three response parameters of the hybrid LDAC system as compared to the two other factors of T d 1 and m ˙ a 1 .
  • MARD value of 7.65% was observed within the experimental and anticipated values, demonstrating the reliability of the correlation.
For future research work, many aspects include various different variables or parameters that can be chosen to enhance the dehumidification performance of the KCOOH solution. The developed hybrid LDAC system in this research work can be employed for analysis and comparison of the heat load contributed by the dehumidifier unit and stand-alone conventional VCR system. Additionally, the developed hybrid LDAC system can be utilized in hospitals and quarantine centers for the treatment of air in negative pressure rooms (NPR). In such a structure, air can be continuously supplied through a duct, and the liquid desiccant absorbs moisture with viruses in the dehumidifier unit. Afterwards, the infected or degenerated liquid desiccant solution can be regenerated or disinfected in a regeneration process where the COVID-19 virus can be killed.

Author Contributions

Conceptualization, methodology, software, validation, formal analysis, investigation, resources, K.K.; data curation, writing—original draft preparation, writing—review and editing, visualization, supervision, A.S.; Conceptualization, project administration, funding acquisition, S.S., C.A.S., A.A. and M.B. All authors have read and agreed to the published version of the manuscript.

Funding

This research is supported by the Structures and Materials (S&M) Research Lab of Prince Sultan University, and the authors acknowledge the support of Prince Sultan University for paying the article processing charges (APC) of this publication.

Institutional Review Board Statement

Not applicable.

Informed Consent Statement

Not applicable.

Data Availability Statement

Not applicable.

Acknowledgments

The authors extend their appreciation to the Deanship of Scientific Research at King Khalid University, Saudi Arabia for funding this work through Research Group Program under grant no. RGP 2/26/43.

Conflicts of Interest

The authors declare no conflict of interest.

Abbreviations

ACAir conditioner
COPCoefficient of performance
C O P H y b r i d Coefficient of performance of a hybrid system
DOEDesign of experiments
D1 D4Desiccant solution state points
LDACLiquid desiccant air-conditioner
MARDMean absolute relative deviation
TRTon of refrigeration
VCRVapor compression refrigeration
Subscripts
A1 A7Air state points
C p a Isobaric specific heat (kJ/kg.K)
C1Concentration of LiCl solution
C2Concentration of KCOOH solution
hpHeat pump
h f g Latent heat of evaporation (kJ/kg)
Δ h a b s Absorption enthalpy (kJ/kg)
Δ h d i l Enthalpy of dilution (kJ/kg)
m ˙ a 11 Inlet airflow rate at level 1
m ˙ a 12 Inlet airflow rate at level 2
m ˙ a 13 Inlet airflow rate at level 3
syssystem
T Temperature (K)
T d 11 Inlet desiccant temperature at level 1
T d 12 Inlet desiccant temperature at level 2
T d 13 Inlet desiccant temperature at level 3
w 11 Inlet air humidity at level 1
w 12 Inlet air humidity at level 2
w 13 Inlet air humidity at level 3
Δ w Specific humidity change
w Specific humidity
Relative humidity

References

  1. Bluyssen, P.M.; Cox, C. Indoor environment quality and upgrading of European office buildings. Energy Build. 2002, 34, 155–162. [Google Scholar] [CrossRef]
  2. Air Conditioners to Burn up Your Electricity Bill by 2030—The Financial Express. Available online: https://www.financialexpress.com/industry/air-conditioners-to-burn-up-your-electricity-bill-by-2030/1385105/ (accessed on 20 January 2021).
  3. Jani, D.B.; Mishra, M.; Sahoo, P.K. Solid desiccant air conditioning—A state of the art review. Renew. Sustain. Energy Rev. 2016, 60, 1451–1469. [Google Scholar] [CrossRef]
  4. Pintaldi, S.; Perfumo, C.; Sethuvenkatraman, S.; White, S.; Rosengarten, G. A review of thermal energy storage technologies and control approaches for solar cooling. Renew. Sustain. Energy Rev. 2015, 41, 975–995. [Google Scholar] [CrossRef]
  5. Luo, Y.; Shao, S.; Xu, H.; Tian, C. Dehumidification performance of [EMIM] BF4. Appl. Therm. Eng. 2011, 31, 2772–2777. [Google Scholar] [CrossRef]
  6. Rafique, M.M.; Gandhidasan, P.; Bahaidarah, H.M.S. Liquid desiccant materials and dehumidifiers—A review. Renew. Sustain. Energy Rev. 2016, 56, 179–195. [Google Scholar] [CrossRef]
  7. Sharma, A.; Kaushal, R. Experimental investigation of a novel multi-channel flat plate liquid desiccant dehumidification system. Energy Sources Part A Recover. Util. Environ. Eff. 2020, 1–19. [Google Scholar] [CrossRef]
  8. Sharma, A.; Kaushal, R. Experimental and statistical analysis of relative humidity and temperature of moist air in a flat Plate multi-layer desiccant cooling system. Energy Sources Part A Recover. Util. Environ. Eff. 2021, 1–19. [Google Scholar] [CrossRef]
  9. Mei, L.; Dai, Y. A technical review on use of liquid-desiccant dehumidification for air-conditioning application. Renew. Sustain. Energy Rev. 2008, 12, 662–689. [Google Scholar] [CrossRef]
  10. Gao, W.Z.; Liu, J.H.; Cheng, Y.P.; Zhang, X.L. Experimental investigation on the heat and mass transfer between air and liquid desiccant in a cross-flow dehumidifier. Renew. Energy 2012, 37, 117–123. [Google Scholar] [CrossRef]
  11. Salah Hassan, M.; Hassan, A.A.M. Performance of a proposed complete wetting surface counter flow channel type liquid desiccant air dehumidifier. Renew. Energy 2009, 34, 2107–2116. [Google Scholar] [CrossRef]
  12. Liu, X.; Qu, K.; Jiang, Y. Empirical correlations to predict the performance of the dehumidifier using liquid desiccant in heat and mass transfer. Renew. Energy 2006, 31, 1627–1639. [Google Scholar] [CrossRef]
  13. Qiu, G.; Liu, H.; Riffat, S.B. Experimental investigation of a liquid desiccant cooling system driven by flue gas waste heat of a biomass boiler. Int. J. Low-Carbon Technol. 2013, 8, 165–172. [Google Scholar] [CrossRef]
  14. Liang, J.-D.; Huang, B.-H.; Chiang, Y.-C.; Chen, S.-L. Experimental investigation of a liquid desiccant dehumidification system integrated with shallow geothermal energy. Energy 2020, 191, 116452. [Google Scholar] [CrossRef]
  15. Khalil, A. An experimental study on multi-purpose desiccant integrated vapor-compression air-conditioning system. Int. J. Energy Res. 2012, 36, 535–544. [Google Scholar] [CrossRef]
  16. Yamaguchi, S.; Jeong, J.; Saito, K.; Miyauchi, H.; Harada, M. Hybrid liquid desiccant air-conditioning system: Experiments and simulations. Appl. Therm. Eng. 2011, 31, 3741–3747. [Google Scholar] [CrossRef]
  17. Lof GOG, Cooling with Solar Energy, Congress on Solar… Google Scholar. Available online: https://scholar.google.com/scholar?hl=en&as_sdt=0%2C5&q=Lof+GOG%2C+Cooling+with+Solar+Energy%2C+Congress+on+Solar+Energy%2C+1955%2C+pp.+117e189&btnG= (accessed on 25 January 2021).
  18. Zurigat, Y.H.; Abu-Arabi, M.K.; Abdul-Wahab, S.A. Air dehumidification by triethylene glycol desiccant in a packed column. Energy Convers. Manag. 2004, 45, 141–155. [Google Scholar] [CrossRef]
  19. Jain, S.; Bansal, P.K. Performance analysis of liquid desiccant dehumidification systems. Int. J. Refrig. 2007, 30, 861–872. [Google Scholar] [CrossRef]
  20. Abdul-Wahab, S.; Zurigat, Y.; Abu-Arabi, M. Predictions of moisture removal rate and dehumidification effectiveness for structured liquid desiccant air dehumidifier. Energy 2004, 29, 19–34. [Google Scholar] [CrossRef]
  21. Elsarrag, E.; Ali, E.E.M.; Jain, S. Design Guidelines and performance study on a structured packed liquid desiccant air-conditioning system. HVAC&R Res. 2005, 11, 319–337. [Google Scholar] [CrossRef]
  22. Conde, M.R. Properties of aqueous solutions of lithium and calcium chlorides: Formulations for use in air conditioning equipment design. Int. J. Therm. Sci. 2004, 43, 367–382. [Google Scholar] [CrossRef]
  23. Shukla, D.L.; Modi, K.V. A technical review on regeneration of liquid desiccant using solar energy. Renew. Sustain. Energy Rev. 2017, 78, 517–529. [Google Scholar] [CrossRef]
  24. Yin, Y.; Qian, J.; Zhang, X. Recent advancements in liquid desiccant dehumidification technology. Renew. Sustain. Energy Rev. 2014, 31, 38–52. [Google Scholar] [CrossRef]
  25. Kaita, Y. Thermodynamic properties of lithium bromide–water solutions at high temperatures. Int. J. Refrig. 2001, 24, 374–390. [Google Scholar] [CrossRef]
  26. Pátek, J.; Klomfar, J. A computationally effective formulation of the thermodynamic properties of LiBr–H2O solutions from 273 to 500K over full composition range. Int. J. Refrig. 2006, 29, 566–578. [Google Scholar] [CrossRef]
  27. Mehta, J.R.; Shah, N.M.; Patel, K.N. A review on internally cooled liquid desiccant air dehumidifier. In Proceedings of the International Conference on Recent Trends in Engineering and Technology (ICRTET 2016), Nasik, India, 28–30 April 2016; pp. 5–10. [Google Scholar]
  28. Abdel-Salam, A.H.; Simonson, C.J. State-of-the-art in liquid desiccant air conditioning equipment and systems. Renew. Sustain. Energy Rev. 2016, 58, 1152–1183. [Google Scholar] [CrossRef]
  29. Abdel-Salam, M.R.; Besant, R.W.; Simonson, C.J. Sensitivity of the performance of a flat-plate liquid-to-air membrane energy exchanger (LAMEE) to the air and solution channel widths and flow maldistribution. Int. J. Heat Mass Transf. 2015, 84, 1082–1100. [Google Scholar] [CrossRef]
  30. Abdel-Salam, M.R.; Besant, R.W.; Simonson, C.J. Performance testing of a novel 3-fluid liquid-to-air membrane energy exchanger (3-fluid LAMEE) under desiccant solution regeneration operating conditions. Int. J. Heat Mass Transf. 2016, 95, 773–786. [Google Scholar] [CrossRef]
  31. Luo, C.; Su, Q.; Mi, W. Thermophysical properties and application of LiNO3–H2O working fluid. Int. J. Refrig. 2013, 36, 1689–1700. [Google Scholar] [CrossRef]
  32. Abdel-Salam, M.R.; Fauchoux, M.; Ge, G.; Besant, R.W.; Simonson, C.J. Expected energy and economic benefits, and environmental impacts for liquid-to-air membrane energy exchangers (LAMEEs) in HVAC systems: A review. Appl. Energy 2014, 127, 202–218. [Google Scholar] [CrossRef]
  33. Wang, Z.; Zhang, X.; Li, Z. Investigation on the coupled heat and mass transfer process between extremely high humidity air and liquid desiccant in the counter-flow adiabatic packed tower. Int. J. Heat Mass Transf. 2017, 110, 898–907. [Google Scholar] [CrossRef]
  34. Riffat, S.B.; James, S.E.; Wong, C.W. Experimental analysis of the absorption and desorption rates of hcook/H2O and LiBr/H2O. Int. J. Energy Res. 1998, 22, 1099–1103. [Google Scholar] [CrossRef]
  35. Dean, J.A. Lange’s Handbook of Chemistry; McGraw-Hill, Inc.: New York, NY, USA, 1999. [Google Scholar]
  36. Wen, T.; Luo, Y.; Sheng, L. Experimental study on the corrosion behavior and regeneration performance of KCOOH aqueous solution. Sol. Energy 2020, 201, 638–648. [Google Scholar] [CrossRef]
  37. Ertas, A.; Anderson, E.; Kiris, I. Properties of a new liquid desiccant solution—Lithium chloride and calcium chloride mixture. Sol. Energy 1992, 49, 205–212. [Google Scholar] [CrossRef]
  38. Wang, H.; Cheng, Q.; Feng, W.; Xu, W. Experimental and theoretical research on the electrical conductivity of a liquid desiccant for the liquid desiccant air-conditioning system: LiCl aqueous solution. Int. J. Refrig. 2018, 91, 189–198. [Google Scholar] [CrossRef]
  39. Liu, X.; Yi, X.; Jiang, Y. Mass transfer performance comparison of two commonly used liquid desiccants: LiBr and LiCl aqueous solutions. Energy Convers. Manag. 2011, 52, 180–190. [Google Scholar] [CrossRef]
  40. Antony, J. Design of Experiments for Engineers and Scientists. Google Books. Available online: https://books.google.co.in/books?hl=en&lr=&id=p7pCAgAAQBAJ&oi=fnd&pg=PP1&dq=J.+Antony,+Design+of+Experiments+for+Engineers+and+Scientists,+Elsevier,&ots=BEoXVWuBMp&sig=uCaVIt5VXy4S04rHSuTKFNw2NYk#v=onepage&q=J.%20Antony%2C%20Design%20of%20Experiments%20for%20Engineers%20and%20Scientists%2C%20Elsevier%2C&f=false (accessed on 6 February 2021).
  41. Kumar, R.; Dhar, P.; Jain, S. Development of new wire mesh packings for improving the performance of zero carryover spray tower. Energy 2011, 36, 1362–1374. [Google Scholar] [CrossRef]
  42. Afzal, A.; Samee, A.D.M.; Javad, A.; Shafvan, S.A.; Ajinas, P.V.A.; Kabeer, K.M.A. Heat transfer analysis of plain and dimpled tubes with different spacings. Heat Transf.-Asian Res. 2017, 47, 556–568. [Google Scholar] [CrossRef]
  43. Soudagar, M.E.M.; Afzal, A.; Safaei, M.R.; Manokar, A.M.; El-Seesy, A.I.; Mujtaba, M.A.; Samuel, O.D.; Badruddin, I.A.; Ahmed, W.; Shahapurkar, K.; et al. Investigation on the effect of cottonseed oil blended with different percentages of octanol and suspended MWCNT nanoparticles on diesel engine characteristics. J. Therm. Anal. 2020, 147, 525–542. [Google Scholar] [CrossRef]
  44. Soudagar, M.E.M.; Afzal, A.; Kareemullah, M. Waste coconut oil methyl ester with and without additives as an alternative fuel in diesel engine at two different injection pressures. Energy Sources Part A Recover. Util. Environ. Eff. 2020, 1–19. [Google Scholar] [CrossRef]
  45. Verma, T.N.; Nashine, P.; Chaurasiya, P.K.; Rajak, U.; Afzal, A.; Kumar, S.; Singh, D.V.; Azad, A.K. The effect of ethanol-diesel-biodiesel blends on combustion, performance and emissions of a direct injection diesel engine. Sustain. Energy Tech-Nologies Assess. 2020, 42, 100851. [Google Scholar] [CrossRef]
  46. Afzal, A.; Aabid, A.; Khan, A.; Khan, S.A.; Rajak, U.; Verma, T.N.; Kumar, R. Response surface analysis, clustering, and random forest regression of pressure in suddenly expanded high-speed aerodynamic flows. Aerosp. Sci. Technol. 2020, 107, 106318. [Google Scholar] [CrossRef]
  47. Afzal, A.; Saleel, C.A.; Badruddin, I.A.; Khan, T.Y.; Kamangar, S.; Mallick, Z.; Samuel, O.D.; Soudagar, M.E. Human thermal comfort in passenger vehicles using an organic phase change material—An experimental investigation, neural network modelling, and optimization. Build. Environ. 2020, 180, 107012. [Google Scholar] [CrossRef]
  48. Aneeque, M.; Alshahrani, S.; Kareemullah, M.; Afzal, A.; Saleel, C.; Soudagar, M.; Hossain, N.; Subbiah, R.; Ahmed, M. The combined effect of alcohols and Calophyllum inophyllum biodiesel using response surface methodology optimization. Sustainability 2021, 13, 7345. [Google Scholar] [CrossRef]
  49. Afzal, A.; Mokashi, I.; Khan, S.A.; Abdullah, N.A.; Bin Azami, M.H. Optimization and analysis of maximum temperature in a battery pack affected by low to high Prandtl number coolants using response surface methodology and particle swarm optimization algorithm. Numer. Heat Transf. Part A Appl. 2020, 79, 406–435. [Google Scholar] [CrossRef]
  50. Chandrashekar, A.; Chaluvaraju, B.V.; Afzal, A.; Vinnik, D.A.; Kaladgi, A.; Alamri, S.; Ahamed, S.C.; Tirth, V. Mechanical and corrosion studies of friction stir welded nano Al2O3 reinforced Al-Mg matrix composites: RSM-ANN modelling approach. Symmetry 2021, 13, 537. [Google Scholar] [CrossRef]
Figure 1. Vapor pressure measurement test rig.
Sustainability 14 03441 g001
Figure 2. KCOOH solution vapor pressure.
Sustainability 14 03441 g002
Figure 3. Vapor pressure comparison between LiCl and KCOOH solutions.
Sustainability 14 03441 g003
Figure 4. Experimental setup.
Sustainability 14 03441 g004
Figure 5. General scheme for conducting experiments using DOE methodology.
Sustainability 14 03441 g005
Figure 6. Flowchart of full factorial methodology.
Sustainability 14 03441 g006
Figure 7. Main effects plot for Δ w response.
Sustainability 14 03441 g007
Figure 8. Contour plots for Δ w response. (a) Contour plots for Δ w vs T d 1 and m ˙ a 1 , (b) Contour plots for Δ w vs w 1 and m ˙ a 1 ,   and   (c) Contour plots for Δ w vs w 1 and T d 1 .
Sustainability 14 03441 g008aSustainability 14 03441 g008b
Figure 9. Main effects plot for Q d response.
Sustainability 14 03441 g009
Figure 10. Contour plots for Q d response. (a) Contour plots for Q d   vs T d 1 and m ˙ a 1 ,   (b) Contour plots for Q d vs w 1 and m ˙ a 1 ,   a n d   (c) Contour plots for Q d vs w 1 and T d 1 .
Sustainability 14 03441 g010aSustainability 14 03441 g010b
Figure 11. Main effects plot for C O P H y b r i d response.
Sustainability 14 03441 g011
Figure 12. Contour plots for C O P H y b r i d response. (a) Contour plots for C O P H y b r i d vs T d 1 and m ˙ a 1 ,   (b) Contour plots for C O P H y b r i d vs w 1 and m ˙ a 1 ,   and   (c) Contour plots for C O P H y b r i d vs w 1 and T d 1 .
Sustainability 14 03441 g012aSustainability 14 03441 g012b
Table 1. Laboratory validation of measurement of water vapor pressure.
T (°C)20222427303337414447
Exp. (Pa)22892679298435404202498561597627895510,489
Ref. (Pa)2333263929863559−4239502662797772910510,612
MD (%)1.921.490.060.530.880.821.941.901.671.17
Table 2. Measured parameters and specifications of used instruments.
ParametersInstrumentsRange of MeasurementAccuracy
TemperaturePT-100 RTD−50 to 200 °C ± 0.1 °C
Air relative humidityMultispan MTC-11010–100% ± 1%
Solution densitySpecific gravity hydrometer1.0–2.0 (specific gravity) ± 1 Kg/m3
Air velocityAnemometer HTC AVM-060.8–30 m/s ± 2%
Airflow rateAnemometer HTC AVM-060 ~ 9999 m3/min-
Table 3. Uncertainties associated with calculated parameters.
ParametersRangeUncertainties
Relative air humidity (%)40–70 ± 1
Air temperature (°C)20–45 ± 0.2
Desiccant inlet temperature, T d 1 (°C)15–45 ± 0.3
Solution concertation ± 0.2%
Humidity, w (gm/kg of dry air) ± 2.455%
COP of hybrid system, COPhybrid ± 5.554 %
Dehumidifier heat load, Q d   (kJ/kg) ± 5.323%
Table 4. Experimental parameters and their values.
SI. NoParametersUnitsLow LevelMedium LevelHigh Level
1Type of desiccant36% LiCl70% KCOOH
2Inlet air flow rate m a 1 ( kg / s ) kg/s0.050.070.09
3Inlet desiccant temperature T d 1 (°C)°C323538
4Inlet air humidity w 1 ( g / kg ) g/Kg162024
Table 5. DOE model using full factorial design.
Run OrderDesiccant Type m a 1 T d 1 w 1
170% KCOOH0.073816
270% KCOOH0.053824
370% KCOOH0.073824
436% LiCl0.093216
570% KCOOH0.093824
670% KCOOH0.053220
770% KCOOH0.073220
836% LiCl0.053524
936% LiCl0.053224
1070% KCOOH0.053216
1136% LiCl0.093224
1236% LiCl0.073516
1370% KCOOH0.053816
1470% KCOOH0.053820
1536% LiCl0.093516
1670% KCOOH0.093224
1770% KCOOH0.093516
1836% LiCl0.073224
1970% KCOOH0.093220
2070% KCOOH0.053224
2136% LiCl0.073820
2270% KCOOH0.073524
2336% LiCl0.073216
2436% LiCl0.073524
2536% LiCl0.053220
2670% KCOOH0.093216
2736% LiCl0.053820
2836% LiCl0.073816
2936% LiCl0.053520
3036% LiCl0.093820
3170% KCOOH0.073224
3236% LiCl0.093824
3370% KCOOH0.093816
3470% KCOOH0.053524
3570% KCOOH0.053516
3636% LiCl0.073824
3770% KCOOH0.073216
3870% KCOOH0.093524
3970% KCOOH0.073820
4036% LiCl0.073220
4136% LiCl0.053516
4270% KCOOH0.073520
4336% LiCl0.073520
4436% LiCl0.053816
4536% LiCl0.093220
4636% LiCl0.053216
4736% LiCl0.093520
4870% KCOOH0.093520
4970% KCOOH0.093820
5070% KCOOH0.053520
5170% KCOOH0.073516
5236% LiCl0.093816
5336% LiCl0.053824
5436% LiCl0.093524
Table 6. Response obtained after applying full factorial design.
Run OrderParametersResult
Type of Desiccant m a 1 Inlet Desiccant TemperatureInlet Air Humidity Δ w Q d C O P H y b r i d
170% KCOOH0.0738164.7811.2311.799
270% KCOOH0.0538247.917.342.12
370% KCOOH0.0738245.1312.3251.893
436% LiCl0.0932164.5111.9981.851
570% KCOOH0.0938246.115.1561.912
670% KCOOH0.0532208.1221.8532.117
770% KCOOH0.0732206.98717.1532.123
836% LiCl0.0535247.2115.1561.912
936% LiCl0.0532248.9824.4562.182
1070% KCOOH0.0532165.914.1691.89
1136% LiCl0.0932247.921.04672.105
1236% LiCl0.0735163.357.8671.789
1370% KCOOH0.0538166.2315.1321.902
1470% KCOOH0.0538204.19.3421.834
1536% LiCl0.0935164.5612.1271.729
1670% KCOOH0.0932248.122.54672.211
1770% KCOOH0.0935165.2313.5631.799
1836% LiCl0.0732247.5917.5691.959
1970% KCOOH0.0932207.114.231.989
2070% KCOOH0.0532249.5625.1562.256
2136% LiCl0.0738204.139.8691.756
2270% KCOOH0.0735247.1217.2562.154
2336% LiCl0.0732165.2514.9871.894
2436% LiCl0.0735246.616.7862.0156
2536% LiCl0.0532207.2920.2392.089
2670% KCOOH0.0932165.1312.5621.978
2736% LiCl0.0538203.728.8561.794
2836% LiCl0.0738164.279.7791.671
2936% LiCl0.0535205.213.1121.898
3036% LiCl0.0938202.917.23921.765
3170% KCOOH0.0732248.8519.1252.019
3236% LiCl0.0938245.8214.89561.865
3370% KCOOH0.0938165.1211.1121.725
3470% KCOOH0.0535248.1317.561.989
3570% KCOOH0.0535165.2314.5691.956
3636% LiCl0.0738244.2510.2351.823
3770% KCOOH0.0732166.1215.7891.912
3870% KCOOH0.0935245.9514.6711.998
3970% KCOOH0.0738204.9811.5791.813
4036% LiCl0.0732206.2516.4581.933
4136% LiCl0.0535164.8913.2311.823
4270% KCOOH0.0735205.113.5671.913
4336% LiCl0.0735204.7512.1361.834
4436% LiCl0.0538165.4613.9821.812
4536% LiCl0.0932206.5613.561.952
4636% LiCl0.0532165.2313.8921.85
4736% LiCl0.0935204.5612.0991.808
4870% KCOOH0.0935205.112.9871.897
4970% KCOOH0.0938203.247.9561.812
5070% KCOOH0.0535205.514.5671.987
5170% KCOOH0.0735164.18.5671.814
5236% LiCl0.0938164.119.5761.615
5336% LiCl0.053824716.86781.984
5436% LiCl0.0935245.1713.5691.926
Table 7. Regression correlations evolving from variable-response performance.
Regression Correlation
Δ w = 5.786 + [ 0.322   ×   C 2 ]   + [ 0.322   ×   C 1 ] + [ 0.639   ×   m ˙ a 11 ] [ 0.252   ×   m ˙ a 12 ] [ 0.387   ×   m ˙ a 13 ] + [ 1.182   ×   T d 11 ] [ 0.355   ×   T d 12 ] [ 0.827   ×   T d 13 ] [ 0.815   ×   w 11 ] [ 0.475   ×   w 12 ] + [ 1.290   ×   w 13 ]
Q d = 3.7459 + [ 0.0740   ×   C 2 ] [ 0.0740   ×   C 1 ] + [ 0.2283   ×   m ˙ a 11 ] [ 0.1075   ×   m ˙ a 12 ] [ 0.1208   ×   m ˙ a 13 ] + [ 0.4226   ×   T d 11 ] [ 0.0855   ×   T d 12 ] [ 0.3371   ×   T d 13 ] [ 0.2330   ×   w 11 ] [ 0.1569   ×   w 12 ] + [ 0.3899   ×   w 13 ]
C O P H y b r i d = 0.27656 + [ 0.01162   ×   C 2 ] [ 0.01162   ×   C 1 ] + [ 0.01456   ×   m ˙ a 11 ] [ 0.00521   ×   m ˙ a 12 ] [ 0.00935   ×   m ˙ a 13 ] + [ 0.02814   ×   T d 11 ] [ 0.00207   ×   T d 12 ] [ 0.02607   ×   T d 13 ] [ 0.02686   ×   w 11 ] [ 0.00146   ×   w 12 ] + [ 0.02832   ×   w 13 ]
Table 8. ANOVA of regression model.
Δ w Q d C O P H y b r i d
Sum of Square Valuesp-ValueSum of Square Valuesp-ValueSum of Squares Valuesp-Value
Model127.478<0.0001874.041<0.00010.98190<0.0001
Desiccant type5.598<0.000116.089<0.00010.08780<0.0001
m ˙ a 1 11.201<0.000185.009<0.00010.07031<0.0001
T d 1 39.760<0.0001318.988<0.00010.32877<0.0001
w 1 45.964<0.0001248.956<0.00010.34548<0.0001
m ˙ a 1 × T d 1 0.3770.0469.196<0.00010.02924<0.0001
m ˙ a 1 × w 1 2.992<0.000121.801<0.00010.006080.175
T d 1 × w 1 13.137<0.000171.737<0.00010.015030.009
m ˙ a 1 × T d 1 × w 1 8.447<0.0001102.265<0.00010.09919<0.0001
Δ w Q d C O P H y b r i d
R2 value99.32% 99.53% 97.72%
Publisher’s Note: MDPI stays neutral with regard to jurisdictional claims in published maps and institutional affiliations.

