
A Conceptual Model for Measuring a Circular Economy of Seaports: A Case Study on Antwerp and Koper Ports


Abstract
:1. Introduction
2. A Literature Review
3. Methods
3.1. Identification and Definition of Circular Economy Indicators
- the indicator is made up of a definition, a value, and a measurement unit
- the indicator is relevant to measure a circular economy
- indicators are objective (assuring open accessibility) and expressed in a quantitative term
- the indicator is linked to the circular economy policies or strategic dimensions
- the indicator is based on needs and interventions
- the evaluation methodology is designed in a transparent way and with high-quality indicators and data
- simplified one-dimensional information about the circularity of the seaports give an added value, compared to the individual indicators
- the weighing methods are transparent and statistically reliable
3.2. Grouping and Sorting Process
- The economic dimension, where the main focus lies in creating economic welfare and advantages for the ports while including the main principles of circularity and promoting the transition from linear activities into circular ones (e.g., waste management in ports, producing electricity with alternatives).
- The environmental dimension, with the focus on reducing the environmental impacts of port activities in the port area and its vicinity, contributes to increasing biodiversity and mitigating the damage to the environment (e.g., cleaning operations, reducing bad economic practices).
- The social dimension, which focuses on creating equality in the workforce and workplace, enabling further education and promotion among workers, and promoting the inclusion and integration of political, communal, and social entities within the port— all in the direction of promoting the circular economy (e.g., enabling different types of transport to work, funding activities and projects that encourage circularity in nearby communities).
3.3. Determining Weights by Using an Analytical Hierarchy Process
3.4. Obtaining Seaports’ Data and Their Normalisation
- (1)
- a secondary review of the literature provided in Table 1 focused on the identification of seaports’ data meaningful for further calculations of indicators and final seaport circularity
- (2)
- a secondary review of existing literature (e.g., scientific papers) as well as a Google search for calculating proposed indicators (In)
- (3)
- phone calls to the seaports listed in Table 1 in search of personnel responsible for circular economy and sustainability activities. After acquiring the email addresses, a short questionnaire was prepared and sent to each of the five mentioned seaports and their personnel.
4. Results
4.1. Results from the Weighing Process
4.2. Calculation of the Circularity Value of the Case-Study Seaports
- the seaports did not provide such data or the statistical data for the mentioned indicator and open access (e.g., annual reports), and they could not be obtained from the available literature and websites that are freely accessible, and
- the seaports do not have such activities on the premise of their seaport area, and as such do not provide statistical data.
5. Discussion and Conclusions
Author Contributions
Funding
Institutional Review Board Statement
Informed Consent Statement
Data Availability Statement
Acknowledgments
Conflicts of Interest
Appendix A

| Indicator | Port of Koper—Indicator Values | Port of Antwerp—Indicator Values |
|---|---|---|
| I1 | 70% [46,59] | 67% [31] |
| I2 | 9% [46,59] | 84% [33] |
| I3 | 18% [46,59] | 36% [33] |
| I4 | n.a. | n.a. |
| I5 | n.a. | 49% [33] |
| I6 | 2% [46] | 18% [33] |
| I7 | n.a. | n.a. |
| I8 | n.a. | n.a. |
| I9 | n.a. | n.a. |
| I10 | n.a. | 24% [33] |
| I11 | n.a. | n.a. |
| I12 | 3.6% [46] | 15% [33] |
| I13 | n.a. | 8% [31] |
| I14 | n.a. | 40% [31] |
| I15 | 35% [45] | 60% [31] |
| I16 | n.a. | n.a. |
| I17 | n.a. | n.a. |
| I18 | n.a. | n.a. |
| I19 | 16% [46] | 25 [31] |
| I20 | 0.0267 Mt/a [46] | 0.5768 Mt/a [33] |
| I21 | n.a. | n.a. |
| I22 | n.a. | n.a. |
| I23 | 0.0050 bn EUR/a [46,60] | 0.0680 bn EUR/a [31,33,61] |
| I24 | 0.0200 bn EUR/a [46,60] | 0.0250 bn EUR/a [31,33,61] |
| I25 | 0.0800 bn EUR/a [46,60] | 0.3670 bn EUR/a [31,33,61] |
| I26 | 5% [46] | 15% [31] |
| I27 | 2% [46] | −3% [31] |
| I28 | n.a. | n.a. |
| I29 | 10% [46] | 20% [31] |
| I30 | No. 3 [60] | No. 4 [61] |
| I31 | 15% [46] | 25% [31] |
Appendix B
| Year | Author | Research Focus |
|---|---|---|
| 2010 | Lukman et al. [62] | Indicators for school education on university |
| 2016 | Instituto Mexicano del Transporte [63] | Methodology for seaport indicators |
| 2016 | Valenzuela-Venegas et al. [64] | Indicators for the assessment of CE in Eco-Industrial parks |
| 2016 | Gearaedts [65] | Indicators for assessing energy adaptiveness in buildings |
| 2016 | Franklin-Johnson et al. [66] | Managerial indicators for CE performance in the resource sector |
| 2016 | Niero et al. [67] | LCA assessment of aluminium cans |
| 2017 | Huysman et al. [68] | Selection of performance indicators in CE with a focus on plastic waste |
| 2018 | Yang et al. [69] | Environmental and economic indicators in industrial parks |
| 2018 | Jacobi et al. [70] | Socio-economic indicators for CE (in the case of Austria) |
| 2018 | Cobo et al. [71] | Circularity indicator of components |
| 2018 | Hens et al. [72] | Cleaner Production and “Corporate Social Responsibility” assessment |
| 2018 | Van Eygen et al. [73] | Collection, selection, and recycling rate of waste |
| 2018 | Paulik [74] | Assessment of CE standard BS 8001:2007 |
| 2018 | Căutişanu et al. [19] | Indicators for recycled resources, education level, waste, etc. |
| 2019 | Zhao et al. [75] | Emergy Sustainability Index |
| 2019 | Williams [29] | Green Space Index in seaports |
| 2019 | Salguero-Puerta et al. [20] | Sustainability indicators for Waste management |
| 2019 | Florinda et al. [21] | Consumption of fossil fuels for energy and environmental impacts |
| 2019 | Kayal et al. [76] | Economic index for the circularity of businesses |
| 2019 | Howard et al. [77] | CE indicators in the regenerative supply chain |
| 2019 | Pieratti et al. [78] | Economic and environmental indicators in the wood industry |
| 2019 | Sterew et al. [79] | Resource prod. and recycling rate of municipal waste indicators |
| 2019 | Niero & Kalbar [80] | Material circularity and lifecycle-based indicators |
| 2019 | Girard & Nocca [81] | Review of tools to measure circularity and CE |
| 2020 | Kristensen & Mosgaard [82] | Micro-level indicators of CE |
| 2020 | Rossi et al. [83] | CE indicators in the plastic, textile, and electronic industry sectors |
| 2020 | Völker et al. [84] | Indicator development on a par with CE policies within EC |
| 2020 | Lindgreen et al. [17] | Methods and Tools for assessing CE |
| 2021 | Nocca et al. [23] | Integration of CE with cultural heritage conservation |
| 2021 | Pacurariu et al. [25] | EU key indicators in transitioning towards CE |
| 2021 | Stavropoulos et al. [85] | Innovation in relation to circularity in economy |
| 2022 | Agrawal et al. [86] | Industry 4.0 integration within CE |
| 2022 | Calzolari et al. [22] | CE indicators for supply chains |
| 2022 | Lindgreen et al. [24] | Assessing practices engaged towards/within CE |
Appendix C
| Expert No. | Gender 1 | Work Place and Working Time | Research Field |
|---|---|---|---|
| 1 | M | Over 40 years’ experience in academia | cleaner production, sustainability, circular economy |
| 2 | M | Over 25 years’ experience in academia | sustainable indicators, LCA, circular economy |
| 3 | F | Over 20 years’ experience in academia | sustainable production and consumption, LCA, circular economy |
| 4 | M | Over 40 years’ experience in academia | cleaner production, sustainable production and consumption, circular economy |
| 5 | M | Over 40 years’ experience in academia | sustainable production and consumption, circular economy, waste management |
| 6 | M | Over 25 years’ experience in academia | sustainable production and consumption, circular economy |
| 7 | F | Over 25 years’ experience in company | sustainable production and consumption, circular economy |
| 8 | F | Over 25 years’ experience in company (port) | sustainability management, circular economy |
| 9 | M | Over 15 years’ experience in company (port) | sustainability management, circular economy |
| 10 | M | Over 20 years’ experience in companies and NGOs | sustainability, circular economy |
| 11 | M | Over 20 years’ experience in academia | sustainability, carbon footprint, circular economy |
| 12 | M | Over 20 years’ experience in academia and companies | sustainability, measuring sustainability, circular economy |
| 13 | M | Over 30 years’ experience in academia | LCA, circular economy |
| 14 | M | Over 30 years’ experience in academia | sustainability engineering, circular economy, environmental technologies |
| 15 | F | Over 30 years’ experience in academia and NGOs | environmental impacts, circular economy |
| 16 | F | Over 10 years’ experience in academia | sustainability, environmental impacts, circular economy |
| 17 | F | Over 7 years’ experience in academia | sustainability, closed loops, environmental impacts |
| 1 | M | Over 6 years’ experience in academia and companies | business processes, LCA, circular economy |
| 19 | M | Over 6 years’ experience in companies | sustainability, circular economy |
| 20 | M | Over 6 years’ experience in companies | sustainability, circular economy |
| 21 | F | Over 7 years’ experience in academia and companies | sustainability management, circular economy |
| 22 | M | Over 30 years’ experience in academia | sustainability, circular economy |
| 23 | F | Over 30 years’ experience in industry | environmental protection, circular economy |
| 24 | M | Over 10 years’ experience in industry and NGO | sustainability, circular economy |
| 25 | F | Over 20 years’ experience in NGO | sustainability, climate change, circular economy |
| 26 | M | Over 20 years’ experience in industry | recycling, circular economy |
| 27 | F | Over 20 years’ experience in academia and research | sustainability, circular economy |
| 28 | M | Over 30 years’ experience in industry | recycling, circular economy |
| 29 | F | Over 30 years’ experience in industry, academia, NGOs | climate change, raw materials, circular economy |
| 30 | F | Over 15 years’ experience in industry | eco-design, sustainability, circular economy |
References
- Kopnina, H.; Shoreman-Ouimer, E. Sustainability—Key Issues, 1st ed.; Routledge: London, UK, 2015; pp. 1–410. [Google Scholar]
- European Commission. Communication from the Commission to the European Parliament, the Council, the European Economic and Social Committee and the Committee of the Regions—The European Green Deal COM (2019) 640 Final. Available online: https://eur-lex.europa.eu/legal-content/EN/LSU/?uri=COM:2019:640:FIN (accessed on 5 January 2022).
- ESPO. ESPO’s Roadmap to Implement the European Green Deal Objectives in Ports. 2020. Available online: https://www.espo.be/media/ESPO%20Green%20Deal%20position%20paper%20Green%20Deal-FINAL.pdf (accessed on 5 January 2022).
- Carpenter, A.; Lozano, R.; Sammalisto, K.; Astner, L. Securing a port’s future through Circular Economy: Experiences from the Port of Gavle in contributing to sustainability. Mar. Pollut. Bull. 2018, 128, 539–547. [Google Scholar] [CrossRef] [PubMed]
- Mańkowska, M.; Kotowska, I.; Pluciński, M. Seaports as Nodal Points of Circular Supply Chains: Opportunities and Challenges for Secondary Ports. Sustainability 2020, 12, 3926. [Google Scholar] [CrossRef]
- Haezendonck, E.; Van den Berghe, K. Patterns of Circular Transition: What Is the Circular Economy Maturity of Belgian Ports? Sustainability 2020, 12, 9269. [Google Scholar] [CrossRef]
- Roberts, T.; Williams, I.; Preston, J.; Clarke, N.; Odum, M.; Gorman, S. A Virtuous Circle? Increasing Local Benefits from Ports by Adopting Circular Economy Principles. Sustainability 2021, 13, 7079. [Google Scholar] [CrossRef]
- LOOP Ports. LOOP Ports—Circular Economy Project for Ports. 2022. Available online: https://circulareconomy.europa.eu/platform/en/dialogue/existing-eu-platforms/circular-economy-platform-ports-loop-ports (accessed on 5 January 2022).
- Karimpour, R.; Ballini, F.; Ölcer, A.I. Circular economy approach to facilitate the transition of the port cities into self-sustainable energy ports—A case study in Copenhagen-Malmö Port (CMP). WMU J. Marit. Aff. 2019, 18, 225–247. [Google Scholar] [CrossRef]
- Gravagnuolo, A.; Angrisano, M.; Girard, L.F. Circular Economy Strategies in Eight Historic Port Cities: Criteria and Indicators Towards a Circular City Assessment Framework. Sustainability 2019, 11, 3512. [Google Scholar] [CrossRef] [Green Version]
- Port of the Future. Port of the Future KIP Set. Deliverable 3.1. 2020. Available online: https://www.docksthefuture.eu/wp-content/uploads/2021/02/D3.1-Port-of-the-Future-KPI-set.pdf (accessed on 15 December 2021).
- United Nations. The 17 Goals—Sustainable Development Goals. Available online: https://sdgs.un.org/goals (accessed on 15 December 2021).
- European Commission. Communication from the Commission to the European Parliament, the Council, the European Economic and Social Committee and the Committee of the Regions—Closing the Loop—An EU Action Plan for the Circular Economy COM (2015) 0614 Final. Available online: https://eur-lex.europa.eu/legal-content/EN/TXT/?uri=CELEX:52015DC0614 (accessed on 5 January 2022).
- European Commission. Communication from the Commission to the European Parliament, the Council, the European Economic and Social Committee and the Committee of the Regions—A New Circular Economy Action Plan for a Cleaner and More Competitive Europe COM (2020) 98 Final. Available online: https://eur-lex.europa.eu/legal-content/EN/TXT/?uri=COM%3A2020%3A98%3AFIN (accessed on 5 January 2022).
- Kirchherr, J.; Reike, D.; Hekkert, M. Conceptualising the circular economy: An analysis of 114 definitions. Resour. Conserv. Recycl. 2017, 127, 221–232. [Google Scholar] [CrossRef]
- Potting, J.; Hekkert, M.; Worell, E.; Hanemaaijer, A. Circular Economy: Measuring Innovation in the Product Chain. 2017. Available online: https://www.pbl.nl/sites/default/files/downloads/pbl-2016-circular-economy-measuring-innovation-in-product-chains-2544.pdf (accessed on 5 January 2022).
- Lindgren, E.R.; Salomone, R.; Reyes, T. A critical Review of Academic Approaches, Methods and Tools to Assess Circular Economy at the Micro Level. Sustainability 2020, 12, 4973. [Google Scholar] [CrossRef]
- Balanay, R.; Halog, A. Tools for circular economy: Review and some potential applications for the Philippine textile industry. In Circular Economy in Textiles and Apparel; Muthu, S.S., Ed.; Woodhead Publishing: Cambridge, UK, 2019; pp. 49–75. [Google Scholar] [CrossRef]
- Căutişanu, C.; Asandului, L.; Borza, M.; Turturean, C. Quantitative approach to circular economy in the OECD countries. Amfiteatru Econ. Econ. Bus. Res. Period. 2018, 20, 262–277. [Google Scholar]
- Salguero-Puerta, L.; Leyva-Diaz, J.C.; Cortes-Garcia, F.J.; Molina-Moreno, V. Sustainability Indicators Concerning Waste Management for Implementation of the Circular Economy Model on the University of Lome (Togo) Campus. Int. J. Environ. Res. Public Health 2019, 16, 2234. [Google Scholar] [CrossRef] [Green Version]
- Florinda, M.; Felgueiras, C.; Smitkova, M.; Caetano, N. Analysis of Fossil Fuel Energy Consumption and Environmental Impacts in European Countries. Energies 2019, 12, 964. [Google Scholar] [CrossRef] [Green Version]
- Calzolari, T.; Genovese, A.; Brint, A. Circular Economy indicators for supply chains: A systematic literature review. Environ. Sustain. Indic. 2022, 13, 100160. [Google Scholar] [CrossRef]
- Nocca, F.; De Toro, P.; Voysekhovska, V. Circular economy and cultural heritage conservation: A proposal for integrating Level(s) evaluation tool. Aestimum 2021, 78, 105–143. [Google Scholar] [CrossRef]
- Lindgreen, E.R.; Opferkuch, K.; Walker, A.M.; Salomone, R.; Reyes, T.; Raggi, A.; Simboli, A.; Vermeulen, W.J.V.; Caeiro, S. Exploring assessment practices of companies actively engaged with circular economy. Bus. Strategy Environ. 2022, 1–25. Available online: https://www.researchgate.net/publication/357794732_Exploring_assessment_practices_of_companies_actively_engaged_with_circular_economy (accessed on 10 February 2022). [CrossRef]
- Pacurariu, R.L.; Vatca, S.D.; Lakatos, E.S.; Bacali, L.; Vlad, M. A critical Review of EU Key Indicators for the Transition to the Circular Economy. Environ. Res. Public Health 2021, 18, 8840. [Google Scholar] [CrossRef] [PubMed]
- Zink, T.; Geyer, R. Circular Economy Rebound. J. Ind. Ecol. 2017, 21, 593–602. [Google Scholar] [CrossRef]
- D’Adamo, I.; Lupi, G. Sustainability and Resilience after COVID-19: A Circular Premium in the Fashion Industry. Sustainability 2021, 13, 1861. [Google Scholar] [CrossRef]
- El Jihad, A.R.; Bordanova, D.V. The Circular Economy in the Spanish Port Infrastructure. A Comparison with the European Context. Available online: http://repositori.uji.es/xmlui/bitstream/handle/10234/194132/TFG_2021_RadiElJihad_Abdelouahed.pdf?sequence=1 (accessed on 10 February 2022).
- Williams, J. The Circular Regeneration of a Seaport. Sustainability 2019, 11, 3424. [Google Scholar] [CrossRef] [Green Version]
- Port of Antwerp. Annual Report 2016. 2017. Available online: https://www.portofantwerp.com/sites/default/files/POA-2071_Jaarverslag2017_UK_WEB%20FIN.pdf (accessed on 5 December 2021).
- Port of Antwerp. Facts & Figures. 2019. Available online: https://www.portofantwerp.com/sites/default/files/Facts_en_Figures_2019.pdf (accessed on 5 December 2021).
- Port of Antwerp. Yearbook of Statistics 2020. 2021. Available online: https://www.portofantwerp.com/sites/default/files/Statistisch%20Jaarboek%202020_1.pdf (accessed on 5 December 2021).
- Port of Antwerp. Sustainability Trend Report. Available online: https://www.oursustainableport.com/en (accessed on 5 December 2021).
- Port of Amsterdam. Annual Report 2017. 2018. Available online: https://www.portofamsterdam.com/sites/default/files/2020-06/annual-report-2017.pdf (accessed on 5 December 2021).
- Port of Amsterdam. Annual Report 2018. 2019. Available online: https://www.portofamsterdam.com/sites/default/files/2020-06/annual-report-2018.pdf (accessed on 5 December 2021).
- Port of Amsterdam. Annual Report 2019. 2020. Available online: https://jaarverslag.portofamsterdam.com/sites/jaarverslag/files/2021-05/PoA_JV2020_ENG_040521.pdf (accessed on 5 December 2021).
- Port of Genova. Relazione Annuale 2014. 2015. Available online: https://www.portsofgenoa.com/components/com_publiccompetitions/includes/download.php?id=21:relazione-annuale-2014.pdf (accessed on 5 December 2021).
- Port of Genova. Relazione Annuale 2015. 2016. Available online: https://www.portsofgenoa.com/components/com_publiccompetitions/includes/download.php?id=24:relazione-annuale-2015.pdf (accessed on 5 December 2021).
- Port of Genova. Relazione Annuale 2016. 2017. Available online: https://www.portsofgenoa.com/components/com_publiccompetitions/includes/download.php?id=100:relazione-annuale-2016-ge.pdf (accessed on 5 December 2021).
- Port of Barcelona. Port of Barcelona Traffic Statistics—Accumulated Data December 2018. 2018. Available online: https://contentv5.portdebarcelona.cat/cntmng/guestDownload/direct/workspace/SpacesStore/3740c008-e1ef-438e-85e8-993c1f8a2fa8/PortBcnTrafic2018_12_en.pdf (accessed on 5 December 2021).
- Port of Barcelona. Port of Barcelona Traffic Statistics—Accumulated Data December 2019. 2019. Available online: https://contentv5.portdebarcelona.cat/cntmng/gd/d/workspace/SpacesStore/583fa5eb-9809-4954-982f-cf6ecdf1d365/PortBcnTrafic2019_12_en.pdf (accessed on 5 December 2021).
- Port of Barcelona. Port of Barcelona Traffic Statistics—Accumulated Data December 2020. 2020. Available online: https://contentv5.portdebarcelona.cat/cntmng/gd/d/workspace/SpacesStore/a02c025b-d028-47fc-9e33-21efc96a5c17/PortBcnTrafic2020_12_en.pdf (accessed on 5 December 2021).
- Port of Koper. Annual Report 2018. Available online: https://www.luka-kp.si/wp-content/uploads/2021/06/LETNO-POROCILO-2018_ANG_26_04_2019_OBJAVLJENO.pdf (accessed on 5 December 2021).
- Port of Koper. Sustainability Report 2018. Available online: https://www.luka-kp.si/wp-content/uploads/2021/06/TRAJNOSTNO-POROCILO-2018_-ANG_26_04_2019_-OBJAVLJENO.pdf (accessed on 5 December 2021).
- Port of Koper. Annual Report 2019. Available online: https://www.luka-kp.si/wp-content/uploads/2021/06/Letno-porocilo-2019_ANGLESKO_OBLIKOVANO_ZA-OBJAVO.pdf (accessed on 5 December 2021).
- Port of Koper. Annual Report 2020. Available online: https://www.luka-kp.si/wp-content/uploads/2021/06/Annual-report-2020-ENG.pdf (accessed on 5 December 2021).
- European Commission. Commission of the European Communities—Communication from the Commission Structural indicators COM (2002) 551 Final. Available online: https://eur-lex.europa.eu/LexUriServ/LexUriServ.do?uri=COM:2002:0551:FIN:EN:PDF (accessed on 5 January 2022).
- European Commission. Indicative Guidelines on Evaluation Methods: Monitoring and Evaluation Indicators. 2006. Available online: https://ec.europa.eu/regional_policy/sources/docoffic/2007/working/wd2indic_082006_en.pdf (accessed on 15 December 2021).
- Saaty, T.L. The Analytic Hierarchy Process: Planning, Priority Setting, Resource Allocation; McGraw-Hill International Book Company: New York, NY, USA, 1980; pp. 1–287. [Google Scholar]
- Saaty, T.L. Fundamentals of Decision Making and Priority Theory with the Analytic Hierarchy Process, 1st ed.; Analytic Hierarchy Process Series; RWS Publications: Pittsburgh, PA, USA, 2000; Volume 6, pp. 1–477. [Google Scholar]
- Dekamin, M.; Barmaki, M.; Kanooni, A. Selecting the best environmental friendly oilseed crop by using Life Cycle Assessment, water footprint and analytic hierarchy process methods. J. Clean. Prod. 2018, 198, 1239–1250. [Google Scholar] [CrossRef]
- Ameen, R.; Mourshed, M. Urban sustainability assessment framework development: The ranking and weighting of sustainability indicators using analytic hierarchy process. Sustain. Cities Soc. 2019, 44, 356–366. [Google Scholar] [CrossRef]
- Kwatra, S.; Kumar, A.; Sharma, S.; Sharma, P. Stakeholder participation in prioritising sustainability issues at regional level using analytic hierarchy process (AHP) technique: A case study of Goa, India. Environ. Sustain. Indic. 2021, 11. [Google Scholar] [CrossRef]
- Krajnc, D.; Glavic, P. How to compare companies on relevant dimensions of sustainability. Ecol. Econ. 2005, 55, 551–563. [Google Scholar] [CrossRef]
- Saaty, T.L. Decision Making for Leaders: The Analytical Hierarchy Process for Decisions in a Complex World; Lifetime Learning Publications: Belmont, CA, USA, 1982; pp. 1–291. [Google Scholar]
- Ramanathan, R. A note on the use of the analytic hierarchy process for environmental impact assessment. J. Environ. Manag. 2001, 63, 27–35. [Google Scholar] [CrossRef] [PubMed] [Green Version]
- Lukman, R.K.; Cepak, F.; Kovačič, D.; Keblič, D.; Omahne, V.; Zorman, T.; Gabrič, M.; Marković, G.; Progar, J.; Medved, T. Circular Economy Indicators in Seaports: Final Project Report. Call: Through Creative Way to Knowledge, Students’ Projects. Celje, 2020 (in Slovene). European Social Fund, the Slovenian Ministry for Education, Science and Sport and the Public Scholarship, Development, Disability and Maintenance Fund of the Republic of Slovenia (Project Agreement No. 11081-4/2019). Available online: https://fl.um.si/knjiznicaFL/eknjige/Kazalci_kroznega_gospodarstva_v_pristaniscih.pdf (accessed on 15 December 2021).
- European Commission. Competition—State Aid—State Aid Rules and Coronavirus. Available online: https://ec.europa.eu/competition-policy/state-aid/coronavirus_en (accessed on 14 February 2022).
- Cepak, F.; Marzi, B. Environmental Impacts of the Port of Koper. Varst. Narave 2009, 22, 97–116. [Google Scholar]
- Port of Koper. Luka Koper. 2022. Available online: https://www.luka-kp.si/en/ (accessed on 5 December 2021).
- Port of Antwerp. Port of Antwerp. 2022. Available online: https://www.portofantwerp.com/en (accessed on 5 December 2021).
- Lukman, R.; Krajnc, D.; Glavič, P. University ranking using research, educational and environmental indicators. J. Clean. Prod. 2010, 18, 619–628. [Google Scholar] [CrossRef]
- Instituto Mexicano del Transporte. Port Indicators System: Methodology. 2016. Available online: https://portalcip.org/wp-content/uploads/2019/07/Port-Indicators-System.pdf (accessed on 20 November 2021).
- Valenzuela-Venegas, G.; Salgado, J.C.; Diaz Alvarado, F.A. Sustainability Indicators for the Assessment of Eco-Industrial Parks: Classification and criteria for selection. J. Clean. Prod. 2016, 133, 99–116. [Google Scholar] [CrossRef]
- Geraedts, R. FLEX 4.0, A Practical Instrument to Assess the Adaptive Capacity of Buildings. Energy Procedia 2016, 96, 568–579. [Google Scholar] [CrossRef] [Green Version]
- Franklin-Johnson, E.; Figge, F.; Canning, L. Resource duration as a managerial indicator for Circular Economy performance. J. Clean. Prod. 2016, 133, 589–598. [Google Scholar] [CrossRef]
- Niero, M.; Irving Olsen, S. Circular economy: To be or not to be in a closed product loop? A Life Cycle Assessment of aluminium cans with inclusion of alloying elements. Resour. Conserv. Recycl. 2016, 114, 18–31. [Google Scholar] [CrossRef] [Green Version]
- Huysman, S.; De Schaepmeester, J.; Ragaert, K.; Dewulf, J.; De Meester, S. Performance indicators for a circular economy: A case study on post-industrial plastic waste. Resour. Conserv. Recycl. 2017, 120, 46–54. [Google Scholar] [CrossRef]
- Yang, T.; Ren, Y.; Shi, L.; Wang, G. The circular transformation of chemical industrial parks: An integrated evaluation framework and 20 cases in China. J. Clean. Prod. 2018, 196, 763–772. [Google Scholar] [CrossRef]
- Jacobi, N.; Haas, W.; Wiedenhofer, D.; Mayer, A. Providing an economy-wide monitoring framework for the circular economy in Austria: Status quo and challenges. Resour. Conserv. Recycl. 2018, 137, 156–166. [Google Scholar] [CrossRef]
- Cobo, S.; Dominguez-Ramos, A.; Irabien, A. Trade-Offs between Nutrient Circularity and Environmental Impacts in the Management of Organic Waste. Environ. Sci. Technol. 2018, 52, 10923–10933. [Google Scholar] [CrossRef] [PubMed] [Green Version]
- Hens, L.; Block, C.; Cabello-Eras, J.J.; Sagastume-Gutierez, A.; Garcia-Lorenzo, D.; Chamorro, C.; Herrera Mendoza, K.; Haeseldonckx, D.; Vandecasteele, C. On the evolution of “Cleaner Production” as a concept and a practice. J. Clean. Prod. 2018, 172, 3323–3333. [Google Scholar] [CrossRef]
- Van Eygen, E.; Laner, D.; Fellner, J. Circular economy of plastic packaging: Current practice and perspectives in Austria. Waste Manag. 2018, 72, 55–64. [Google Scholar] [CrossRef] [PubMed]
- Paulik, S. Critical appraisal of the circular economy standard BS 8001:2017 and a dashboard of quantitative system indicators for its implementation in organisations. Resour. Conserv. Recycl. 2018, 129, 81–92. [Google Scholar] [CrossRef]
- Zhao, Y.; Yu, M.; Kong, F.-W.; Li, L.-H. An emergy ternary diagram approach to evaluate circular economy implementation of eco-industrial parks. Clean Technol. Environ. Policy 2019, 21, 1433–1445. [Google Scholar] [CrossRef]
- Kayal, B.; Abu-Ghunmi, D.; Abu-Ghunmi, L.; Archenti, A.; Nicolescu, M.; Larkin, C.; Corbet, S. An economic index for measuring firm’s circularity: The case of water industry. J. Behav. Exp. Financ. 2019, 21, 123–129. [Google Scholar] [CrossRef]
- Howard, M.; Hopkinson, P.; Miemczyk, J. The regenerative supply chain: A framework for developing circular economy indicators. Int. J. Prod. Res. 2019, 57, 7300–7318. [Google Scholar] [CrossRef] [Green Version]
- Pieratti, E.; Paletto, A.; De Meo, I.; Fagarazzi, C.; Migliorini Giovannini, M.R. Assessing the forest-wood chain at local level: A Multi-Criteria Deci-sion Analysis (MCDA) based on the circular bieconomy principles. Ann. For. Res. 2019, 62, 123–138. [Google Scholar] [CrossRef]
- Sterew, N.; Ivanova, V. From sustainability to a model of circular economy—The example of Bulgaria. In Proceedings of the Intcess 2019 6th International Conference on Education and Social Sciences, Dubai, United Arab Emirates, 4–6 February 2019; pp. 757–766. [Google Scholar]
- Niero, M.; Kalbar, P.P. Coupling material circularity indicators and life cycle based indicators: A proposal to advance the assessment of circular economy strategies at the product level. Resour. Conserv. Recycl. 2019, 140, 305–312. [Google Scholar] [CrossRef]
- Girard, F.L.; Nocca, F. Moving Towards the Circular Economy/City Model: Which Tools for Operationalizing This Model? Sustainability 2019, 11, 6253. [Google Scholar] [CrossRef] [Green Version]
- Kristensen, S.H.; Mosgaard, M.A. A review of micro level indicators for a circular economy—moving away from the three dimensions of sustainability. J. Clean. Prod. 2020, 243, 118531. [Google Scholar] [CrossRef]
- Rossi, E.; Bertassini, A.C.; dos Santos Ferreira, C.; Neves do Amaral, W.A.; Ometto, A.R. Circular economy indicators for organisations considering sustainability and business models: Plastic, textile and electro-electronic cases. J. Clean. Prod. 2020, 247, 119137. [Google Scholar] [CrossRef]
- Völker, T.; Kovacic, Z.; Strand, R. Indicator development as a site of collective imagination? The case of European Commission policies on the circular economy. Cult. Organ. 2020, 26, 103–120. [Google Scholar] [CrossRef]
- Stavropoulos, P.; Papacharalampopoulos, A.; Tzimanis, K.; Petrides, D.; Chryssolouris, G. On the Relationship between Circular and Innovation Approach to Economy. Sustainability 2021, 13, 11829. [Google Scholar] [CrossRef]
- Agrawal, R.; Wankhede, V.A.; Kumar, A.; Luthra, S.; Huisingh, D. Progress and trends in integrating Industry 4.0 within Circular Economy: A comprehensive literature review and future research propositions. Bus. Strategy Environ. 2022, 31, 559–579. [Google Scholar] [CrossRef]


| Port | Annual Reports |
|---|---|
| Port of Antwerp | Annual Report 2016 [30] |
| Facts & Figures 2019 [31] | |
| Yearbook of Statistics 2020 [32] | |
| Sustainability Trend Report [33] | |
| Port of Amsterdam | Annual Report 2017 [34] |
| Annual Report 2018 [35] | |
| Annual Report 2020 [36] | |
| Port of Genova | Relazione annuale 2014 [37] |
| Relazione annual 2015 [38] | |
| Relazione annuale 2017 [39] | |
| Port of Barcelona | Annual Report 2018 [40] |
| Annual Report 2019 [41] | |
| Annual Report 2020 [42] | |
| Port of Koper | Annual Report 2018 [43] |
| Sustainability Report 2018 [44] | |
| Annual Report 2019 [45] | |
| Annual Report 2020 [46] |
| R0 | R1 | R2 | R3 | R4 | R5 | R6 | R7 | R8 | R9 | |
|---|---|---|---|---|---|---|---|---|---|---|
| R0 | 1.000 | 1.880 | 1.000 | 1.150 | 1.150 | 1.000 | 0.880 | 0.680 | 0.600 | 0.750 |
| R1 | 0.530 | 1.000 | 2.500 | 0.630 | 0.520 | 0.580 | 0.630 | 0.600 | 0.650 | 0.520 |
| R2 | 1.000 | 0.400 | 1.000 | 1.000 | 0.480 | 0.580 | 0.470 | 0.580 | 0.580 | 0.750 |
| R3 | 0.870 | 1.600 | 1.000 | 1.000 | 1.000 | 1.150 | 0.680 | 0.650 | 0.410 | 0.410 |
| R4 | 0.870 | 1.930 | 2.070 | 1.000 | 1.000 | 1.670 | 1.150 | 0.560 | 0.560 | 0.500 |
| R5 | 1.000 | 1.730 | 1.730 | 0.870 | 0.600 | 1.000 | 0.830 | 1.070 | 0.650 | 0.540 |
| R6 | 1.130 | 1.600 | 2.130 | 1.470 | 0.870 | 1.200 | 1.000 | 0.710 | 2.500 | 0.540 |
| R7 | 1.470 | 1.670 | 1.730 | 1.530 | 1.800 | 0.930 | 1.400 | 1.000 | 1.250 | 0.650 |
| R8 | 1.670 | 1.530 | 1.730 | 2.470 | 1.800 | 1.530 | 0.400 | 0.800 | 1.000 | 0.750 |
| R9 | 1.330 | 1.930 | 1.330 | 2.470 | 2.000 | 1.870 | 1.870 | 1.530 | 1.330 | 1.000 |
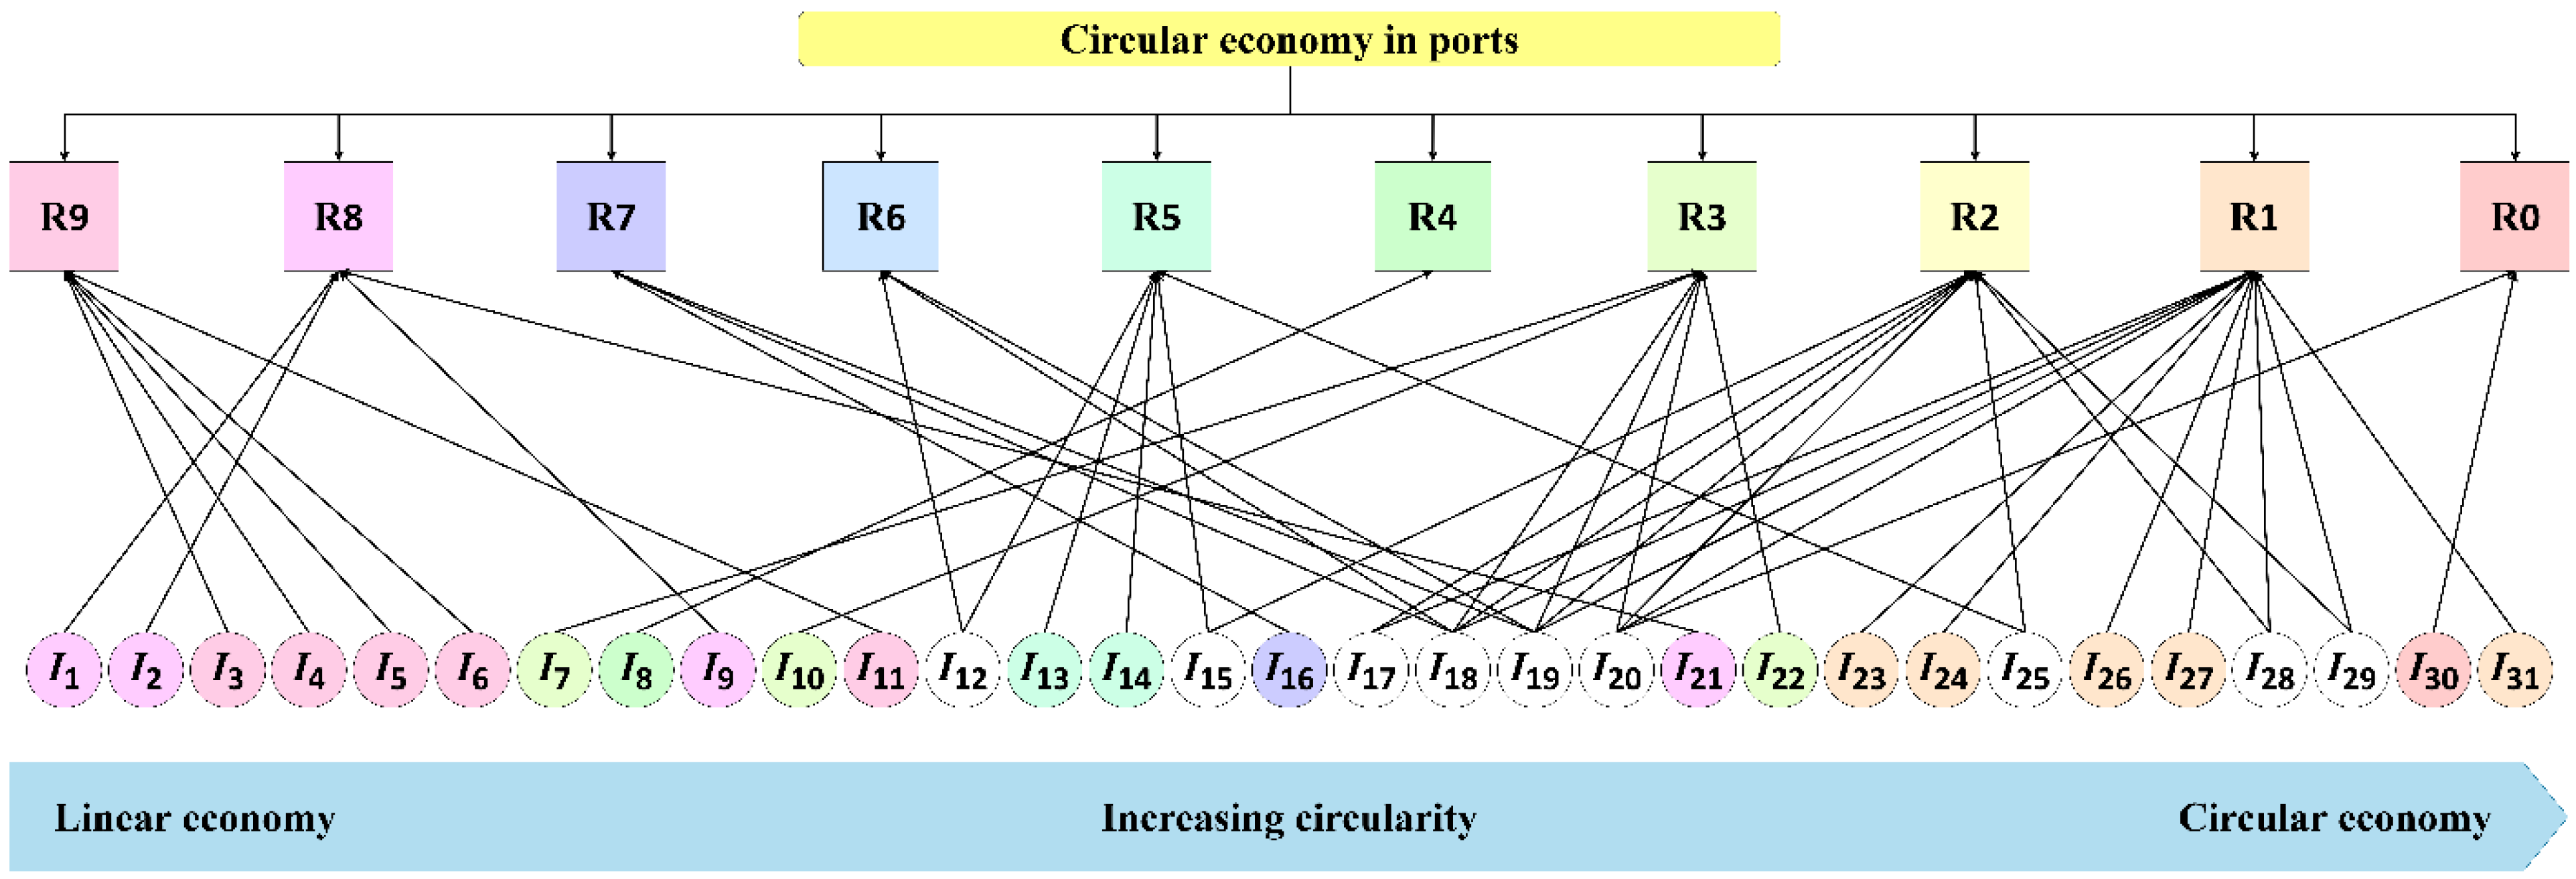
| R-Strategy | Indicators | No. of Indicators |
|---|---|---|
| R0 | I20, I30 | 2 |
| R1 | I17, I18, I19, I20, I23, I24, I26, I27, I28, I29, I31 | 11 |
| R2 | I15, I17, I18, I19, I20, I25, I28, I29 | 8 |
| R3 | I7, I10, I18, I19, I20, I22 | 6 |
| R4 | I8 | 1 |
| R5 | I12, I13, I14, I15 | 4 |
| R6 | I12, I18, I19 | 3 |
| R7 | I16, I18, I19 | 3 |
| R8 | I1, I2, I9, I21 | 4 |
| R9 | I3, I4, I5, I6, I11 | 5 |
| Indicator | Indicator Full Name | Indicator Weight |
|---|---|---|
| I1 | Fraction (in %) of recycled waste in comparison with the total waste produced | 0.0300 |
| I2 | Fraction (in %) of recycled plastic waste in comparison with the total plastic waste produced | 0.0300 |
| I3 | Faction (in %) of waste produced in the port that goes to landfill in comparison with the total waste produced | 0.0308 |
| I4 | Amount of materials (e.g., plastic, tiers) used for alternative fuel (t/a) | 0.0308 |
| I5 | Fraction (in %) of biogas produced from the total biodegradable waste produced | 0.0308 |
| I6 | Fraction (in %) of waste used for energy production in comparison with the total waste incinerated | 0.0308 |
| I7 | Quantity of the reused materials (t/a) | 0.0128 |
| I8 | Fraction (in %) of repaired/maintained products | 0.0970 |
| I9 | Fraction (in %) of the recycled goods used | 0.0300 |
| I10 | Fraction (in %) of waste reused | 0.0128 |
| I11 | Unsold products recovered for redistribution at the market itself or through nearby community facilities (t/a) | 0.0308 |
| I12 | Fraction (in %) of water consumption for habitat (reduction, for example, thanks to harvesting rainwater on the roofs) | 0.0609 |
| I13 | Fraction (in %) of green roofs | 0.0223 |
| I14 | Fraction (in %) of food waste reused against the total food waste produced | 0.0223 |
| I15 | Fraction (in %) of retrofitting interventions on buildings | 0.0303 |
| I16 | Fraction (in %) of degraded buildings | 0.0403 |
| I17 | Fraction (in %) of synergies in the supply chain (energy, resources), compared to the whole supply chain | 0.0144 |
| I18 | Fraction (in %) of processes designed for flexibility by using modular, synergy systems | 0.1062 |
| I19 | Fraction (in %) of symbiotic and synergistic relationships in the port area and among the port area and the city | 0.1062 |
| I20 | Amount of sea sewage materials used for new products (e.g., bricks) (Mt/a) | 0.0732 |
| SUM TOTAL | 0.8426 |
| Indicator | Indicator Full Name | Indicator Weight |
|---|---|---|
| I21 | Revenue from recycled goods (bn EUR/a) | 0.0300 |
| I22 | Value of material reused (bn EUR/a) | 0.0128 |
| I23 | Circular economy innovation budget (bn EUR/a) | 0.0064 |
| I24 | Circular-economy-related grants from the local, national EU budget (bn EUR/a) | 0.0064 |
| I25 | Direct and indirect new investments generated and considering circular economy (bn EUR/a) | 0.0080 |
| SUM TOTAL | 0.0636 |
| Indicator | Indicator Full Name | Indicator Weight |
|---|---|---|
| I26 | A fraction (in %) of the circular-economy-related position in a port, compared to all the position | 0.0064 |
| I27 | A fraction (in %) of new circular economy jobs created in a port, compared to all the position | 0.0064 |
| I28 | A fraction (in %) of events and dissemination activities about circular economy within the port compared to all the events | 0.0144 |
| I29 | A fraction (in %) of active employees in circular economy initiatives, compared to all employees | 0.0144 |
| I30 | Number of innovation awards related to a circular economy | 0.0460 |
| I31 | A fraction (in %) of employees attending internal/external circular economy capacity building | 0.0064 |
| SUM TOTAL | 0.0938 |
| Seaport | Final Circularity Value |
|---|---|
| Port of Koper | 0.1041 |
| Port of Antwerp | 0.0164 |
Publisher’s Note: MDPI stays neutral with regard to jurisdictional claims in published maps and institutional affiliations. |
© 2022 by the authors. Licensee MDPI, Basel, Switzerland. This article is an open access article distributed under the terms and conditions of the Creative Commons Attribution (CC BY) license (https://creativecommons.org/licenses/by/4.0/).
Share and Cite
Kovačič Lukman, R.; Brglez, K.; Krajnc, D. A Conceptual Model for Measuring a Circular Economy of Seaports: A Case Study on Antwerp and Koper Ports. Sustainability 2022, 14, 3467. https://doi.org/10.3390/su14063467
Kovačič Lukman R, Brglez K, Krajnc D. A Conceptual Model for Measuring a Circular Economy of Seaports: A Case Study on Antwerp and Koper Ports. Sustainability. 2022; 14(6):3467. https://doi.org/10.3390/su14063467
Chicago/Turabian StyleKovačič Lukman, Rebeka, Kristijan Brglez, and Damjan Krajnc. 2022. "A Conceptual Model for Measuring a Circular Economy of Seaports: A Case Study on Antwerp and Koper Ports" Sustainability 14, no. 6: 3467. https://doi.org/10.3390/su14063467
APA StyleKovačič Lukman, R., Brglez, K., & Krajnc, D. (2022). A Conceptual Model for Measuring a Circular Economy of Seaports: A Case Study on Antwerp and Koper Ports. Sustainability, 14(6), 3467. https://doi.org/10.3390/su14063467