Article

The Case of South Korean Airlines-Within-Airlines Model: Helping Full-Service Carriers Challenge Low-Cost Carriers

1
Faculty of Business and Management, Information Technology University, Arfa Software Technology Park, Ferozpur Road, Lahore 54600, Punjab, Pakistan
2
Department of System Management Engineering, Sungkyunkwan University, 25-2 Sungkyunkwan-ro, Jongno-gu, Seoul 01032, Korea
*
Author to whom correspondence should be addressed.
Sustainability 2022, 14(6), 3468; https://doi.org/10.3390/su14063468
Submission received: 26 January 2022 / Revised: 21 February 2022 / Accepted: 7 March 2022 / Published: 16 March 2022
(This article belongs to the Special Issue Aviation Management and Air Transport Industry II)

Abstract

:
The South Korean aviation market has grown rapidly since the emergence of Low-Cost Carriers (LCCs), and in response to this emergence, the two Full-Service Carriers (FSCs) of South Korea adopted the airline-within-airline (AWA) model and introduced their LCCs to compete with independent LCCs (ILCCs). A few years back, ILCCs filed a petition against Asiana Airlines, one of the two FSCs in South Korea, as Asiana Air was launching another subsidiary on the model of AWA. This, interestingly, indicates that AWA are doing well in the South Korean aviation market. However, a detailed study is required to evaluate the performance of this model, as in the global market the success of AWA is blurred. This study attempts to shed light on the performance of South Korean AWA, which may provide fruitful insights considering the post-COVID-19 dynamics of the aviation market.

1. Introduction

Low-Cost Carriers (LCCs) follow a business model that is a lean form of the conventional Full-Service Carriers (FSCs) model. The pioneer of the lean concept is Toyota Production System (TPS), which introduced the lean concept after World War II when the world was going through an economic crisis. Similarly, the shift in the aviation model from FSC to LCC was triggered by different socio-economic crises accompanied by airline deregulation [1]. In response to LCCs, many FSCs around the globe were compelled to adopt the strategy of AWA [1,2,3,4], and this happened in the South Korean aviation market as well. Hence, there are two types of LCCs in South Korea: the independent LCCs (ILCCs) and the AWA owned by FSCs.
Researchers have investigated AWA competing with ILCCs under certain conditions. For example, when the market is expanding [3]. In these studies, some authors, such as [5], have reported the failures of AWA, while other authors, such as [6], have discussed the successful cases of AWA. The South Korean market was also expanding before the COVID-19 pandemic occurred [7,8]. However, hardly any studies evaluate how the AWA are performing in South Korea. Interestingly, South Korean ILCCs filed a petition against Asiana Airlines, one of the two FSCs in South Korea, as Asiana Air was launching another subsidiary on the model of AWA. This provides a hint that AWA in the South Korean market are doing well. Nevertheless, more evidence is required to validate this idea. Figure 1 shows the market shares of FSCs and the two types of LCCs from 2006 to 2019. The chart clearly depicts that AWA have grown over time, but ILCCs still hold more market share as compared to AWA.
When it comes to the aviation market, the growth of the South Korean market has been rather interesting over the last fifteen years, and the world’s busiest air route, Seoul to Jeju, arises from the South Korean market [9]. The South Korean aviation market has all the ingredients of a dynamic aviation market—FSCs, LCCs, AWA, and competitors such as fast trains [8]. Furthermore, the South Korean aviation market serves both the tourism and business routes. In addition, since the emergence of LCCs, the market has experienced growth, and was still expanding before COVID-19 struck, which curtailed the growth rate considerably.
Another interesting point about the Korean market is that South Korean LCCs also have to compete against International LCCs, as Chinese LCCs provide services on some tourism-specific routes. Ref. [8] explained the evolution of South Korean LCCs, their competition with FSCs, their role in the tourism market, and the changing dynamics of LCC–FSC competition in the presence of a fast train, explaining that the dynamics have evolved over time; the LCC–FSC competition has also evolved over time, which helps explain the conflicting reports in the literature on LCC–FSC competition. In the South Korean market, the AWA that apparently contribute most considerably to the LCC market do not compete with ILCCs on all routes. However, the competition dynamics of AWA and ILCCs have not been explored yet.
Hence, some key questions need to be answered: (i) Were South Korean AWA successful in competing with ILCCs when the market was expanding before COVID-19? (ii) Are competition dynamics sensitive to market growth, as suggested by [3], such that AWA compete primarily in expanding markets?
To answer these questions, the challenge is to measure competition. Competition is evaluated largely by discrete choice models [10]. The use of discrete choice models is not new [11], and they have been used in many research disciplines and for multiple purposes. For example, for evaluating social interactions [12], investigating population dynamics [13], exploring the supply chain demand patterns [14], and for revenue management and consumer behavior [15]. More recently, a hybrid discrete choice model has been used for transportation studies, a generalized discrete model for green vehicle adoption [16], a discrete choice model for empirical studies in psychology [17], and a hybrid model for policy- and decision-making [17]. However, discrete choice models either involve plenty of surveys or require aggregate data [18,19,20]. For example, Ref. [18] used a Computer Reservation System, the Official Airline Guide, and Superset, which contain market size data. Similarly, Refs. [19,20] used various datasets, including price data and income.
For the current study, the unavailability of such data remains a challenge, and in such a case the use of the Competitive Lotka–Volterra (LV) model is useful. The Competitive LV model is an extension of predator–prey equations, and a one-of-its-kind model. The model has been used extensively to explore the competition dynamics in different areas of study, such as market analysis, eco-systems, and cryptocurrency [8,21,22,23,24,25,26,27,28]. Ref. [7], interestingly, used the LV model to evaluate the competition, and combined it with a moving window approach. Using the non-linear least-squares method, this study concluded that competition may be a function of time. Taking this lead, our study has adopted the moving window LV approach from [7], modified the LV model, and included market growth as an external factor prompting AWA to start competing in expanding markets [3].
The results of this study show that there is a cooperative relationship between ILCCs and AWA. However, the relationship changes over time, which means this relationship is one of facultative mutualism, wherein the two species do not rely on each other only, and may grow independently. In other words, the relationship may be seen as partial but tacit collusion, and this does not mean that competition does not exist between the two. The study concludes that the AWA of South Korea have been successful against ILCCs. In addition, the market share (Figure 1) also depicts that the duopoly of South Korean FSCs still holds over 70% of the market share, while the ILCCs share the rest of 30%. Further, our results also show that AWA are more sensitive to market growth, which means AWA tend to compete better in expanding markets as compared to ILCCs. Since the literature reports that some AWA have been successful while others failed, our results shed light on plausible reasons behind this. We show that AWA are successful in expanding markets, and contend that their failure might be due to the introduction of AWA in saturated markets. However, it remains to be seen why AWA perform better in expanding markets.
This paper is further organized as below: Section 2 derives the key points from an extensive literature review of the AWA, the LV model, and the South Korean aviation market. Section 3 explains the data processing approach and the details of the methodology. Section 4 presents the results, Section 5 discusses them, and Section 6 concludes the paper.

2. Literature Review

In response to the emergence of LCCs, there are two alternatives: one is to eliminate waste so as to reduce the cost of operations and make them leaner, while avoiding changes to the existing business model (Morrell, 2005). The second way is “airlines-within-airlines” (AWA), wherein FSCs have simultaneously run subsidiary airlines with a low-cost lean business strategy [1,2,3,6,29]. The concept of AWA is over 20 years old [6], and it basically has three possible objectives: (a) to spin off a profitable business, as achieved by British Airways; (b) to defeat the low-cost competition in key markets, and (c) to establish a test-bed for adapting a low-cost model [5]. Further, studies such as [2] theoretically provide five different success factors of AWA, which are as follows: (1) the dominance of the parent company in the domestic market; (2) the complete separation of operations between the AWA and its parent company; (3) the lack of integration of the AWA with the parent company in any aspect; (4) continuous improvement in the business model; and (5) reduced self-competition through network management. In the case of the South Korean market, South Korean FSCs initially adopted the first strategy, for example, by lowering the costs with better services as compared to LCCs; however, they later relied on the adoption of the second strategy. With respect to the five success factors, South Korean AWA fulfill half of them, as South Korean duo FSCs, Korean Air and Asiana Air, have enjoyed market dominance for several years; however, there was no evidence of a complete separation of their operations or a lack of integration between the AWA and their parent companies [30]. As for the fourth and fifth factors, it can be said that AWA are desperate for continuous improvement [31], and there are also cases where, to avoid self-competition, the FSCs did not introduce their own LCC on a business route [8].
In addition to the choice of response strategy and success factors of AWA, authors such as [3] theoretically addressed the impact of AWA on LCCs and welfare. However, on this front, the performance of AWA is not very consistent. Refs. [1,29,32] validated the argument by presenting the case of Jetstar Air, wherein, despite several limitations, the AWA strategy is more likely to be successful in competition with ILCCs. Recently, [4] also claimed that the Qantas Group and Singapore Airlines Group have succeeded at becoming well settled in the market, with the strategy of keeping both responsive and cost-based brands in the market; however, it is highly critical whether the AWA strategy is not implemented properly. Ref. [2] discussed the proper implementation, and [6] discussed reasons for the successes and failures, of AWA in different areas as well.
Recently, global aviation and tourism have been affected by the COVID-19 pandemic; however, South Korean aviation and tourism industries have been in extremis over the last five years. This is due, firstly, to the MERS outbreak from June 2015 to 2016 [33]; secondly to THAAD in 2017, when Chinese tourists boycotted South Korea as a tourism destination [34,35], and now recently due to the COVID-19 pandemic. Recently, the news has emerged that the two FSCs (Korea Air and Asiana airlines) (Seoul, South Korea) are ready for a merger, which will bring the AWA (Jin Air, Air Busan, and Air Seoul) together as one entity [36]. The evaluation of ILCC-AWA competition in the current scenario becomes very interesting as the merger of the FSC duo and AWA trio will require a lot of strategic decision-making. This study can contribute to the said purpose. Another interesting ongoing trend in Europe is LCCs becoming hybrid, i.e., offering the services of Full Service carriers [20,37]. If South Korean LCCs also react to the merger of Asiana Air and Korean Air, they can impact the AWA, which may lead to the merger of AWA with their parent network carriers.
For understanding the competition, previously, discrete choice models have been used, which involve lots of surveys. Authors such as [38,39] proposed quantitative models for competition. However, these complex models require data for several variables. The competitive form of the LV model consists of a pair of continuous differential equations, introduced by [40,41]. The model is used to evaluate the competition dynamics between two competing entities. The LV model basically comes from ecological systems [42], and is still being used in this field [25,43]. However, over the years, several advancements have been made to the construction of the LV model. For example, it can be used for n-dimensional competition as well [44,45], and can be used combined with machine learning [46]. The basic model is deterministic in nature, but stochastic versions are also being examined [47]. The advancements are not limited to structures only; the model has been extensively used in different areas, and its applications have grown remarkably. For example, the model is used in the areas of mathematical biology [48], the economy [49], and material sciences [50]. The model has gained special recognition in recent years, and has been used for concepts such as cryptocurrency [21,26,28,51,52], transportation [8], and tourism [7], and has been merged with the concepts of computing and analytics [23,53,54], analytics relevant to sales [55], healthcare [56], and market research [57].
Although the LV model is widely used, it has the limitation of self-containment. However, this limitation has been handled very well by researchers, as the LV model can easily be modified, and integrating external factors improves the model. Ref. [58] proposed a neural network LV model. Ref. [10] added oil prices as an external factor to the model. Similarly, [59] modified the LV model with grey theory, while [7] modified the LV model using inflation as an external factor. LV evaluates the competition using time series, based on the assumption that the competition is static. This limitation was addressed by [7]. The study showed that competition dynamics may not be static and that dynamics may change their behavior over time, and proposed a moving window approach to observe such dynamics over time. However, when the competition parameters were plotted along with the confidence intervals, the varying width of the confidence intervals was observed, indicating the unstable variance or non-stationariness of the data. Hence, when variance is increased, a large sample size is required to achieve the same degree of confidence. Using the moving window approach requires a large sample, so it is not feasible to increase the window size. In general, increasing the sample size is not always even possible.
This study uses a modified moving window LV model, which makes a two-fold contribution. First, it analyzes the competition more precisely and accurately; secondly, it is helpful for variance reduction. The model uses the market growth rate as an external factor, since the competitive LV model assumes that the overall population remains constant; however, the aviation market may not be the best example. In particular, we know that prior to COVID-19, the South Korean aviation market was expanding [7], indicating that the inclusion of a market growth factor may improve the overall model, because adding a variable that can explain the variance is helpful in improving the model.

3. Methodology

The LV model is based on predator–prey equations. The general form of the LV model is presented in the below equations.
d y / d t = a 1 y + b 1 y 2 + c 1 x y
d x / d t = a 2 x + b 2 x 2 + c 2 x y
where x and y are two entities that compete in the same environment. a1y represents the exponential growth, b1y2 represents the self-competition (logistic) parameter and c1xy represents the interaction term. These equations are used to develop the aviation competition model.
Equations (3) and (4) show the aviation competition model based on the competitive LV model, whereas Equations (5) and (6) (further below) represent the proposed modified LV model:
d I / d t = a 1 I + b 1 I 2 + c 1 I A
d A / d t = a 2 A + b 2 A 2 + c 2 I A
where I represents the monthly demand (passenger volume) for ILCCs, A represents the monthly demand (passenger volume) for AWA, ai and bi are logistic parameters, and ci is the interaction parameter.
Using Table 1, based on the signs of ci, different relationships between competing entities can be inferred. The modified form with growth rate can be represented by Equations (5) and (6), where G represents the market growth rate:
d I / d t = a 1 I + b 1 I 2 + c 1 I A + d 1 G
d A / d t = a 2 A + b 2 A 2 + c 2 I A + d 2 G
where I means the cumulative demand (passenger volume) for all the ILCCs, and similarly, A means the cumulative demand for all the AWA, and G shows the growth rate. Monthly data (2009–2020) are extracted from the official website of the Airport Corporation, Korea, for all the flights moving in and out of Gimpo airport (the domestic terminal of Seoul) (Figure 2). Descriptive statistics of the input data are presented in Table 2.
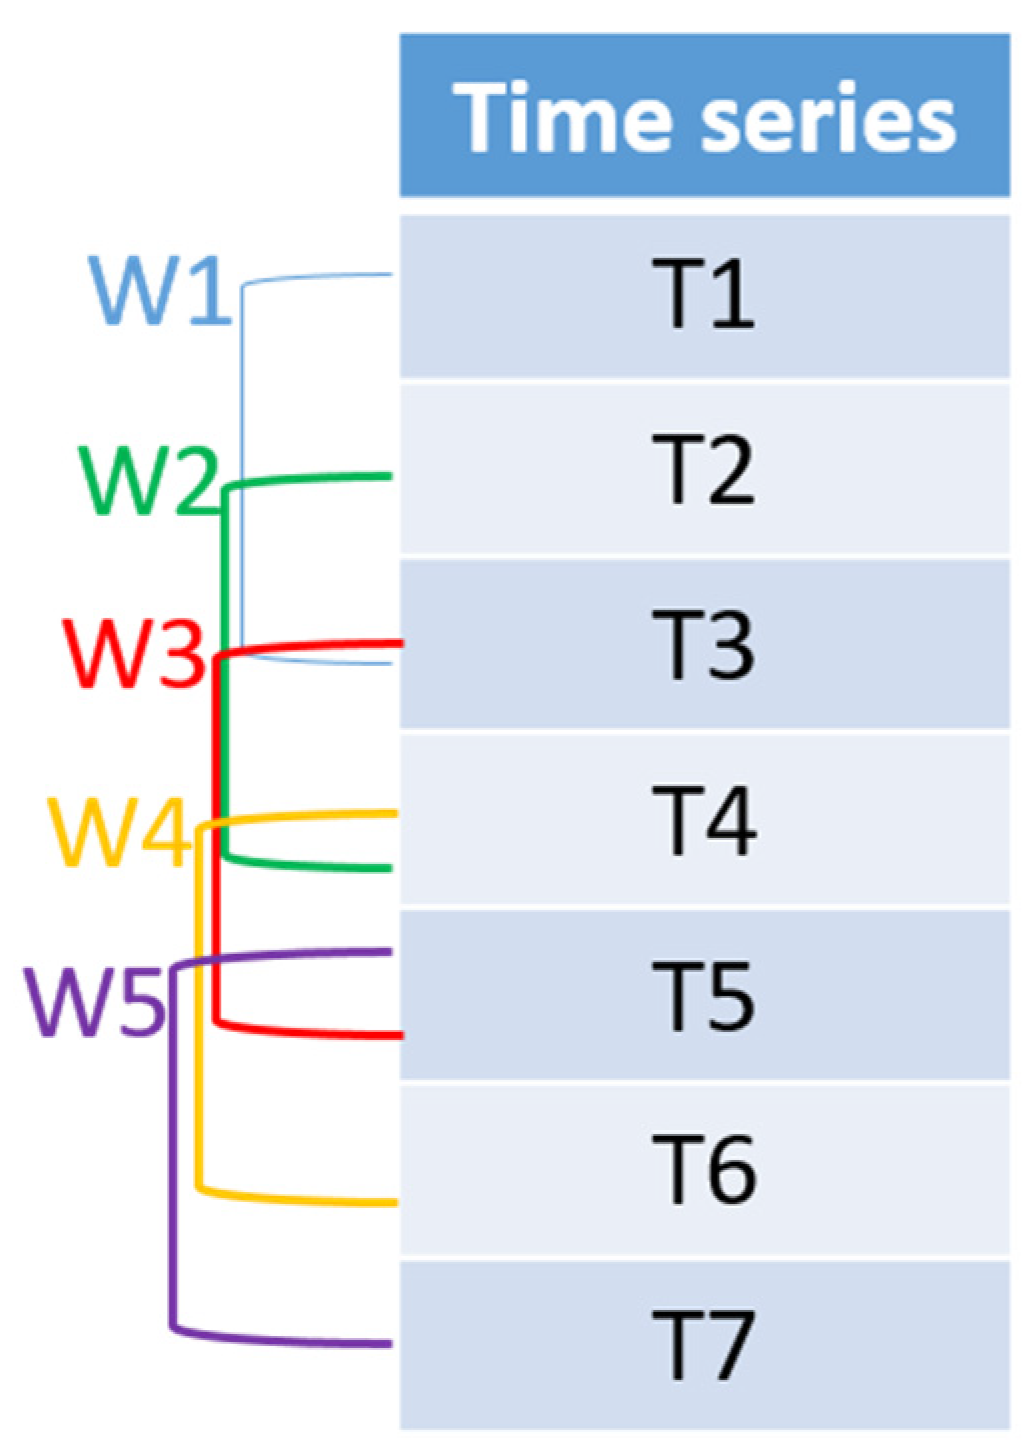
The moving window approach proposes taking the subset (48 data points in this case) of the data from the starting point and analyzing by applying the LV model, then taking the next 48 points starting from the second point, and so on, calculating the interaction parameters for each window, in order to observe the trends in the interaction parameters [7]. Figure 3 helps us to understand the moving window approach, where Wis are different time windows.

4. Experiment and Results

The experiment was performed in two steps: first, the base model was applied (Equations (3) and (4)) and moving interactions were calculated; next, the model was modified, first with LCC growth, and then with overall market growth, and moving interactions were compared with the base model. Overall market growth means the inclusion of FSCs in the growth. The parameters were calculated using the non-linear least-squares method. The precision, accuracy, and model significance are compared in terms of CIs, mean absolute percentage errors (MAPE), and p-values for interaction parameters, respectively.
Table 3 shows the results for the overall data for all three cases, using Equations (3) and (4). This table shows that without external factors, the model exhibits a mutualism relationship between ILCCs and AWA, with reference to Table 1, as both interaction parameters are positive; however, one p-value is higher than 0.05, so the resulting relationship is insignificant. However, the inclusion of LCC growth and overall market growth improves the results, as both results are significant, though in both cases, the relationship remains one of mutualism, which can be referred to as collusion. The resultant competitive LV model is provided on the basis of the assumption that this relationship does not change over time, whereas [7] already explained that the relationship is a function of time. Table 3 also shows that AWA are more sensitive to market growth in both the cases—when only LCC market is considered (87,910) and when the overall market is considered (402,700). This shows that AWA perform better in expanding markets as compared to ILCCs. The p-values represent that both the modified models are more reliable and deliver significant result as compared to the base model. All three models imply a similar relationship (mutualism), but the results of the base model are non-significant, so cannot be considered.
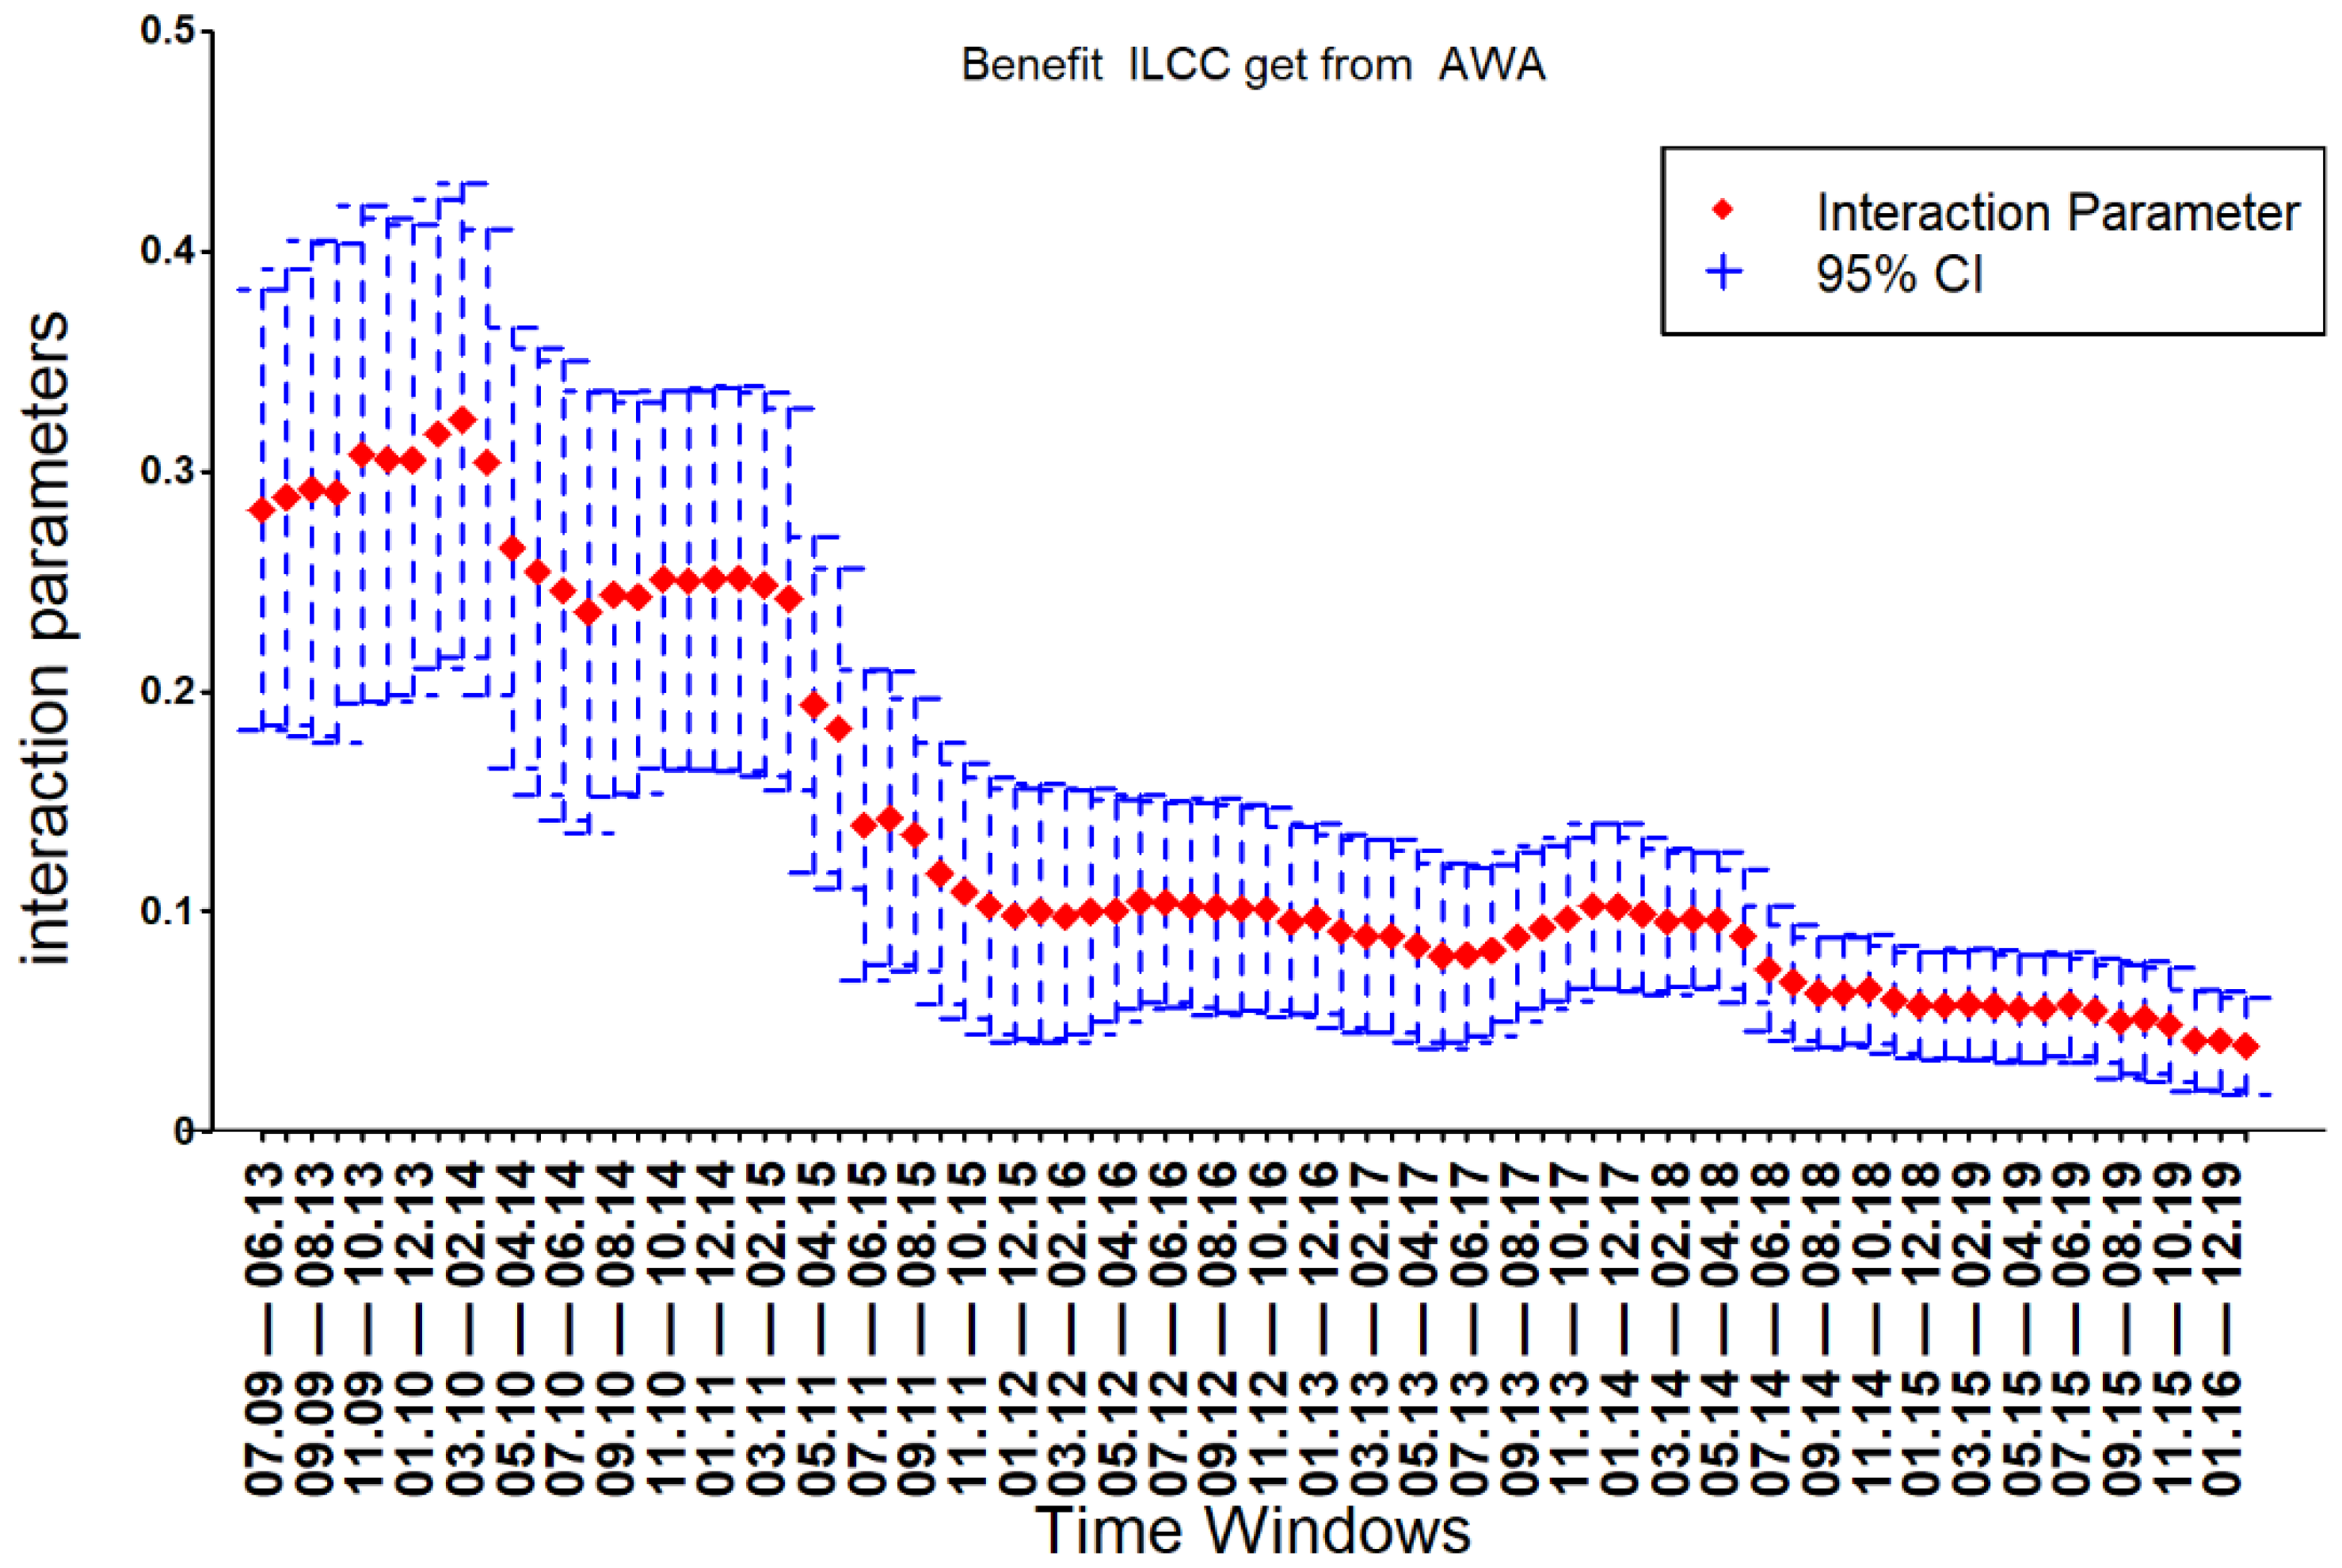
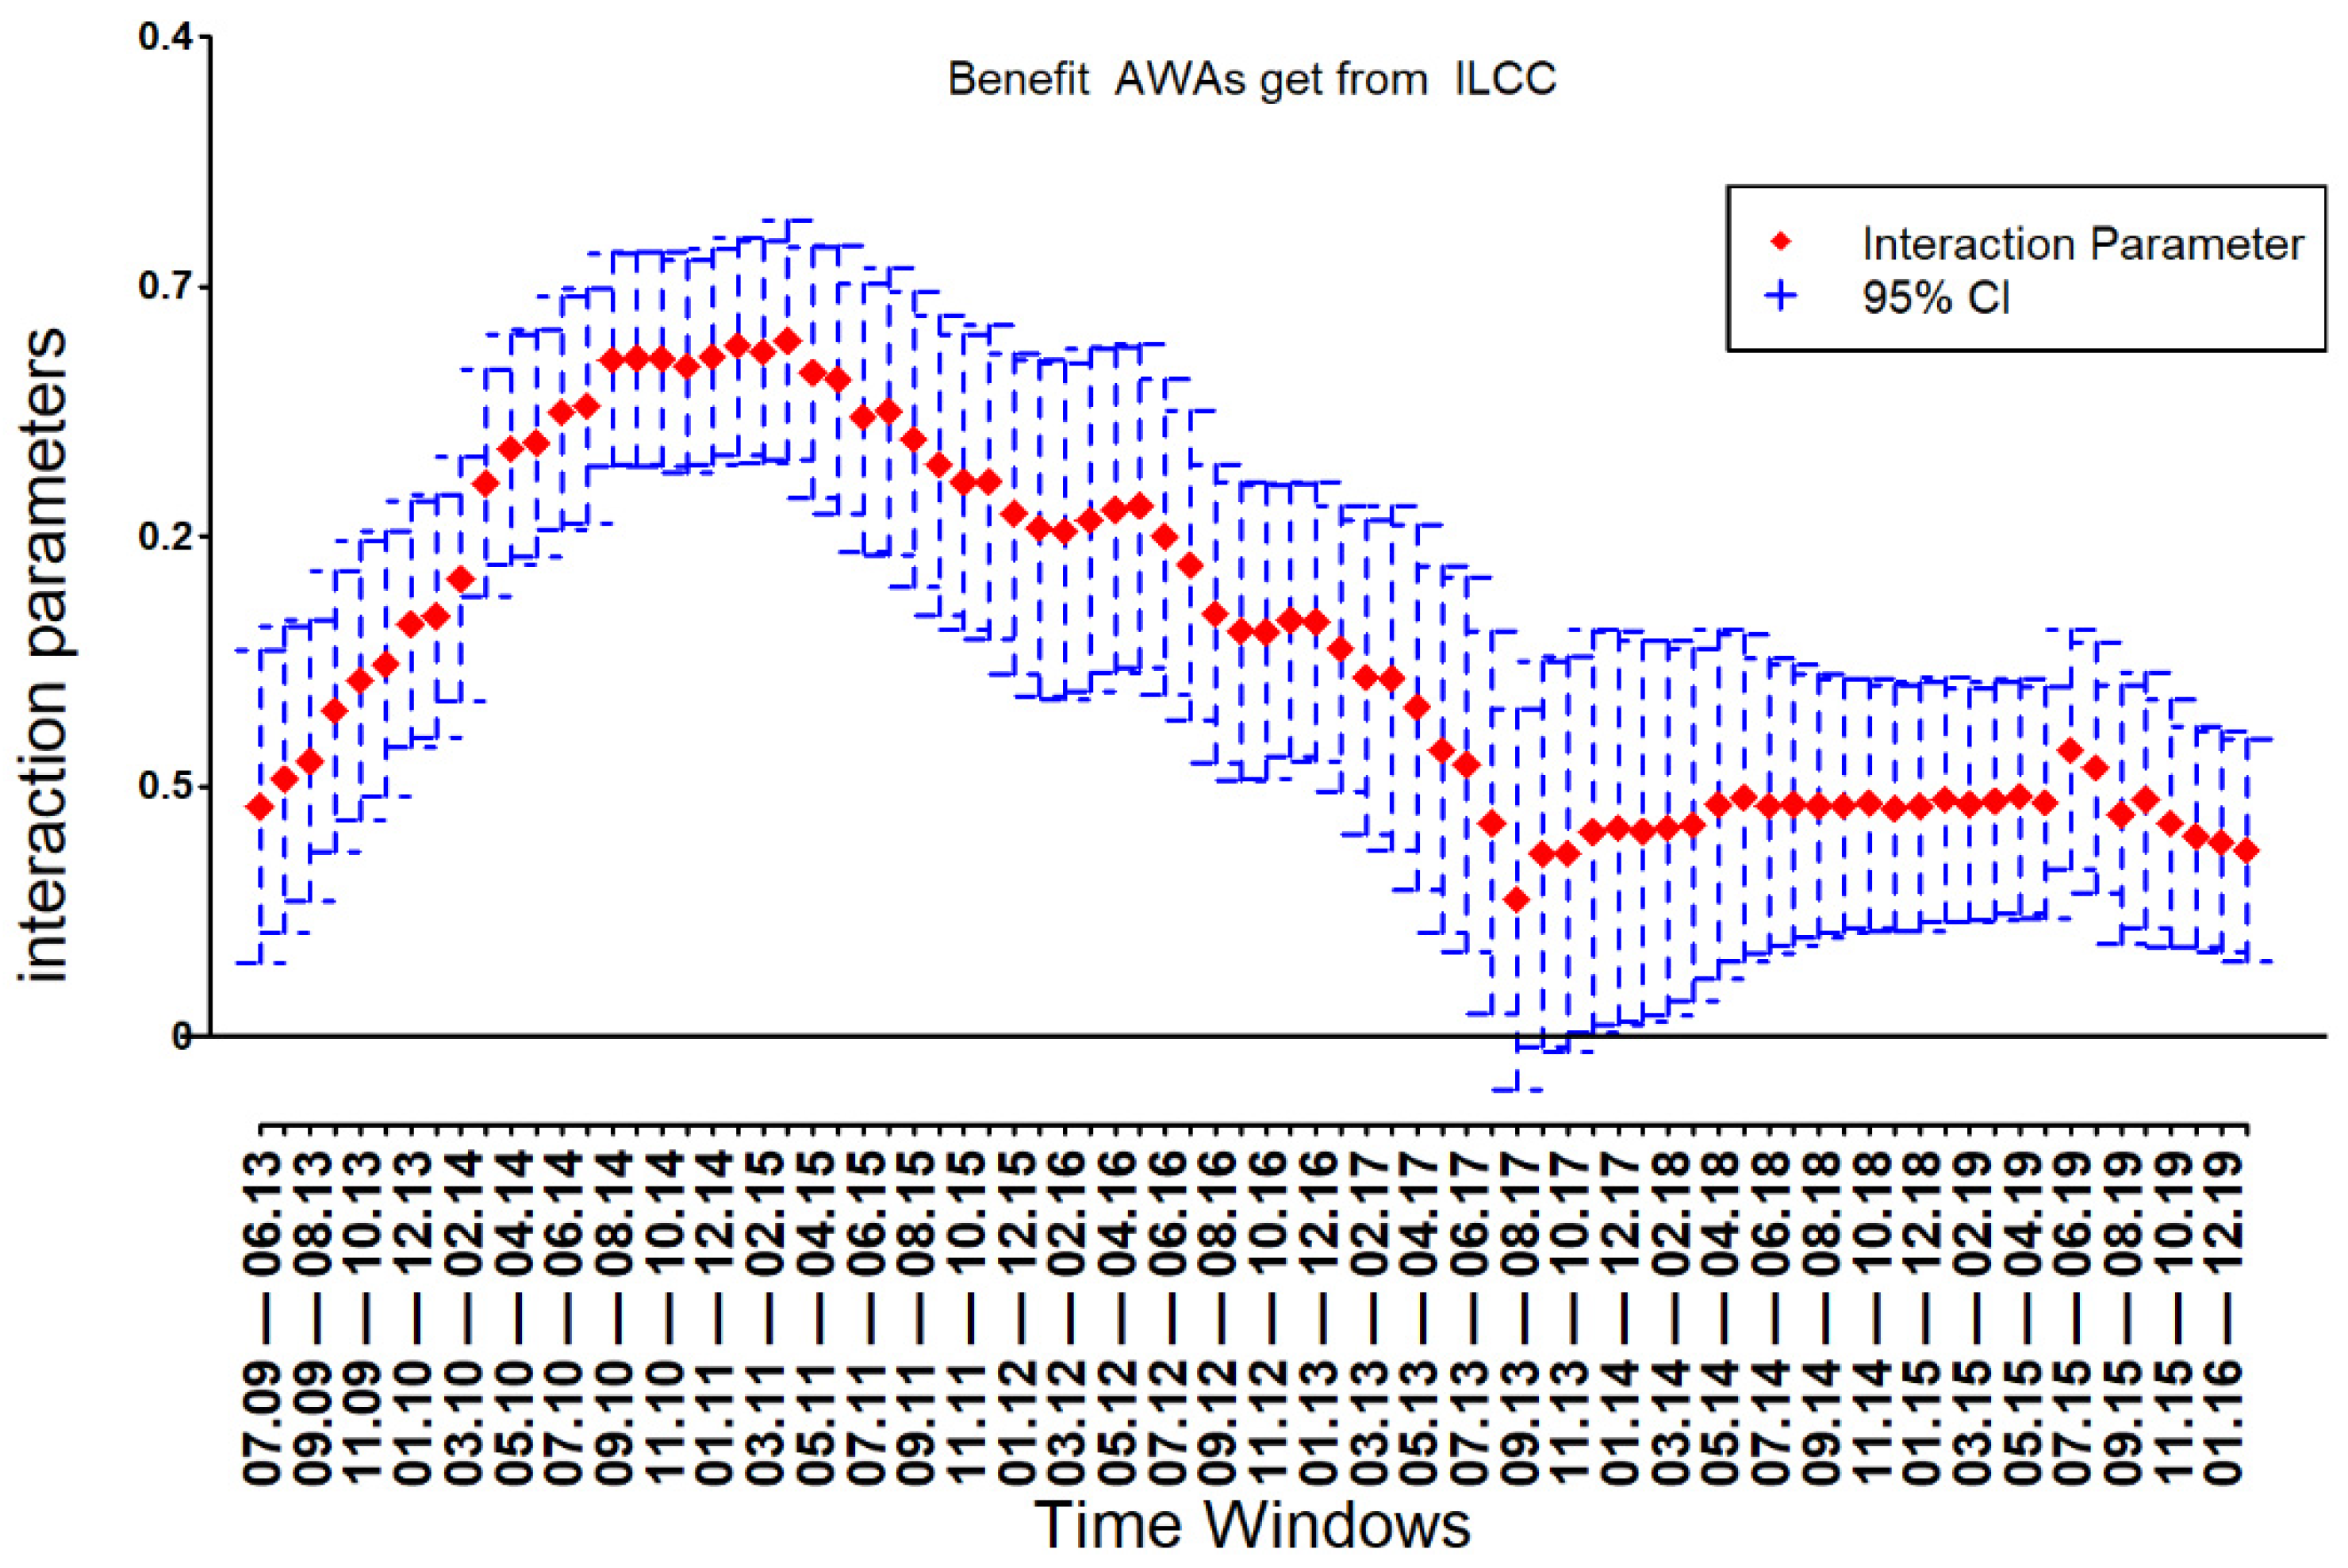
Figure 4 and Figure 5 represent the interaction parameters calculated for all the time windows (base model), where the results show that the relationship was initially mutualism; however, this is unexplained in the later windows, due to the insignificance of the later part. Considering the CIs rather than considering the interaction parameter shows that the relationship changed from mutualism to commensalism, which is still a form of cooperation (Table 1).
Figure 6 and Figure 7 represent the interaction parameters of the model when the model was modified using overall market growth as an external factor. This model shows the similar behavior of the interaction terms, and explains the similar relationship to the base model; however, comparing Figure 4 with Figure 6 shows that there is a shift in the interaction parameters of AWA, from − to +, in the later windows, although this is still insignificant.
Figure 8 and Figure 9 show the interaction parameters of the modified model when the market growth of LCCs is considered as an external factor. This model clearly shows that, throughout the windows, the relationship is one of mutualism (collusion); however, it provides interesting insights.
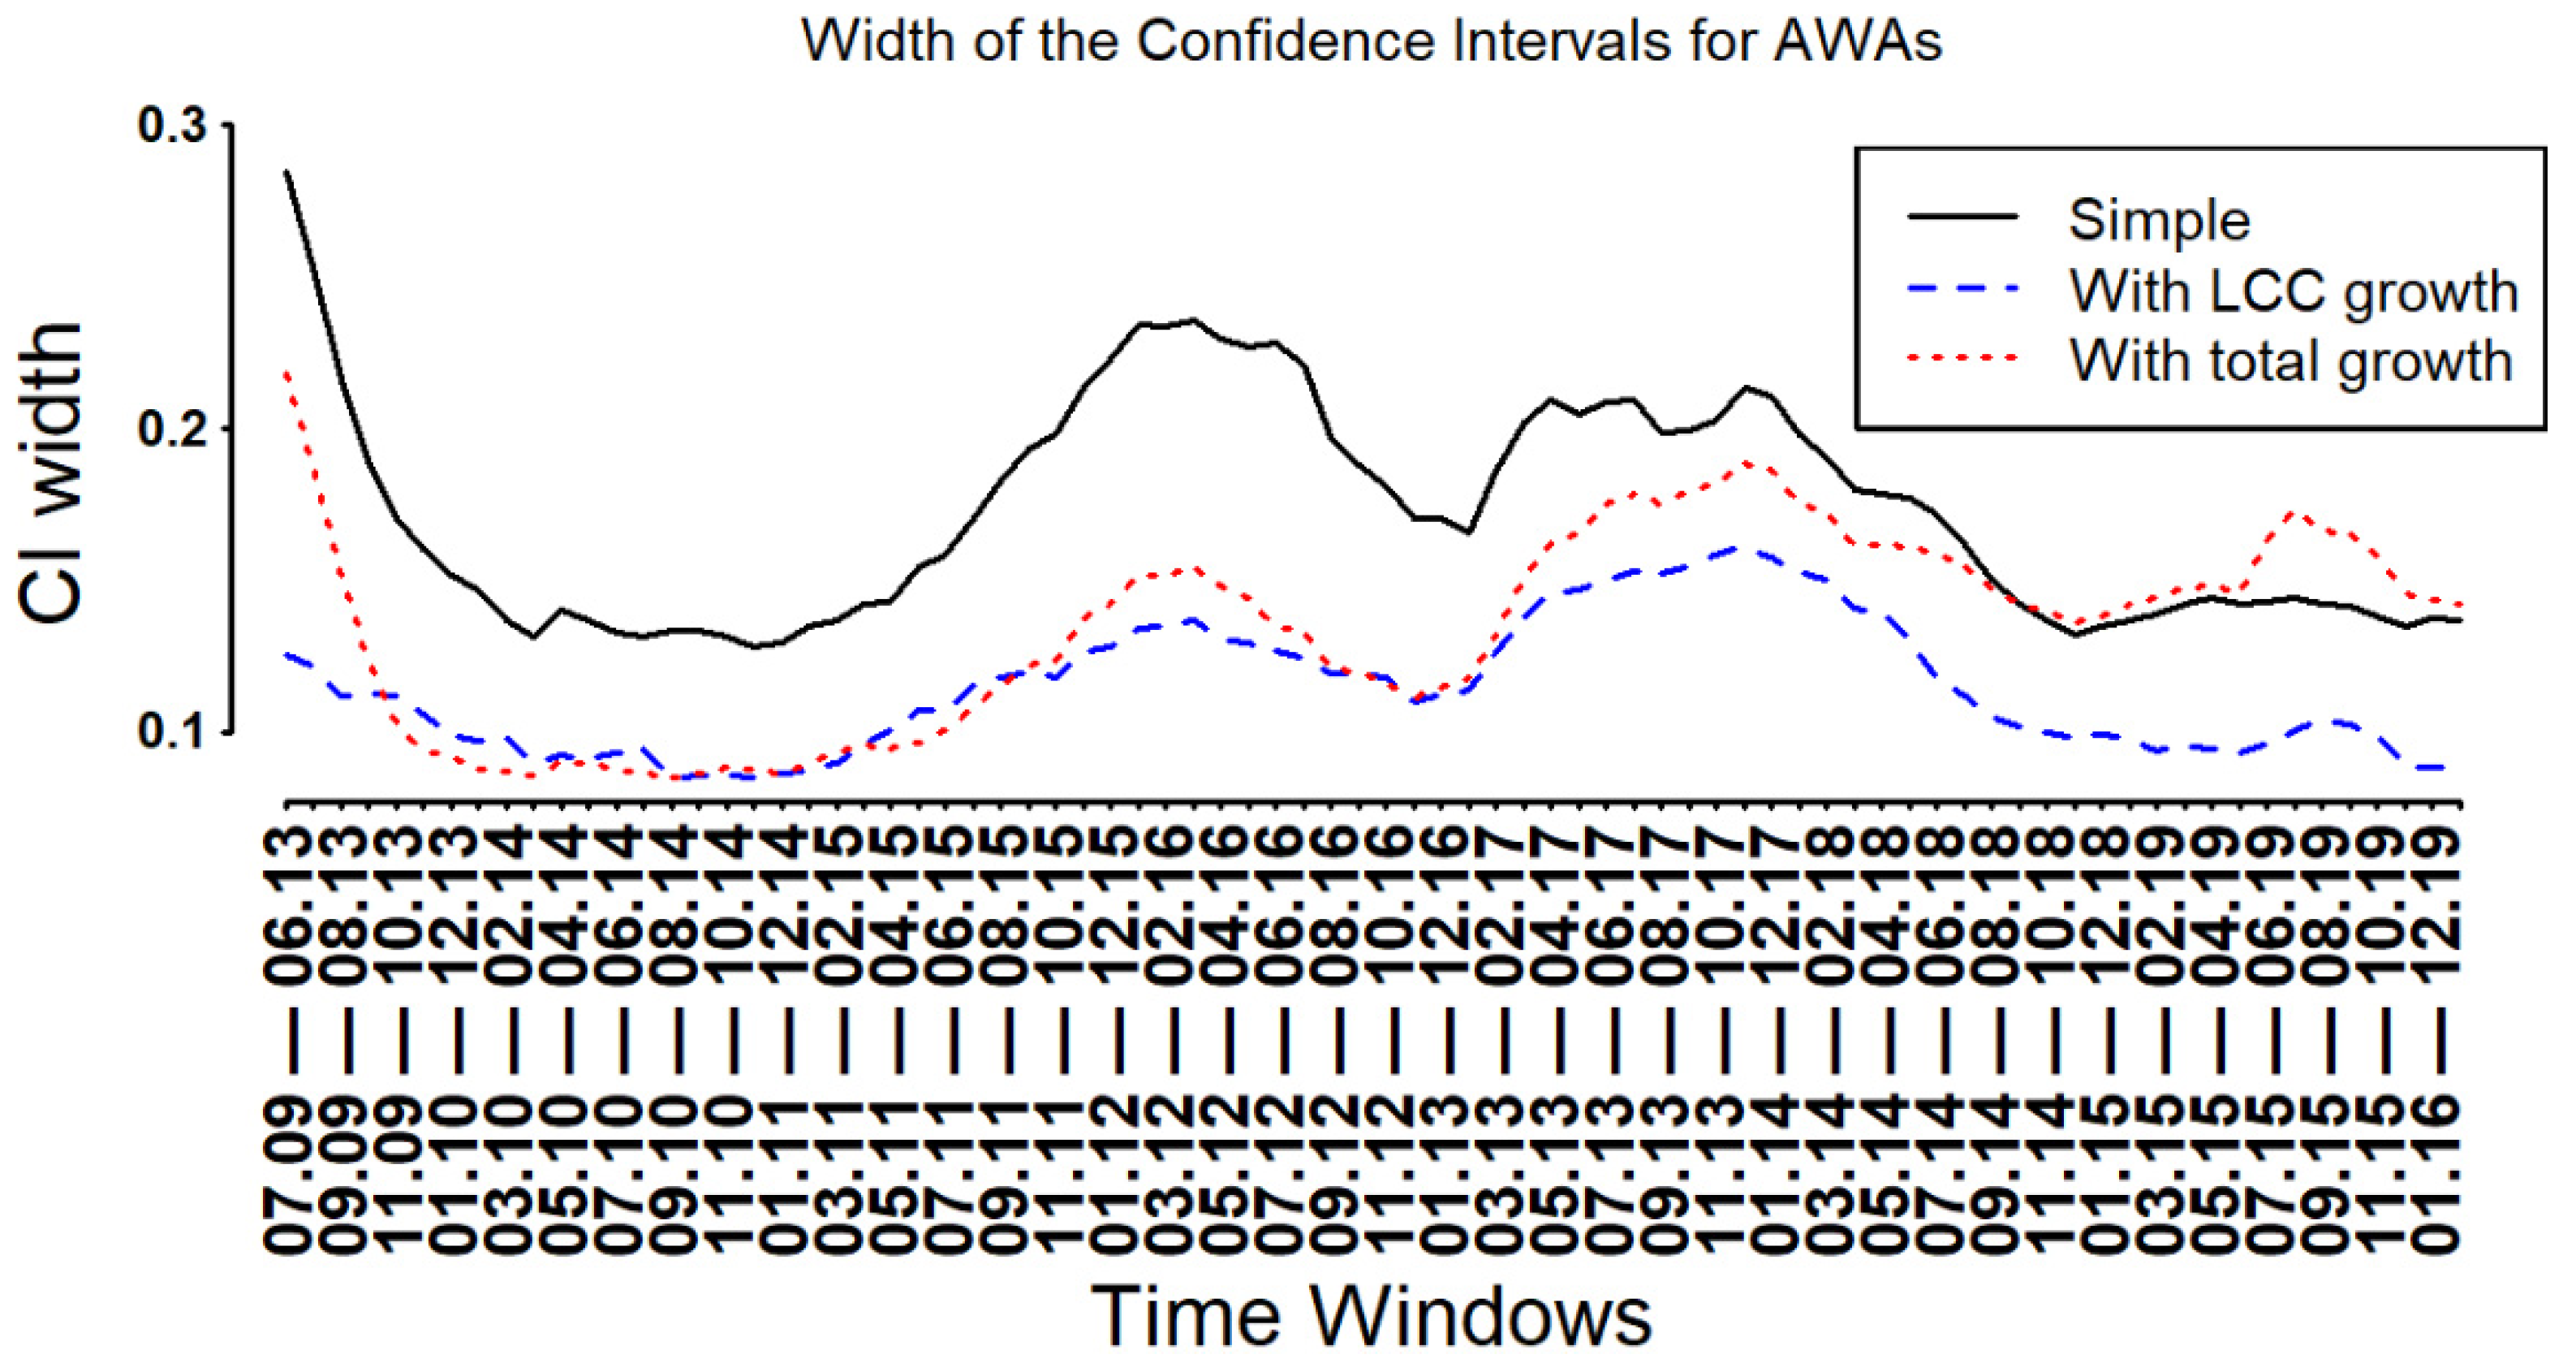
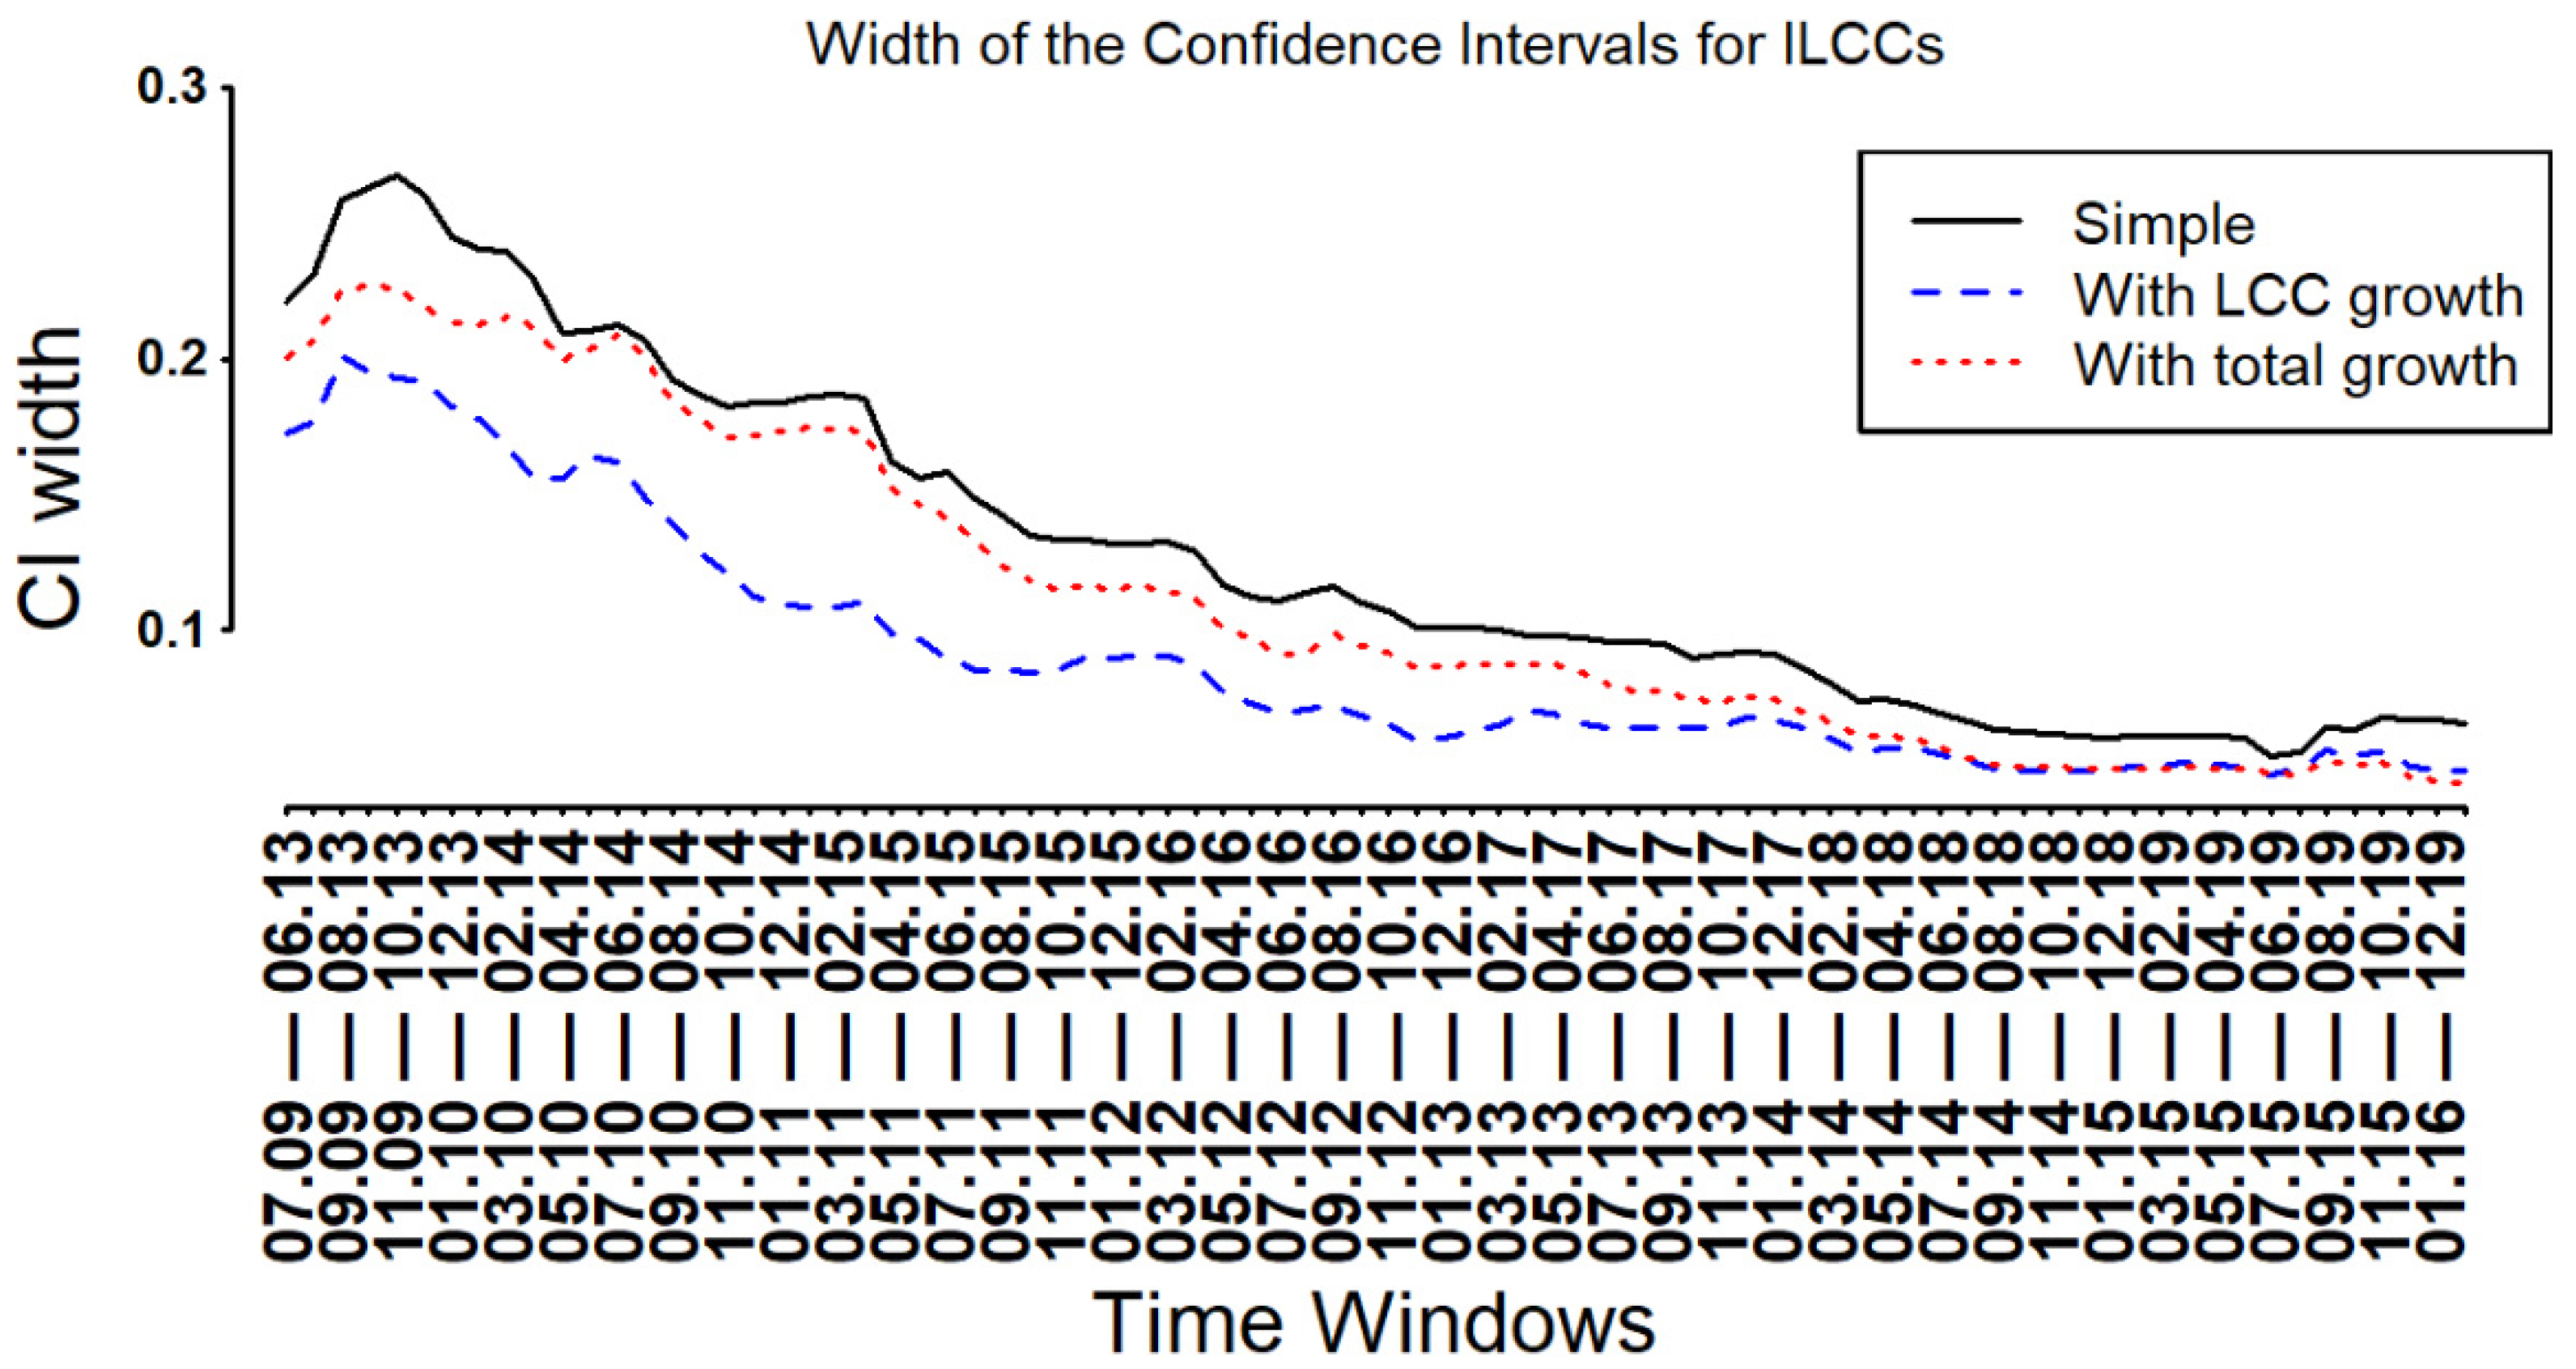
The modified LV model merged with the moving window improves the results, and helps us to gain more insights into the competitive dynamics between ILCCs and AWA. Here, the CIs play a very important role, as the interaction parameters alone may imply the wrong relationship. For example, in Figure 4 and Figure 5, if only interaction parameters are considered, the relationship shown is mutualism, when in fact it is not in later windows, because CIs cross the origin. Similarly, Figure 6 and Figure 7 show that the relationship changed from mutualism to predator–prey, but the predator–prey part was insignificant. However, in the third case, Figure 8 and Figure 9 show that the model revealed that the relationship remained one of mutualism through all windows, but the level of that mutualism fluctuated. Figure 10 and Figure 11 show how the modified models with external factors improved the CIs’ width. A very interesting point here is that the fluctuating width of the CIs suggests that the data are non-stationary, and variance changes through the windows. To achieve a similar level of confidence, the sample size (window size in our case) needs to be increased. The modified models reduced the CI width, as well as the width variance. Hence, the modified models can provide more reliable results.
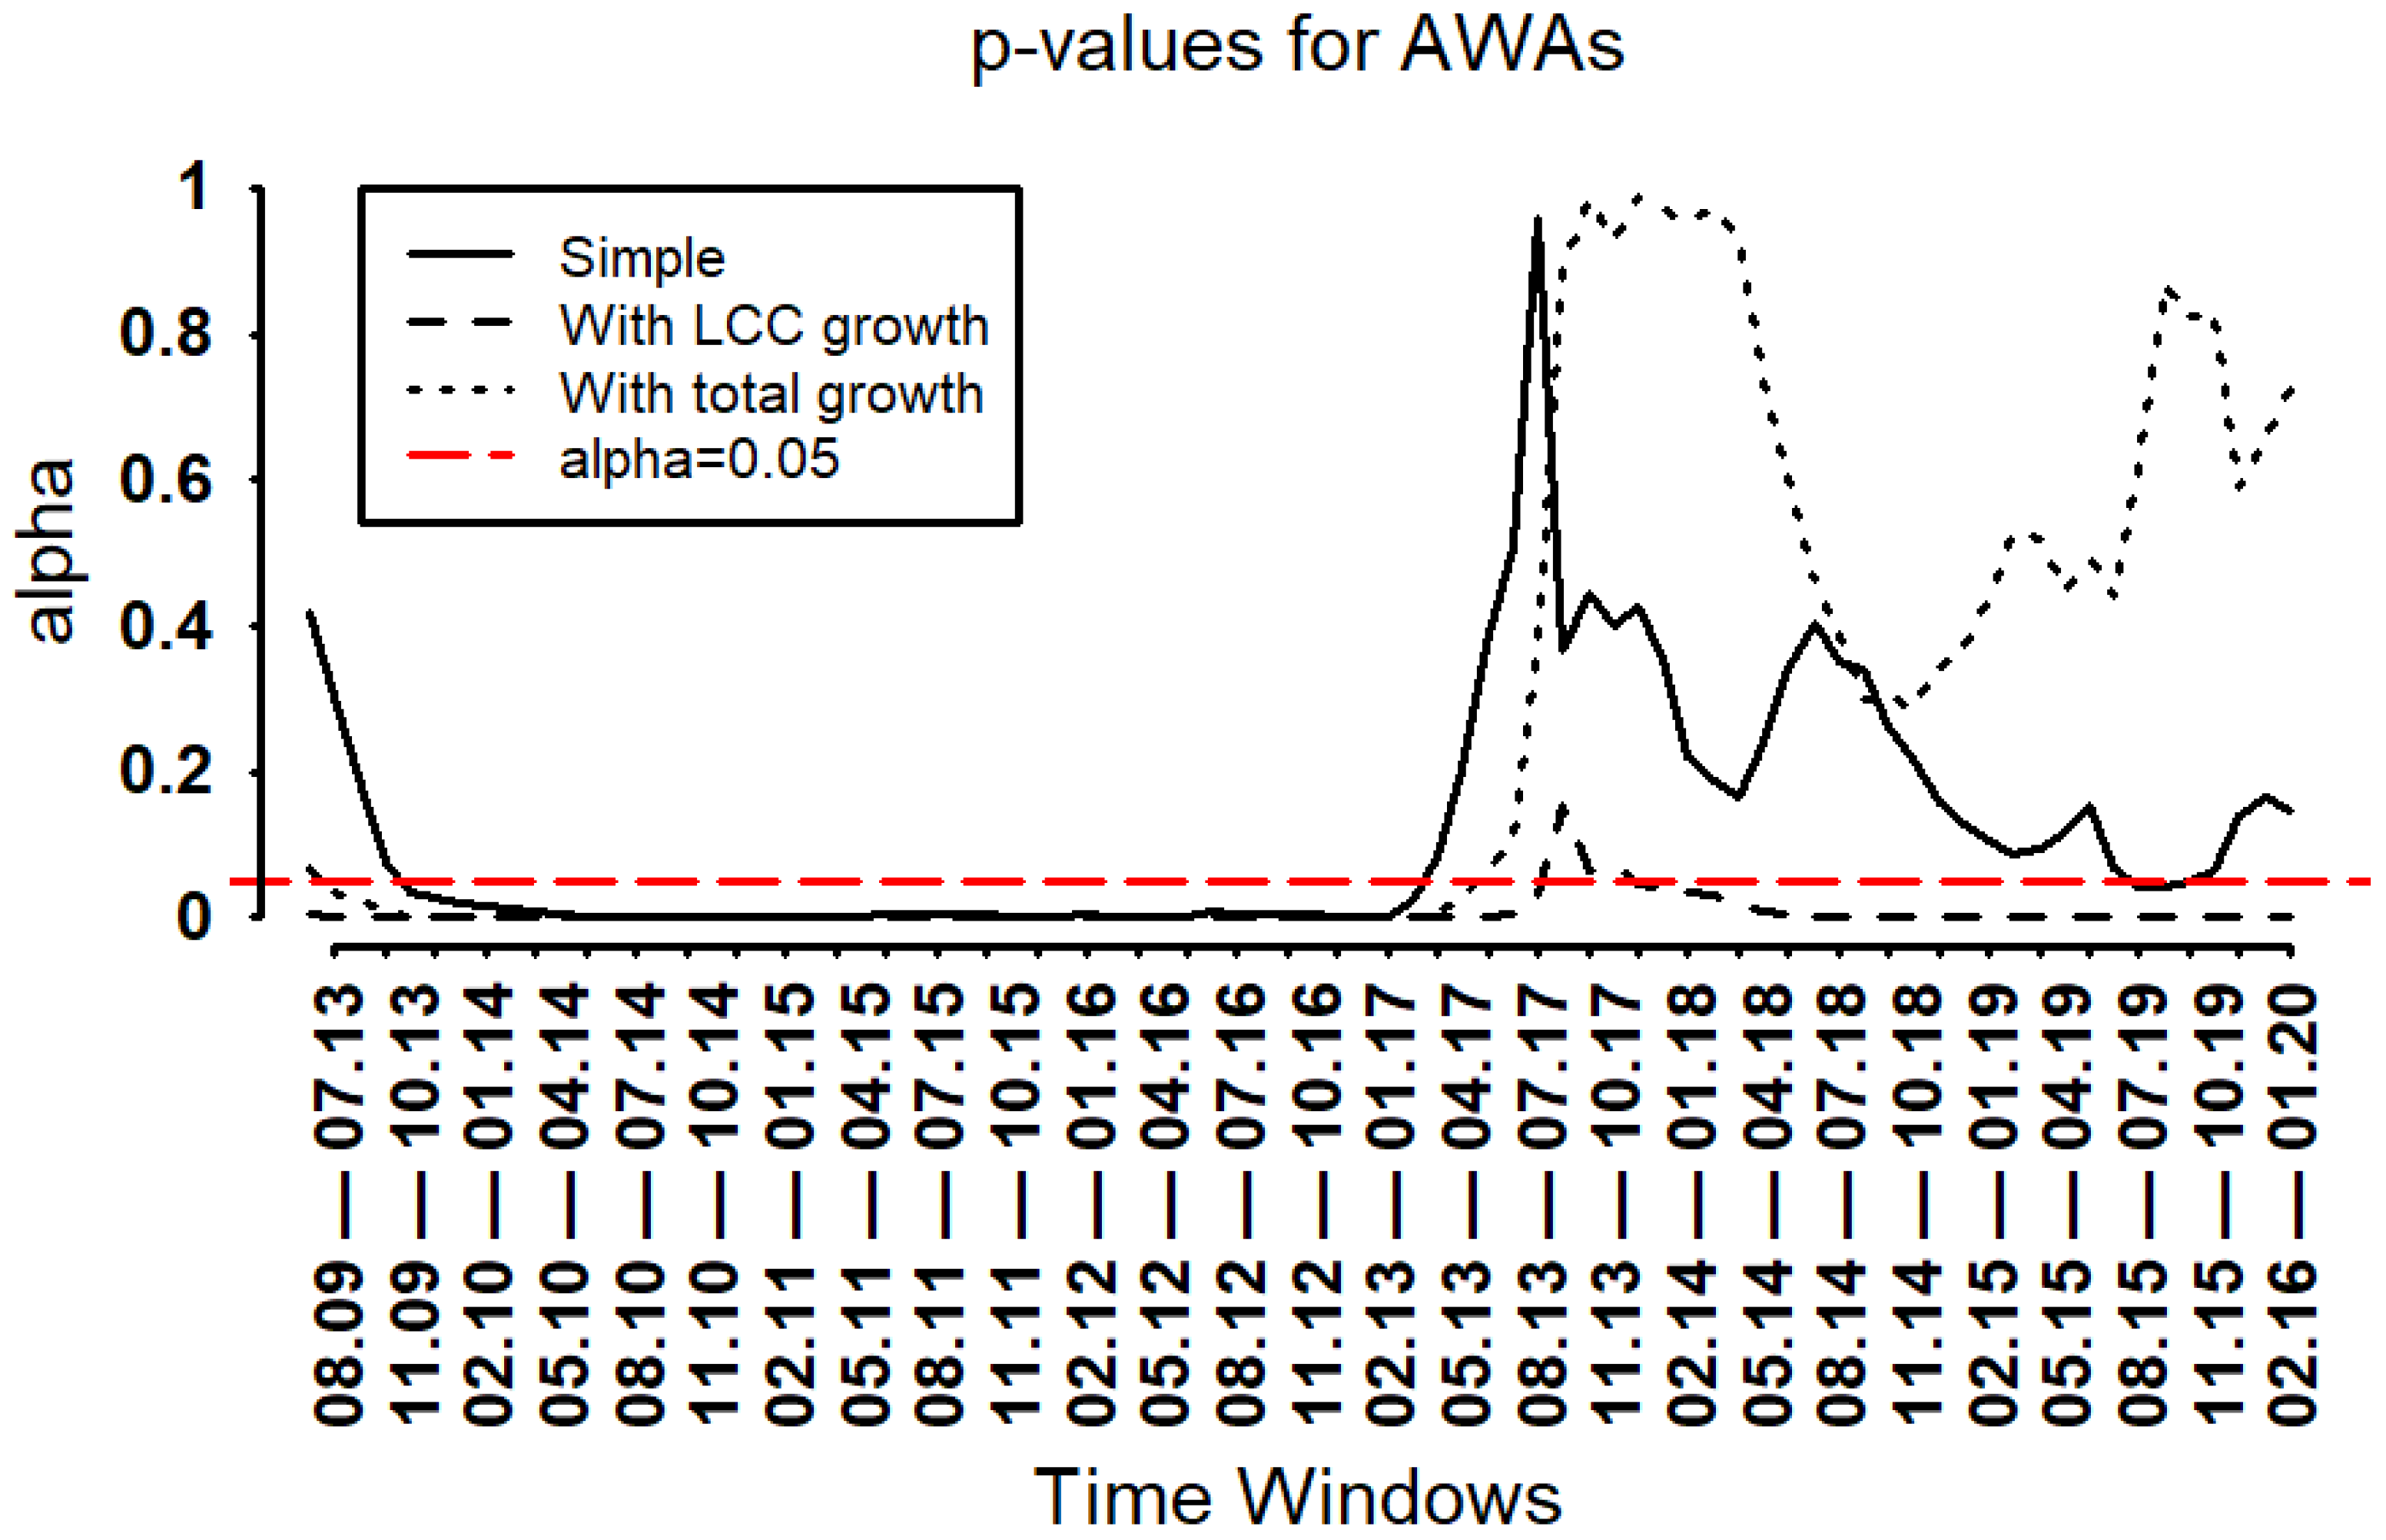
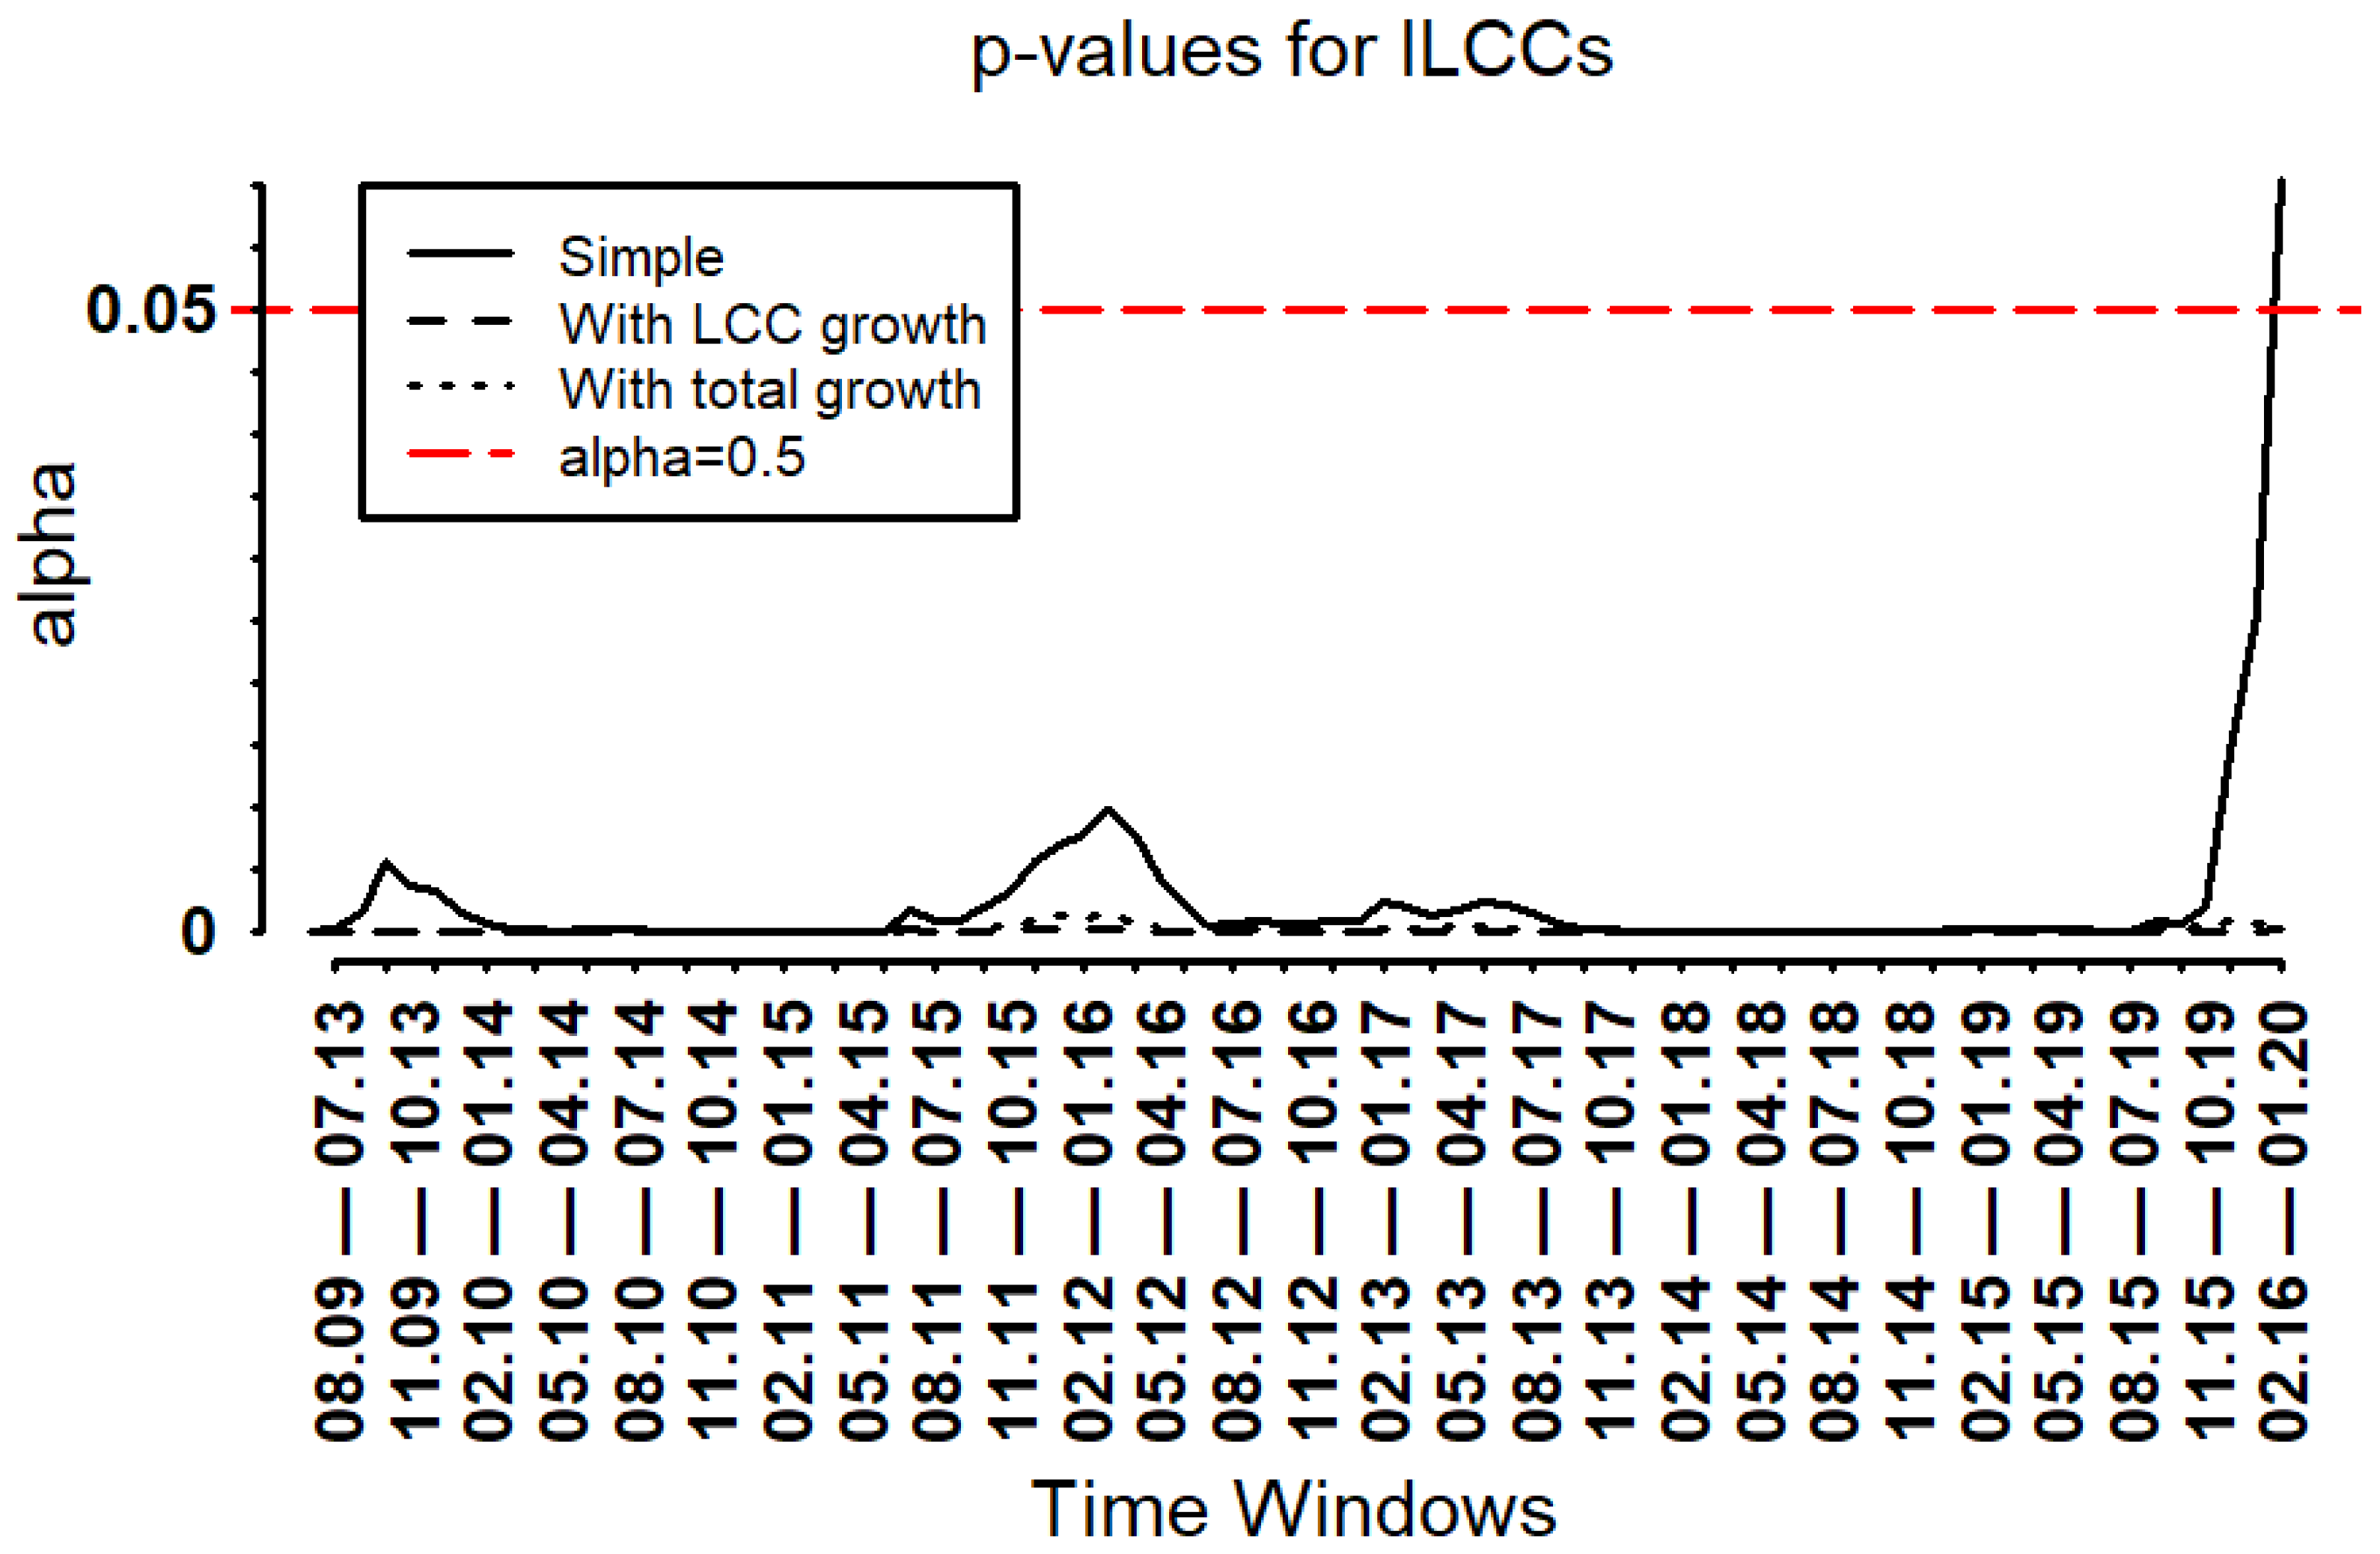
While it is evident that the modified models provide more precise results, we have seen CIs not crossing the origin in the model with LCCs growth. With reference to Table 3, the base model without any factor using overall data, the p-value for AWA was above the threshold of 0.05. As such, the p-value for each window was collected, and these are presented in Figure 12 and Figure 13, which show that the p-values for all the windows for the model with LCC growth are under 0.05:
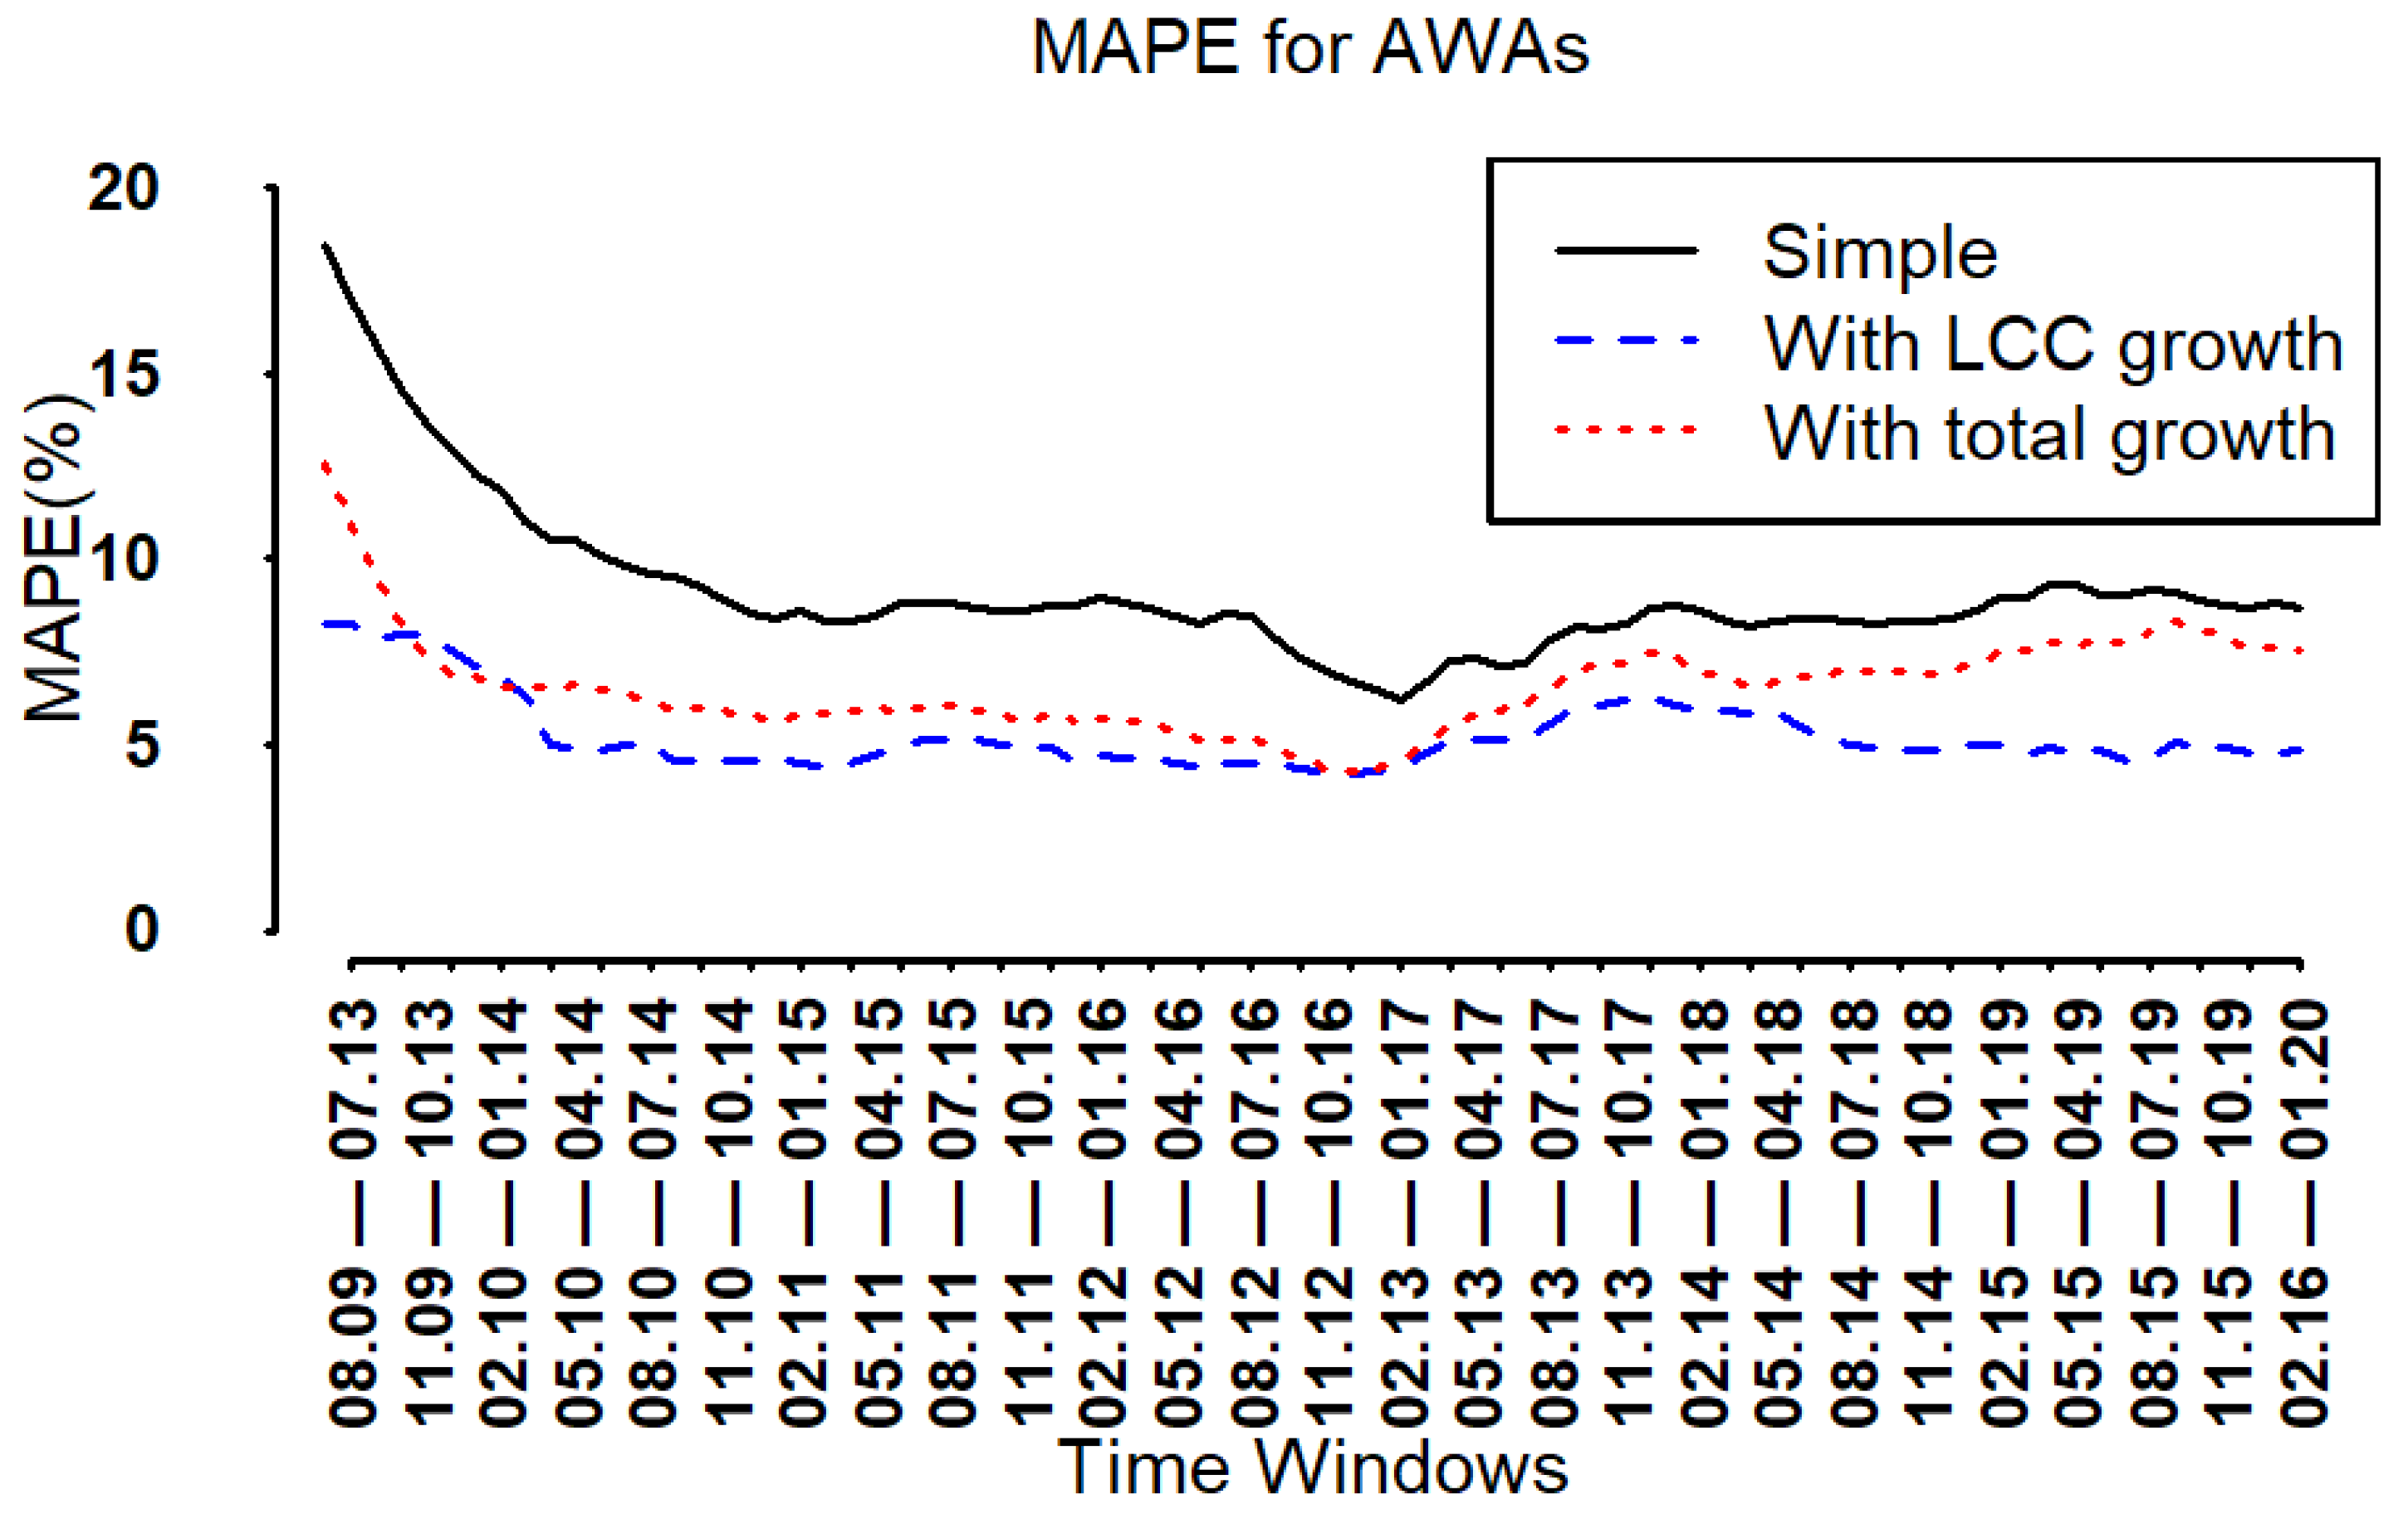
Comparison of the modified models with the base model showed that in terms of precision and significance, the model with LCC growth as an external factor was better than the other two models; however, the question of accuracy remained. To answer this question, the mean absolute percentage error (MAPE) value for each window was calculated and presented in Figure 14 and Figure 15. It can be observed that in terms of accuracy, both of the modified models consistently performed better than the base model.

5. Discussion

A comparison of the proposed modified models with the base model reveals that the model with LCC growth, which is the combined growth of the ILCCs and AWA, performs better than the base model, as well as the model with overall growth, which combines the growth of the LCCs and FSCs on all three fronts of precision, accuracy, and significance. The reason for this is that the LV model has the limitation of self-containment, and considers the total population to be constant; on the other hand, the South Korean aviation market is expanding, and this expansion is basically because of the LCCs market [8]. This is reflected in our proposed models; since the FSCs growth is stable, the base model is less responsive to overall growth, while it is more sensitive to LCC growth. Theoretically, this makes sense, as such studies as those by [67,68] and the UK Civil Aviation Authority (2006) suggest that at times, LCCs and FSCs are two different markets. Further, the model with LCCs growth will be considered as the best of these models, and will be discussed. This study investigates the competition between ILCCs and AWA, and intends to evaluate the AWA’s performance against ILCCs, while knowing that AWA partially follows the success factors proposed by [2]. Figure 1 shows clearly that the ILCCs have higher passenger demand in comparison to AWA, but this does not simply answer the question raised by this study, as the internal dynamics are more complex. As the first step to gauge these dynamics, the overall data were used to run the LV model presented in Equations (3) and (4). Notice that the ILCCs and AWA share a cooperative relationship, as both dynamic parameters are positive, whereas the AWA are more responsive to market expansion (Table 3). This indicates that with market growth, the AWA are growing faster than the ILCCs. Figure 6, Figure 7 and Figure 9 present the changing dynamics, showing how the relationship of mutual benefit has changed over time and is not static, similar to the LCC–FSC competition in the South Korean business and leisure routes, which is consistent with [7,8]. Figure 9 shows that the benefit AWA get from ILCCs has been changing over time; initially, it increased up to 2014–2015; it then started decreasing, and became stable around 2017. On the other hand, the benefit LCC derives from AWA (Figure 10) decreased up until 2014–2015, and became mostly stable after that, except for a little downwards trend after 2017–2018.
It is obvious that establishing AWA presents far more extreme challenges than establishing LCCs. In the former case, airlines need to adopt a business-model-within-a-business-model, and would try to use as many resources from the parent company as possible. The LCC model is not only about continuously adding value, but waste management as well, where cutting waste requires the identification of the waste, while the latter case has no such constraints. When they enter a market as a pioneer, LCCs usually compete only with legacy carriers, and that is a competition between two different models. However, AWA that compete with LCCs have to face self-competition, which means on occasions that an AWA competes with its parent company. However, AWA can enjoy the resources and the pre-established company image of the parent company. It is important to understand that FSCs compete on the basis of responsiveness, while LCCs compete on efficiency. Therefore, FSCs need to achieve a balance of efficiency and responsiveness, and it can be a challenge [69] to maintain both approaches side-by-side [2]. Ref. [2] found that one of the five success factors for AWA is to completely separate their operations from those of their parent airlines. It is hard to determine whether AWA have complied with these suggestions. However, this study tried to search some resources that indicate whether South Korean AWA have followed these suggestions or not.
At first glance, it can be inferred that ILCCs have evolved to be more stable than AWA, except for in the initial years. In the initial years, the increasing trend of AWA benefitting over ILCCs and the decreasing trend of ILCCs benefitting over AWA indicate that the AWA impact the ILCCs, as the relationship was moving from one of mutualism to predator–prey (reduced collusion). However, the stability of ILCCs forced the AWA trend back towards mutualism, and in recent years, the mutualism relationship has been more or less stable, except for a slight increase in AWA benefit over ILCCs. The main reason for this mutual relationship and the relatively smaller fluctuation in competition dynamics in later years is the lower market growth, and the larger fluctuations in early years are because of the higher growth. This also indicates that, in expanding markets, the relationships are more likely to be cooperation (high collusion), while in saturated or declining markets, the relationships are expected to be competitive [70]. As shown in Figure 9 and Figure 10, around 2017, the relationship almost reached one of commensalism from mutualism (collusion broken), as the LCC’s growth became negative in the year 2017 due to MERS, followed by THAAD (Figure 16). However, the LV model can still explain who is performing better in expanding markets, as explained by [8]. Overall, the AWA have done well in competition with ILCCs in expanding markets; however, in a crunch situation such as MERS, ILCCs were more stable, while AWA fluctuated. Over time, the growth rate is declining as the market is approaching saturation, and more competition is expected in the near future. However, ILCCs have acknowledge the success of AWA, as South Korean LCCs submitted a petition against Asiana Airline’s (FSC of South Korea) move to establish a second AWA [71]. Figure 1, which presents the market shares of ILCCs, AWA, and FSCs of South Korea, helps us understand that the LCCs succeeded in gaining over 50% of the market share up until 2019. However, almost half of that is owned by AWA. Although in terms of market share, the LCC strategy outperforms that of FSCs, it is important to understand that most of the aviation market of South Korea is still ruled by the two FSCs and their AWA (Figure 1).
However, keeping the market situation in mind, and in particular the roles of MERS, THAAD, and now COVID-19 (using Figure 1, Figure 9 and Figure 10), the story may look quite different. As the LCC market was expanding, the AWA were enjoying a good market position by eating up ILCCs, until the emergence of MERS in 2015. After MERS, ILCCs became stable and AWA were losing, and by the beginning of THAAD in 2017, the relationship reached the verge of a one-way relationship. Later, the AWA started to gain ground, and became stable, until the COVID-19 pandemic began. The decline of AWA can be observed in the last section. Still, it is hard to say whether AWA are more vulnerable to market growth, or that market growth is actually due to AWA. Does this mean that once the pandemic is over, AWA will become the reason for market expansion?
The cooperative relationship between ILCCs and AWA hints at the tacit collusion explained by [61]. Previous studies, such as [7,8], on the South Korean aviation market suggest that despite the changing nature of the interaction between LCCs and FSCs, there is no clear evidence that these two entities compete, and they rather show a mutualistic behavior. However, one of the major goals of airline deregulation has been to demolish the duopoly of South Korean FSCs Korean Air and Asiana Air [72]. The deregulation was expected to allow new entrants to join the aviation industry, which would induce competition, and passengers would be offered lower prices and airlines would offer services with minimal profit margins. The results of our model show no trace of pure competition when prices are fairly low, and competitors find it hard to make a profit. Still, over 70% of market shares are held by FSCs and AWA, which shows the Korean market is oligopolistic. These results are aligned with [73], as they show that one of the objectives of deregulation could not be achieved in South Korean aviation markets. This is a potential insight for policymakers, and raises several questions. Has the South Korean market really become an oligopoly? Are South Korean airlines enjoying high/fixed profit margins in spite of deregulation? Despite oligopoly being illegal, are Korean airlines cooperating secretly without announcing it? If yes, how do South Korean policymakers tackle this oligopoly so that fair competition can be created and passengers can get real low-price fares?

6. Conclusions

This study identifies that LCCs hold over 50% of the market share, but a significant amount of the LCC market shares are actually held by AWA. This shows that the overall market is still dominated by the two business giants (Asiana Airline and Korean Airline) (Seoul, South Korea) in the South Korean aviation market. Foreseeing the “new normal”, FSCs will face the challenge of retaining their market position, as the economic crisis triggered by the COVID-19 pandemic must have impacted FSC travelers. There are still a few routes whereby FSCs can introduce AWA, as the results show that AWA are more vulnerable to growth, and may in fact cause growth. The cost effect can bring many FSC travelers struck by the COVID-19 crisis back to the airline industry, since many FSC users would like the cost-focused services offered by the FSCs instead of trying their luck with the ILCCs.
This study contributes in multiple ways. First, it contributes to competition modelling, whereby the LV model is modified for a growing market by adding a growth factor, which provides a better understanding of competition in a growing market. Further, the modification improves the precision and accuracy of the LV model, reduces the variance, and addresses the limitation of stationary data. Finally, the model reveals that AWA have been successful in competing with the ILCCs, and have gained market shares for FSCs. However, in a fluctuating market, AWA are more vulnerable; once the market is near to reaching saturation, it would be hard to compete with stable ILCCs. The model explains the MERS effect in the South Korean market, wherein the relationship between ILCCs and AWA has almost become one-way. Although the vulnerability of AWA is yet to be studied, one of the main reasons for it is that AWA do not follow all the success factors suggested by [2]. In a growing market, AWA are doing well; however, in a saturated market, AWA may have to separate their operations completely from their parent network carriers. Realistically, it is always more challenging for ILCCs to perform as compared to AWA, because AWA can always share resources with their parent companies, and vice versa. This point is reflected by the fact that South Korean ILCCs are under the influence of debt financing [63], and debt may impact the operational performance of any firm [74]. Additionally, another factor is the halo effect, by which passengers tend to choose AWA because of the trust and the image of the parent company. Specifically, the South Korean FSCs (Korean Air and Asiana air) (Seoul, South Korea) have been in the South Korean market for several years, and passengers have a very positive perception of these airlines [63].
The self-contained nature of the LV model remains even after the addition of the growth factor, even though other factors such as price can be used to reduce this limitation in future research. For the moment, however, the price data of the South Korean airline industry are not available.

Author Contributions

Conceptualization, N.T.K. and Y.B.K.; Formal analysis, J.A.; Supervision, Y.B.K.; Validation, Y.B.K.; Visualization, A.A.R.; Writing—original draft, N.T.K.; Writing—review & editing, J.A. and A.A.R. All authors have read and agreed to the published version of the manuscript.

Funding

This research is funded by National Research Foundation of Korea, Fund ID is NRF-2021K1A3A1A17102392.

Institutional Review Board Statement

Not applicable.

Informed Consent Statement

Not applicable.

Data Availability Statement

The data used in this study are openly available at https://www.airport.co.kr/ (accessed on 6 March 2022).

Conflicts of Interest

The authors declare no conflict of interest.

References

  1. Graham, B.; Vowles, T.M. Carriers within Carriers: A Strategic Response to Low-Cost Airline Competition. Transp. Rev. 2006, 26, 105–126. [Google Scholar] [CrossRef]
  2. Gillen, D.; Gados, A. Airlines within airlines: Assessing the vulnerabilities of mixing business models. Res. Transp. Econ. 2008, 24, 25–35. [Google Scholar] [CrossRef]
  3. Lin, M.H. Airlines-within-airlines strategies and existence of low-cost carriers. Transp. Res. Part E Logist. Transp. Rev. 2012, 48, 637–651. [Google Scholar] [CrossRef]
  4. Raynes, C.; Tsui, K.W.H. Review of Airline-within-Airline strategy: Case studies of the Singapore Airlines Group and Qantas Group. Case Stud. Transp. Policy 2019, 7, 150–165. [Google Scholar] [CrossRef] [PubMed]
  5. Morrell, P. Airlines within airlines: An analysis of US network airline responses to Low Cost Carriers. J. Air Transp. Manag. 2005, 11, 303–312. [Google Scholar] [CrossRef] [Green Version]
  6. Pearson, J.; Merkert, R. Airlines-within-airlines: A business model moving East. J. Air Transp. Manag. 2014, 38, 21–26. [Google Scholar] [CrossRef]
  7. Khan, N.T.; Kim, Y.H.; Kim, Y.B. The dynamic impact of low-cost carriers on full-service carriers and the tourism industry of South Korea: A competitive analysis using the Lotka–Volterra model. Asia Pac. J. Tour. Res. 2018, 23, 656–666. [Google Scholar] [CrossRef]
  8. Khan, N.T.; Jung, G.; Kim, J.; Kim, Y.B. Evolving competition between low-cost carriers and full-service carriers: The case of South Korea. J. Transp. Geogr. 2019, 74, 1–9. [Google Scholar] [CrossRef]
  9. Smith, O. World’s Busiest Routes; the Busiest Route in the World Will Surprise You. 2016. Available online: http://www.traveller.com.au/ (accessed on 10 May 2017).
  10. Lo, S.-C. Dynamic Analyses for Passenger Volume of Domestic Airline and High Speed Rail. Int. J. Math. Comput. Sci. 2012, 6, 106–110. [Google Scholar]
  11. Small, K.A. A discrete choice model for ordered alternatives. Econom. J. Econom. Soc. 1987, 55, 409–424. [Google Scholar] [CrossRef]
  12. Soetevent, A.R.; Kooreman, P. A discrete-choice model with social interactions: With an application to high school teen behavior. J. Appl. Econom. 2007, 22, 599–624. [Google Scholar] [CrossRef] [Green Version]
  13. Kornstad, T.; Thoresen, T.O. A discrete choice model for labor supply and childcare. J. Popul. Econ. 2007, 20, 781–803. [Google Scholar] [CrossRef] [Green Version]
  14. Gracia, A.; De Magistris, T. The demand for organic foods in the South of Italy: A discrete choice model. Food Policy 2008, 33, 386–396. [Google Scholar] [CrossRef]
  15. Talluri, K.; Van Ryzin, G. Revenue management under a general discrete choice model of consumer behavior. Manag. Sci. 2004, 50, 15–33. [Google Scholar] [CrossRef]
  16. Márquez, L.; Cantillo, V.; Arellana, J. Assessing the influence of indicators’ complexity on hybrid discrete choice model estimates. Transportation 2020, 47, 373–396. [Google Scholar] [CrossRef]
  17. Chorus, C.G.; Pudāne, B.; Mouter, N.; Campbell, D. Taboo trade-off aversion: A discrete choice model and empirical analysis. J. Choice Model. 2018, 27, 37–49. [Google Scholar] [CrossRef]
  18. Coldren, G.M.; Koppelman, F.S.; Kasturirangan, K.; Mukherjee, A. Modeling aggregate air-travel itinerary shares: Logit model development at a major US airline. J. Air Transp. Manag. 2003, 9, 361–369. [Google Scholar] [CrossRef]
  19. Hsiao, C.-Y.; Hansen, M. A passenger demand model for air transportation in a hub-and-spoke network. Transp. Res. Part E Logist. Transp. Rev. 2011, 47, 1112–1125. [Google Scholar] [CrossRef]
  20. Birolini, S.; Besana, E.; Cattaneo, M.; Redondi, R.; Sallan, J.M. An integrated connection planning and passenger allocation model for low-cost carriers. J. Air Transp. Manag. 2022, 99, 102160. [Google Scholar] [CrossRef]
  21. Gatabazi, P.; Mba, J.C.; Pindza, E.; Labuschagne, C. Grey Lotka–Volterra models with application to cryptocurrencies adoption. Chaos Solitons Fractals 2019, 122, 47–57. [Google Scholar] [CrossRef]
  22. Liu, H.; He, J.; Chen, X. Research on Enterprise Monopoly Based on Lotka–Volterra Model. In Proceedings of the International Conference on Human Systems Engineering and Design: Future Trends and Applications, Munich, Germany, 16–18 September 2019; Springer: Berlin/Heidelberg, Germany, 2019. [Google Scholar]
  23. Wu, X.; Sun, M.; Chen, X.; Wang, J.; Guo, B. Empirical study of particle swarm optimization inspired by Lotka–Volterra model in Ecology. Soft Comput. 2019, 23, 5571–5582. [Google Scholar] [CrossRef]
  24. Xu, F.; Gan, W. On a Lotka–Volterra type competition model from river ecology. Nonlinear Anal. Real World Appl. 2019, 47, 373–384. [Google Scholar] [CrossRef]
  25. Zhang, G.; Allaire, D.; McAdams, D.A.; Shankar, V. System evolution prediction and manipulation using a Lotka–Volterra ecosystem model. Des. Stud. 2019, 60, 103–138. [Google Scholar] [CrossRef]
  26. Danylchuk, H.; Kovtun, O.; Kibalnyk, L.; Sysoiev, O. Monitoring and modelling of cryptocurrency trend resistance by recurrent and R/S-analysis. E3S Web Conf. 2020, 136, 13030. [Google Scholar] [CrossRef] [Green Version]
  27. Huang, Q.; Lin, M.Y.; Coffman, R.L.; Campbell, J.D.; Traquina, P.; Lin, Y.J.; Liu, L.T.C.; Cheng, J.; Wu, Y.C.; Wu, C.C.; et al. The impact of Microplastic particles on population Dynamics of predator and prey: Implication of the Lotka-Volterra Model. Sci. Rep. 2020, 10, 1–10. [Google Scholar] [CrossRef]
  28. Muhammad, Z.M.Z.; Özkaynak, F. A Cryptographic Confusion Primitive Based on Lotka–Volterra Chaotic System and Its Practical Applications in Image Encryption. In Proceedings of the 2020 IEEE 15th International Conference on Advanced Trends in Radioelectronics, Telecommunications and Computer Engineering (TCSET), IEEE, Lviv-Slavske, Ukraine, 25–29 February 2020. [Google Scholar]
  29. Homsombat, W.; Lei, Z.; Fu, X. Competitive effects of the airlines-within-airlines strategy–Pricing and route entry patterns. Transp. Res. Part E Logist. Transp. Rev. 2014, 63, 1–16. [Google Scholar] [CrossRef]
  30. Hyun, R. ‘Jin Air’, the Cheapest Airline Who Celebrated Its 9th Anniversary. 2017. Available online: http://sagunin.com/sub_read.html?uid=17884&section=sc62&section2=%EC%9D%BC%EB%B0%98. (accessed on 9 December 2021).
  31. Beads, C. Korean Air vs. Asiana Airlines: The opposite LCC strategy ‘Eye-Track’. 2016. Available online: http://biz.chosun.com/site/data/html_dir/2016/07/20/2016072002565.html?rsMobile=false (accessed on 9 December 2021).
  32. Whyte, R.; Lohmann, G. The carrier-within-a-carrier strategy: An analysis of Jetstar. J. Air Transp. Manag. 2015, 42, 141–148. [Google Scholar] [CrossRef] [Green Version]
  33. Joo, H.; Maskery, B.A.; Berro, A.D.; Rotz, L.D.; Lee, Y.K.; Brown, C.M. Economic impact of the 2015 MERS outbreak on the Republic of Korea’s tourism-related industries. Health Secur. 2019, 17, 100–108. [Google Scholar] [CrossRef]
  34. Huang, E. China Inflicted a World of Pain on South Korea in 2017. 2017. Available online: https://qz.com/1149663/china-south-korea-relations-in-2017-thaad-backlash-and-the-effect-on-tourism/#:~:text=The%20number%20of%20Chinese%20tourists%20to%20South%20Korea%20plunged%20in%202017&text=Relations%20between%20the%20two%20countries,threat%20to%20its%20national%20security. (accessed on 9 December 2021).
  35. Yonhap, Number of Chinese Tourists to S. Korea Dips 30% over THAAD Row. 2020. Available online: https://en.yna.co.kr/view/AEN20200702003700320 (accessed on 9 December 2021).
  36. Herald, T.K. Korean Air’s Asiana Acquisition: What Is Happening? 2021. Available online: https://www.aviationpros.com/airlines/news/21241569/korean-airs-asiana-acquisition-what-is-happening (accessed on 9 December 2021).
  37. Klophaus, R.; Conrady, R.; Fichert, F. Low cost carriers going hybrid: Evidence from Europe. J. Air Transp. Manag. 2012, 23, 54–58. [Google Scholar] [CrossRef]
  38. Borenstein, S. Hubs and high fares: Dominance and market power in the US airline industry. RAND J. Econ. 1989, 20, 344–365. [Google Scholar] [CrossRef]
  39. Dresner, M.; Lin, J.-S.C.; Windle, R. The impact of low-cost carriers on airport and route competition. J. Transp. Econ. Policy 1996, 30, 309–328. [Google Scholar]
  40. Lotka, A.J. Elements of physical biology. Sci. PlProg. Twent. Century (1919–1933) 1926, 21, 341–343. [Google Scholar]
  41. Volterra, V. Variazioni e Fluttuazioni del Numero d’Individui in Specie Animali Conviventi. Ferrari, C., Ed.; 1927. Available online: https://www.liberliber.it/online/autori/autori-v/vito-volterra/variazioni-e-fluttuazioni-del-numero-dindividui-in-specie-animali-conviventi/ (accessed on 3 January 1989).
  42. Plank, M. Hamiltonian structures for the n-dimensional Lotka–Volterra equations. J. Math. Phys. 1995, 36, 3520–3534. [Google Scholar] [CrossRef]
  43. Jones, E.W.; Shankin-Clarke, P.; Carlson, J.M. Navigation and Control of Outcomes in a Generalized Lotka–Volterra Model of the Microbiome. 2020. Available online: https://arxiv.org/abs/2003.12954 (accessed on 6 March 2022).
  44. He, M.; Li, Z.; Chen, F.; Zhu, Z. Dynamic Behaviors of an N-species Lotka–Volterra Model with Nonlinear Impulses. IAENG Int. J. Appl. Math. 2020, 50, 1–9. [Google Scholar]
  45. Korobeinikov, A.; Wake, G.C. Global properties of the three-dimensional predator-prey Lotka–Volterra systems. Adv. Decis. Sci. 1999, 3, 155–162. [Google Scholar] [CrossRef] [Green Version]
  46. Hovsepian, K.; Anselmo, P.; Mazumdar, S. Supervised inductive learning with Lotka–Volterra derived models. Knowl. Inf. Syst. 2011, 26, 195–223. [Google Scholar] [CrossRef]
  47. Lv, J.; Zou, X.; Tian, L. A geometric method for asymptotic properties of the stochastic Lotka–Volterra model. Commun. Nonlinear Sci. Numer. Simul. 2019, 67, 449–459. [Google Scholar] [CrossRef]
  48. Volterra, J.V. Variations and fluctuations of the number of individuals in animal species living together. In Animal Ecology; Chapman, R.N., Ed.; McGraw–Hill: New York, NY, USA, 1931. [Google Scholar]
  49. Goodwin, R.M. A Growth Cycle. Socialism, Capitalism and Economic Growth; Cambridge University Press: Cambridge, UK, 1967; pp. 54–58. [Google Scholar]
  50. Noszticzius, Z.; Noszticzius, E.; Schelly, Z. Use of ion-selective electrodes for monitoring oscillating reactions. 2. Potential response of bromide-iodide-selective electrodes in slow corrosive processes. Disproportionation of bromous and iodous acids. A Lotka–Volterra model for the halate driven oscillators. J. Phys. Chem. 1983, 87, 510–524. [Google Scholar]
  51. Gatabazi, P.; Mba, J.; Pindza, E. Fractional gray Lotka–Volterra models with application to cryptocurrencies adoption. Chaos Interdiscip. J. Nonlinear Sci. 2019, 29, 073116. [Google Scholar] [CrossRef] [PubMed]
  52. Gatabazi, P.; Mba, J.; Pindza, E. Modeling cryptocurrencies transaction counts using variable-order Fractional Grey Lotka-Volterra dynamical system. Chaos Solitons Fractals 2019, 127, 283–290. [Google Scholar] [CrossRef]
  53. Casado-Vara, R.; Canal-Alonso, A.; Martin-del Rey, A.; De la Prieta, F.; Prieto, J. Smart Buildings IoT Networks Accuracy Evolution Prediction to Improve Their Reliability Using a Lotka–Volterra Ecosystem Model. Sensors 2019, 19, 4642. [Google Scholar] [CrossRef] [Green Version]
  54. Fečkan, M.; Pačuta, J. Data approximation using Lotka–Volterra models and a software minimization function. J. Appl. Math. Stat. Inform. 2019, 15, 5–14. [Google Scholar] [CrossRef] [Green Version]
  55. Hung, H.-C.; Chiu, Y.C.; Huang, H.C.; Wu, M.C. An enhanced application of Lotka–Volterra model to forecast the sales of two competing retail formats. Comput. Ind. Eng. 2017, 109, 325–334. [Google Scholar] [CrossRef]
  56. Tannenbaum, A.R.; Georgiou, T.T.; Deasy, J.O.; Norton, L. Control and the Analysis of Cancer Growth Models. bioRxiv 2018, 244301. [Google Scholar] [CrossRef]
  57. Lee, S.-J.; Lee, D.-J.; Oh, H.-S. Technological forecasting at the Korean stock market: A dynamic competition analysis using Lotka–Volterra model. Technol. Forecast. Soc. Chang. 2005, 72, 1044–1057. [Google Scholar] [CrossRef]
  58. Li, M.; Yi, Z.; Zhu, M. Solving TSP by using Lotka–Volterra neural networks. Neurocomputing 2009, 72, 3873–3880. [Google Scholar] [CrossRef]
  59. Wu, L.; Liu, S.; Wang, Y. Grey Lotka–Volterra model and its application. Technol. Forecast. Soc. Chang. 2012, 79, 1720–1730. [Google Scholar] [CrossRef]
  60. Modis, T. Technological forecasting at the stock market. Technol. Forecast. Soc. Chang. 1999, 62, 173–202. [Google Scholar] [CrossRef] [Green Version]
  61. Aryal, G.; Ciliberto, F.; Leyden, B. Public Communication and Collusion in the Airline Industry; Centre for Economic Policy Research: London, UK, 2018. [Google Scholar]
  62. Kumar, N. Strategies to fight low-cost rivals. Harv. Bus. Rev. 2006, 84, 104–112. [Google Scholar]
  63. Hong, S.-J.; Domergue, F. Estimations Viability of LCCs Business Model in Korea. J. Int. Logist. Trade 2018, 16, 11–20. [Google Scholar] [CrossRef]
  64. Lo, S.-C.; Liao, Y.-P. External Effects on Dynamic Competitive Model of Domestic Airline and High Speed Rail. Int. J. Econ. Manag. Eng. 2012, 6, 1724–1728. [Google Scholar]
  65. Dodgson, J. Predatory behaviour and the airline industry. Built Environ. 1996, 22, 167–176. Available online: https://www.jstor.org/stable/23288560 (accessed on 25 February 2020).
  66. Kahn, A.E. Thinking about predation—A personal diary. Rev. Ind. Organ. 1991, 6, 137–146. [Google Scholar]
  67. Forsyth, P. Low-cost carriers in Australia: Experiences and impacts. J. Air Transp. Manag. 2003, 9, 277–284. [Google Scholar] [CrossRef]
  68. Gillen, D.; Lall, A. Competitive advantage of low-cost carriers: Some implications for airports. J. Air Transp. Manag. 2004, 10, 41–50. [Google Scholar] [CrossRef]
  69. Chavan, M. The balanced scorecard: A new challenge. J. Manag. Dev. 2009, 28, 393–406. [Google Scholar] [CrossRef] [Green Version]
  70. Abbink, K.; Brandts, J. Collusion in growing and shrinking markets: Empirical evidence from experimental duopolies. Exp. Compet. Policy 2009, 34–60. Available online: https://www.nottingham.ac.uk/cedex/documents/papers/2005-03.pdf (accessed on 25 February 2020).
  71. Yonhap. Budget Carriers Stand against Asiana’s LCC. 2015. Available online: http://www.koreaherald.com/view.php?ud=20150322000222 (accessed on 10 September 2019).
  72. Kim, D. The Effects of Airline Deregulation: A Comparative Analysis. J. Bus. Econ. Environ. Stud. 2016, 6, 5–10. [Google Scholar] [CrossRef]
  73. Sun, J.Y. Airline deregulation and its impacts on air travel demand and airline competition: Evidence from Korea. Rev. Ind. Organ. 2017, 51, 343–380. [Google Scholar] [CrossRef]
  74. Ahmed, F.; Siddiqui, D.A. Impact of Debt Financing on Performance: Evidence from Textile Sector of Pakistan. 2019. Available online: https://ssrn.com/abstract=3384213 (accessed on 22 August 2021).
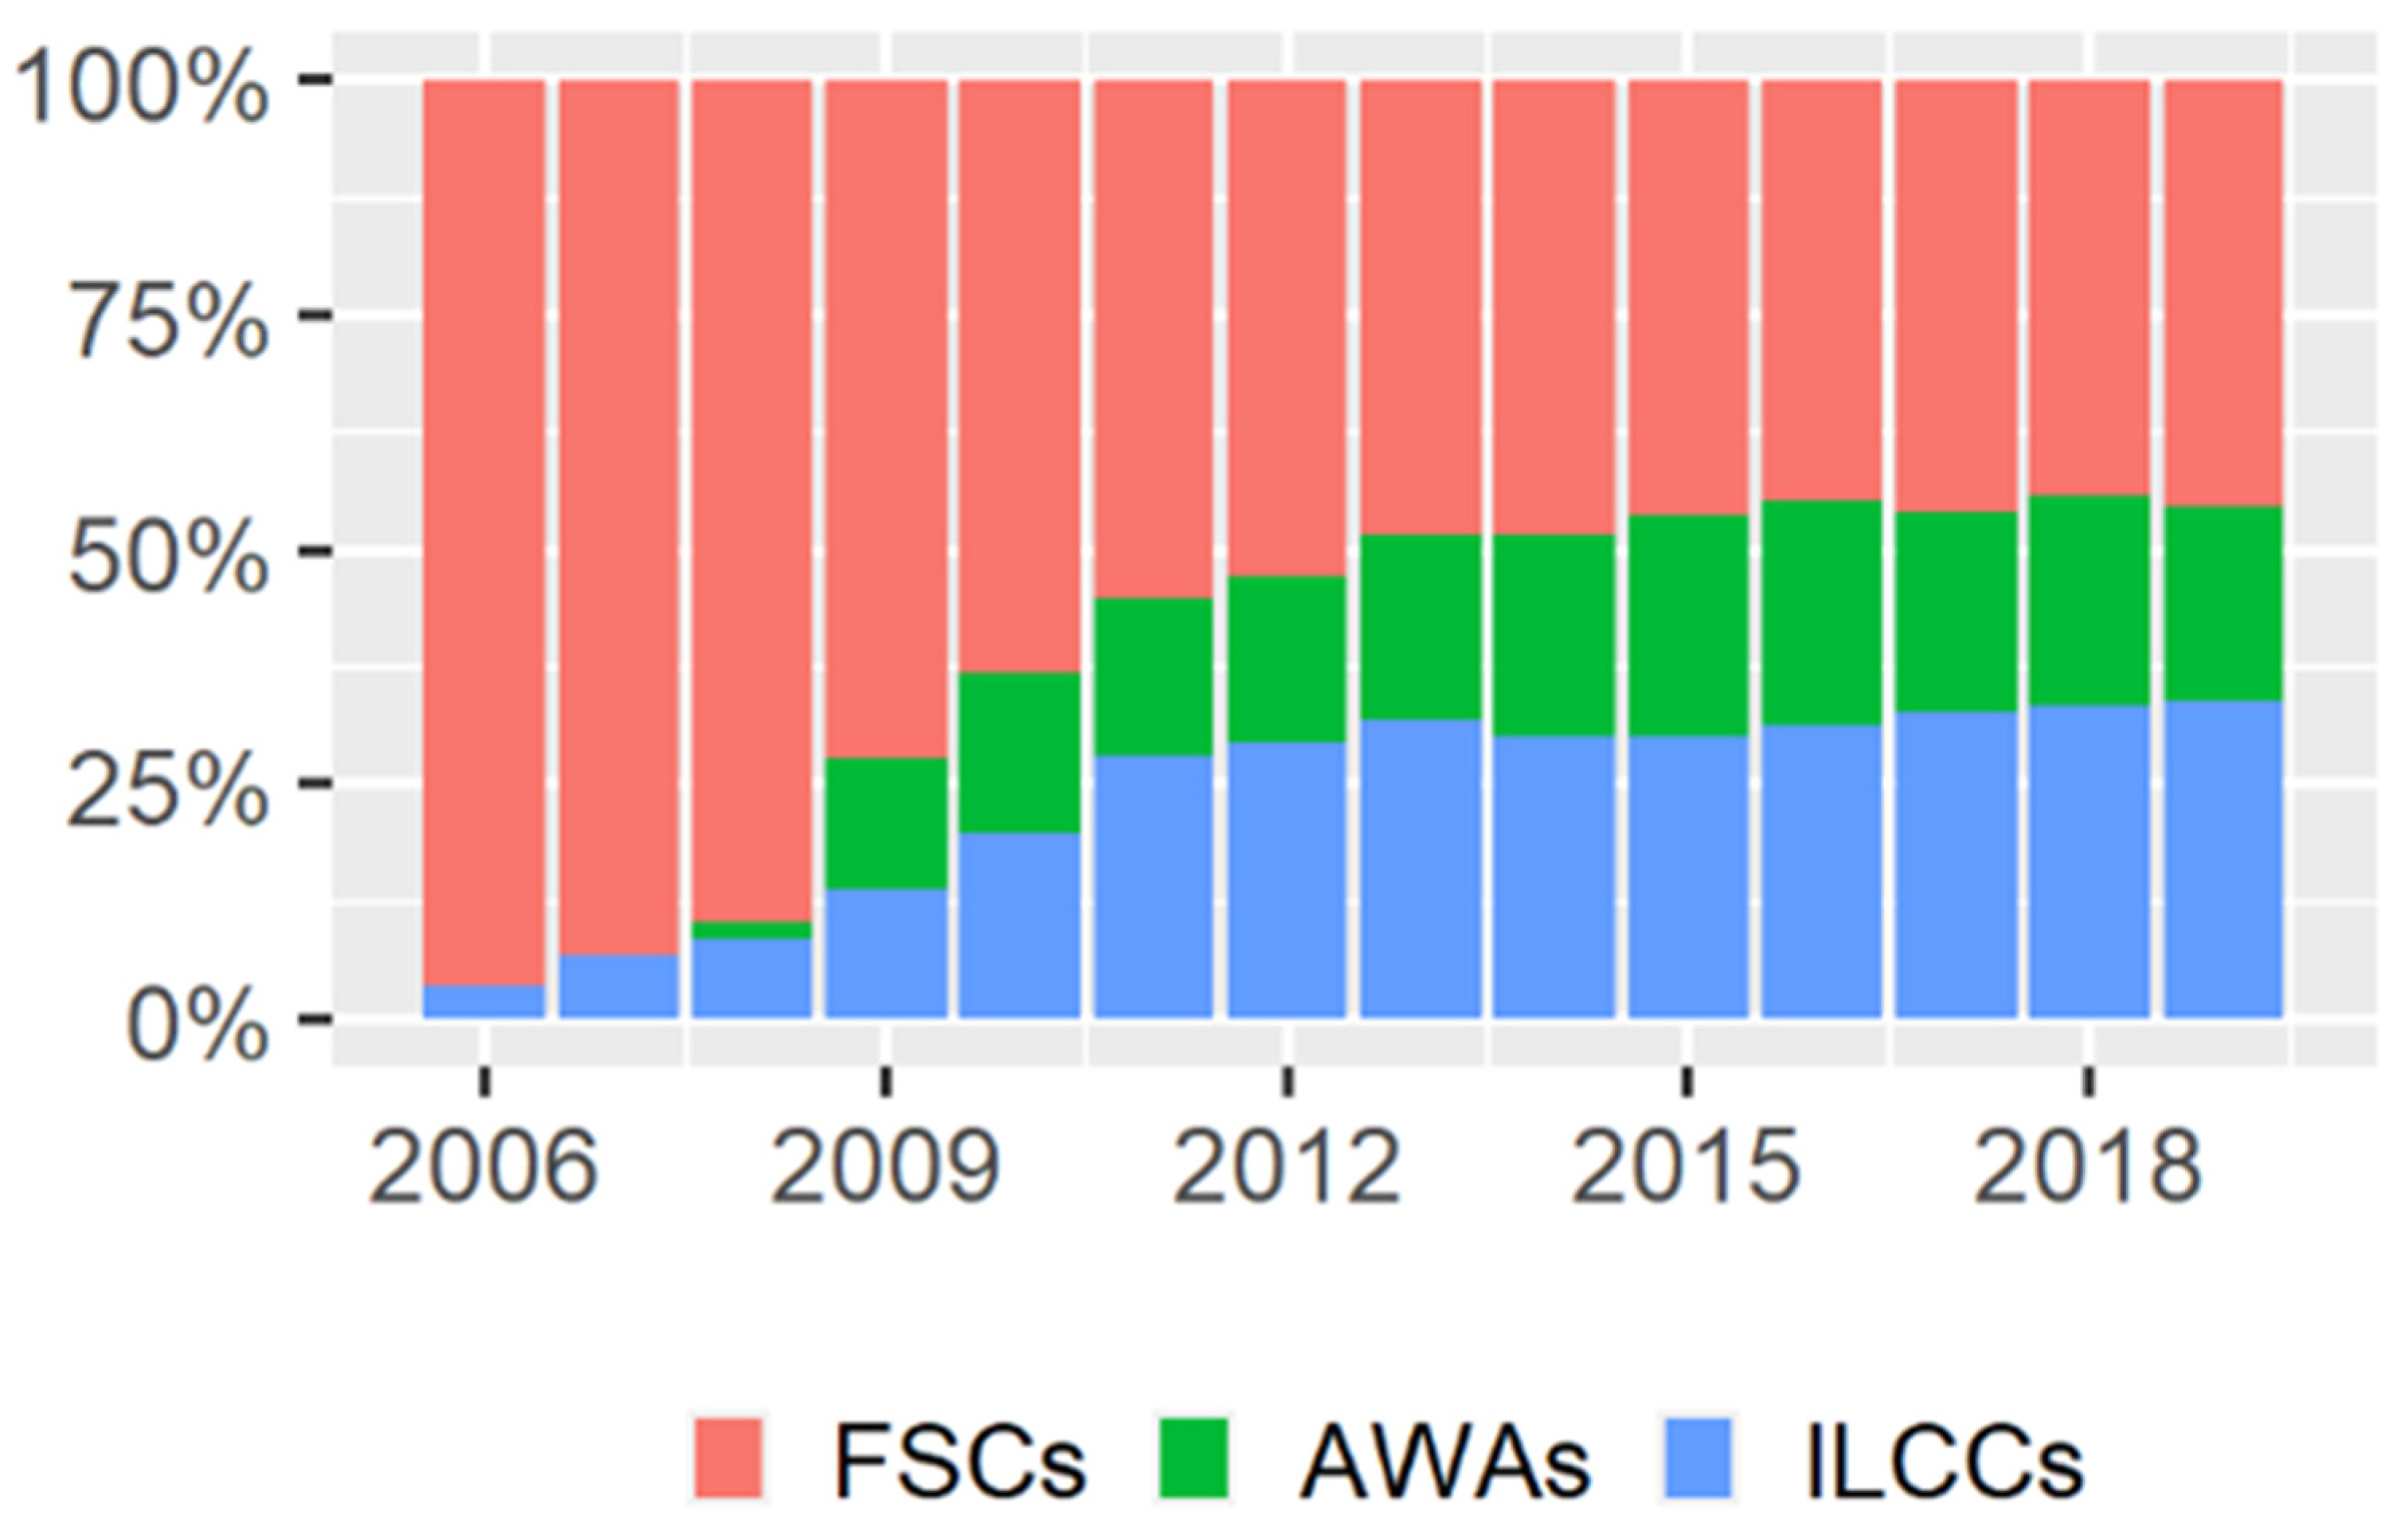
Figure 1. The trend of the market shares in South Korean aviation.
Sustainability 14 03468 g001
Figure 2. Airports and all the domestic air routes of South Korea.
Sustainability 14 03468 g002
Figure 3. Moving window approach.
Sustainability 14 03468 g003
Figure 4. Interaction parameters of AWA for the base model.
Sustainability 14 03468 g004
Figure 5. Interaction parameters of ILCCs for the base model.
Sustainability 14 03468 g005
Figure 6. Interaction parameters for AWA with overall growth.
Sustainability 14 03468 g006
Figure 7. Interaction parameters for ILCCs with overall growth.
Sustainability 14 03468 g007
Figure 8. Interaction parameters for AWA with LCC growth.
Sustainability 14 03468 g008
Figure 9. Interaction parameters for ILCCs with LCC growth.
Sustainability 14 03468 g009
Figure 10. Comparison of the CIs of the base model with the modified models.
Sustainability 14 03468 g010
Figure 11. Comparison of the CIs of the base model with the modified models.
Sustainability 14 03468 g011
Figure 12. Comparison of the p-values of the base model with the modified models.
Sustainability 14 03468 g012
Figure 13. Comparison of the p-values of the base model with the modified models.
Sustainability 14 03468 g013
Figure 14. Comparison of the MAPE values of the base model with the modified models.
Sustainability 14 03468 g014
Figure 15. Comparison of the MAPE values of the base model with the modified models.
Sustainability 14 03468 g015
Figure 16. Annual growth of LCCs in the South Korean aviation market.
Sustainability 14 03468 g016
Table 1. Types of relationships that can be evaluated through the LV model [7,60].
RelationshipGeneral ExplanationFit to the Airline Industry
Mutualism (Cooperation)c1 and c2 both are positive. Both species benefit from each other. This is an evolutionary process that peacefully tolerates the creation of a new population, without harming the old one.In the airline industry, direct cooperation is rarely observed and the phenomenon of cooperation refers to tacit collusion [61]
Competitionc1 and c2 are both negative. This indicates a negative relationship; both species suffer from the existence of the other species and fight for the same resources.A phenomenon where both competitors reduce their prices to compete and the market is free for new entrants [62].
Commensalismc1 is positive c2 is zero. Parasitic type of relationship; one benefits from the other, who remains unaffected. One population shares its resources with the other for self-interest.A perfect example of this behavior is the relationship between AWA and the mother companies. Where the mother companies can use the resources of the subsidiary [63].
Amensalismc1 is negative and c2 is zero. One is inhibited by the existence of the other, while the other remains unaffected. One population does not get any benefit, but its presence only harms the other population.For example, Taiwan’s domestic aviation and high-speed rail have a relationship where rail is not affected by the aviation industry; however, the aviation industry suffers from rail [64].
Predator–PreyOne species feeds off the other; the victim species does not affect the other. One population highly depends on the other and relies on the other’s resources. If the resources of the victim population decline, the reliant population also declines.Predatory behavior refers to a firm that reduces its own profit to drive a competitor out of the market by cutting its prices and/or increasing its output. As a result, the competitor loses money and is forced to leave the market. Such predatory behavior keeps new entrants from entering the market. For example, the unsuccessful entry of Compass airlines into the newly deregulated Australian domestic market [65], or the demise of Laker’s Sky Train transit–Atlantic service, was the predatory response of the established carriers [66].
Neutralismc1 and c2 both are zero. No relationship.
Table 2. Descriptive statistics of the data.
AWAFSCsILCCsLCCs
Mean306,811.13735,438.83445,970.92752,782.05
Std. Dev90,175.6192,473.51129,428.99212,648.57
Min153,695529,690161,603317,251
Median311,374730,128465,769783,734
Max493,708921,986677,4041,105,247
N.Valid127127127127
Table 3. Results of the complete data set with and without external factors.
ParameterValuep ValueFactor (Parameter Value)Relationship
c1 (ILCC)8.78 × 10−71.67 × 10−6NoneApparently mutualism (Not significant)
c2 (AWA)3.95 × 10−80.87None
c3 (ILCC)8.65 × 10−77.20 × 10−8LCC growth (53,990)Mutualism (Significant)
c4 (AWA)5.02 × 10−70.00894LCC Growth (87,910)
c5 (ILCC)8.50 × 10−74.36 × 10−8Overall Growth (258,300)Mutualism (Significant)
c6 (AWA)4.77 × 10−70.0106Overall Growth (402,700)
Publisher’s Note: MDPI stays neutral with regard to jurisdictional claims in published maps and institutional affiliations.