Article

Spatio-temporal Differentiation of Coupling Coordination between Ecological Footprint and Ecosystem Service Functions in the Aksu Region, Xinjiang, China

1
College of The Ecology and Environment, Xinjiang University, Urumqi 830017, China
2
Key Laboratory of Oasis Ecology of Education Ministry, Urumqi 830017, China
3
Comprehensive Land Management Center, Xinjiang Uygur Autonomous Region, Urumqi 830002, China
4
Xinjiang Scientific Research Station for Ecological Protection and Restoration of Land Space in Arid Areas, Urumqi 830002, China
*
Author to whom correspondence should be addressed.
Sustainability 2022, 14(6), 3483; https://doi.org/10.3390/su14063483
Submission received: 22 December 2021 / Revised: 11 March 2022 / Accepted: 13 March 2022 / Published: 16 March 2022
(This article belongs to the Special Issue Regional Ecology and Sustainability)

Abstract

:
The ecological footprint and ecosystem service functions in the northwest arid region of China have their unique characteristics and are limited by natural resources. The coordination level between the pressure of human activities on the ecosystem and the ecosystem service capacity can be objectively reflected on by exploring the coupling coordination relationship between these two aspects. This work used the ecological footprint and Integrated Valuation of Ecosystem Services and Trade-offs models to quantitatively analyze the spatial and temporal variations of the ecological footprint and ecosystem service functions in the Aksu region in Xinjiang. A coupling coordination degree model and spatial autocorrelation analysis were used to assess the coupling coordination level and spatial agglomeration characteristics of the regional ecological footprint and ecosystem service functions. The results showed that the ecological footprint of the Aksu region has been high in the northeast and low in the southwest, with noticeable spatial heterogeneity, from 2005 to 2018. Carbon (66.17%) and cropland (26.64%) are the main contributing factors to the regional ecological footprint. The biocapacity is dominated by cropland, built-up land, and forest land. The ecological footprint and biocapacity showed an increasing trend, ranging from an ecological surplus to an ecological deficit, with a continued ecological deficit. The level of ecosystem service functions in the Aksu region was low, with significant spatial variability. The high values were concentrated in the northern part of the region and the Tarim and Hotan River Basins. The coupling coordination level of the ecological footprint and ecosystem service functions in the Aksu area was high in the north and low in the south. The aforementioned coupling coordination level was dominated by the spatial pattern of the ecosystem service functions and had noticeable spatial agglomeration characteristics. The coupling coordination degree of the ecological footprint and water supply function showed an upward trend. By contrast, the coupling coordination degree of the ecological footprint with soil conservation and biodiversity maintenance functions showed a downward trend.

1. Introduction

The ecosystem service functions of forests, grasslands, wetlands, and deserts continue to deteriorate with the unreasonable development of land resources and the continuous change of the land use mode [1]. The coupled relationship between social economy and the ecological environment has also been seriously challenged, restricting the sustainable development of the regional social economy [2,3]. This phenomenon is more obvious in arid areas [4,5]. On this basis, scientists attempt to seek the coupling coordination development between the social economy and natural environment based on the concept of sustainable development [6,7]. In this process, the utilization of natural capital and the response of the ecosystem to this utilization are the focus of scientists.
Natural capital is an important source of economic wealth for individuals and human societies and could provide people with a variety of ecosystem services and the material basis for maintaining sustainable economic and social development [8,9]. Research on natural capital utilization is an important basis for regional sustainable development [10]. Considering its importance, various methodologies have been developed to evaluate the spatial–temporal variation of natural capital utilization. Among these methods, the ecological footprint developed by Rees and Wackernagel is considered to be the first creative attempt [11,12]. The model reduces the complex ecological and economic process to a problem of supply and demand balance of the ecological productive space, resulting in a unified accounting of resource consumption and economic externality cost [13,14]. This model has been widely used by scholars since its introduction because of its simplified and unified index system and its universal, practical, and easy-to-interpret methodology [15,16,17]. Since then, more footprints, such as a carbon footprint, energy footprint, water footprint, tourism footprint, and seafood footprint, have been derived as an indicator of the environmental impacts of individuals, human populations, organizations or nations [18,19,20,21]. In 1999, a 3D ecological footprint model was developed to better explain the difference between resource flows and the human demand for natural capital stocks [22]. Galli et al. discussed the role of the ecological footprint in tracking human-induced pressures on biodiversity and provided a research framework of how the ecological footprint tool can be used to the advancement of conservation science to support biological conservation [23]. A personal footprint calculator was specifically investigated to provide a valuable guide to individuals toward sustainable consumption choices, and it proved to be effective in enhancing individuals’ understanding of the environmental impact of their actions [24].
Ecosystem service function, which refers to the ability of the ecosystem to provide humans with natural resources, products, and support, is the basic guarantee of human production and life [25,26]. Healthy ecosystems and ecosystem services are necessary to achieve harmony and balance between human society and ecosystems [27]. The research on ecosystem service function has gradually become an important basis for the regional assessment of ecological security. At present, a large number of evaluation models are used to evaluate the service function of the ecosystem [28,29,30]. The Integrated Valuation of Ecosystem Services and Trade-offs (InVEST) model can evaluate the service function of an ecosystem on different scales because it can realize broad scale spatial visualization [31,32,33]. Specifically, the model was used to simulate the water yield, supply, and consumption in a watershed draining into the Caspian Sea in northern Iran [34]. In the northwest arid region of China, the model was employed to estimate water conservation in the upper reaches of a river basin [35]. He et al. discussed the suitability of the InVEST model on the assessment of the effects of urban expansion on regional carbon storage by linking the LUSD-urban model and the InVEST model [36]. The model was integrated with SD-CLUE-S to simulate and predict the land-use changes impacts on carbon storage at different spatial scales in Northwest China [37], and Wang et al. assessed the water yield, soil conservation, water purification, and habitat quality based on the InVEST model [38,39]. Although the InVEST model has been widely used, there is still a lack of knowledge on the application of the model to investigate the ecological footprint and sustainability of social economics in arid regions.
Comprehensive evaluation of the sustainability of the ecosystem is difficult because the single ecological footprint and ecosystem service function assessment ignores the multi-functionality of the land [40,41]. Meanwhile, the coupling coordination degree model can measure the coordination level of multiple systems or elements within the system, reflecting the development trend of the system [42,43]. Accordingly, the coupling coordination degree model based on the ecological footprint and ecosystem service functions can objectively reflect the coordination level of regional socio-economic development and the natural environment. The higher the coordination level, the more orderly the development of the ecosystem, and the higher the level of regional sustainable development. This model can further reflect the overall characteristics of the economy and functionality of the ecosystem.
Aksu is located in the arid area of Northwest China and has abundant oil and gas resources, outstanding other resources, and geopolitical advantages. It is the key area of China’s westward opening. Soil erosion and desertification are intensified, biodiversity is low, and the ecosystem is extremely unstable when the distribution of water resources is extremely unbalanced. Its socio-economic development continues to place pressure on the land resources and the ecological environment in the region, and the coupling and coordinated development of the socio-economic and ecological environments has been seriously challenged. How to realize the sustainable development of the Aksu region is the focus of scientists and decision makers. In this study, we selected the Aksu region as the study area to analyze the coupling mechanism of the ecological footprint with the water supply, soil conservation, and habitat quality from 2005 to 2018, and to evaluate the spatial distribution of the coupling status between the ecological footprint and ecosystem service function based on the integration of the ecological footprint and InVEST models. This work is expected to provide a scientific basis for social and economic sustainable development and ecosystem protection in the Aksu region.

2. Materials and Methods

2.1. Study Area

The Aksu region (78°03′–84°07′ E, 39°30′–42°41′ N) is located in the middle of the southern foot of the Tianshan Mountain in Xinjiang Uygur Autonomous Region, China, and the northern edge of the Taklamakan Desert. The administrative area includes Aksu City, Wushi County, Wensu County, Baicheng County, Kuche City, Keping County, Awati County, Xinhe County, and Shaya County. The climate is characterized by dry and cold winters and dry and hot summers. The topography is low in the southeast and high in the northwest (Figure 1). A large area of glacial and permanent snow is distributed in the northern part. The desert and Gobi in the south are widespread, with low vegetation cover, low rainfall, and high evaporation. The Gobi and oasis appear in the central part of the region, and a high consumption and unbalanced use of water and soil resources have aggravated the ecological environment deterioration.
The land use type is mainly bare area and grassland. The main water systems include the Tarim River, Aksu River, Tailan River, Weigan River, and Kuche River. Water resources are relatively abundant in Xinjiang. The soil is mainly desert brown calcic soil, brown desert soil, moisture soil, meadow soil, and saline. The vegetation community is single, with many deep-rooted plants that are salt tolerant and cold resistant. The region is rich in mineral, oil, and gas resources with large reserves and is an important energy industry base in Xinjiang. The crops of the region are dominated by cotton, wheat, and corn. The GDP of Aksu in 2018 was CNY 7.80 × 10¹⁰, which was 5.97 times higher than that in 2005, with the most significant growth in the secondary industry, which was 9.69 times higher than that in 2005.

2.2. Data Sources

In the ecological footprint model, the biological resource and energy account data are from the Xinjiang Statistical Yearbook (2005–2018) and the Aksu Regional Statistical Yearbook (2005–2018), and the bio-thermal value data are obtained from the Agricultural Economic and Technical Handbook. The land use data, DEM, and population density data come from the Resource and Environmental Science Data Center of the Chinese Academy of Sciences (http://www.resdc.cn/(accessed on 16 January 2022)).
In the InVEST model, the rainfall and potential evapotranspiration data are from the National Earth System Science Data Center (http://www.geodata.cn (accessed on 20 February 2022)) [44]. The soil data are from the World Soil Database, and the NDVI data are obtained from the Geospatial Data Cloud (http://www.gscloud.cn/(accessed on 13 February 2022)). The biophysical parameters are referred to the FAO reference values and the InVEST guidebook. The raster data are resampled to 1 × 1 km resolution.

2.3. Methods

2.3.1. Ecological Footprint Model

The Global Footprint Network states that the ecological footprint (EF) is the total area of an ecologically productive land (land and water with ecologically productive functions) required for a region to sustain a certain population and absorb the waste generated by human activities. The biocapacity (BC) is the maximum area of ecologically productive land that a region can provide to humans [45]. If EF = BC, then the region is in an ecological equilibrium, which indicates a balanced regional supply and demand. If EF > BC, then the region is in an ecological deficit, which means that the existing resource level of the region cannot meet human demand and needs to import resources from other regions. Otherwise, the region is in an ecological surplus, which means that the existing resource level of the region can meet human demand, and the development model is sustainable [46].
Scholars have produced a series of gridded population density datasets with the support of various data resources with the continuous development of remote sensing technology. Assuming the same level of per capita consumption within the same city, combined with the population density data, we can quantitatively assess the spatial and temporal changes of the ecological footprint and biocapacity using [47,48]:
E F = N × e f = N × k 6 γ k × a a k
E F G = ef / GDP
F E F j = E F i P i × p j
F B C j = 0.88 × γ k × β k × a a k j
F E S j F E D j = F E F j F B C j
where EF (ha) represents the total ecological footprint; N, ef (ha), γk, aak (ha), EFG (ha), and GDP (CNY 104) are population, regional per capita EF, equilibrium factors of the kth type of productive land, area occupied of the kth type of productive land, EF of CNY 10,000 GDP, and per capita GDP, respectively; F E F j ,   F B C j , and   F E S j / F E D j   ha represent the ecological footprint, biocapacity, and ecological surplus/ecological deficit of the grid j, respectively; and E F i   ha , Pi, p j , β k , and aakj (ha) are the ecological footprint of county i, population of county i, population of grid j, yield factors of the kth type of productive land, and area occupied of the kth type of productive land in the jth grids.
This study uses the ratio of the average productivity of a certain type of productive land in the Aksu region to the sum of the productivity of all productive land to represent the equilibrium factors, and the ratio of the average productivity of a certain type of productive land in the region to the average production level of that type of land in Xinjiang to represent the yield factors; the results are shown in Table 1 [40]. In the Aksu region, 66.28% of the increase of built-up land comes from cropland, and 22.15% comes from non-productive land. Accordingly, the conversion factor of built-up land in this work adopts the conversion factor of cropland. Meanwhile, the proportions of grazing land (20.48%) and cropland (9.73%) in the Aksu region are larger than that of forest land (4.51%), and all three have the capacity to absorb carbon dioxide. If only forest land is used to calculate the carbon footprint, then the actual situation of the study area would be difficult to reflect. Therefore, the carbon footprint uses the ratio of the total carbon emissions of all types of energy to the comprehensive carbon absorption coefficient of grazing land–cropland–forest land to obtain the converted carbon-uptake land, while making the following adjustments to the carbon equilibrium factor [46,49]:
Biological   account :   γ k = p k ¯ / p ¯ = x q x k × r x k s k / k x q x k × r x k s k β k = p k ¯ / P k ¯ = x q x k × r x k s k / x Q x k × r x k S k
Energy   account :   γ E n e r g y l a n d = x t x t + y t + z t × γ g r a s s l a n d + y t x t + y t + z t × γ c u l t i v a t e d l a n d + z t x t + y t + z t × γ f o r e s t l a n d
where p k ¯ and p ¯ (109 J/ha) represent the average productivity of the kth type of productive land and of the region, respectively; q x k   kg   and   r x k (109 J/kg) represent the annual production and unit calorific value of the x organisms of the kth type of productive land, respectively; s k (ha) is the biologically productive area of the kth type of productive land in the region; P k ¯ (109 J/ha) and S k (ha) are the average productivity and area of the kth type of productive land in the province; respectively; t represents the accounting year; xt (ha) is the grazing land area; yt (ha) denotes the cropland area; and zt (ha) refers to the forest land area.

2.3.2. InVEST Model

(1)
Water supply
The water yield module mainly calculates the water yield of the grid cells based on the principle of water balance, including annual rainfall, the available water content of plants, potential evapotranspiration, root depth, soil depth, and watershed area, which is represented by the difference between precipitation and actual evapotranspiration [39].
Y x = ( 1 A E T x P x ) × P x
A E T x P x = 1 + ω x R x 1 + ω x R x + 1 R x
ω x = Z A W C x P x
R x = K x × E T 0 P x
where Y x   mm ,   A E T x (mm), P x   mm ,   R x ,   ω x , Z ,   A W C x ,   K x ,   and   E T 0 represent the annual water volume, evapotranspiration, precipitation, Budyko dryness index, nonphysical parameter of the natural climate-soil properties, seasonal characteristic constant of precipitation, effective plant water content, evapotranspiration coefficient of vegetation, and reference crop evapotranspiration, respectively. The effective plant water content is calculated using the AWC mode [50].
(2)
Soil conservation
The sediment retention module is based on the modified general soil loss equation. This module uses the rainfall erosivity factor, soil erodibility factor, vegetation coverage factor, and soil and water conservation measure factor to generate the spatial visualized sediment yield of the catchment. Then, the difference between the potential soil erosion and actual soil erosion is used to obtain the soil retention in the study area [51]:
R K L S = R × K × L S
U S L E = R × K × L S × C × P
S D = R K L S U S L E
where U S L E ,   R K L S ,   S D , LS, and P represent the actual soil erosion, potential soil erosion, soil conservation, slope length gradient, and soil and water conservation measure factor, respectively. R, K, and C represent the rainfall erosivity factor, soil erodibility factor, and vegetation cover factor, and they are calculated using Wischmeier’s monthly scale model, EPIC model, and NDVI index [52], respectively.
(3)
Habitat quality
The habitat quality module uses the sensitivity of each land use type and the intensity of external threats to obtain the ability of the ecosystem to provide suitable living conditions. The value lies between zero and one. The closer to one, the better the habitat quality is [53]:
Q x j = H j × 1 D x j z D x j z + k z
where Qxj, Hj, Dxj, k, and z represent the habitat quality index, habitat suitability of habitat type j, level of habitat stress in raster x of habitat type j, half-saturation factor, and default parameter, respectively.

2.3.3. Coupling Coordination Degree Model

The ecological footprint and ecosystem service functions are closely related, and the coupled coordination model can further analyze the level of coordination between the two systems [42]:
C = U 1 × U 2 / U 1 + U 2 2 2 1 / 2
T = δ U 1 + η U 2
D = C × T
where C, U1, U2, and T represent the coupling degree index, ecological footprint index, ecosystem service function, and integrated development levels of U1 and U2, respectively. δ and η are taken as 0.5 because they are of the same importance in this study. D is the coupling coordination degree index, [0–0.1] for the extreme dissonance stage, (0.1–0.2] for the severe dissonance stage, (0.2–0.3] for the moderate dissonance stage, (0.3–0.4] for the mild dissonance stage, (0.4–0.5] for the near dissonance stage, (0.5–0.6] for the barely coordinated stage, (0.6–0.7] for the initial coordination stage, (0.7–0.8] for the moderate coordination stage, (0.8–0.9] for the high coordination stage, and (0.9–1] for the extreme coordination stage [54].

2.3.4. Spatial Statistical Analysis

In geography, everything is connected to everything else, but things that are close together are more closely connected [55]. The spatial autocorrelation analysis was used to reveal the spatial distribution characteristics of the coupling coordination degree (D) of the ecological footprint and ecosystem service functions using GeoDa software and further explore the similarity degree of the coupling coordination degree in adjacent regions [56]:
I = n i = 1 n j = 1 n W i j y i y ¯ y j y ¯ / i = 1 n j = 1 n W i j j = 1 n y j y ¯ 2
I i = y i y ¯ j n W i j y j y ¯ / j = 1 n W i j y j y ¯ 2 / n
where I represents the global Moran index (1     I     1; when I > 0, D has a positive correlation in the spatial distribution; when I = 0, D has a random distribution; when I < 0, D has a negative correlation). Ii, n, W i j , y ¯ , y i , and y j represent the local Moran index, number of raster cells, spatial weight matrix, spatial cell average, and attribute values of rasters i and j, respectively.

3. Results and Analysis

3.1. Spatial–Temporal Differentiation of the Ecological Footprint

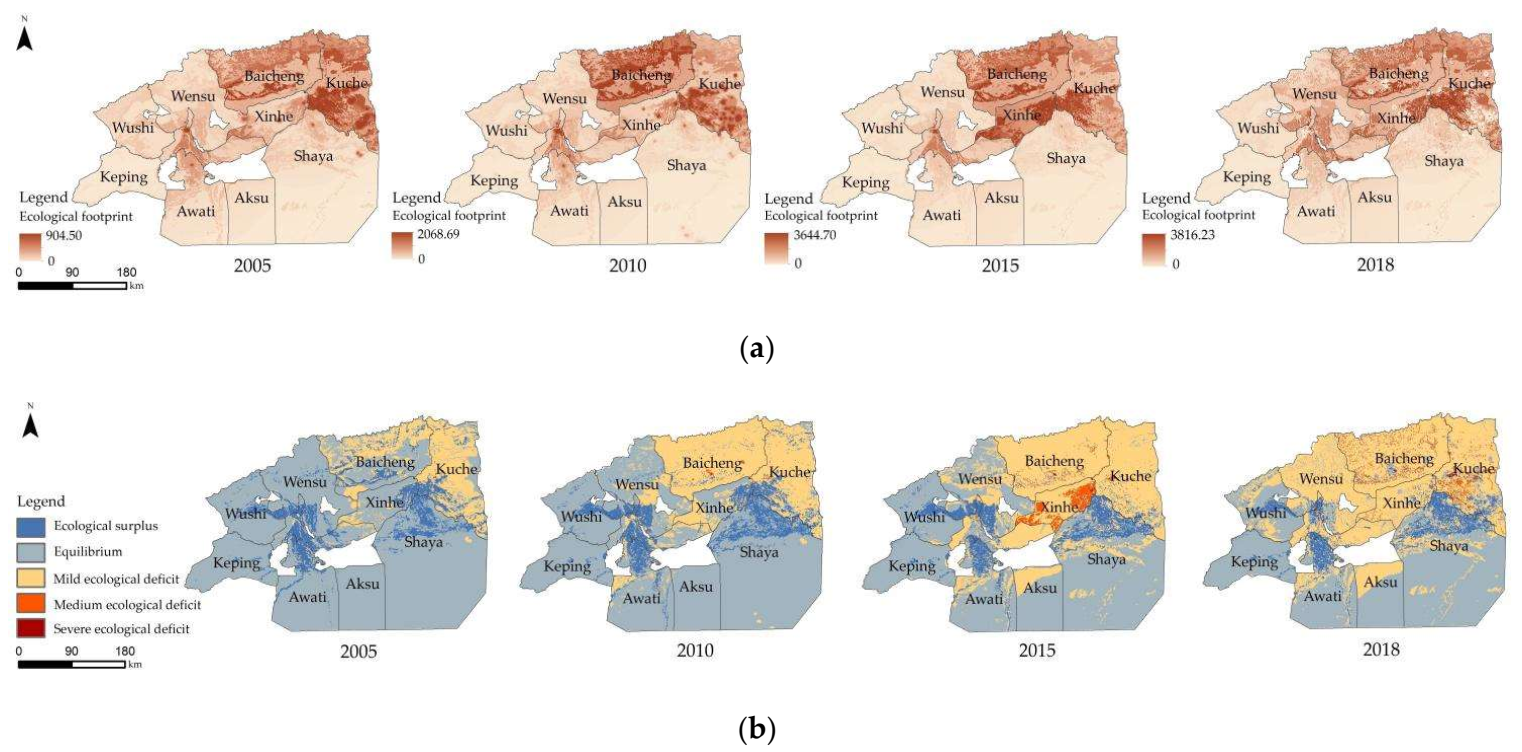
The per capita ecological footprint and per capita biocapacity of the Aksu area increased year by year from 2005 to 2018. The increase in the ecological footprint was significantly higher than that of the biocapacity, resulting in a shift in the region’s ecological balance from surplus to deficit (Figure 2). Meanwhile, the regional per capita GDP increased from CNY 5770 to CNY 30,457; however, the ecological footprint of CNY 10,000 GDP decreased from 2.98 ha to 1.74 ha.
The spatial distribution of the ecological footprint in the Aksu region was high in the northeast and low in the southwest (Figure 3a). In terms of the footprint composition, the ecological footprints of carbon and cropland accounted for 66.17% and 26.64%, respectively, which are the main contributing factors to the ecological footprint of the study area. Baicheng County and Kucha City are rich in mineral resources, and the carbon footprint there accounted for 89.00% and 79.50%, respectively. Meanwhile, a large population density placed more pressure on the land and had a higher ecological footprint. In the period 2005 to 2018, the unit ecological footprint of the Aksu region increased from 28.85 ha to 129.50 ha with a growth rate of 7.74 ha/a. The unit biocapacity of productive land in the study area was as follows: cropland = built-up land > forest land > grazing land > fishing ground. The unit biocapacity increased from 34.97 ha to 46.14 ha with a growth rate of 0.86 ha/a due to the continuous growth trend of cropland, forest land, and built-up land in the region, which increased by 2.8%, 0.8%, and 0.1% respectively.
The original ecological footprint model considers that the value of biocapacity minus the ecological footprint is equal to zero as the ecological equilibrium state. Considering the flow of people and commodities within the region, we estimated that the ecological equilibrium state is approximately 10% of the biocapacity per square kilometer of productive land (Figure 3b). The ecological footprint (28.85 ha) of the regional unit grid in 2005 was smaller than the biocapacity (34.97 ha), indicating an ecological surplus. During the study period, the increase in the ecological footprint was higher than the biocapacity, resulting in a regional ecological deficit becoming increasingly prominent. The rapid growth of the carbon footprint and stable biocapacity in Xinhe County, Baicheng County, and Kuche County resulted in the gradual intensification of the ecological deficit.

3.2. Spatial–Temporal Differentiation of the Ecosystem Service Functions

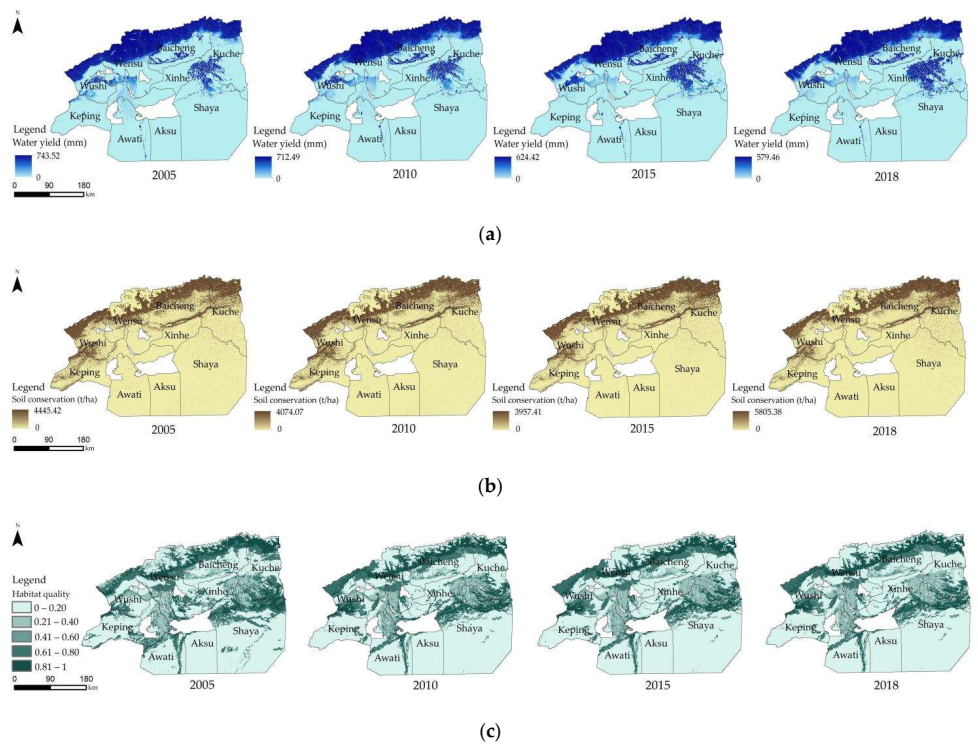
The ecosystem service functions in the Aksu region were spatially high in the north and low in the south (Figure 4), with a significant spatial difference. The water conservation area in the northern part of the region and the northern portion of Tarim River have high precipitation and relatively low evaporation, resulting in a relatively high water supply function. Soil erosion is strong, grassland is widely distributed, and soil retention is also relatively higher in the north of Wushi County, Wensu County, Baicheng, and Kuche City. The Tarim River in the central part of the region and the Hotan River in the southeast provided sufficient water resources and maintained high biodiversity. By contrast, the southern region (Awati, Aksu, and Shaya counties) with scarce rainfall and huge evaporation resulted in a lower water supply, soil conservation function, and habitat quality.
In the period 2005 to 2018, the highest water yield of the raster cell decreased at a rate of 39.71 mm/a. The regional average water yield decreased from 20.54 mm to 17.45 mm, mainly due to the annual changes of rainfall and potential evapotranspiration. Soil retention in the raster unit showed a decreasing trend from 2005 to 2015 and then increased, which was basically exacerbated by the change in rainfall erosion. The overall regional biodiversity was low and continued to decline due to the conversion of grazing land to cropland and later replaced by built-up land, the desertification of grazing land, and the expansion of the unused land area. The area with a biodiversity of (0,0.4) accounted for a relatively large proportion in the entire study period and increased from 67.6% to 73.8% from 2005 to 2018, respectively.

3.3. Spatial–Temporal Differentiation of the Coupling Coordination between Ecological Footprint and Ecosystem Service Functions

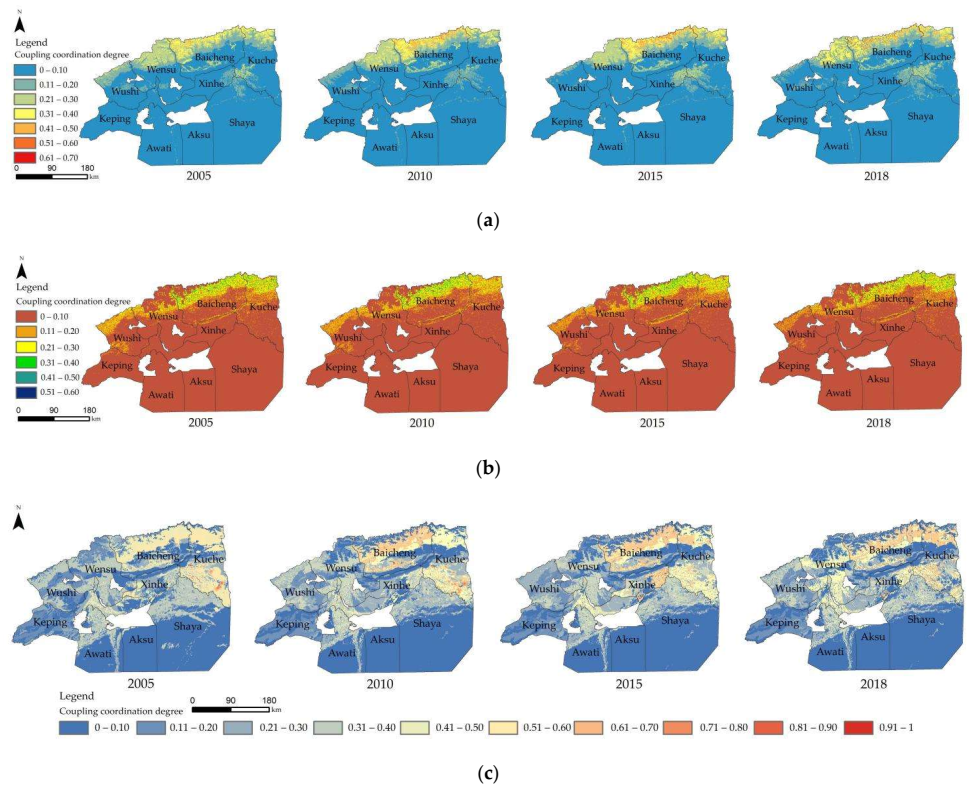
The coupling coordination degree of the ecological footprint and ecosystem service functions in the Aksu region was low, and the coupling relationship was high in the northern part of study area, which was consistent with the spatial distribution of the ecosystem service functions (Figure 5). The ecological footprint had a high degree of coupling coordination with the water supply and soil conservation functions in the northern part of the region, where precipitation and land output capacity are relatively higher, and the coordination degree between the economic development and the ecological environment were higher compared with those in the southern part. Baicheng County, the Weigan River Basin, and Aksu River Basin were the areas with a high degree of coupling coordination between the ecological footprint and biodiversity maintenance. The land types are mainly natural pasture, forest land, and cropland, with a relatively rich biodiversity, frequent human activities, and high level of socio-economic development. These regions were characterized by a high coupling coordination level. The south part of the study area is dominated by the Taklamakan Desert, with less interference from human activities and low vegetation coverage and precipitation, thus the coupling coordination level was low.
The coupling coordination between the ecological footprint and habitat quality was the strongest in the Aksu region from 2005 to 2018; however, the coupling coordination between the ecological footprint and water supply and soil conservation function was weak. The ecological footprint lagged behind the water supply because of the better ecological quality of the water-conserving area on the southern slope of the Tianshan Mountain, and the ecological footprint gradually increased with an increase in human interference. The proportion of the coupling coordination degree of the ecological footprint and water supply function belonging to [0–0.3] decreased, and that of (0.3–0.6] increased (Figure 6), showing a trend toward coordination; however, the ecological deficit in the region is obvious, and the economic development structure needs to be adjusted. Considering the entire study area, the pressure on the ecological environment has gradually increased with the development of social economics, resulting in the increase in the proportion of the ecological footprint and soil conservation function [0–0.1]. Meanwhile, the other coordination degrees decreased. The coupling coordination degree between the ecological footprint and biodiversity maintenance fluctuated and decreased.

3.4. Analysis of the Spatial Clustering Characteristics

GeoDA software was used to compute the global and local Moran’s I to spatially analyze the spatial distribution of the coupling coordination degree between the ecological footprint and ecosystem service functions. The results showed that Moral’s I indexes of the coupling coordination degree were all greater than 0 (p < 0.05, Z > 1.96 significance test) (Table 2), indicating that the coupling coordination degree had a significant positive correlation and presented a significant spatial agglomeration characteristic. Specifically, the region with a high coupling coordination degree was surrounded by regions with a high coupling coordination degree, and vice versa.
The spatial aggregation of coupling coordination can be detected using LISA. The spatial distribution of the coupling coordination degree in the Aksu region in 2018 showed a noticeable similarity and agglomeration, and the positive correlation distribution patterns of high–high and low–low agglomeration were evident (Figure 7). The coupling coordination of the ecological footprint and water supply had a high–high concentration in the water conservation area in the northern part of the region, indicating that the grids with a high coupling coordination degree was surrounded by high coordination grids. The high–high clustering of the coupling coordination of the ecological footprint with the soil conservation function was mainly distributed in grazing land and forest land areas in the northern part of the region; however, the coupling coordination level of the surrounding unused land and glacier zone was low. The high–high clustering of the coupling coordination of the ecological footprint and biodiversity maintenance function was mainly distributed in grazing land, forest land, and cropland areas. Accordingly, the overall distribution was a combination of high–high and low–low clustering due to the mosaic distribution of oasis and desert in the region. The southern region of the study area, which is dominated by large areas of unused land, was characterized by a low coupling coordination degree between the ecological footprint and ecosystem service functions. Hence, the spatial distribution had evident characteristics of low–low clustering.

4. Discussion

The goal of ecological footprint model optimization has always been to improve the consistency of the results of natural capital usage with the actual production level. Scholars have modified the model parameters [57,58], and the localized parameterization of the Aksu region are accounted for in this work because the “global hectare” (biologically productive hectares converted from the world average biological productivity) scale ignores the inter-regional variability and has limitations when used in the evaluation of small-scale regions [59] (Table 3). The results showed that the equalization factors of cropland and built-up land were significantly higher than those of provincial and national ones. Meanwhile, the equalization factors of grazing land and fishing ground were significantly lower than the other parameters. The yield factors of cropland, forest land, grazing land, and built-up land were higher than those of provincial ones, but lower than national ones, which is mainly related to the regional natural conditions. The Aksu region is an important producing area of high-quality cotton, grain, and special melons and fruits in Xinjiang. Although the cropland area accounts for 26.16% of the regional productive area, the total calorific value generated from its biomass production accounts for 73.00% of the total regional calorific value; thus, the equilibrium factor is large. Meanwhile, the production level per unit area of grazing land and fishing ground is lower. Accordingly, the equilibrium factors are smaller. Given that the provincial and national carbon-uptake land equilibrium factor was the same as the forest land, and the forest land area in the Aksu region is small, a direct application of the forest land equilibrium factors will result in an excessive ecological footprint. In addition, the production capacity of productive land in the Aksu region accounts for a larger proportion of the same type of land in Xinjiang, resulting in yield factors greater than the provincial parameters, underestimation of the biocapacity by the provincial parameters and intensification of the ecological deficit. The per capita ecological footprint and ecological deficit showed an increasing trend during the study period in the Aksu region, and the change was consistent with the results of other studies [60]. The per capita biocapacity also increased. The reason for the difference with the results of other studies may be attributed to the selection of the equilibrium and yield factors and the different indicators for the measurement of biological and energy accounts [61]. At present, most of the accounting of the ecological footprint adopts statistical data of administrative units, which lacks accurate spatial expression. Remote sensing data have a wider spatial distribution and higher accuracy compared with statistical data [62]. The temporal and spatial change process of the results can be more intuitively expressed by using pixel-level population density data to calculate the spatialized ecological footprint and biocapacity. In this work, the grid-based ecological footprint and ecological deficit also showed an increasing trend during the study period in the Aksu region, which was consistent with the results at the administrative unit scale. The high-value areas were concentrated in the built-up land of Baicheng County and Kuche City, with large spatial differences, necessitating further optimization of the unbalanced ecological pattern.
The InVEST model shows that the regional ecosystem service functions are significantly different, reflecting the similarity of the arid regions. Precipitation and land use type have positive effects, and areas with high plant cover have a better retention of soil and water and higher biodiversity; this finding has been confirmed by previous studies [66,67]. In the Aksu region, evaporation is high, precipitation is low, coverage is low, water demand is high, and the ecological environmental background is fragile, resulting in weak ecosystem services. The simulation results are in line with the findings of some scholars [51]. The grazing land and water areas decreased by 8671.46 km2 and 2215.16 km2, respectively, from 2005 to 2018, mainly degraded to unused land, resulting in a declining trend of ecosystem services. The area of cropland and built-up land also increased, resulting in a low overall biodiversity and a continuous decline. To promote the sustainable development of the region, we should pay attention to the balance between economic development and ecological protection, scientifically plan the land use methods and identify ecological sources. When the InVEST model was used in the arid area of western China, it did not consider the water production caused by glacier snow melt. In the assessment of habitat quality, only the interaction and role of different land types were considered, and factors such as animal habitat were not considered. Future research could further optimize the model to make the simulation results more realistic by considering the glacier and snow melt.
The study found a strong correlation between the ecological footprint and socio-economic development, and the ecological footprint model can effectively measure the level of regional economic development [68,69,70]. Accordingly, the coupling coordination model further quantifies the interaction mechanism between socio-economic development and the ecological environment under land use change to investigate the effect of economic output on the natural–economic–social system from a macroscopic perspective. The results show significant spatial differences in the level of coupling coordination between the ecological footprint and ecosystem service functions in the Aksu region, and the spatial distribution of the coupling status is dominated by the spatial distribution of the ecosystem service functions, which is consistent with the results of a previous study [14]. The spatial distribution of the coupling coordination degree has evident clustering characteristics. Most high–high clustering areas were in the state of ecological deficit, and the trade-off between economic development and ecological protection should be given attention in the future.
The following suggestions are made for the fragile ecological environment in the arid region to promote the coordinated development of economic and ecological environments. (1) The area used for social and economic development must not exceed the boundaries of the ecological protection red line, and the number of permanent basic farmlands must be guaranteed. The fragile environmental regions could improve the coupling between the social economics and ecological environments through an adjustment of the industrial structure and improvement of the agricultural modernization level. (2) The Aksu region, which is an important energy industrial base in Xinjiang, China, needs to optimize the industrial energy structure, increase the level of clean energy utilization, fully utilize the advantages of light energy resources, and promote the diversification of the energy industry. (3) The ecological sources, especially for the Hotan, Tarim, and Aksu River Basins, reasonable planning of economic development, and ecological protection strategies according to the environmental conditions should be accurately identified by initiating biological or physical protection projects along the downstream of rivers and lake areas to protect water resources. (4) The irrigation area must be controlled, the water for the ecological environment must be increased, and water resource utilization planning must be enacted. The land use mode must be changed, soil restoration and conservation programs must be carried out, and the coordinated development of regional economic development and ecosystem services must be promoted.

5. Conclusions

The pursuit of economic development and ecological environmental protection is a contradiction that has resulted in a more complex interactive coupling relationship in the long run, and their coordinated development is essential. This work quantifies the spatial and temporal variations of the ecological footprint and ecosystem service functions in the Aksu region from 2005 to 2018 based on the data from a kilometer grid. Moreover, this work combines the coupling coordination model and spatial autocorrelation analysis to explore the coupling coordination level between the ecological footprint and water supply, soil conservation, and biodiversity maintenance functions, and their spatial clustering characteristics. The study results show that:
  • The per capita ecological footprint and biocapacity of the Aksu region increased from 2005 to 2018, and the per capita ecological footprint significantly grew higher than the per capita biocapacity, resulting in the gradual shift of the region from an ecological surplus to an ecological deficit. Meanwhile, the regional per capita GDP gradually increased, but the ecological footprint of CNY 10,000 GDP slowly decreased, indicating that the resource utilization efficiency of the Aksu region had improved.
  • The ecological footprint of the Aksu region is high in the northeast and low in the southwest, and the spatial heterogeneity is noticeable. Carbon (66.17%) and cropland (26.64%) are the main contributors to the regional ecological footprint. The biocapacity is dominated by cropland, built-up land, and forest land. The regional average ecological footprint from 2005 to 2018 increased from 28.82 ha to 117.46 ha per grid cell, and the biocapacity steadily changed, resulting in an increasing regional ecological deficit.
  • The ecosystem service functions in the Aksu region are high in the north and low in the south, with significant regional differences. The ecosystem services in Wushi County, Wensu County, Baicheng County, and the northern part of Kuqa City on the southern slope of the Tianshan Mountains are relatively higher compared with that in the Taklimakan Desert at the southern part of the study area. This function is mainly affected by rainfall, evapotranspiration, land use type, and vegetation coverage. The water supply and biodiversity maintenance functions showed a decreasing trend within the study period.
  • The coupling coordination degree of the ecological footprint and ecosystem service functions in the Aksu region is high in the north and low in the south, which is dominated by the spatial pattern of ecosystem services. The coupling relationship between the ecological footprint and habitat quality is the strongest, while that between the ecological footprint and water supply and soil conservation is weak. The coordination degree between the ecological footprint and water supply function increased within the study period; however, the coordination degree between the ecological footprint and soil conservation function and biodiversity conservation function decreased. In addition, the coupling coordination degree had evident spatial agglomeration characteristics.

Author Contributions

Conceptualization, methodology, software, and writing—review and editing, H.X.; methodology, supervision, writing—review and editing, and resources, J.Y.; data curation and software, G.X. and T.L. All authors have read and agreed to the published version of the manuscript.

Funding

This research was funded by The Master Plan of Major Projects for the Protection and Restoration of Important Ecosystems in Xinjiang (2021-2035) (NO.202005140014) and Thematic study on Ecological Restoration Planning of Territorial Spaces in the Autonomous Region (NO.202105140022).

Institutional Review Board Statement

Not applicable.

Informed Consent Statement

Not applicable.

Data Availability Statement

The biological resource and energy account data come from the Xinjiang Statistical Yearbook and the Aksu Regional Statistical Yearbook. The land use, DEM, and population density data come from the Resource and Environmental Science Data Center of the Chinese Academy of Sciences. The meteorological data come from the National Earth System Science Data Center. The soil data come from the World Soil Database. NDVI comes from the Geospatial Data Cloud.

Conflicts of Interest

The authors declare no conflict of interest.

References

  1. Rudolph, A.; Figge, L. Determinants of ecological footprints: What is the role of globalization? Ecol. Indic. 2017, 81, 348–361. [Google Scholar] [CrossRef]
  2. Jorgenson, A.K.; Clark, B. Are the Economy and the Environment Decoupling? A Comparative International Study, 1960–2005. Am. J. Sociol. 2012, 118, 1–44. [Google Scholar] [CrossRef]
  3. Qin, C.; Tang, Z.; Chen, J.; Chen, X. The Impact of Soil and Water Resource Conservation on Agricultural Production- an Analysis of the Agricultural Production Performance in Zhejiang, China. Agric. Water Manag. 2020, 240, 106268. [Google Scholar] [CrossRef]
  4. Mahmoud, S.H.; Gan, T.Y. Impact of anthropogenic climate change and human activities on environment and ecosystem services in arid regions. Sci. Total Environ. 2018, 633, 1329–1344. [Google Scholar] [CrossRef] [PubMed]
  5. Wang, K.; Deng, L.; Shangguan, Z.; Chen, Y.; Lin, X. Sustainability of eco-environment in semi-arid regions: Lessons from the Chinese Loess Plateau. Environ. Sci. Policy 2021, 125, 126–134. [Google Scholar] [CrossRef]
  6. Liu, J.; Tian, Y.; Huang, K.; Yi, T. Spatial-temporal differentiation of the coupling coordinated development of regional energy-economy-ecology system: A case study of the Yangtze River Economic Belt. Ecol. Indic. 2021, 124, 107394. [Google Scholar] [CrossRef]
  7. Fan, Y.; Fang, C.; Zhang, Q. Coupling coordinated development between social economy and ecological environment in Chinese provincial capital cities-assessment and policy implications. J. Clean. Prod. 2019, 229, 289–298. [Google Scholar] [CrossRef]
  8. Wackernagel, M.; McIntosh, J.; Rees, W.E.; Woollard, R. How Big is Our Ecological Footprint? A Handbook for Estimating a Community’s Appropriated Carrying Capacity; Discussion draft of the Task Force on Planning Healthy and Sustainable Communities; University of British Columbia: Vancouver, BC, Canada, 1993. [Google Scholar]
  9. Costanza, R. Ecological economics in 2049: Getting beyond the argument culture to the world we all want. Ecol. Econ. 2020, 168, 106484. [Google Scholar] [CrossRef]
  10. Mancini, M.; Galli, A.; Niccolucci, V.; Lin, D.; Hanscom, L.; Wackernagel, M.; Bastianoni, S.; Marchettini, N. Stocks and flows of natural capital: Implications for Ecological Footprint. Ecol. Indic. 2017, 77, 123–128. [Google Scholar] [CrossRef]
  11. Rees, W.E. Ecological footprints and appropriated carrying capacity: What urban economics leaves out. Environ. Urban 1992, 4, 121–130. [Google Scholar] [CrossRef]
  12. Wackernagel, M. Our Ecological Footprint: Reducing Human Impact on the Earth; New Society Publishers: Gabriola Island, BC, Canada, 1996. [Google Scholar]
  13. Silvio, F.; Barbara, P.; Angelo, M. Mapping National Environmental Sustainability Distribution by Ecological Footprint: The Case of Italy. Sustainability 2021, 13, 8671. [Google Scholar] [CrossRef]
  14. Gu, Y.; Ding, J.; Li, A. Spatio-temporal difference of coupling coordination degree of productive ecological carrying capacity and ecological function coupling in Baoding, Hebei province. Acta Ecol. Sinica 2020, 40, 7175–7186. [Google Scholar] [CrossRef]
  15. Korkut, P.; Veli, Y. Investigating the persistence of shocks on the ecological balance: Evidence from G10 and N11 countries. Sustain. Prod. Consum. 2021, 28, 624–636. [Google Scholar] [CrossRef]
  16. Galli, A.; Iha, K.; Pires, S.; Alves, A.; Zokai, G.; Lin, D.; Murthy, A.; Wackernagel, M. Assessing the Ecological Footprint and biocapacity of Portuguese cities: Critical results for environmental awareness and local management. Cities 2020, 96, 102442. [Google Scholar] [CrossRef]
  17. Neagu, O. Economic Complexity and Ecological Footprint: Evidence from the Most Complex Economies in the World. Sustainability 2020, 12, 9031. [Google Scholar] [CrossRef]
  18. Bherwani, H.; Nair, M.; Niwalkar, A.; Balachandran, D.; Kumar, R. Application of circular economy framework for reducing the impacts of climate change: A case study from India on the evaluation of carbon and materials footprint nexus. Energy Nexus 2022, 5, 100047. [Google Scholar] [CrossRef]
  19. Mo, L.; Chen, J.; Xie, Y. Ecological Approach for the Evaluation of Structure and Sustainability in the Tourism Industry. Sustainability 2021, 13, 13294. [Google Scholar] [CrossRef]
  20. Wang, H.; Huang, J.; Zhou, H.; Deng, C.; Fang, C. Analysis of sustainable utilization of water resources based on the improved water resources ecological footprint model: A case study of Hubei Province, China. J. Environ. Manag. 2020, 262, 110331. [Google Scholar] [CrossRef]
  21. Altiok, S.; Murthy, A.; Iha, K.; Galli, A. Reducing Mediterranean Seafood Footprints: The role of consumer attitudes. Ocean. Coast. Manag. 2021, 214, 105915. [Google Scholar] [CrossRef]
  22. Niccolucci, V.; Galli, A.; Reed, A.; Neri, E.; Wackernagel, M.; Bastianoni, S. Towards a 3D national ecological footprin tgeography. Ecol. Model. 2011, 222, 2939–2944. [Google Scholar] [CrossRef]
  23. Galli, A.; Wackernagel, M.; Iha, K.; Lazarus, E. Ecological Footprint: Implications for biodiversity. Biol. Conserv. 2014, 173, 121–132. [Google Scholar] [CrossRef]
  24. Collins, A.; Galli, A.; Hipwood, T.; Murthy, A. Living within a One Planet reality: The contribution of personal Footprint calculators. Environ. Res. Lett. 2020, 15, 025008. [Google Scholar] [CrossRef]
  25. Costanza, R.; De Groot, R.; Sutton, P.; Van der Ploeg, S.; Anderson, S.J.; Kubiszewski, I.; Farber, S.; Turner, R.K. Changes in the Global Value of Ecosystem Services. Glob. Environ. Change 2014, 26, 152–158. [Google Scholar] [CrossRef]
  26. Woldeyohannes, A.; Cotter, M.; Biru, W.; Kelbor, G. Assessing Changes in Ecosystem Service Values over 1985–2050 in Response to Land Use and Land Cover Dynamics in Abaya-Chamo Basin, Southern Ethiopia. Land 2020, 9, 37. [Google Scholar] [CrossRef] [Green Version]
  27. Huang, X.; Chen, Y.; Ma, J.; Hao, X. Research of the Sustainable Development of Tarim River Based on Ecosystem Service Function. Procedia Environ. Sci. 2011, 10, 239–246. [Google Scholar] [CrossRef] [Green Version]
  28. He, F.; Jin, J.; Zhang, H.; Yuan, L. The change of ecological service value and the promotion mode of ecological function in mountain development using InVEST model. Arab. J. Geosci. 2021, 14, 510. [Google Scholar] [CrossRef]
  29. Guerry, A.D.; Ruckelshaus, M.H.; Arkema, K.K.; Bernhardt, J.R.; Guannel, G.; Kim, C.K.; Marsik, M.; Day, A.; Tallis, H.; Spencer, J.; et al. Modeling Benefits from Nature: Using Ecosystem Services to Inform Coastal and Marine Spatial Planning. Int. J. Biodivers. Sci. Ecosyst. Serv. Manag. 2012, 8, 107–121. [Google Scholar] [CrossRef] [Green Version]
  30. Brown, G.; Brabyn, L. The extrapolation of social landscape values to a national level in New Zealand using landscape character classification. Appl. Geogr. 2012, 35, 84–94. [Google Scholar] [CrossRef]
  31. Arunyawat, S.; Shrestha, R. Assessing Land Use Change and Its Impact on Ecosystem Services in Northern Thailand. Sustainability 2016, 8, 768. [Google Scholar] [CrossRef] [Green Version]
  32. Gashawa, T.; Bantider, A.; Zeleke, G.; Alamirew, T.; Jemberu, W.; Worqlul, A.; Dile, Y.; Bewket, W.; Meshesha, D.; Adem, A.; et al. Evaluating InVEST model for estimating soil loss and sediment export in data scarce regions of the Abbay (Upper Blue Nile) Basin: Implications for land managers. Environ. Chall. 2021, 5, 100381. [Google Scholar] [CrossRef]
  33. Leh, M.; Matlock, M.; Cummings, E.; Nalley, L. Quantifying and mapping multiple ecosystem services change in West Africa. Agric. Ecosyst. Environ. 2013, 165, 6–18. [Google Scholar] [CrossRef]
  34. Daneshi, A.; Brouwer, R.; Najafinejad, A.; Panahi, M.; Zarandian, A.; Maghsood, F.F. Modelling the impacts of climate and land use change on water security in a semi-arid forested watershed using InVEST. J. Hydrol. 2021, 593, 125621. [Google Scholar] [CrossRef]
  35. Zhang, F.; Li, X.; Feng, Q.; Wang, H.; Wei, Y.; Bai, H. Spatial and Temporal Variation of Water Conservation in the Upper Reaches of Heihe River Basin Based on InVEST Model. J. Desert Res. 2018, 38, 1321–1329. [Google Scholar] [CrossRef]
  36. He, C.; Zhang, D.; Huang, Q.; Zhao, Y. Assessing the potential impacts of urban expansion on regional carbon storage by linking the LUSD-urban and InVEST models. Environ. Model. Softw. 2016, 75, 44–58. [Google Scholar] [CrossRef]
  37. Liang, Y.; Liu, L.; Huang, J. Integrating the SD-CLUE-S and InVEST models into assessment of oasis carbon storage in northwestern China. PLoS ONE 2017, 12, e0172494. [Google Scholar] [CrossRef]
  38. Wang, B.; Zhao, J.; Hu, X. Spatial pattern analysis of ecosystem services based on InVEST in Heihe River Basin. Chin. J. Ecol. 2016, 35, 2783–2792. [Google Scholar] [CrossRef]
  39. Ding, C.; Zhang, H.; Li, X.; Li, W.; Gao, Y. Quantitative assessment of water conservation function of the natural spruce forest in the central Tianshan Mountains: A case study of the Urumqi River Basin. Acta Ecol. Sin. 2017, 37, 3733–3743. [Google Scholar] [CrossRef] [Green Version]
  40. Li, P.; Zhang, R.; Wei, H.; Xu, L. Assessment of physical quantity and value of natural capital in China since the 21st century based on a modified ecological footprint model. Sci. Total Environ. 2021, 806, 150676. [Google Scholar] [CrossRef]
  41. Mancini, M.; Galli, A.; Coscieme, L.; Niccolucci, V.; Lin, D.; Pulselli, F.; Bastianoni, S.; Marchettini, N. Exploring ecosystem services assessment through Ecological Footprint accounting. Ecosyst. Serv. 2018, 30, 228–235. [Google Scholar] [CrossRef]
  42. Ariken, M.; Zhang, F.; Chan, N.; Kung, H.-T. Coupling coordination analysis and spatio-temporal heterogeneity between urbanization and eco-environment along the silk road economic belt in China. Ecol. Indic. 2021, 121, 107014. [Google Scholar] [CrossRef]
  43. Fu, J.; Zhang, Q.; Wang, P.; Zhang, L.; Tian, Y.; Li, X. Spatio-Temporal Changes in Ecosystem Service Value and Its Coordinated Development with Economy: A Case Study in Hainan Province, China. Remote Sens. 2022, 14, 970. [Google Scholar] [CrossRef]
  44. National Science and Technology Infrastructure Platform Construction—National Earth System Science Data Center. Available online: http://www.geodata.cn (accessed on 20 February 2022).
  45. Global Footprint Network. National Footprint and Biocapacity Accounts. Available online: https://www.footprintnetwork.org/resources/data/ (accessed on 1 August 2020).
  46. Liu, T.; Wang, H.-Z.; Wang, H.-Z.; Xu, H. The spatiotemporal evolution of ecological security in China based on the ecological footprint model with localization of parameters. Ecol. Indic. 2021, 126, 107636. [Google Scholar] [CrossRef]
  47. Lin, C.; Li, X.; Yang, N.; Li, E.; Du, P. A Study on Spatial Pattern of Ecological Footprint for Urban Agglomeration Combinedwith Remote Sensing Products: A Case Study of Urban Agglomeration in the Yangtze River Delta. Geogr. Geo-Inf. Sci. 2018, 34, 20–25+130. [Google Scholar] [CrossRef]
  48. Guo, J.; Ren, J.; Huang, X.; He, G.; Shi, Y.; Zhou, H. The Dynamic Evolution of the Ecological Footprint and Ecological Capacity of Qinghai Province. Sustainability 2020, 12, 3065. [Google Scholar] [CrossRef] [Green Version]
  49. Li, P.; Xu, L.; Zhang, J.; Jin, M.; Zhang, R. Spatio-temporal changes of three-dimensional ecological footprint in inland river basins in Arid Region: A case study of the Manas River Basin. Acta Ecol. Sin. 2020, 40, 6776–6787. [Google Scholar] [CrossRef]
  50. Xu, C.; Cao, Y.; Xu, Z.; Yang, J.; Zeng, Z. A Study on Identification Methods of Ecological Source Area in Aksu Area, Xinjiang Uygur Autonomous Region. Bull. Soil Water Conserv. 2021, 41, 174–181+188. [Google Scholar] [CrossRef]
  51. Aneseyee, A.; Elias, E.; Soromessa, T.; Feyisa, G. Land use/land cover change effect on soil erosion and sediment delivery in the Winike watershed, Omo Gibe Basin, Ethiopia. Sci. Total Environ. 2020, 728, 138776. [Google Scholar] [CrossRef]
  52. Cai, C.; Ding, S.; Shi, Z.; Huang, L.; Zhang, G. Study of Applying USLE and Geographical Information System IDRISI to Predict Soil Erosion in Small Watershed. J. Soil Water Conserv. 2000, 14, 19–24. [Google Scholar] [CrossRef]
  53. Hack, J.; Molewijk, D.; Beißler, M.R. A Conceptual Approach to Modeling the Geospatial Impact of Typical Urban Threats on the Habitat Quality of River Corridors. Remote Sens. 2020, 12, 1345. [Google Scholar] [CrossRef] [Green Version]
  54. Deng, M.; Chen, J.; Tao, F.; Zhu, J.; Wang, M. On the Coupling and Coordination Development between Environment and Economy: A Case Study in the Yangtze River Delta of China. Int. J. Environ. Res. Public Health 2022, 19, 586. [Google Scholar] [CrossRef]
  55. Tobler, W. A Computer Movie Simulating Urban Growth in the Detroit Region. Econ. Geogr. 1970, 46, 234–240. [Google Scholar] [CrossRef]
  56. Ji, J.; Tang, Z.; Zhang, W.; Liu, W.; Jin, B.; Xi, X.; Wang, F.; Zhang, R.; Guo, B.; Xu, Z.; et al. Spatiotemporal and Multiscale Analysis of the Coupling Coordination Degree between Economic Development Equality and Eco-Environmental Quality in China from 2001 to 2020. Remote Sens. 2022, 14, 737. [Google Scholar] [CrossRef]
  57. Wiedmann, T.; Lenzen, M. On the conversion between local and global hectares in Ecological Footprint analysis. Ecol. Econ. 2007, 60, 673–677. [Google Scholar] [CrossRef]
  58. Kitzes, J.; Galli, A.; Bagliani, M.; Barrett, J.; Dige, G.; Ede, S.; Erb, K.; Giljum, S.; Haberl, H.; Hails, C.; et al. A research agenda for improving national Ecological Footprint accounts. Ecol. Econ. 2009, 68, 1991–2007. [Google Scholar] [CrossRef]
  59. Liu, Y.; Zhu, Z.; Jia, G. Study on Carrying Capacity of Arid Zone in Central Ningxia Based on the Sub-National Hectare Ecological Footprint. Res. Soil Water Conserv. 2017, 24, 357–362. [Google Scholar] [CrossRef]
  60. Wang, L.; Zhou, Y.; Chen, J. Ecological Capacity and Ecological Security of Aksu Prefecture. Environ. Prot. Xinjiang 2017, 39, 45–50. [Google Scholar] [CrossRef]
  61. Jin, M.; Xu, L.; Li, P. Spatial and temporal evolution of natural capital utilization in the three-dimensionalecological footprint under the regional economic differentiation in north and south Xinjiang. Acta Ecol. Sin. 2020, 40, 4327–4339. [Google Scholar] [CrossRef]
  62. Zang, J.; Zhang, T.; Chen, L.; Li, L.; Liu, W.; Yuan, L.; Zhang, Y.; Liu, R.; Wang, Z.; Yu, Z.; et al. Optimization of Modelling Population Density Estimation Based on Impervious Surfaces. Land 2021, 10, 791. [Google Scholar] [CrossRef]
  63. Yang, Y.; Fan, M. Analysis of spatial and temporal differences and equity of ecological footprints of provinces along the Silk Road Economic Belt in China. Acta Ecol. Sin. 2019, 39, 5040–5050. [Google Scholar] [CrossRef]
  64. Liu, M.; Li, W. Calculation of Equivalence Factor Used in Ecological Footprint for China and Its Provinces Based on Net Primary Production. J. Ecol. Rural. Environ. 2010, 26, 401–406. [Google Scholar] [CrossRef]
  65. Liu, M.; Li, W.; Xie, G. Estimation of China ecological footprint production coefficient based on net primary productivity. Chin. J. Ecol. 2010, 29, 592–597. [Google Scholar] [CrossRef]
  66. Sun, Q.; Xu, C.; Ren, Z.; Chu, Z. Spatiotemporal Variation in Water Yield and Their Underlying Mechanisms in Tarim River Basin. J. Irrig. Drain. 2021, 40, 114–122. [Google Scholar] [CrossRef]
  67. Guo, L.; Yin, X.; Gou, Z.; Gao, J. Evaluation on water yield and analysis of its variation characteristics of Arku River Basin based on In VEST model. J. Shihezi Univ. 2020, 38, 216–224. [Google Scholar] [CrossRef]
  68. Siche, R.; Pereira, L.; Agostinho, F.; Ortega, E. Convergence of ecological footprint and emergy analysis as a sustainability indicator of countries: Peru as case study. Commun. Nonlinear Sci. Numer. Simul. 2010, 15, 3182–3192. [Google Scholar] [CrossRef]
  69. Ozturk, I.; Al-Mulali, U.; Saboori, B. Investigating the environmental Kuznets curve hypothesis: The role of tourism and ecological footprint. Environ. Sci. Pollut. Res. Int. 2016, 23, 1916–1928. [Google Scholar] [CrossRef]
  70. Deng, C.; Liu, Z.; Li, R.; Li, K. Sustainability Evaluation Based on a Three-Dimensional Ecological Footprint Model: A Case Study in Hunan, China. Sustainability 2018, 10, 4498. [Google Scholar] [CrossRef] [Green Version]
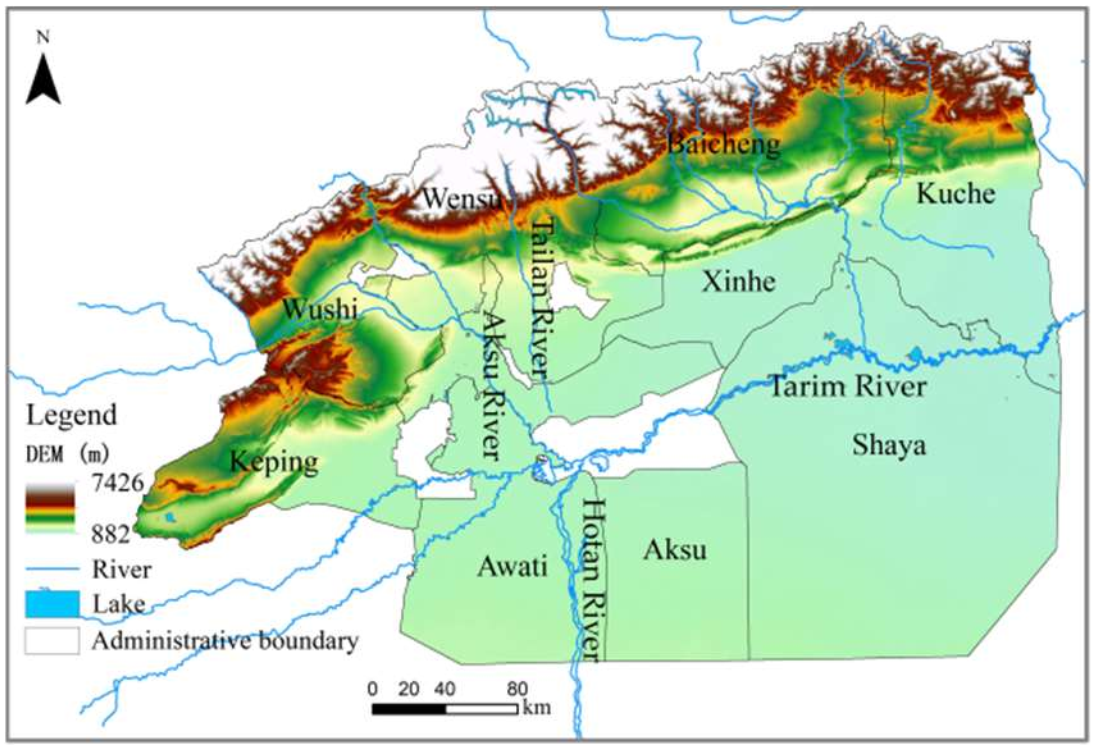
Figure 1. Overview of the study area (excluding the Corps).
Sustainability 14 03483 g001
Figure 2. Per capita ecological footprint, per capita biocapacity, and ecological footprint of CNY 10,000 of GDP in the Aksu region from 2005 to 2018.
Sustainability 14 03483 g002
Figure 3. Ecological footprint and ecological deficit in the Aksu region from 2005 to 2018. (a) ecological footprint; (b) ecological deficit.
Sustainability 14 03483 g003
Figure 4. Ecosystem service functions in the Aksu region from 2005 to 2018. (a) water supply function; (b) soil conservation function; (c) habitat quality function.
Sustainability 14 03483 g004
Figure 5. Coupling coordination degree of the ecological footprint and ecosystem service functions in the Aksu region from 2005 to 2018. (a) ecological footprint and water supply of D; (b) ecological footprint and soil conservation of D; (c) ecological footprint and habitat quality of D.
Sustainability 14 03483 g005
Figure 6. Change ratio of the coupling coordination degree between the ecological footprint and ecosystem services in the Aksu region from 2005 to 2018.
Sustainability 14 03483 g006
Figure 7. LISA cluster map of the coupling coordination degree between the ecological footprint and ecosystem service functions. (a) ecological footprint and water supply LISA. (b) ecological footprint and soil conservation LISA. (c) ecological footprint and habitat quality LISA.
Sustainability 14 03483 g007
Table 1. Ecological footprint accounts and model parameters of the Aksu region.
AccountLand TypeSubaccountEquilibrium FactorsYield Factors
Biological resources accountCroplandLand of providing agricultural products (food crops, economic crops, and fruit melons) and some livestock products (pork, poultry meat, and eggs) for the region.3.830.96
Forest landLand of providing forest products (apples, pears, grapes, apricots, peaches, dates, walnuts, etc.) for the region.1.161.14
Grazing landLand of providing most of the livestock products (beef, lamb, milk, etc.) for the region.0.061.89
Fishing groundWaters of providing aquatic products (fish, shrimp, crab, shellfish, etc.) for the region.0.031.49
Energy accountBuilt-up landLand of providing urban and rural housing, transportation, water conservancy, communications, and other infrastructures for the region.3.830.96
Carbon-uptake landLand of absorbing carbon dioxide from the combustion of fossil fuels (raw coal, coke, natural gas, crude oil, gasoline, diesel, etc.) for the region.1.080.00
Table 2. Moran’s I index of the coupling coordination degree between the ecological footprint and ecosystem service functions in the Aksu region from 2015 to 2018.
Coupling Coordination Degree20052010
Moran’s IZpMoran’s IZp
Ecological footprint and water supply function0.889358.43<0.0010.904380.20<0.001
Ecological footprint and soil conservation function0.802509.73<0.0010.801544.51<0.001
Ecological footprint and habitat quality0.518148.05<0.0010.707308.41<0.001
Coupling Coordination Degree20152018
Moran’s IZpMoran’s IZp
Ecological footprint and water supply function0.905410.46<0.0010.779309.42<0.001
Ecological footprint and soil conservation function0.817550.85<0.0010.770525.77<0.001
Ecological footprint and habitat quality0.717338.20<0.0010.539235.29<0.001
Table 3. Comparison of the equilibrium and yield factors in the ecological footprint at different scales.
Land Use TypeEquilibrium FactorsYield Factors
Local ParametersProvincial Parameters [63]National Parameters [64]Local ParametersProvincial ParametersNational Parameters [65]
Cropland3.832.252.520.960.741.32
Forest land1.162.361.281.140.972.55
Grazing land0.060.420.431.890.541.93
Fishing ground0.030.330.351.490.541.00
Built-up land3.832.252.520.960.741.32
Carbon-uptake land1.082.361.28
Publisher’s Note: MDPI stays neutral with regard to jurisdictional claims in published maps and institutional affiliations.